
Influences of Green Eating Behaviors Underlying the Extended Theory of Planned Behavior: A Study of Market Segmentation and Purchase Intention

 ,
, 
Abstract
:1. Introduction
2. Literature Review
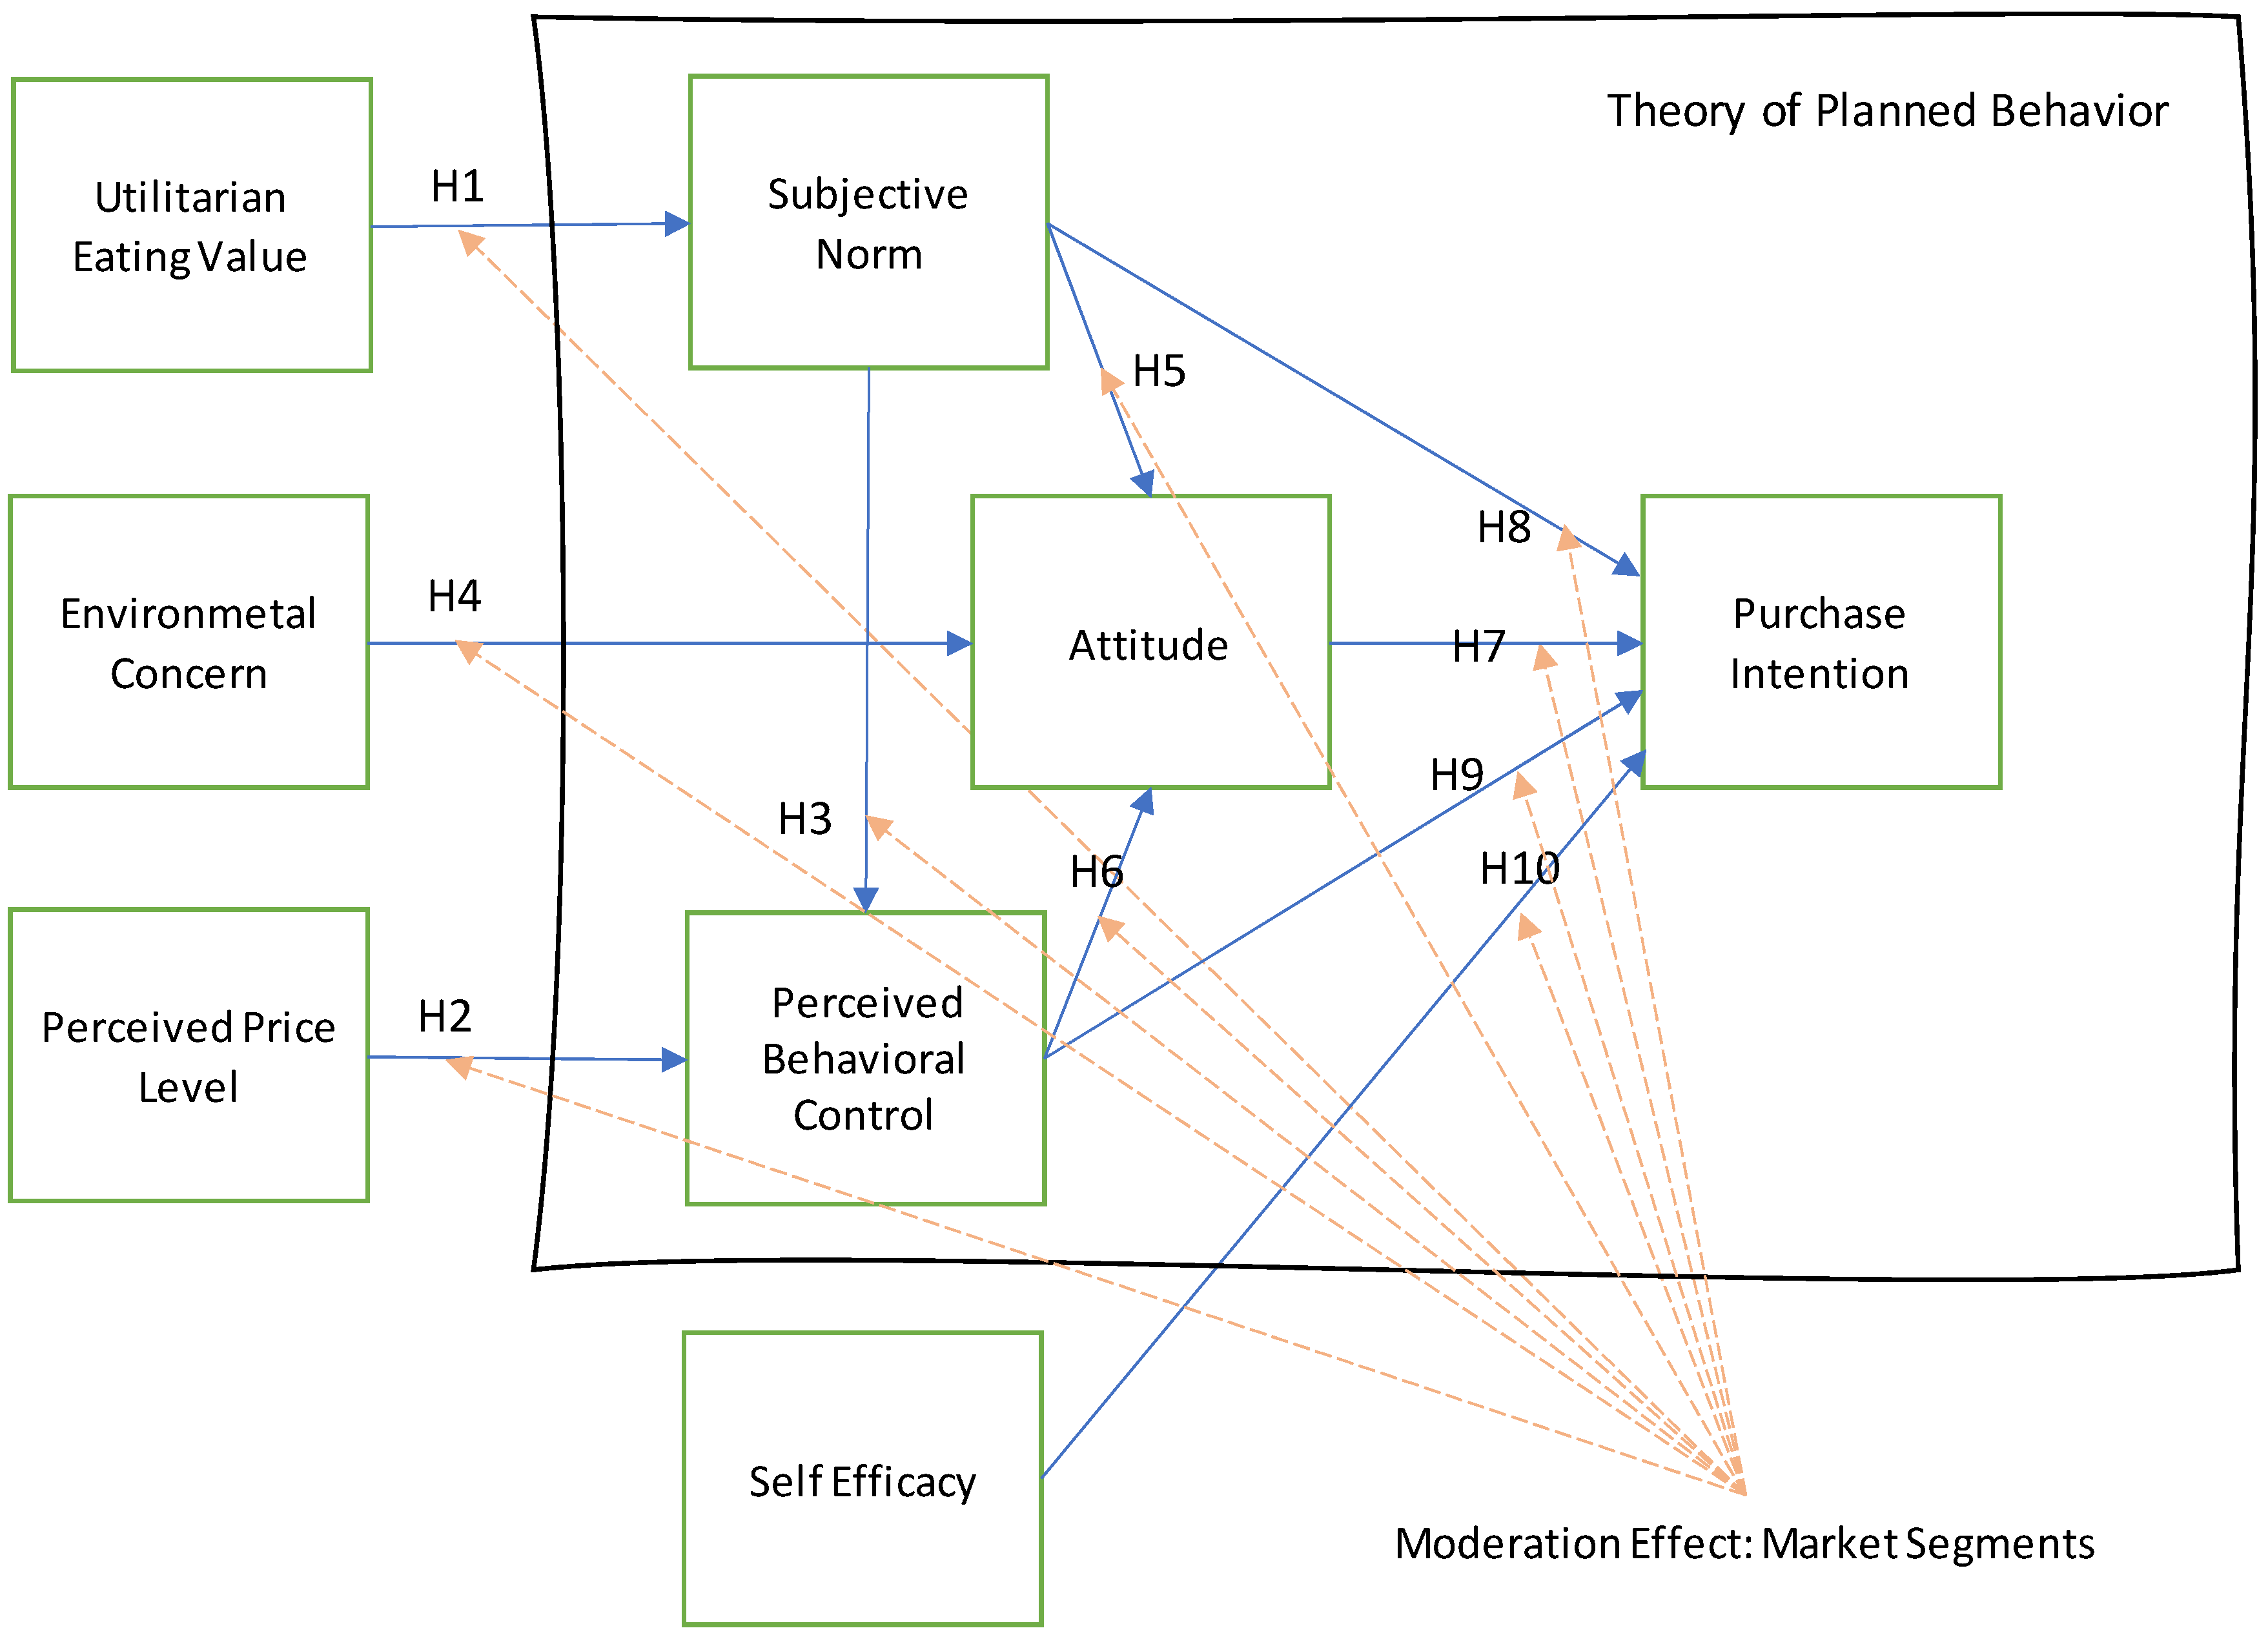
2.1. Theory of Planned Behavior
2.1.1. Subjective Norm
2.1.2. Attitude
2.1.3. Perceived Behavioral Control
2.1.4. Purchase Intention
2.2. Utilitarian Eating Value
2.3. Perceived Price
2.4. Environmental Concerns
2.5. Self-Efficacy
3. Research Methodology
3.1. Pilot Test and Cluster Analysis
3.2. Sampling, Data Collection, and Development of Measures
3.3. Data Analysis and Statistical Measures
4. Result of the Study
4.1. Pilot Study and Market Segmentation
4.2. Measurement Model
4.2.1. The Goodness of Fit (GOF)
4.2.2. Convergent Validity
4.2.3. Discriminant Validity
4.3. Primary Structural Model
4.4. Multigroup Moderation Analysis (MGA)
4.4.1. Measurement Invariance
4.4.2. Z-Test for Loading Differences
5. Discussion
6. Research Implications
7. Limitations of the Study
8. Conclusions
Author Contributions
Funding
Institutional Review Board Statement
Informed Consent Statement
Data Availability Statement
Acknowledgments
Conflicts of Interest
Appendix A. Questionnaire
Appendix A.1. Introductory Questions
- (a)
- Are you a regular buyer of green food?
- (b)
- Are you a potential buyer of green food?
Appendix A.2. Demographic Data of Respondents
- GenderMale, Female
- Age (years)<21, 22–38, 39–53, >54
- Income (Thai Baht)<15,000, 15,001–20,000, 20,001–25,000, 25,001–30,000, >30,000
- Family size1, 2, 3, 4
- Tasted experienceEver, Never
- Consume in the futureWill, Will not
Appendix A.3. Customer Attitudes
- 7.
- Customer Attitudes towards Green Eating Behavior
- 7.1.
- Do you trust farmers to grow a green plant for green food?Do you trust the procession of a producer to produce green food?Do you trust the government to manage green food policies?Do you trust the green food certificate from the certificate authority?Do you strongly trust green food?
- 7.2.
- Environmental concern [28]Do environmental issues impact your purchasing decision on green food?Does your knowledge of environmental issues impact your purchasing decision on green food?Does your realization of environmental issues impact your purchasing decision on green food?Does the threat of environmental issues impact your purchasing decision on green food?Do the government policies about environmental issues affect your responsibility to the environment?
- 7.3.
- Is the price of green food reasonable?Do you rather consume only food that you had before and you know it is tasty?Does the food portion of green food can supply your hunger (per meal)?Do you like a variety of food recipes?Do you like a variety of green food recipes?
- 7.4.
- Is the price of green food expensive?Is the price of green food reasonable?Is green food more expensive than normal food?Is the price of green food higher than you expected?
- 7.5.
- Does buying green food benefit your purchasing decision?Do you buy green food for your safeness?Do you demand to buy green food?Do you buy green food for a better quality of life?Are you interested to buy green food?
- 7.6.
- Does it depend on your decision whether you buy green food or not?Do you believe that you could buy green food whenever you want?Do you have enough money, time, and a chance to buy green food?
- 7.7.
- Do people around you support you to consume green food?Do people around you expect you to consume green food when you are at home?Do environmental groups influence your consuming decision about green food?
- 7.8.
- Will you buy green food if it is available in the shop?Do you intend to buy green food?Do you want to buy green food?How possible is it that you will buy green food?
References
- Martínez García de Leaniz, P.; Herrero Crespo, Á.; Gómez López, R. Customer Responses to Environmentally Certified Hotels: The Moderating Effect of Environmental Consciousness on the Formation of Behavioral Intentions. J. Sustain. Tour. 2018, 26, 1160–1177. [Google Scholar] [CrossRef] [Green Version]
- Chauhan, A.; Saini, R.P. A Review on Integrated Renewable Energy System Based Power Generation for Stand-Alone Applications: Configurations, Storage Options, Sizing Methodologies and Control. Renew. Sustain. Energy Rev. 2014, 38, 99–120. [Google Scholar] [CrossRef]
- Bratt, C.; Hallstedt, S.; Robèrt, K.-H.; Broman, G.; Oldmark, J. Assessment of Eco-Labelling Criteria Development from a Strategic Sustainability Perspective. J. Clean. Prod. 2011, 19, 1631–1638. [Google Scholar] [CrossRef] [Green Version]
- United Nations Environment Programme. Sustainable Food Systems. Available online: https://www.unjobnet.org/jobs/detail/42088627 (accessed on 7 June 2022).
- Dorce, L.C.; da Silva, M.C.; Mauad, J.R.C.; de Faria Domingues, C.H.; Borges, J.A.R. Extending the Theory of Planned Behavior to Understand Consumer Purchase Behavior for Organic Vegetables in Brazil: The Role of Perceived Health Benefits, Perceived Sustainability Benefits and Perceived Price. Food Qual. Prefer. 2021, 91, 104191. [Google Scholar] [CrossRef]
- Rahman, I.; Reynolds, D. Predicting Green Hotel Behavioral Intentions Using a Theory of Environmental Commitment and Sacrifice for the Environment. Int. J. Hosp. Manag. 2016, 52, 107–116. [Google Scholar] [CrossRef]
- Ricci, E.C.; Banterle, A.; Stranieri, S. Trust to Go Green: An Exploration of Consumer Intentions for Eco-Friendly Convenience Food. Ecol. Econ. 2018, 148, 54–65. [Google Scholar] [CrossRef] [Green Version]
- Pedersen, E.R.; Neergaard, P. Caveat Emptor—Let the Buyer Beware! Environmental Labelling and the Limitations of ‘Green’ Consumerism. Bus. Strategy Environ. 2006, 15, 15–29. [Google Scholar] [CrossRef]
- Jafarzadeh, S.; Jafari, S.M.; Salehabadi, A.; Nafchi, A.M.; Uthaya Kumar, U.S.; Khalil, H.P.S.A. Biodegradable Green Packaging with Antimicrobial Functions Based on the Bioactive Compounds from Tropical Plants and Their By-Products. Trends Food Sci. Technol. 2020, 100, 262–277. [Google Scholar] [CrossRef]
- Yanakittkul, P.; Aungvaravong, C. A Model of Farmers Intentions towards Organic Farming: A Case Study on Rice Farming in Thailand. Heliyon 2020, 6, e03039. [Google Scholar] [CrossRef] [Green Version]
- Pollution Control Department. Thailand State of Pollution. Available online: https://www.pcd.go.th/pcd_news/12628/ (accessed on 7 June 2022).
- Tangwanichagapong, S.; Logan, M.; Visvanathan, C. Circular Economy for Sustainable Resource Management: The Case of Packaging Waste Sector in Thailand. In Circular Economy: Global Perspective; Springer: Singapore, 2020; pp. 353–387. [Google Scholar]
- Sawasdee, A.; Rodboonsong, S.; Joemsittiprasert, W. Reducing Food Waste Generation in Thailand through Environmental Consciousness, Green Marketing, and Purchasing Discipline: Mediating Role of Recycling Behavior. World Food Policy 2020, 6, 60–77. [Google Scholar] [CrossRef]
- Yashasvini, M.; Sundar, D. Eco-Friendly Packaging in Food Processing Industries. Int. J. Manag. Soc. Sci. 2019, 8, 47–51. Available online: https://pdfs.semanticscholar.org/64ed/ecccebf09fb94a849328713b463aefa0b14d.pdf (accessed on 7 June 2022).
- Aleenajitpong, N. Attitude Towards Green Packaging and Its Impact on Purchase Intention of Green Packaged Consumer Products among Undergraduates in Bangkok Metropolitan, Thailand. SSRN Electron. J. 2013. [Google Scholar] [CrossRef]
- Fangmongkol, K.; Gheewala, S.H. Life Cycle Assessment of Biodegradable Food Container from Bagasse in Thailand. J. Sustain. Energy Environ. 2020, 11, 61–69. [Google Scholar]
- Ajzen, I. The Theory of Planned Behavior. Organ. Behav. Hum. Decis. Processes 1991, 50, 179–211. [Google Scholar] [CrossRef]
- Hair, J.F. Multivariate Data Analysis; Pearson: Hoboken, NJ, USA, 1998. [Google Scholar]
- Byrne, B.M. Structural Equation Modeling with AMOS: Basic Concepts, Applications, and Programming; Taylor & Francis Group: New York, NY, USA, 2016. [Google Scholar]
- Ketkaew, C.; Wongthahan, P.; Sae-Eaw, A. How Sauce Color Affects Consumer Emotional Response and Purchase Intention: A Structural Equation Modeling Approach for Sensory Analysis. Br. Food J. 2021, 123, 2152–2169. [Google Scholar] [CrossRef]
- Santos, P.M.; Cirillo, M.Â.; Guimarães, E.R. Specialty Coffee in Brazil: Transition among Consumers’ Constructs Using Structural Equation Modeling. Br. Food J. 2021, 123, 1913–1930. [Google Scholar] [CrossRef]
- Nosi, C.; Zollo, L.; Rialti, R.; Ciappei, C. Sustainable Consumption in Organic Food Buying Behavior: The Case of Quinoa. Br. Food J. 2020, 122, 976–994. [Google Scholar] [CrossRef]
- Watanabe, E.A.; Alfinito, S.; Curvelo, I.C.G.; Hamza, K.M. Perceived Value, Trust and Purchase Intention of Organic Food: A Study with Brazilian Consumers. Br. Food J. 2020, 122, 1070–1184. [Google Scholar] [CrossRef]
- Yadav, R.; Pathak, G.S. Young Consumers’ Intention towards Buying Green Products in a Developing Nation: Extending the Theory of Planned Behavior. J. Clean. Prod. 2016, 135, 732–739. [Google Scholar] [CrossRef]
- Dowd, K.; Burke, K.J. The Influence of Ethical Values and Food Choice Motivations on Intentions to Purchase Sustainably Sourced Foods. Appetite 2013, 69, 137–144. [Google Scholar] [CrossRef]
- Stranieri, S.; Ricci, E.C.; Banterle, A. Convenience Food with Environmentally-Sustainable Attributes: A Consumer Perspective. Appetite 2017, 116, 11–20. [Google Scholar] [CrossRef] [PubMed]
- Qi, X.; Ploeger, A. Explaining Chinese Consumers’ Green Food Purchase Intentions during the COVID-19 Pandemic: An Extended Theory of Planned Behaviour. Foods 2021, 10, 1200. [Google Scholar] [CrossRef] [PubMed]
- Qi, X.; Ploeger, A. Explaining Consumers’ Intentions towards Purchasing Green Food in Qingdao, China: The Amendment and Extension of the Theory of Planned Behavior. Appetite 2019, 133, 414–422. [Google Scholar] [CrossRef] [PubMed]
- Wang, Y.-F.; Wang, C.-J. Do Psychological Factors Affect Green Food and Beverage Behaviour? An Application of the Theory of Planned Behaviour. Br. Food J. 2016, 118, 2171–2199. [Google Scholar] [CrossRef]
- Ajzen, I. Residual Effects of Past on Later Behavior: Habituation and Reasoned Action Perspectives. Personal. Soc. Psychol. Rev. 2002, 6, 107–122. [Google Scholar] [CrossRef]
- Santos, S.C.; Liguori, E.W. Entrepreneurial Self-Efficacy and Intentions. Int. J. Entrep. Behav. Res. 2019, 26, 400–415. [Google Scholar] [CrossRef]
- Paul, J.; Modi, A.; Patel, J. Predicting Green Product Consumption Using Theory of Planned Behavior and Reasoned Action. J. Retail. Consum. Serv. 2016, 29, 123–134. [Google Scholar] [CrossRef]
- White Baker, E.; Al-Gahtani, S.S.; Hubona, G.S. The Effects of Gender and Age on New Technology Implementation in a Developing Country. Inf. Technol. People 2007, 20, 352–375. [Google Scholar] [CrossRef]
- Chou, C.-J.; Chen, K.-S.; Wang, Y.-Y. Green Practices in the Restaurant Industry from an Innovation Adoption Perspective: Evidence from Taiwan. Int. J. Hosp. Manag. 2012, 31, 703–711. [Google Scholar] [CrossRef]
- Michaelidou, N.; Hassan, L.M. Modeling the Factors Affecting Rural Consumers’ Purchase of Organic and Free-Range Produce: A Case Study of Consumers’ from the Island of Arran in Scotland, UK. Food Policy 2010, 35, 130–139. [Google Scholar] [CrossRef]
- Tang, Y.; Medhekar, M. Australian and New Zealand Marketing Academy Conference. In Proceedings of the Drivers of Green Power Electricity Purchase, ANZMAC, Sydney, Australia, 1–3 December 2008; pp. 1–8. [Google Scholar]
- Amoako, G.K.; Dzogbenuku, R.K.; Abubakari, A. Do Green Knowledge and Attitude Influence the Youth’s Green Purchasing? Theory of Planned Behavior. Int. J. Product. Perform. Manag. 2020, 69, 1609–1626. [Google Scholar] [CrossRef]
- de Leeuw, A.; Valois, P.; Ajzen, I.; Schmidt, P. Using the Theory of Planned Behavior to Identify Key Beliefs Underlying Pro-Environmental Behavior in High-School Students: Implications for Educational Interventions. J. Environ. Psychol. 2015, 42, 128–138. [Google Scholar] [CrossRef]
- Lizin, S.; van Dael, M.; van Passel, S. Battery Pack Recycling: Behaviour Change Interventions Derived from an Integrative Theory of Planned Behaviour Study. Resour. Conserv. Recycl. 2017, 122, 66–82. [Google Scholar] [CrossRef]
- Cristea, M.; Gheorghiu, A. Attitude, Perceived Behavioral Control, and Intention to Adopt Risky Behaviors. Transp. Res. Part FTraffic Psychol. Behav. 2016, 43, 157–165. [Google Scholar] [CrossRef]
- Son, J.; Jin, B.; George, B. Consumers’ Purchase Intention toward Foreign Brand Goods. Manag. Decis. 2013, 51, 434–450. [Google Scholar] [CrossRef]
- Ru, X.; Wang, S.; Yan, S. Exploring the Effects of Normative Factors and Perceived Behavioral Control on Individual’s Energy-Saving Intention: An Empirical Study in Eastern China. Resour. Conserv. Recycl. 2018, 134, 91–99. [Google Scholar] [CrossRef]
- Prakash, G.; Pathak, P. Intention to Buy Eco-Friendly Packaged Products among Young Consumers of India: A Study on Developing Nation. J. Clean. Prod. 2017, 141, 385–393. [Google Scholar] [CrossRef]
- Vazifehdoust, H.; Taleghani, M.; Esmaeilpour, F.; Nazari, K.; Khadang, M. Purchasing Green to Become Greener: Factors Influence Consumers’ Green Purchasing Behavior. Manag. Sci. Lett. 2013, 2489–2500. [Google Scholar] [CrossRef]
- Ahmed, N.; Li, C.; Khan, A.; Qalati, S.A.; Naz, S.; Rana, F. Purchase Intention toward Organic Food among Young Consumers Using Theory of Planned Behavior: Role of Environmental Concerns and Environmental Awareness. J. Environ. Plan. Manag. 2021, 64, 796–822. [Google Scholar] [CrossRef]
- Liu, M.T.; Liu, Y.; Mo, Z. Moral Norm Is the Key. Asia Pac. J. Mark. Logist. 2020, 32, 1823–1841. [Google Scholar] [CrossRef]
- Hoffman, D.L.; Novak, T.P. Marketing in Hypermedia Computer-Mediated Environments: Conceptual Foundations. J. Mark. 1996, 60, 50–68. [Google Scholar] [CrossRef]
- Filieri, R.; Lin, Z. The Role of Aesthetic, Cultural, Utilitarian and Branding Factors in Young Chinese Consumers’ Repurchase Intention of Smartphone Brands. Comput. Hum. Behav. 2017, 67, 139–150. [Google Scholar] [CrossRef] [Green Version]
- Ajzen, I. Attitudes, Personality and Behavior; McGraw-Hill Education: New York, NY, USA, 2005. [Google Scholar]
- Babin, B.J.; Darden, W.R.; Griffin, M. Work and/or Fun: Measuring Hedonic and Utilitarian Shopping Value. J. Consum. Res. 1994, 20, 644. [Google Scholar] [CrossRef]
- Maehle, N.; Iversen, N.; Hem, L.; Otnes, C. Exploring Consumer Preferences for Hedonic and Utilitarian Food Attributes. Br. Food J. 2015, 117, 3039–3063. [Google Scholar] [CrossRef]
- Zagata, L. Consumers’ Beliefs and Behavioural Intentions towards Organic Food. Evidence from the Czech Republic. Appetite 2012, 59, 81–89. [Google Scholar] [CrossRef]
- Al-Swidi, A.; Mohammed Rafiul Huque, S.; Haroon Hafeez, M.; Noor Mohd Shariff, M. The Role of Subjective Norms in Theory of Planned Behavior in the Context of Organic Food Consumption. Br. Food J. 2014, 116, 1561–1580. [Google Scholar] [CrossRef]
- Massey, M.; O’Cass, A.; Otahal, P. A Meta-Analytic Study of the Factors Driving the Purchase of Organic Food. Appetite 2018, 125, 418–427. [Google Scholar] [CrossRef]
- Campbell, J.; DiPietro, R.B.; Remar, D. Local Foods in a University Setting: Price Consciousness, Product Involvement, Price/Quality Inference and Consumer’s Willingness-to-Pay. Int. J. Hosp. Manag. 2014, 42, 39–49. [Google Scholar] [CrossRef]
- Zhu, Q.; Li, Y.; Geng, Y.; Qi, Y. Green Food Consumption Intention, Behaviors and Influencing Factors among Chinese Consumers. Food Qual. Prefer. 2013, 28, 279–286. [Google Scholar] [CrossRef]
- Basha, M.B.; Mason, C.; Shamsudin, M.F.; Hussain, H.I.; Salem, M.A. Consumers Attitude Towards Organic Food. Procedia Econ. Financ. 2015, 31, 444–452. [Google Scholar] [CrossRef] [Green Version]
- Moon, M.A.; Mohel, S.H.; Farooq, A. I Green, You Green, We All Green: Testing the Extended Environmental Theory of Planned Behavior among the University Students of Pakistan. Soc. Sci. J. 2021, 58, 316–332. [Google Scholar] [CrossRef]
- Bandura, A. Social Foundations of Thought and Action; Englewood Cliffs: Hoboken, NJ, USA, 1986. [Google Scholar]
- Stajkovic, A.D.; Bandura, A.; Locke, E.A.; Lee, D.; Sergent, K. Test of Three Conceptual Models of Influence of the Big Five Personality Traits and Self-Efficacy on Academic Performance: A Meta-Analytic Path-Analysis. Personal. Individ. Differ. 2018, 120, 238–245. [Google Scholar] [CrossRef]
- Bronstein, J. The Role of Perceived Self-Efficacy in the Information Seeking Behavior of Library and Information Science Students. J. Acad. Librariansh. 2014, 40, 101–106. [Google Scholar] [CrossRef]
- Wang, Y.-S.; Lin, H.-H.; Luarn, P. Predicting Consumer Intention to Use Mobile Service. Inf. Syst. J. 2006, 16, 157–179. [Google Scholar] [CrossRef]
- Lancaster, G.A.; Dodd, S.; Williamson, P.R. Design and Analysis of Pilot Studies: Recommendations for Good Practice. J. Eval. Clin. Pract. 2004, 10, 307–312. [Google Scholar] [CrossRef] [PubMed]
- Scholderer, J.; Brunsø, K.; Bredahl, L.; Grunert, K.G. Cross-Cultural Validity of the Food-Related Lifestyles Instrument (FRL) within Western Europe. Appetite 2004, 42, 197–211. [Google Scholar] [CrossRef] [PubMed]
- Kline, R.B. Principles and Practice of Structural Equation Modeling; Guilford Publications: New York, NY, USA, 2015. [Google Scholar]
- Leung, L. Validity, Reliability, and Generalizability in Qualitative Research. J. Fam. Med. Prim. Care 2015, 4, 324. [Google Scholar] [CrossRef] [PubMed]
- Bell, E.; Bryman, A. The Ethics of Management Research: An Exploratory Content Analysis. Br. J. Manag. 2007, 18, 63–77. [Google Scholar] [CrossRef]
- Podsakoff, P.M.; MacKenzie, S.B.; Podsakoff, N.P. Sources of Method Bias in Social Science Research and Recommendations on How to Control It. Annu. Rev. Psychol. 2012, 63, 539–569. [Google Scholar] [CrossRef] [Green Version]
- Anderson, J.C.; Gerbing, D.W. Structural Equation Modeling in Practice: A Review and Recommended Two-Step Approach. Psychol. Bull. 1988, 103, 411–423. [Google Scholar] [CrossRef]
- Franke, G.R. Multicollinearity. In Wiley International Encyclopedia of Marketing; John Wiley & Sons, Ltd.: Chichester, UK, 2010. [Google Scholar]
- Taherdoost, H.; Sahibuddin, S.; Jalaliyoon, N. Exploratory Factor Analysis; Concepts and Theory. Adv. Appl. Pure Math. 2014, 27, 375–382. [Google Scholar]
- Steenkamp, J.E.M.; Baumgartner, H. Assessing Measurement Invariance in Cross-National Consumer Research. J. Consum. Res. 1998, 25, 78–107. [Google Scholar] [CrossRef] [Green Version]
- Ketkaew, C.; Sukitprapanon, S.; Naruetharadhol, P. Association between retirement behavior and financial goals: A comparison between urban and rural citizens in China. Cogent Bus. Manag. 2020, 7, 1739495. [Google Scholar] [CrossRef]
- Byrne, B.M. Testing for multigroup invariance using AMOS graphics: A road less traveled. Struct. Equ. Model. 2004, 11, 272–300. [Google Scholar] [CrossRef]
- Fornell, C.; Larcker, D.F. Structural Equation Models with Unobservable Variables and Measurement Error: Algebra and Statistics. J. Mark. Res. 1981, 18, 382–388. [Google Scholar] [CrossRef]
- Hu, L.; Bentler, P.M. Cutoff Criteria for Fit Indexes in Covariance Structure Analysis: Conventional Criteria versus New Alternatives. Struct. Equ. Model. Multidiscip. J. 1999, 6, 1–55. [Google Scholar] [CrossRef]


| Demographic Variable | Categories | Segment 1 (Non-Green Consumers) | Segment 2 (Green Consumers) | Total | Significance Chi-Square Test | |||
|---|---|---|---|---|---|---|---|---|
| n | % | n | % | n | % | |||
| Segment size | 146 | 31.9 | 312 | 68.1 | 458 | 100.0 | ||
| Gender | Male | 41 | 9.0 | 59 | 12.9 | 100 | 21.8 | 0.027 |
| Female | 105 | 22.9 | 253 | 55.2 | 358 | 78.2 | ||
| Age | <21 | 75 | 16.4 | 147 | 32.1 | 222 | 48.5 | 0.364 |
| 22–38 | 69 | 15.1 | 151 | 33.0 | 220 | 48.0 | ||
| 39–53 | 1 | 0.2 | 8 | 1.7 | 9 | 2.0 | ||
| >54 | 1 | 0.2 | 6 | 1.3 | 7 | 1.5 | ||
| Income | <15,000 | 125 | 27.3 | 248 | 54.1 | 373 | 81.4 | 0.481 |
| 15,001–20,000 | 16 | 3.5 | 47 | 10.3 | 63 | 13.8 | ||
| 20,001–25,000 | 1 | 0.2 | 6 | 1.3 | 7 | 1.5 | ||
| 25,001–30,000 | 2 | 0.4 | 3 | 0.7 | 5 | 1.1 | ||
| >30,000 | 2 | 0.4 | 8 | 1.7 | 10 | 2.2 | ||
| Family size | 1 | 3 | 0.7 | 4 | 0.9 | 7 | 1.5 | 0.001 |
| 2 | 52 | 11.4 | 61 | 13.3 | 113 | 24.7 | ||
| 3 | 68 | 14.8 | 200 | 43.7 | 268 | 58.5 | ||
| 4 | 23 | 5.0 | 47 | 10.3 | 70 | 15.3 | ||
| Tasted experience | Ever | 115 | 25.1 | 275 | 60.0 | 390 | 85.2 | 0.009 |
| Never | 31 | 6.8 | 37 | 8.1 | 68 | 14.8 | ||
| Consume in the future | Will | 136 | 29.7 | 295 | 64.4 | 431 | 94.1 | 0.553 |
| Will not | 10 | 2.2 | 17 | 3.7 | 27 | 5.9 | ||
| Fit Index | Value | Threshold | Assessment |
|---|---|---|---|
| p-value | 0.00 | Acceptable | |
| CMIN/df | 2.649 | <3.00 | Passed |
| TLI | 0.944 | >0.90 | Passed |
| CFI | 0.951 | >0.90 | Passed |
| IFI | 0.951 | >0.90 | Passed |
| RMSEA | 0.060 | <0.10 | Passed |
| Construct | Indicator | Loading | p-Value | AVE | CR |
|---|---|---|---|---|---|
| Self-efficacy (SE) | SE1 to 5 | 0.757 to 0.939 | *** | 0.761 | 0.941 |
| Environmental concern (EC) | EC1 to 5 | 0.791 to 0.937 | *** | 0.772 | 0.944 |
| Utilitarian eating value (UT) | UT1 to 5 | 0.728 to 0.873 | *** | 0.660 | 0.906 |
| Perceived price (PP) | PP1 to 4 | 0.783 to 0.906 | *** | 0.730 | 0.915 |
| Attitude (AT) | AT1 to 5 | 0.870 to 0.932 | *** | 0.810 | 0.955 |
| Perceived behavioral control (PC) | PC1 to 3 | 0.845 to 0.913 | *** | 0.772 | 0.910 |
| Subjective norm (SN) | SN1 to 5 | 0.741 to 0.884 | *** | 0.690 | 0.917 |
| Purchase intention (PI) | PI1 to 4 | 0.898 to 0.955 | *** | 0.861 | 0.961 |
| Construct | PI | SN | PC | AT | PP | UT | EC | SE |
|---|---|---|---|---|---|---|---|---|
| PI | 0.928 | |||||||
| SN | 0.798 | 0.830 | ||||||
| PC | 0.636 | 0.707 | 0.790 | |||||
| AT | 0.824 | 0.844 | 0.776 | 0.900 | ||||
| PP | 0.573 | 0.612 | 0.775 | 0.679 | 0.854 | |||
| UT | 0.639 | 0.650 | 0.708 | 0.717 | 0.730 | 0.812 | ||
| EC | 0.579 | 0.532 | 0.610 | 0.642 | 0.666 | 0.661 | 0.879 | |
| SE | 0.586 | 0.577 | 0.633 | 0.640 | 0.643 | 0.703 | 0.684 | 0.720 |
| Fit Index | Value | Threshold | Assessment |
|---|---|---|---|
| p-value | 0.00 | Acceptable | |
| CMIN/df | 2.679 | <3.00 | Passed |
| TLI | 0.943 | >0.90 | Passed |
| CFI | 0.949 | >0.90 | Passed |
| IFI | 0.949 | >0.90 | Passed |
| RMSEA | 0.061 | <0.10 | Passed |
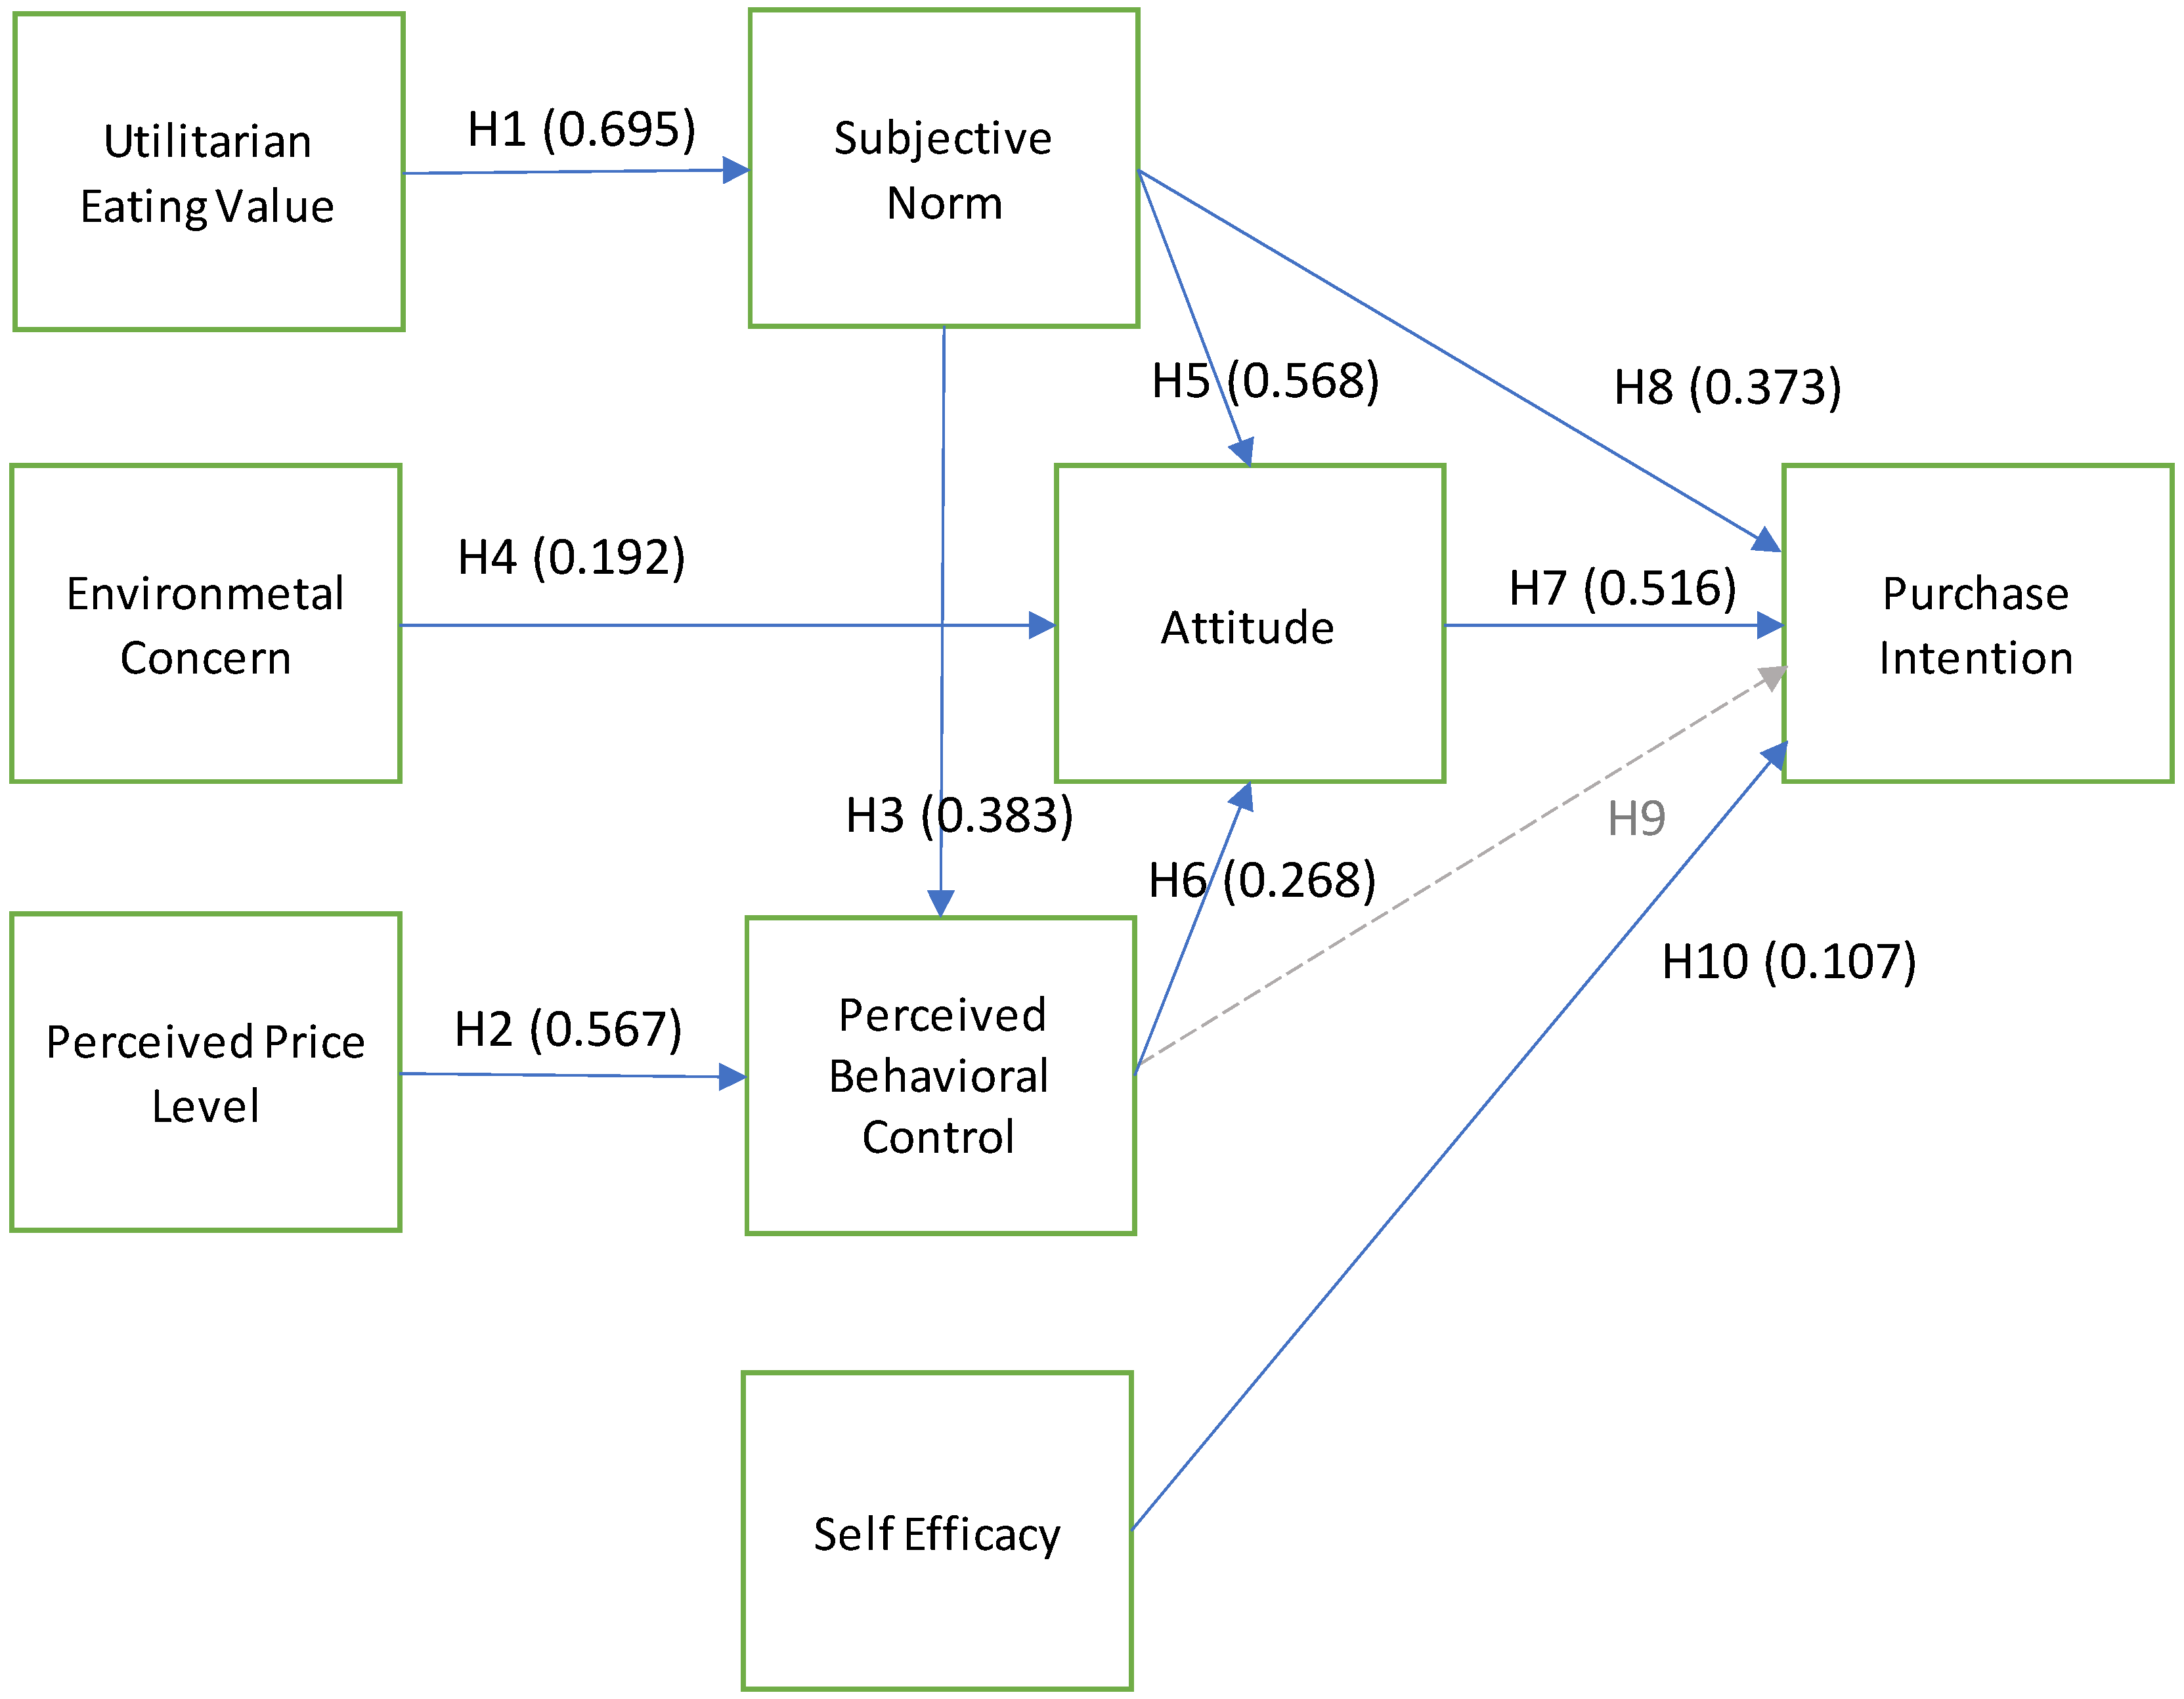
| Path | Relationships | Standardized Estimate | Result |
|---|---|---|---|
| H1 | UT → SN | 0.695 *** | Supported |
| H2 | P → PC | 0.567 *** | Supported |
| H3 | SN → PC | 0.383 *** | Supported |
| H4 | EC → AT | 0.192 *** | Supported |
| H5 | SN → AT | 0.568 *** | Supported |
| H6 | PC → AT | 0.268 *** | Supported |
| H7 | AT → PI | 0.516 *** | Supported |
| H8 | SN → PI | 0.373 *** | Supported |
| H9 | PC → PI | −0.094 | Rejected |
| H10 | SE → PI | 0.107 ** | Supported |
| Fit Index | Configural Invariance | Metric Invariance | Scalar Invariance | Threshold |
|---|---|---|---|---|
| p value | 0.00 | 0.00 | 0.00 | |
| CMIN/df | 1.967 | 1.931 | 1.929 | <3.00 |
| TLI | 0.934 | 0.936 | 0.936 | >0.90 |
| CFI | 0.942 | 0.943 | 0.941 | >0.90 |
| IFI | 0.943 | 0.944 | 0.942 | >0.90 |
| RMSEA | 0.046 | 0.045 | 0.045 | <0.10 |
| Assessment | Acceptable | Acceptable | Acceptable |
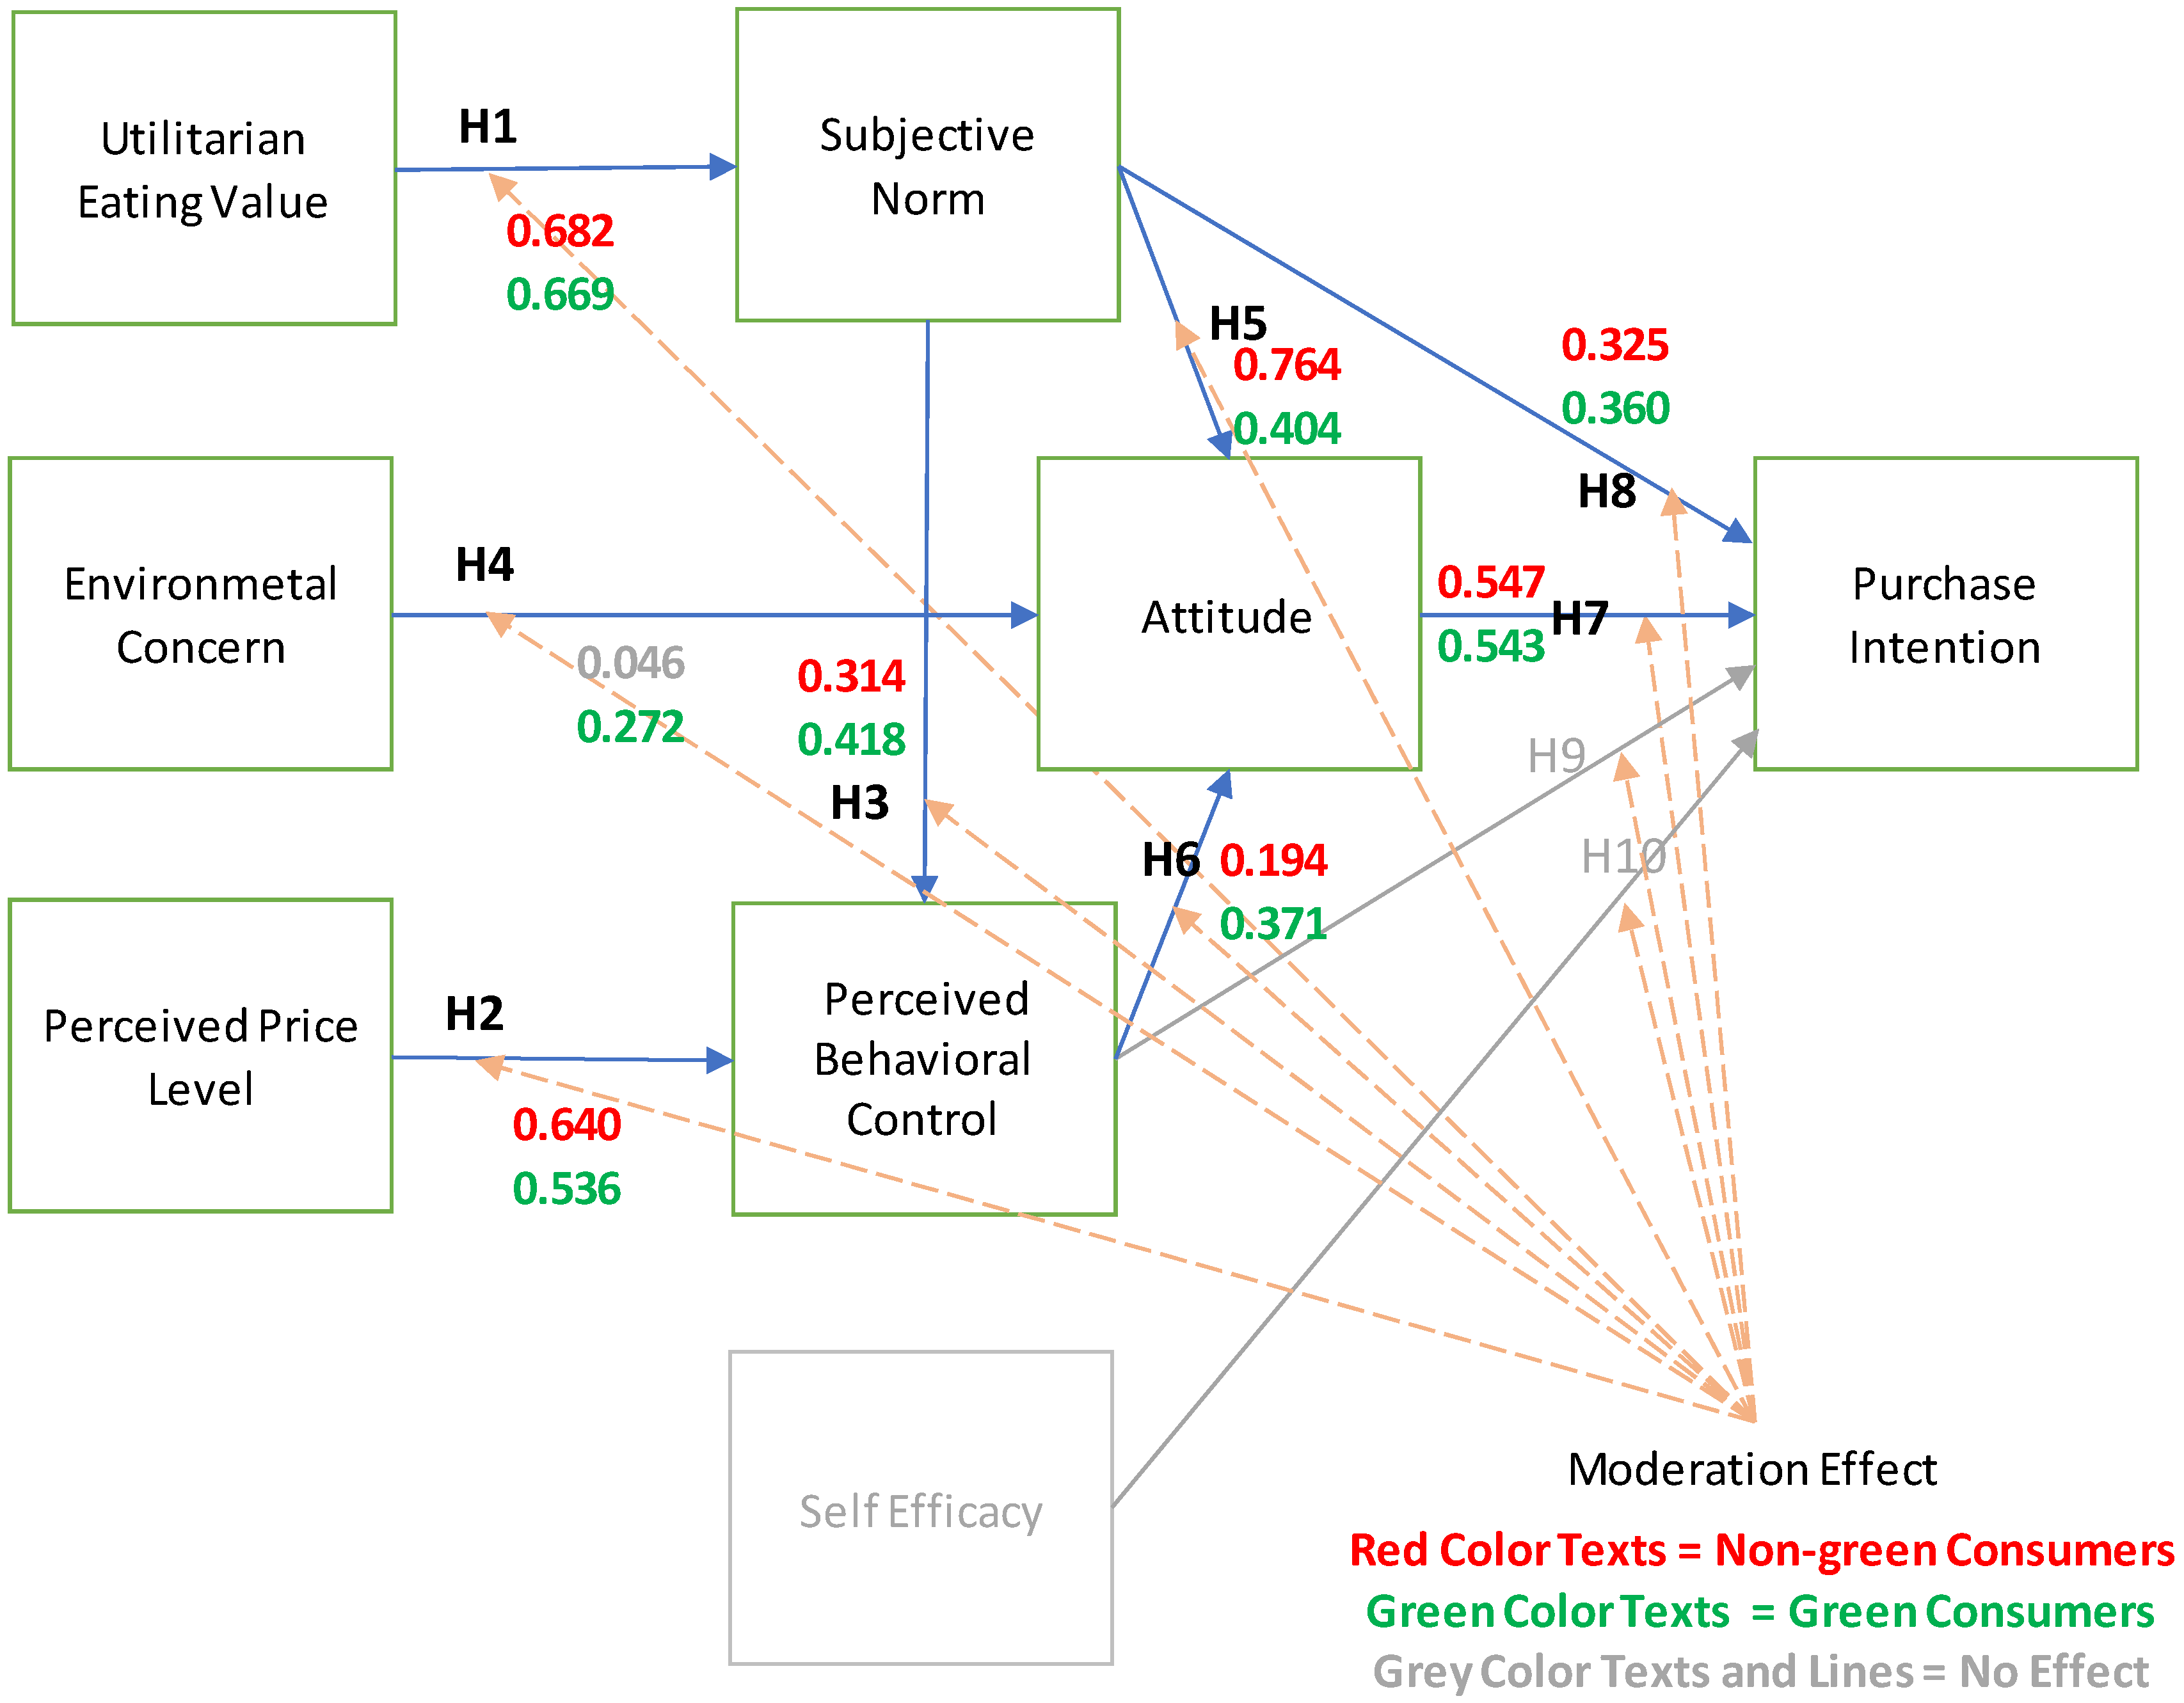
| Path | Relationships | Standardized Loading | Critical Ratio Difference | |
|---|---|---|---|---|
| Non-Green Consumers | Green Consumers | |||
| H1 | UT → SN | 0.682 *** | 0.669 *** | |−0.453| |
| H2 | P → PC | 0.640 *** | 0.536 *** | |−0.715| |
| H3 | SN → PC | 0.314 *** | 0.418 *** | |1.333| |
| H4 | EC → AT | 0.046 | 0.272 *** | |2.431| * |
| H5 | SN → AT | 0.764 *** | 0.404 *** | |−3.643| * |
| H6 | PC → AT | 0.194 * | 0.371 *** | |1.399| |
| H7 | AT → PI | 0.547 ** | 0.543 *** | |−0.004| |
| H8 | SN → PI | 0.325 * | 0.360 *** | |0.132| |
| H9 | PC → PI | 0.119 | 0.109 | |−0.470| |
| H10 | SE → PI | −0.065 | −0.127 | |−0.172| |
Publisher’s Note: MDPI stays neutral with regard to jurisdictional claims in published maps and institutional affiliations. |
© 2022 by the authors. Licensee MDPI, Basel, Switzerland. This article is an open access article distributed under the terms and conditions of the Creative Commons Attribution (CC BY) license (https://creativecommons.org/licenses/by/4.0/).
Share and Cite
Wongsaichia, S.; Naruetharadhol, P.; Schrank, J.; Phoomsom, P.; Sirisoonthonkul, K.; Paiyasen, V.; Srichaingwang, S.; Ketkaew, C. Influences of Green Eating Behaviors Underlying the Extended Theory of Planned Behavior: A Study of Market Segmentation and Purchase Intention. Sustainability 2022, 14, 8050. https://doi.org/10.3390/su14138050
Wongsaichia S, Naruetharadhol P, Schrank J, Phoomsom P, Sirisoonthonkul K, Paiyasen V, Srichaingwang S, Ketkaew C. Influences of Green Eating Behaviors Underlying the Extended Theory of Planned Behavior: A Study of Market Segmentation and Purchase Intention. Sustainability. 2022; 14(13):8050. https://doi.org/10.3390/su14138050
Chicago/Turabian StyleWongsaichia, Sasichakorn, Phaninee Naruetharadhol, Johannes Schrank, Premchai Phoomsom, Kanjakhon Sirisoonthonkul, Vorrapol Paiyasen, Sedthawut Srichaingwang, and Chavis Ketkaew. 2022. "Influences of Green Eating Behaviors Underlying the Extended Theory of Planned Behavior: A Study of Market Segmentation and Purchase Intention" Sustainability 14, no. 13: 8050. https://doi.org/10.3390/su14138050
APA StyleWongsaichia, S., Naruetharadhol, P., Schrank, J., Phoomsom, P., Sirisoonthonkul, K., Paiyasen, V., Srichaingwang, S., & Ketkaew, C. (2022). Influences of Green Eating Behaviors Underlying the Extended Theory of Planned Behavior: A Study of Market Segmentation and Purchase Intention. Sustainability, 14(13), 8050. https://doi.org/10.3390/su14138050