Article

Spatial-Heterogeneity Analysis of the Heavy Metals Cd and Pb in Road Dust in the Main Urban Area of Harbin

College of Geographical Science, Harbin Normal University, Harbin 150025, China
*
Author to whom correspondence should be addressed.
Sustainability 2022, 14(13), 8007; https://doi.org/10.3390/su14138007
Submission received: 28 May 2022 / Revised: 26 June 2022 / Accepted: 27 June 2022 / Published: 30 June 2022

Abstract

:
To provide a scientific basis for pollution prevention and control of the urban environment, the current status of heavy-metal pollution in road dust in Harbin was studied. In total, 63 road dust samples in the main urban area of Harbin were collected, and the contents of Cd and Pb, two representative heavy metals, were detected. Using the Moran Index coupled with semi-variable function and geostatistical methods, the spatial correlation, variation structure, and distribution pattern were analyzed, and the estimated probability of the heavy metals exceeding the safety standard was determined. The study showed that: The mean concentrations of Cd and Pb were higher than the background values in Heilongjiang province, and both exhibited moderate variability, while the coefficient of variation of Cd was larger than that of Pb; Cd was weakly correlated in space and randomly distributed, Pb was moderately correlated in space and exhibited good spatial structure, and both were spatially aggregated. The optimal model for fitting the variance function showed that Cd was a spherical model, and Pb was an exponential model. The variation of Cd was mainly influenced by human factors, and the variation of Pb was influenced by both structural and random factors. The optimized interpolation results of the variance function had high accuracy, and the spatial distribution of Cd was elliptical, whereas the distribution of Pb was stripe-shaped, Cd was mainly influenced by traffic factors, such as industrial enterprise distribution and road painting, while Pb was influenced by natural factors such as river sediment or the study area belonging to a geologically high background area, in addition to the above factors. The estimated probabilities indicate a higher potential risk of Cd in the northeastern part of the study area.

1. Introduction

Urban surface dust is the solid particulate matter in the atmosphere deposited and adhered to the impermeable surface of cities by dry and wet deposition [1]. As an important carrier for the migration and transformation of heavy metals and other pollutants [2,3], surface dust is considered to be the link between heavy metals and other pollutants in urban multi-environmental media and is the “source” and “sink” of pollutants [4,5,6]. As one of the busiest functional areas in the city, urban road pollution is caused by urban human activities such as transportation, industrial emissions, and urban waste disposal [7], resulting in the accumulation of heavy-metal elements in surface dust, which may also be easily raised again under certain exogenous dynamic conditions causing pollution of different environmental media [8], which can pose a threat to human health through exposure pathways such as ingestion, respiration, and skin contact [9,10]. Therefore, it is important to study the variability characteristics of urban surface-dust heavy metals for regional environmental management and ecological security.
In recent years, investigation and evaluation of the pollution status and variability characteristics of heavy metals in urban road dust have received increasing attention in urban environmental studies. For urban road dust heavy-metal pollution, scholars at home and abroad have carried out a lot of work, including on the accumulation characteristics, on the health risks, and source analysis. For example, Asfandyar Shahab [11] et al. collected 114 papers, including 61 cities in 21 countries, and summarized the worldwide-pollution characteristics of heavy metals in road dust through the study of heavy-metal concentrations, sources, distribution, and health risks; Bin Guo [12] et al. did ecological risk assessment and source analysis of heavy metals in the study area. While the spatial heterogeneity of heavy metals has been less studied, for example, Qin Zhiheng [13] et al. used Moran’s I index and semi-variance function theory to reveal the spatial correlation of soil Cd content in the study area and its variability pattern in spatial structure, and Li Chuanzhang [14] et al, and Chandra [15] et al, used the coefficient of variation and semi-variance function theory to explore the strength of soil heavy-metal variability and the range of spatial autocorrelation in the study area. However, none of the above studies considered the clustering characteristics at the local scale, and coupled with the possibility of spatial variability of heavy metals in urban surface dust, few studies have been reported on the use of Anselin Local Moran’s I index to analyze the spatial-clustering characteristics of heavy-metal contents in urban road dust. Therefore, this study combines Global Moran’s I index, Anselin Local Moran’s I index, semi-variance function theory, and geostatistical methods to fully utilize the functionality of different methods, to comprehensively analyze the spatial correlation of dust heavy metals and their variation patterns in the study area, aiming to provide some references for the environmental protection and treatment of residents, enterprises, and related departments along the road.

2. Materials and Methods

2.1. Study Site

Harbin is located in the northeastern region of China’s Northeast Plain and the southern part of Heilongjiang province (Figure 1A,B). It is one of the central cities in Northeast China and an important manufacturing base of the country. Additionally, Harbin is also the transportation, political, economic, cultural, and financial center of the northeast region of the country. It is also a megacity with the largest land area and the third-largest registered population among the provincial cities in China. Harbin exhibits a mid-temperate continental monsoon climate with long, cold winters and short, cool summers. The region has an average annual precipitation of 569.1 mm, which is mainly concentrated in June–September, with summer accounting for 60% of the total annual precipitation. The snowfall period is concentrated from November to January of the following year. According to the China Statistical Yearbook, the number of motor vehicles in Harbin reached about 1.5 million in 2021. The study area is within the main urban area of Harbin, including five urban areas: Daoli, Daowai, Xiangfang, Nangang, and Songbei. The geographical latitude and longitude are 45°43′–45°50′ N, 126°34′–126°45′ E, and the total area is approximately 182.66 km2.

2.2. Sample Collection and Determination

The sampling points of road dust were mainly distributed within the second ring road of the main urban area of Harbin. The sampling time was determined according to the weather and rainfall forecast, and the sampling work was completed within two days (21–22 October 2021) during a sunny week. When selecting the sampling points, care was taken to avoid garbage heaps, low-lying areas, and construction road sections. Brushes and plastic shovels were used to collect the road-surface dust samples. Approximately 150 g to 200 g of dust was collected in each sampling point (composed of 3 to 5 secondary sampling points), and a total of 63 road dust samples were collected. During the sampling process, the coordinates of the sampling points were recorded with a GPS, and the distribution map of the sampling points was drawn with the ArcGIS software (Figure 1C). The samples were sealed in clean polyethylene bags, marked, and naturally air-dried at room temperature in the laboratory. After air-drying, the dust samples were passed through a 10-mesh nylon sieve to remove large stones, leaves, hairs, and other debris. Next, an HQ40D portable multi meter was used to test the pH value of 10 g of the sieved samples. The remaining dust samples were passed through a 200-mesh sieve, digested with HClO4-HNO3-HF, and the contents of Cd and Pb were determined by inductively coupled plasma emission mass spectrometry (ICP-MS). The precision and accuracy of the analytical method were quality controlled using the national soil standard material GSS-15 and parallel samples in the laboratory, and the elemental recovery rates were all 100 ± 10%.

2.3. Data Processing

The mean values, coefficient of variation, and correlation index of the experimental data were calculated using Excel of WPS office. Data testing and correlation analysis were conducted using SPSS 22. Geoda software was used to analyze the data with Moran’s I. The geostatistical software GS + 9.0 was used to analyze the spatial variation of heavy metals. ArcGIS 10.2 was used to draw the location map of the sampling points, the spatial distribution map of heavy metals, and the estimated probability map.

2.4. Spatial-Correlation Analysis

Spatial correlations were analyzed using the Moran Index. This index is divided into Global Moran’s I and Anselin local Moran’s I. Global Moran’s I is a statistic that describes whether there are clustering characteristics of elements in space from the overall scale [16], as described in Equation (1). Anselin local Moran’s I is a decomposition form of global Moran’s I. This index essentially decomposes global Moran’s I into smaller spatial units [17], which can further quantify the degree of difference and salience between specific spatial elements and surrounding elements, as described in Equation (2).
I = n i = 1 n j = 1 n w i j ( x i x ¯ ) ( x j x ¯ ) ( i = 1 n j = 1 n w i j ) i = 1 n ( x i x j ) 2
I i = ( n 1 ) ( x i x ¯ ) j = 1 , j i n w i j ( x j x ¯ ) j = 1 , i j n ( x j x ¯ ) 2
where I is Global Moran’s I; Ii is Anselin local Moran’s I; n represents the number of spatial data; and xi and xj represent attribute values of spatial features of areas i and j. wij is the element of the spatial weight matrix; ij. Generally, Global Moran’s I ranges from −1 to 1. If Global Moran’s I is greater than 0, it means that there is a positive spatial autocorrelation in the study area (i.e., the closer the space, the stronger the correlation). Conversely, if it is less than 0, it means that there is a negative spatial autocorrelation in the study area. Finally, if it is equal to 0, it means that there is no spatial autocorrelation, and, therefore, the values of this index are randomly distributed [18]. Typically, the standard deviation Z value of the assumption of approximate normal distribution under random conditions is used to judge the spatial autocorrelation [19]. The null hypothesis is rejected when Z > 1.96 and p < 0.05. This result indicates that the spatial autocorrelation is positive, and similar observations tend to be clustered in space. The null hypothesis is rejected when Z < −1.96 and p < 0.05. This result shows that the spatial autocorrelation is negative, and similar observations tend to be discrete in space. Conversely, the null hypothesis is accepted when Z = 0, meaning that the spatial distribution is random [20].

2.5. Spatial-Variability Analysis

Spatial variability was analyzed using a semi-variance function. The semi-variance function refers to half of the variance of the difference between two points. It is a function of the continuous spatial variation of dust elements and reflects the variation between observations at different distances of elements. This function can accurately describe the spatial variation structure of heavy metal content [21]. The sample data that satisfied the normal or logarithmic distribution were used to simulate the semi-variance function, after which the relevant parameters were calculated and tested using GS + 9.0 software, as described in Equation (3).
λ ( h ) = i = 1 N ( h ) [ Z ( x i ) Z ( x i + h ) ] 2 2 N ( h )
where λ(h) represents the semi-variance function; h is the step size, that is, the spatial distance of the sample points; Z(xi) and Z(xi + h) are measured values of regional variables Z(x) at spatial locations xi and xi + h; and N(h) is the total number of point pairs when the sample point distance is h. Parameters such as main theoretical models, nugget value, base value, nugget coefficient, partial base value, and range are all important components of semivariogram (semi-variance function). The semivariogram is also a key function to study the spatial variability of sample variables in geostatistics. It mainly reflects the spatial distribution pattern, variation characteristics, and the type and scope of spatial autocorrelation of regional variables [22].

3. Results

3.1. Classical Statistical Analysis of Heavy-Metal Content in Road Dust in the Main Urban Area of Harbin

Table 1 summarizes the descriptive statistical analysis result of heavy-metal content in road surface dust in the study area. The Cd content in road dust was 0.12–2.23 mg/kg, with an average value of 0.96 mg/kg, and the Pb content in road dust was 16.00–132.00 mg/kg, with an average value of 81.14 mg/kg. The average values of Cd and Pb exceeded the soil background value in Heilongjiang province [23]. Specifically, the heavy metal Pb exceeded the background value by nearly 4-fold, whereas Cd exceeded this value by as much as 12-fold. However, upon applying the soil-pollution-risk screening value in the “Soil Environmental Quality Standard” (GB15618--2018) [24] to calculate the excess of heavy metals in the dust in the study area, the results showed that the excess rate of Pb was only 1.59%, whereas the excess rate of Cd reached 87.30%. The pH of the road dust varied from 6.62 to 9.31, with an average value of 7.83. According to the pH-classification standard [25], the value was alkaline within the range of 7.5 to 8.5. Therefore, the road dust in the main urban area of Harbin was mainly weakly alkaline. Previous studies have shown that [26] heavy metals in surface dust mostly exist in the form of elemental metals or insoluble compounds under alkaline conditions, which do not easily migrate. Therefore, the accumulation of heavy metals becomes more notorious with time.
CV (the coefficient of variation) can reflect the uniformity and degree of variation of the element in the sample point. The calculation formula is the ratio of the standard deviation of the element to the average value. As a result, CV < 10% represents a weak variation, and 10% < CV < 100% is moderate variation, whereas CV > 100% is a strong variation [27]. The larger the coefficient of variation, the more uneven the distribution of elements in dust, indicating that it is greatly affected by human activities. The coefficient of the variation of pH in the study area was 7.89%. This was a weak variation, indicating that the physical and chemical properties were relatively stable. Cd and Pb were both moderately variable, indicating that the dust on some roads in the study area had different degrees of Cd and Pb enrichment. Moreover, the coefficient of variation of Cd (40.96%) was greater than that of Pb (30.00%), indicating that Cd was more affected by human activities than Pb. These findings demonstrated that the road surface dust in the study area was affected by exogenous heavy metals to a certain extent, especially the Cd content.

3.2. Spatial Correlation Analysis

3.2.1. Global Moran’s I

Table 2 summarizes the Global Moran’s I of the spatial autocorrelation analysis of heavy metals in road dust in the main urban area of Harbin. The statistical parameters of spatial correlation mainly include the spatial position and attributes of spatial variables. According to the size of the Z value, the correlation is judged with a normal distribution at a 95% confidence interval with a two-sided test threshold of 1.96 as the limit [28]. Our findings indicated that the normalized Z (3.568) of the spatial autocorrelation index of Pb was higher than 1.96 and p (0.000) < 0.05, indicating that Pb exhibited positive spatial autocorrelation, and the values between adjacent observation points were similar. Furthermore, its spatial distribution was clustered and had a good spatial structure. The Z of Cd ranged between 0 and 1.96, with p > 0.05, indicating that the spatial autocorrelation of Cd was not significant, showing a random spatial distribution. This indicated that the distribution of this element was greatly affected by human factors. These findings were consistent with the CV results above.

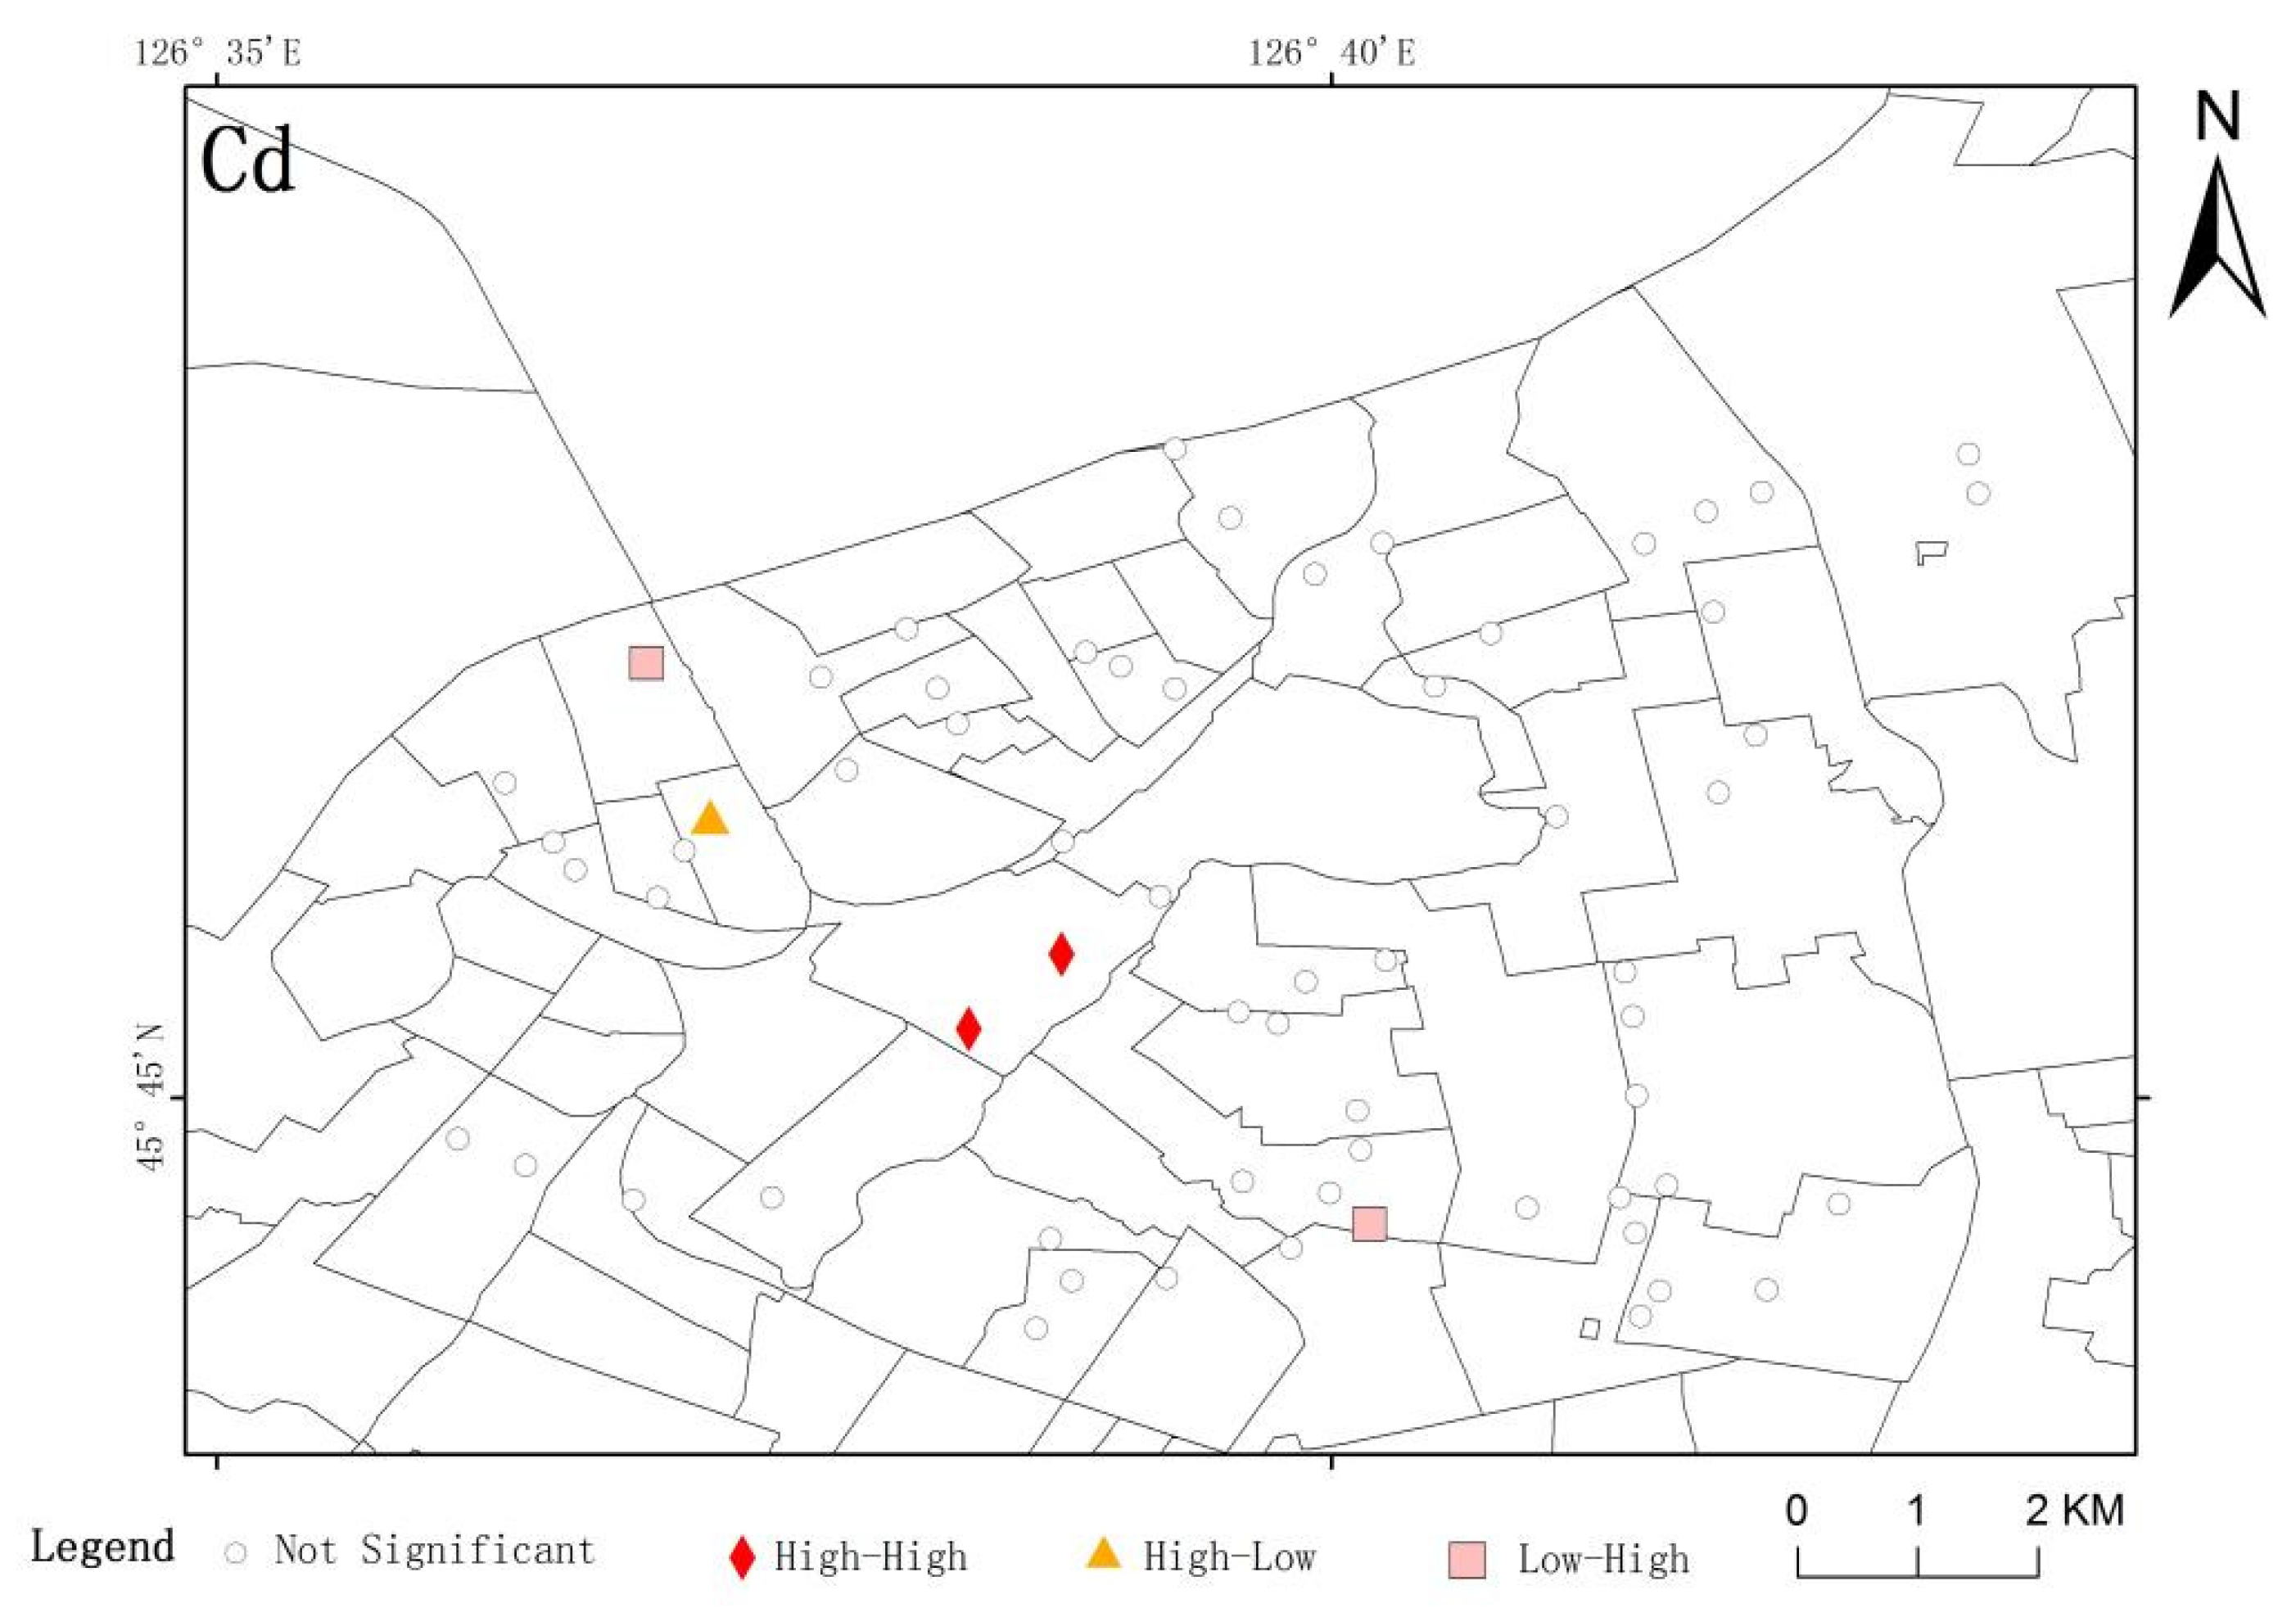
3.2.2. Anselin Local Moran’s I

Geoda software and ArcGIS software were used to conduct Anselin local Moran′s I analysis [29] (Figure 2 and Figure 3). As illustrated in Figure 2, two points constituted high-value clusters (high–high) of Cd, which were distributed near Xidazhi Street, Nangang District, Harbin, China. Furthermore, no low-value cluster points (low–low) were observed. There was only one high outlier (high–low), which was located near Anguo Street in Daoli District. There were two low outliers (low–high), which were located near Youyi Road in Daoli District and Minsheng Road in Nangang District. The rest had no significant correlation. In Figure 3, there were three high-value clusters of Pb, which were distributed near Chengde Street in Daowai District and near Xidazhi Street in Nangang District. Additionally, we detected four low-value areas, all of which were distributed in Daoli District. There were no outliers, and the rest of the points were also insignificant. These points were distributed in various parts of the main urban area of Harbin. Overall, there were high-value clusters of Cd and Pb in the main urban area of Harbin, and, therefore, this area must be more closely monitored.

3.3. Spatial-Variability Analysis

3.3.1. Data Pre-Processing

To ensure the quality of the geostatistical fitting model, the data must conform to the normal distribution [30]. This study used SPSS22 software’s K-S test to calculate the significance test value of the data, which can be quantitatively determined. That is, when p is greater than the confidence level of 0.05, the data conform to a normal distribution. Logarithmic transformation or Box-Cox transformation was carried out for the data that did not conform to the normal distribution. Afterward, model fitting and further research on geostatistical- and spatial-distribution interpolation were conducted. The results are shown in Table 3.

3.3.2. Structural Characteristics of Heavy Metals in Dust

The variogram analysis of Cd and Pb was carried out using GS + 9.0 software [31]. Before the analysis, the geographic coordinates of the sampling points must be converted into projection coordinates [32] and the parameters of the variogram must be established. The effective lag distance is 1/2 of the maximum distance, according to the empirical method, and its value was 5240.81 m. The step length was 520 m, the number of lengths was 10, and the angle tolerance was ±22.5°. The calculation results are shown in Table 4. The following were the selection criteria for the best model: largest coefficient of determination (R2) and lowest residual sum of squares (RSS), with the latter factor being dominant.
In Table 4, the nugget value (C0) represents a random factor; the base value (C0 + C) represents the total variation; the range (A) is the distance corresponding to the variation function reaching the base value. Beyond that range, spatial autocorrelation is meaningless. The nugget coefficient [C0/(C0 + C)] is the ratio of the nugget value to the base value, indicating the proportion of the spatial heterogeneity caused by random factors to the total system variation. If the nugget coefficient is less than 0.25, the variable has a structure (structural factors are natural factors); if the nugget coefficient ranges from 0.25 to 0.75, the variable is determined by both structural and random factors (the random factors are human factors); if the nugget coefficient is greater than 0.75, then the variable is determined by random factors [33,34].
As indicated in Table 4, after semi-variance fitting of the heavy metal Cd, the optimal model selected was the spherical model, the coefficient of determination (R2) was 0.785, the residual sum of squares (RSS) was 1.848 × 10⁻³, and the fitting effect was good. The nugget coefficient was 0.886 (>0.75), and the results showed that the Cd in the study area had a weak spatial correlation. Moreover, its spatial variation was dominated by random variation and was greatly affected by external factors. Furthermore, these findings highlighted the complexity of the spatial variation of heavy metals in dust under strong human interference.
The theoretical optimal model of Pb was an exponential model, the coefficient of determination R2 was 0.931, the residual sum of squares RSS was 13674, and the fitting effect was good. The nugget coefficient was 0.744, ranging from 0.25 to 0.75, indicating that natural structural factors and random factors jointly affected the distribution of Pb content. Furthermore, the Pb in the study area had a moderate spatial correlation, indicating that this heavy metal had a certain spatial-autocorrelation pattern. Although the content of the relevant pattern was affected by human factors, it had not yet reached the level of destroying its original spatial pattern.

3.4. Spatial-Interpolation Analysis

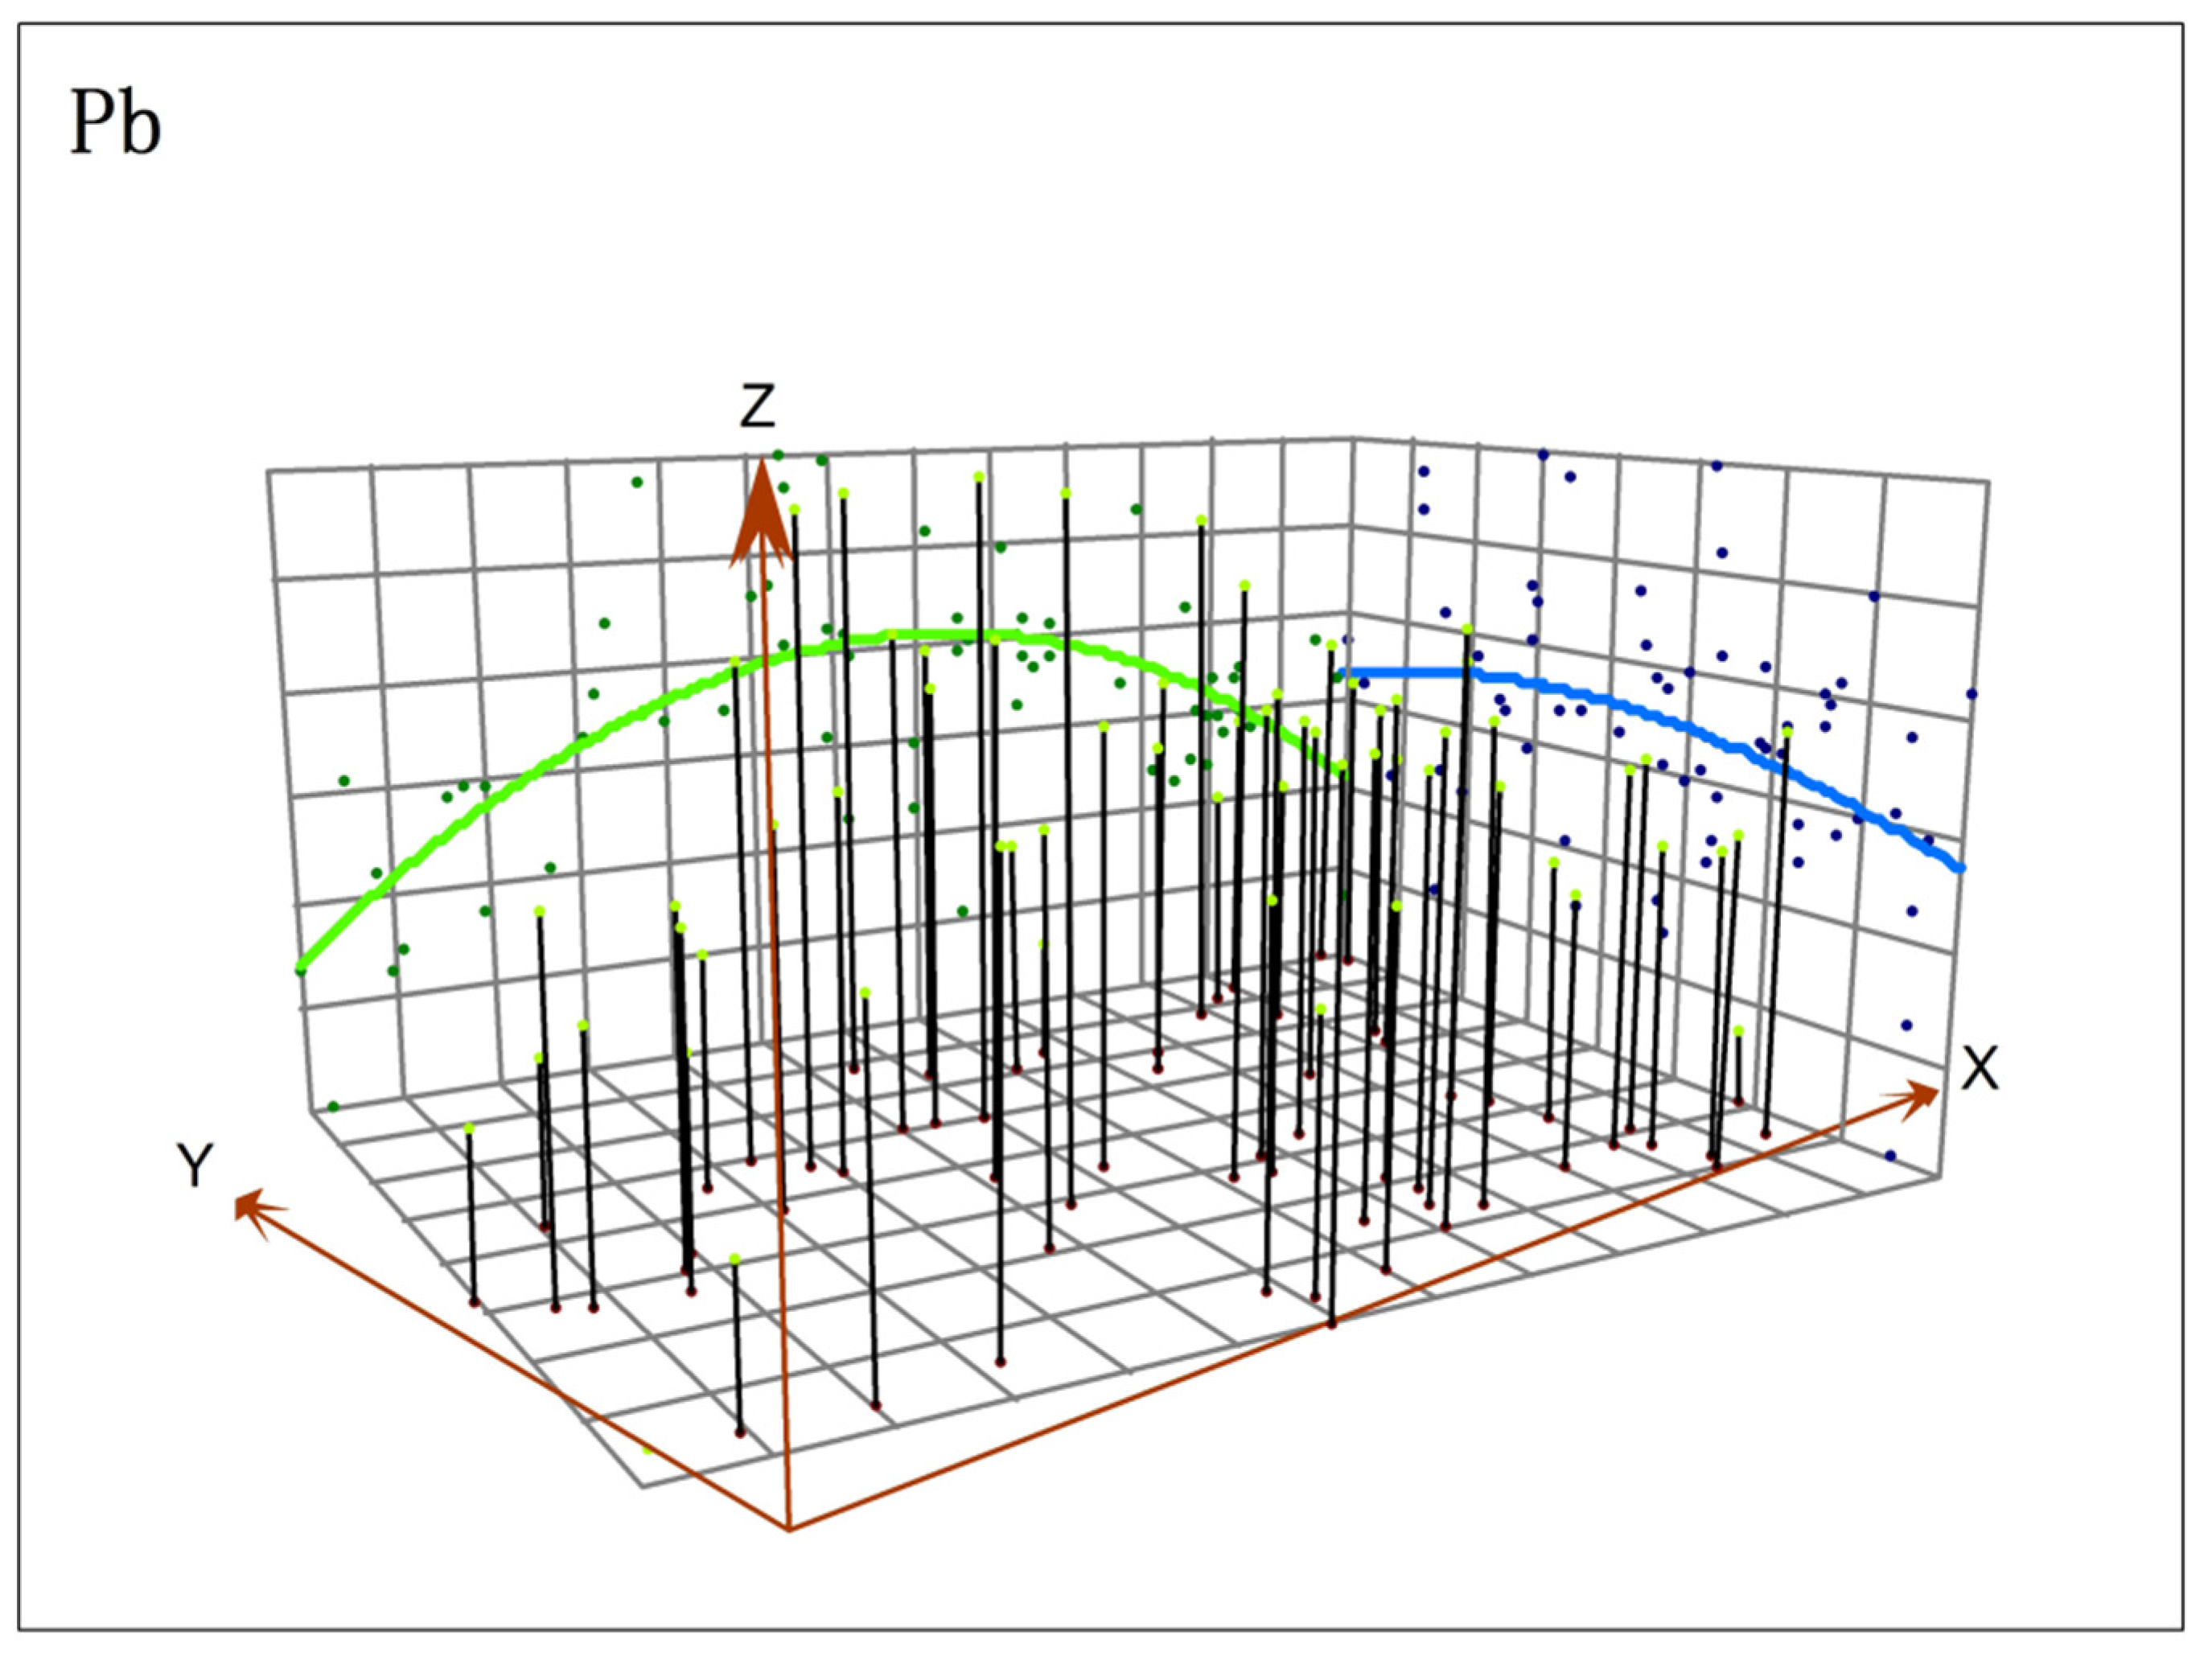
3.4.1. Cross-Validation and Trend Analysis

When using GIS software to build a model for spatial interpolation, cross-validation should be performed first [34]. The error size and accuracy of the interpolation model are determined by verifying the results. The selected semivariogram of the heavy metals in the road dust in the main urban area of Harbin was combined with the original heavy-metal data for cross-validation.
When conducting cross-validation analysis, the closer the mean prediction error (ME) is to 0, the better the prediction effect; the closer the standard mean error (MSE) is to 0, the stronger the prediction bias; and the closer the standard root mean square error (RMSSE) is to 1, the more accurate the error result [35]. According to the cross-validation results, Table 5 was obtained.
As indicated in Table 5, the mean prediction errors (ME) of Cd and Pb were close to 0, and the standard mean errors (MSE) of the two were also close to 0, indicating that the two predictions had strong deviations; the standard root mean square errors (RMSSE) of Cd and Pb were both close to 1, indicating that the error results of the two were relatively accurate, and the interpolation results were also relatively accurate.
After cross-validation, global-trend graphs of Cd and Pb were generated (Figure 4 and Figure 5). A global trend refers to the change trend of spatial data in a specific direction, which reflects the main characteristics of spatial variables in the region, and is used to reveal the overall order of the spatial variables. The assumptions of geostatistical applications must satisfy the second-order stationary assumption. The global trend destroys the conditions for the hypothesis to be established, and, therefore, it is necessary to eliminate the global trend when using geostatistics for interpolation analysis [36].
In the trend graph, the X-axis represents the east–west direction(Green Line), and the Y-axis represents the north–south direction (Blue Line). It can be seen from Figure 4 that the content of Cd in the north–south direction showed an inverted “U” distribution trend. Figure 5 shows the distribution trend of Pb content. Pb in the north–south direction and the east–west direction also showed an inverted “U” distribution, but the change in the east–west direction was larger. That is, Cd and Pb showed a global second-order trend in both the north–south and the east–west directions.

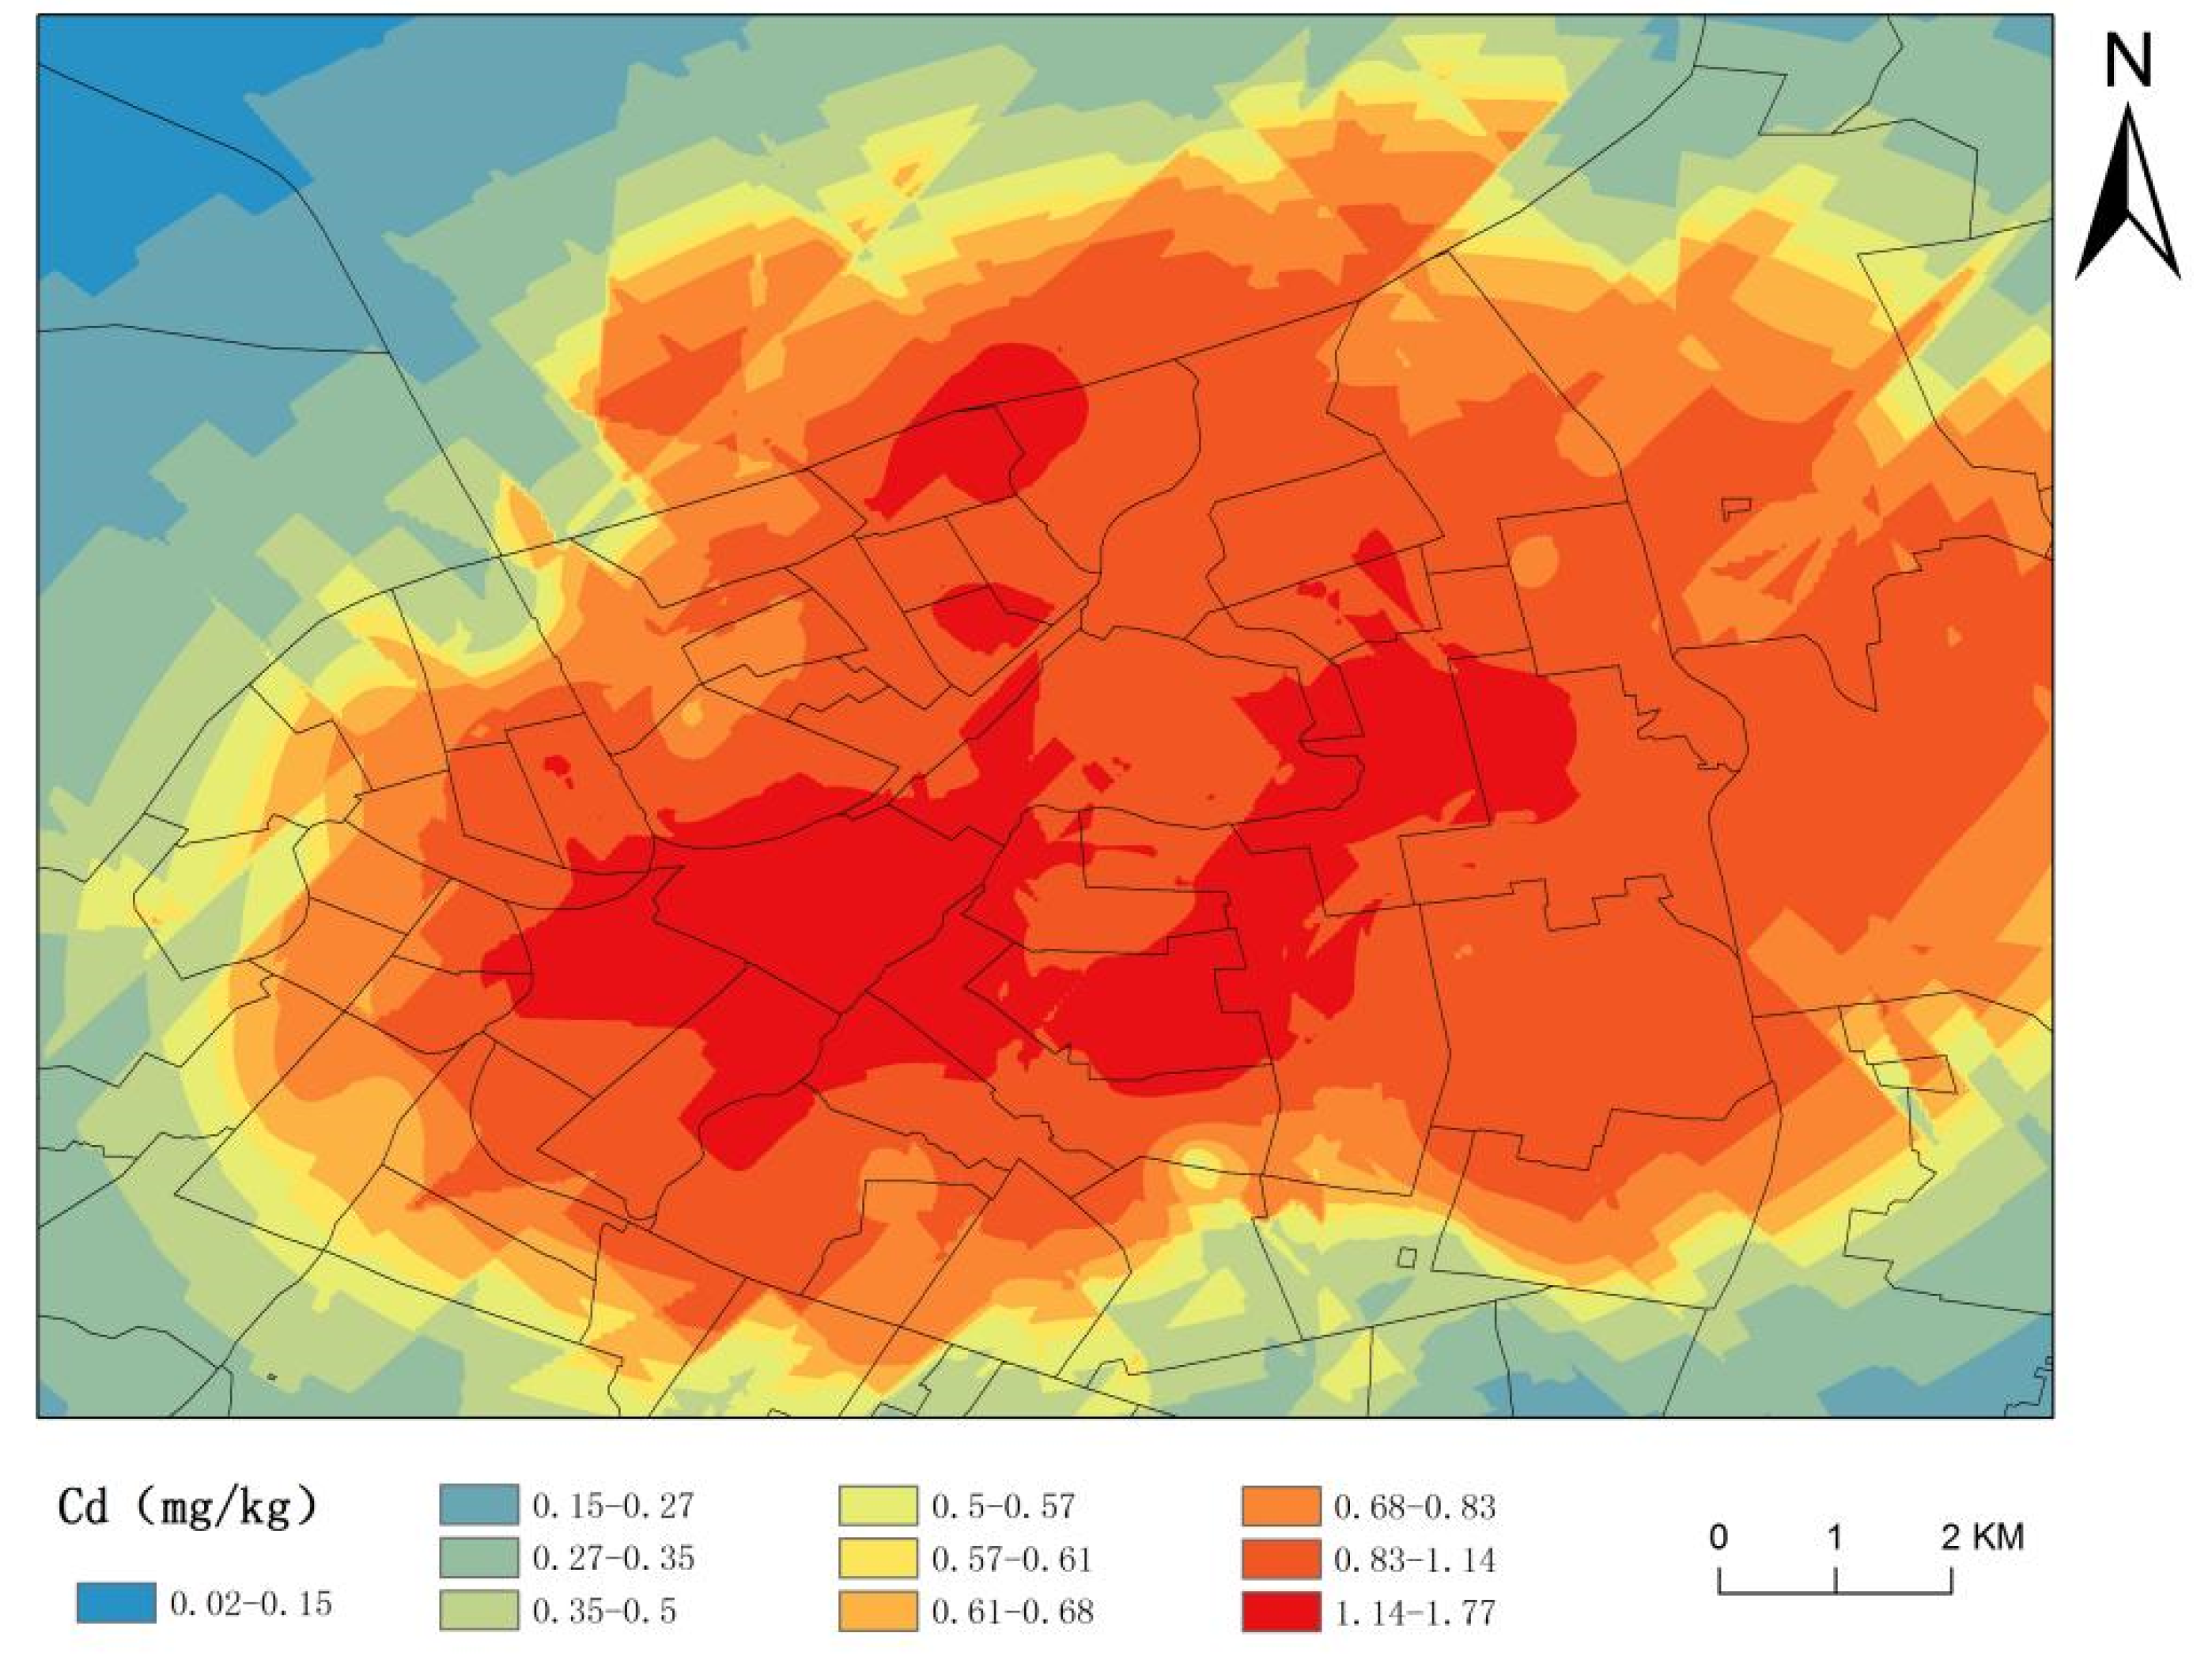
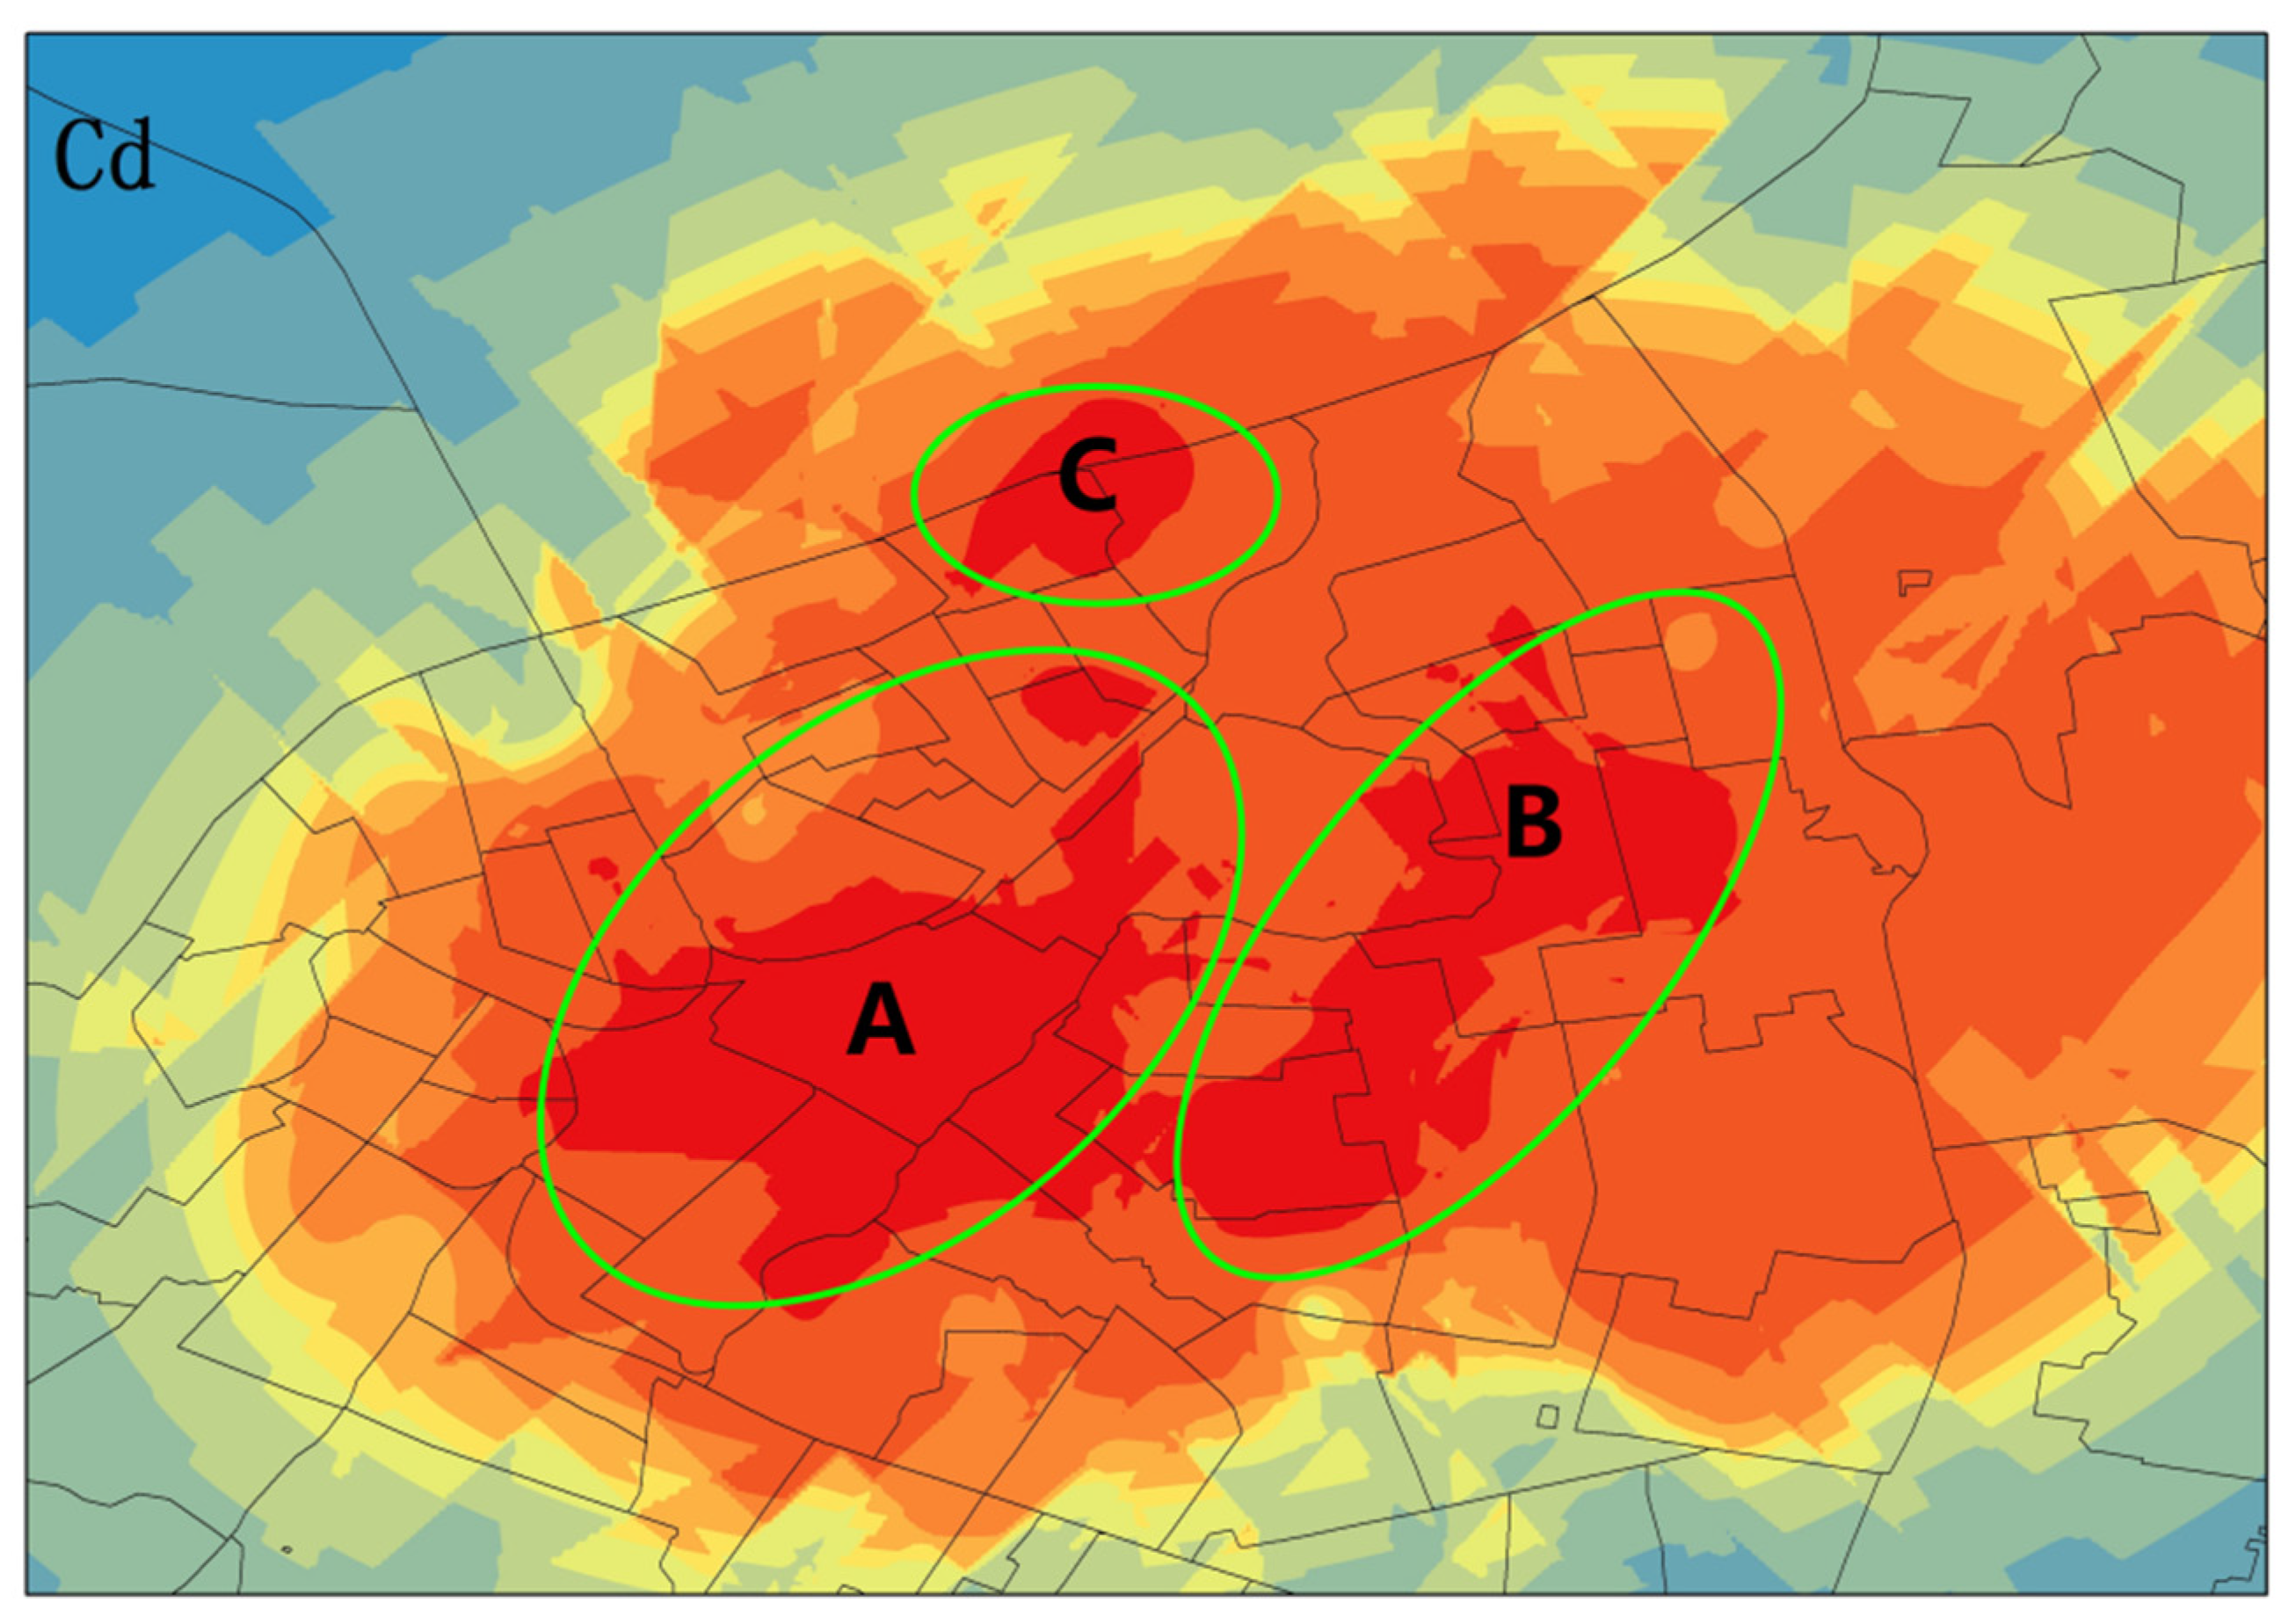
3.4.2. Heavy-Metal Spatial-Interpolation Method Results

After trend analysis, the variogram-analysis results of Cd and Pb were imported into ArcGIS geostatistics to draw interpolation plots [37]. The interpolation method selected was ordinary kriging, and the corresponding transformation was selected according to the data-transformation type. The global-trend order was removed according to the trend-analysis result; the optimal-fitting model and parameters of the variogram were introduced, including model type, nugget value, main range, partial base value, step size, and number of steps. The search-neighborhood setting adopted the default value, and the kriging-interpolation map was obtained. Figure 6 and Figure 7 show the spatial interpolation of the Cd and Pb in the road dust in the main urban area of Harbin. As illustrated in the figure, the high-value areas of the heavy metals Cd and Pb largely coincided with the Anselin local Moran′s I analysis results.
From a global perspective, the content of heavy metals in dust in the entire study area was high in the east and low in the west. The distribution of Cd was elliptical as a whole, and the content increased from the outside of the ellipse to the focus. Additionally, there were three obvious large pollution areas in the central area, which spread gently into the periphery. Pb was generally distributed in stripe-shaped patterns, and the content gradually increased from the two sides of the strips to the middle of the study area. There were two obvious large pollution areas in the middle and northern areas. In general, the spatial continuity of both was good.
As illustrated in the spatial distribution map, the Cd content in the northeast, northwest, southwest, and southeast of the study area was below 0.6 mg/kg, which was lower than the Cd-risk screening value. Most of the content in the central area was above 0.6 mg/kg, and the highest content area was the center, with gradual spreading into the surrounding area, which coincided with gradual decreases in Cd concentrations. The distribution of Pb content in the study area exhibited the following order: western region < eastern region < central region. The central region presented a stripe-like distribution extending from north to south.

4. Discussion

The present study found that there were heavy metals in the dust if the study area exhibited obvious clustering and spatial heterogeneity. Additionally, there were abnormal points with high and low values. Therefore, further analysis of the causes of variation was required. Cd and Pb are generally known to originate from traffic sources [38]. Moreover, the areas with relatively high levels of Cd and Pb pollution in road dust are mainly characterized by a dense distribution of industry, such as machinery, metal, and plastic manufacturing, as well as a dense transportation network and atmospheric deposition. Otherwise, these areas had high heavy-metal burdens due to geological processes [39,40,41]. This information was combined with the findings of this study to identify the sources of pollution more reasonably, which will be discussed below.
It is generally known that the Cd pollution in the study is caused by human activities, whereas the Pb pollution resulted from the combined effect of natural factors and human activities. The high-value areas of Cd and Pb in the study area were divided into three areas (A, B, and C) according to their geographic locations. As shown in Figure 8 and Figure 9, the distribution of Cd in the A and C areas was similar to that of Pb in the A and B areas, indicating that the two pollutants may share a common source. The high-value area of Cd, A, and the high-value area of Pb, B, were located at the intersection of Daoli District and Nangang District, near Xidazhi Street, which is a prosperous urban area with a dense traffic network and many first-class roads. Road congestion often occurs at this site, and there were also a large number of parking lots distributed nearby. Studies have linked parking lots with high Pb levels. There were also three railway lines that intersect with each other at this site. Additionally, there were several factories in the region that were mainly dedicated to the manufacturing of machinery, metal, plastic, and transportation equipment. The above-mentioned traffic problems and the presence of factories may be the main reasons for the excess of the heavy metals Cd and Pb in the region.
The high-value area of Cd, C, and the high-value area of Pb, A, were located in the Daowai District. Through field investigation, it was found that there are many vehicle-maintenance centers distributed in this area. These centers mainly specialize in tire repair and vehicle repair, which would inevitably contribute to the excess of Cd and Pb in this area.
The high-value area of Cd, B, was mainly distributed in the Daowai and Nangang urban areas. This area mainly had a large number of residential areas and schools, as well as a relatively high number of factories. Compared with the entire study area, the roads in this site appeared to be dirtier.
The high-value area of Pb, C, was near the Songhua River Basin, and did not have a correlation with traffic factors. Therefore, the influence of natural factors was considered. Dong Chenyin [42] pointed out, in their research on Baoshan District, Shanghai, that the natural source of Pb was similar to the sediments in the intertidal zone of the Changjiang Estuary,. Similarly, the distribution of Pb in the dust in the main urban area of Harbin was likely to be related to the river sediments in the Songhua River [43], or the study area may belong to a high geological background area.
Atmospheric deposition may also be an important reason for the high content of Cd and Pb in the main urban area of Harbin. Gao Chunhong [44] demonstrated that the air pollution in Harbin mainly came from coal-fired heating emissions in severely cold weather, whereas vehicle exhaust and industrial pollution sources had relatively low contributions. The sampling time of this study coincided with the winter in Harbin. The amount of coal burning required for heating increased significantly in this period. During the coal-burning process, fine-grained dust is released into the atmosphere, which ultimately becomes enriched in the surface layer through dry and wet atmospheric deposition. In turn, this increases the Cd and Pb content of the surface layer. Moreover, Harbin is located at the eastern foot of the Greater Xing’an Mountains. In winter, the atmosphere is stable, and the ground-mounted inversion layer is not conducive to the diffusion of pollutants. Additionally, the convergence of the ground wind field ultimately leads to the accumulation of surrounding pollution.
The colored paint used for road marking contains heavy metals, including Cd and Pb, especially yellow paint [45]. Cd content was much higher than the content of other heavy metals, by up to 5.49 mg/kg [46]. The main roads and secondary roads in the main urban area of Harbin were marked with colored paint, such as double-yellow lines. Therefore, road paint may also be one of the reasons for the heavy-metal pollution of roads in the study area.
The low-value areas in the study area were mainly distributed in Daoli District. This region encompasses the bustling commercial area of Harbin (e.g., Zhongyang Street and Shangzhi Street) and many well-known tourist locations such as Sophia Church and Flood Control Memorial Tower, therefore, there were large numbers of people in this area. This area was the best-managed and the cleanest among all of the study sites. Specifically, road cleaning and strict management systems such as restricting vehicle travel within a specific period were powerful measures to reduce heavy-metal pollution on roads.
Figure 10 shows the estimated probability of the heavy metal Cd exceeding the standard value in the study area [47,48]. According to the soil environmental-quality standard [24], when the pH > 7.5 and the soil’s Cd content exceeds 0.6 mg/kg, this leads to environmental pollution and poses a threat to plant and human health. The average value of Pb did not exceed the environmental-quality standard. Therefore, no estimated probability analysis of Pb was performed. The Cd high-risk areas were distributed in the eastern part of the study area, with the northeastern region exhibiting the highest levels, including the three main urban areas of Daowai District, Xiangfang District, and Nangang District. The estimated probability Ω[Cd ≥ 0.6 mg/kg] reached more than 90%. These findings indicated that the potential risk of Cd in road dust in these three main urban areas was extremely high, and attention should be paid to strengthening prevention and management, in addition to strengthening the cleaning of urban roads.

5. Conclusions

In this study, 63 dust samples were collected from the main urban area of Harbin City, the Cd and Pb contents were detected, and the spatial variation structure and distribution pattern were analyzed by geostatistical methods. The following conclusions were obtained from this study:
(1)
The average value of the heavy metals Cd and Pb in road dust in Harbin was greater than the background value of Heilongjiang province, and the content of Cd exceeded the GB15618-2018 soil-pollution-risk screening value. These findings indicated that there was a certain degree of Cd and Pb pollution in the main urban area of Harbin, with Cd pollution being relatively serious. Both Cd and Pb exhibited moderate variation, with coefficients of variation of 40.96% and 30.00%, respectively.
(2)
The Cd in the study area was weakly correlated in space and randomly distributed; the Pb was spatially moderately correlated and had a good spatial structure. The two heavy metals were spatially clustered, Cd and Pb had high-value clusters, and Pb had low-value clusters. The semivariance functions indicated that the theoretical optimal model for Cd was spherical, whereas that for Pb was exponential. The nugget coefficients for the two were 88.6% (Cd) and 74.4% (Pb), indicating that the variation of Cd was mainly influenced by human factors. In addition, the variation of Pb was mainly influenced by both natural and human factors.
(3)
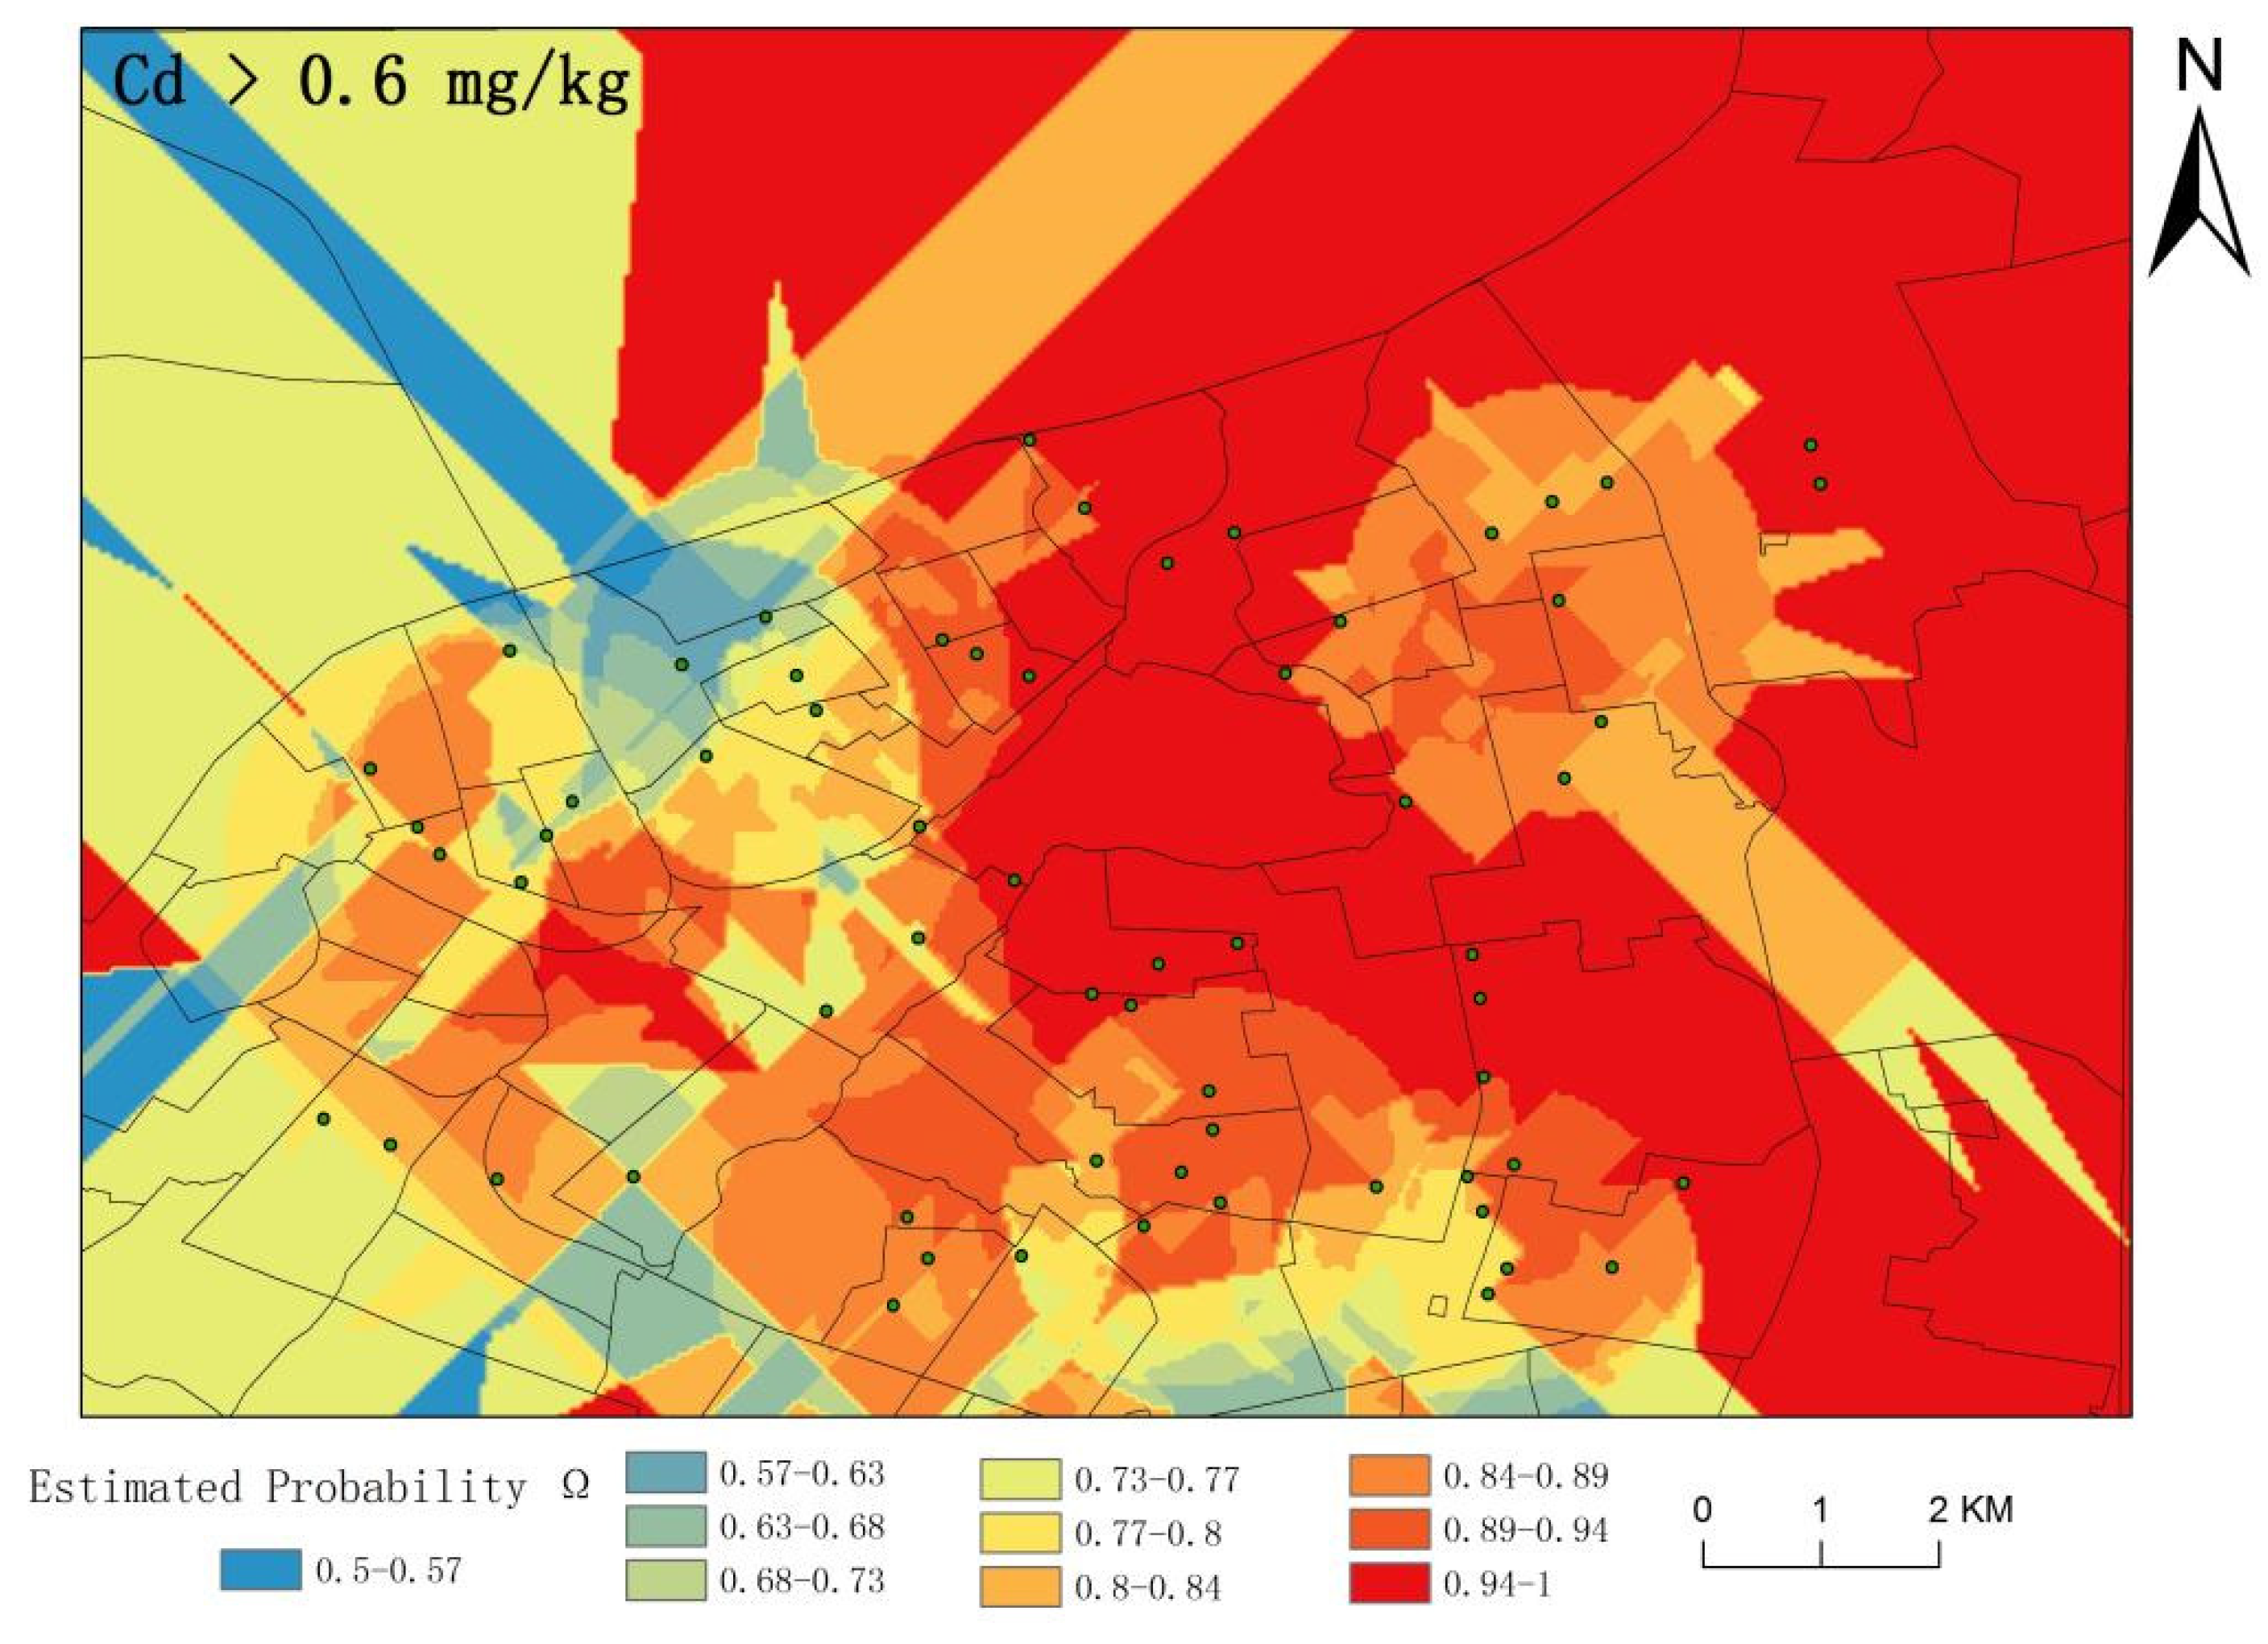
The high-value areas of the dust’s heavy-metal elements in the study area are mainly located near the junction of Daoli District and Xiangfang District–Xidazhang Street, and the pollution in the east is more serious than that in the west. The spatial distribution of Cd was elliptical, and the distribution of Pb was stripe-shaped. The high-value areas of Cd in the study area are mainly influenced by human activities, including vehicle-exhaust emissions and tire wear caused by dense transportation networks, dense distribution of factories, atmospheric deposition, and road paint. In addition to Pb, there were also natural factors influenced by the sediments of the Songhua River. Otherwise, the area might have naturally high levels of heavy metals due to geological processes. According to the estimated probability results, there was a high-potential risk of Cd in the northeastern part of the study area. Therefore, it is necessary to strengthen road cleaning and implement strict management systems, such as restricting vehicle travel during specific periods for areas with high values of heavy metals, and not to slack off for areas with low values of heavy metals and to do a good job of prevention and management.

Author Contributions

Conceptualization, Z.C., X.Z., D.M., P.Z., S.X. and X.N.; methodology, Z.C.; software, Z.C.; validation, X.Z. and P.Z.; formal analysis, Z.C. and X.Z.; investigation, Z.C., S.X., X.N. and X.Z.; data curation, Z.C.; writing—original draft preparation, Z.C.; writing—review and editing, X.Z., S.X. and X.N.; visualization, Z.C.; supervision, X.Z.; project administration, X.Z.; funding acquisition, X.Z. All authors have read and agreed to the published version of the manuscript.

Funding

This research was funded by the General Program of the National Natural Science Foundation of China (42171127), the University Nursing Program for Young Scholars with Creative Talents in Heilongjiang Province of China (UNPYSCT-2017184), and the Doctoral Startup Fund of Harbin Normal University (XKB201314).

Institutional Review Board Statement

Not applicable.

Informed Consent Statement

Not applicable.

Data Availability Statement

Data for this research are available on request.

Acknowledgments

We thank all the participants who responded to the survey.

Conflicts of Interest

The authors declare no conflict of interest.

References

  1. Chang, J.; Liu, M.; Hou, L.J.; Xu, S.Y.; Lin, X.; Ballo, S. Concept, pollution character and environmental effect of urban surface dust. Chin. J. Appl. Ecol. 2007, 18, 1153–1158. [Google Scholar]
  2. Banerjee, A.D.K. Heavy metal levels and solid phase speciation in street dusts of Delhi, India. Environ. Pollut. 2003, 123, 95–105. [Google Scholar] [CrossRef]
  3. Sun, Y.; Zhou, Q.; Xie, X.; Liu, R. Spatial, sources and risk assessment of heavy metal contamination of urban soils in typical regions of Shenyang, China. J. Hazard. Mater. 2009, 174, 455–462. [Google Scholar] [CrossRef] [PubMed]
  4. Zhang, X.; Yu, X.; Song, Q.; Sun, L.; Du, B.; Chen, W. Characteristics and health risk assessment of heavy metals in PM10 and PM2.5 at the south coast of Xiamen Bay. Environ. Sci. Technol. 2019, 42, 201–210. [Google Scholar] [CrossRef]
  5. Han, Y.; Cao, J.; Posmentier, E.S.; Fung, K.; Tian, H.; An, Z. Particulate-associated potentially harmful elements in urban road dusts in Xi’an, China. Appl. Geochem. 2007, 23, 835–845. [Google Scholar] [CrossRef]
  6. Shi, D.; Lu, X.; Xu, X.; Han, X. Study on heavy metal pollution and sources of suspended dust on roads in Baotou city. Environ. Sci. Technol. 2019, 42, 16–23. [Google Scholar] [CrossRef]
  7. Yu, X.; Li, F.; Fu, G.; Feng, H.; Xiong, F. Evaluation of spatial and temporal distribution characteristics and pollution level of heavy metals in road dust in Beijing. Mod. Geol. 2019, 33, 169–175. [Google Scholar] [CrossRef]
  8. Tian, H.; Yang, L.; Xia, Z.; Ning, S.; Wei, C. Distribution characteristics of heavy metals in surface particulate matter and ecological risk evaluation in Lintong District, Xi’an City. J. Ecol. Environ. 2018, 27, 276–281. [Google Scholar] [CrossRef]
  9. Jiao, W.; Niu, Y.; Li, B.; Duan, Y.; Zhang, N.; Zhao, Y.; Niu, Y. Health risk evaluation and anthropogenic source analysis of heavy metals from urban road dust based on chemical morphology analysis. J. Ecol. Environ. 2018, 27, 2269–2275. [Google Scholar] [CrossRef]
  10. Zhu, L.; Chen, Y.Y.; Yuan, G.J.; Zhang, X.Y.; Jiang, X.Q.; Yang, X.R.; Wang, X.H. Optimal evaluation of ecological risk of heavy metals in urban road sediments. Environ. Sci. Res. 2022, 35, 836–844. [Google Scholar] [CrossRef]
  11. Shahab, A.; Hui, Z.; Rad, S.; Xiao, H.; Siddique, J.; Huang, L.L.; Ullah, H.; Rashid, A.; Taha, M.R.; Zada, N. A comprehensive review on pollution status and associated health risk assessment of human exposure to selected heavy metals in road dust across different cities of the world. Environ. Geochem. Health 2022, 1–22. [Google Scholar] [CrossRef] [PubMed]
  12. Guo, B.; Su, Y.; Pei, L.; Wang, X.; Zhang, B.; Zhang, D.; Wang, X. Ecological risk evaluation and source apportionment of heavy metals in park playgrounds: A case study in Xi’an, Shaanxi Province, a northwest city of China. Environ. Sci. Pollut. Res. 2020, 27, 24400–24412. [Google Scholar] [CrossRef] [PubMed]
  13. Qin, Z.; Shi, H.; Wang, M.; Bai, Z.; Yang, Z.; Hao, Y. Spatial distribution and correlation of soil Cd pollution in the main tributaries of Xiangjiang River basin. Environ. Sci. Res. 2018, 31, 1399–1406. [Google Scholar] [CrossRef]
  14. Li, C.; Ou, X.; Zhang, C.; Yang, H.; Zeng, J.; Li, N.; Li, S. Analysis of heavy metal pollution and spatial variability of farmland soils along the Huanjiang River. J. Jiangxi Agric. Univ. 2018, 40, 1348–1356. [Google Scholar] [CrossRef]
  15. Chandra, R.; Prusty, B.; Azeez, P.A. Spatial variability and temporal changes in the trace metal content of soils: Implications for mine restoration plan. Environ. Monit. Assess. 2014, 186, 3661–3671. [Google Scholar] [CrossRef] [PubMed]
  16. Zhang, K.; He, J.; Zhong, Y.; Wei, Q.; Chen, F. GIS-based analysis of heavy metal sources in soils around a copper-silver mining area in Ningxia. Environ. Sci. 2022. [Google Scholar] [CrossRef]
  17. Liu, Z.; Fei, Y.; Shi, H.; Mo, L.; Qi, J.; Wang, C. Analysis of soil heavy metal sources in Rucheng County, Hunan Province based on UNMIX model and Moran index. Environ. Sci. Res. 2021, 34, 2446–2458. [Google Scholar] [CrossRef]
  18. Yu, J.; Shi, H.; Wang, M.; Liu, X. Identification of soil heavy metal cadmium pollution sources in the impact area of key polluting enterprises in Xiangjiang sub-basin. Environ. Sci. Res. 2020, 33, 1013–1020. [Google Scholar] [CrossRef]
  19. Chen, Y. Spatial autocorrelation theory development and method improvement based on Moran statistics. Geogr. Res. 2009, 28, 1449–1463. [Google Scholar]
  20. Li, C.; Liu, C. Spatial correlation and variation analysis of soil Cd around enterprises in Ful River basin. In Proceedings of the 2021 Annual Scientific and Technical Conference of the Chinese Society of Environmental Science—Environmental Engineering Technology Innovation and Application Session (II), Tianjin, China, 20–21 October 2021; pp. 358–364. [Google Scholar] [CrossRef]
  21. Nielsen, D.R.; Warrick, A.W.; Myers, D.E. Geostatistical Methods Applied to Soil Science. Methods Soil Anal. 1986, 5, 53–82. [Google Scholar]
  22. Zhang, H.; Zhao, K.; Ye, Z.; Xu, B.; Zhao, W.; Gu, X.; Zhang, H. Spatial heterogeneity of soil heavy metals and its risk evaluation in typical pecan production areas. Environ. Sci. 2018, 39, 2893–2903. [Google Scholar] [CrossRef]
  23. State Environmental Protection Administration; China National Environmental Monitoring Station. Chinese Soil Element Background Values; China Environmental Science Publishing: Beijing, China, 1990.
  24. 15618—2018 G; Soil Environmental Quality Agricultural Land Soil Pollution Risk Control Standard. Ministry of Ecology and Environment of the People’s Republic of China: Beijing, China, 2018.
  25. Cheng, H.; Li, K.; Li, M.; Yang, K.; Liu, F.; Cheng, X. Background and benchmark values of soil chemical elements in Chinese cities. Geol. Foreground 2014, 21, 265–306. [Google Scholar] [CrossRef]
  26. Zheng, F.; Guo, X.; Tang, M.; Zhu, D.; Dong, S.; Kang, L.; Chen, B. Distribution characteristics and ecological risk assessment of heavy metals in Baiyangdian and surrounding soils. Environ. Sci. 2022. [Google Scholar] [CrossRef]
  27. Zhang, J.; Li, X.; Zhang, L.; Yang, K.; Zhang, Q.; Wang, Y. Spatial variability and sources of heavy metal elements in potentially selenium-rich soils at Brick Bridge, Lujiang County, Anhui Province, China. Environ. Sci. Res. 2019, 32, 1594–1603. [Google Scholar] [CrossRef]
  28. Yang, M.H.; Wang, W.L.; Jin, Z.H.; Zhang, J. Study on the spatial variability of heavy metals in surface dust in urban areas of Baoji City. Henan Sci. 2021, 39, 1317–1323. [Google Scholar]
  29. Huang, S.; Fang, B.; Li, X.; He, S. Study on spatial heterogeneity of soil alkaline dissolved nitrogen in rice fields based on county scale. J. Ecol. Rural. Environ. 2020, 36, 179–185. [Google Scholar] [CrossRef]
  30. Jiao, S. Spatial Heterogeneity Analysis of Soil Heavy Metal Pollution Based on PXRF. Master’s Thesis, Nanjing Forestry University, Nanjing, China, 2021. [Google Scholar] [CrossRef]
  31. Zhang, L.; Chen, X.; Zhang, Z. Analysis of spatial variability of water chemistry in a southwestern karst watershed. Earth Environ. 2019, 47, 594–600. [Google Scholar] [CrossRef]
  32. Wang, M.; Dong, J.; Bai, L.; Zhang, Y.; Jiang, Z.; Jiang, N.; Wu, J.; Zhang, L.; Fang, J.; Fu, W. Spatial heterogeneity of soil heavy metals and their ecological risks in the main production areas of Cephalotaxus botrytis in Zhejiang Province. Environ. Sci. 2021, 42, 5949–5957. [Google Scholar] [CrossRef]
  33. Yang, N.; Lian, Y.; Xia, X.; Zhang, M.S.; Li, Z. Study on spatial variability and multivariate homogeneity partitioning of soil heavy metals in a typical region. J. Agric. Environ. Sci. 2021, 40, 1451–1459. [Google Scholar]
  34. Liu, M. Study on the Pattern of Spatial Heterogeneity of Soil Heavy Metals in Small Watersheds of Black Soil Area. Master’s Thesis, Northeast Agricultural University, Harbin, China, 2021. [Google Scholar] [CrossRef]
  35. ESRI. Using Geostatistical Analyst; ESRI Inc.: Redlands, CA, USA, 2004. [Google Scholar]
  36. Shen, R. Analysis of Spatial Variability of Organic Matter Content in Different Types of Soils in Datong City. Master’s Thesis, Shanxi Agricultural University, Jinzhong, China, 2019. [Google Scholar] [CrossRef]
  37. Zhao, K.; Fu, W.; Ye, Z.; Dai, W. Spatial heterogeneity and distribution characteristics of soil heavy metals in electronic waste dismantling area. Environ. Sci. 2016, 37, 3151–3159. [Google Scholar] [CrossRef]
  38. Ma, J.; Gu, L.; Li, W. Heavy metal accumulation and potential risk in the roadside soil of Zheng-Shang section of Lian-Huo Expressway. Environ. Sci. 2009, 30, 894–899. [Google Scholar] [CrossRef]
  39. Zhu, M.; Tang, L.; Liu, D. A review of soil heavy metal monitoring and assessment along traffic arteries. China Environ. Monit. 2015, 31, 84–91. [Google Scholar] [CrossRef]
  40. Geng, Y.; Zhang, C.; Zhang, Y.; Huang, D.; Yan, S.; Sun, T.; Cheng, L.; Wang, J.; Mao, Y. Fugacity patterns and ecological risk assessment of heavy metals in urban sludge in China. Environ. Sci. 2021, 42, 4834–4843. [Google Scholar] [CrossRef]
  41. Li, Y.; Ma, J.; Liu, D.; Sun, Y.; Chen, Y. Evaluation of heavy metal pollution and potential ecological risk in Kaifeng urban soil. Environ. Sci. 2015, 36, 1037–1044. [Google Scholar] [CrossRef]
  42. Dong, C.Y.; Zhang, W.G.; Wang, G.; Ma, H.L.; Liu, R.Y.; Liu, Y.; Ye, L.P.; Yu, L.C. Isotopic discrimination of urban soil lead pollution sources in Baoshan District, Shanghai. Environ. Sci. 2012, 33, 754–759. [Google Scholar] [CrossRef]
  43. Li, Z. Study on the Evaluation of Heavy Metal Content, Morphology and Ecological Risk of Surface Sediments in Songhua River. Master’s Thesis, Lanzhou University of Technology, Lanzhou, China, 2019. [Google Scholar]
  44. Gao, C.; Zhang, K.; Zang, S.; Zhang, L.; Sun, L. Analysis of air pollutant transport pathways and potential source areas in Harbin City. Environ. Sci. Technol. 2021, 44, 162–170. [Google Scholar] [CrossRef]
  45. Jeong, H.; Choi, J.Y.; Lim, J.; Shim, W.J.; Kim, Y.O.; Ra, K. Characterization of the contribution of road deposited sediments to the contamination of the close marine environment with trace metals: Case of the port city of Busan (South Korea). Mar. Pollut. Bull. 2020, 161, 111717. [Google Scholar] [CrossRef]
  46. Guan, Y.; Lai, Z.; Li, X.; Wang, S.; Zhang, Y.; Zhao, J.; Zhou, J. Determination of Pb, Cd, Cr(III) and Cr(VI) in paints and inks. Anal. Test Tech. Instrum. 2015, 21, 32–36. [Google Scholar] [CrossRef]
  47. Lv, J. Quantitative source analysis and spatial prediction of soil heavy metals in Yantai coastal zone. J. Geogr. 2021, 76, 713–725. [Google Scholar]
  48. Liu, Y.; Ma, Z.; Lu, J.; Bi, J. Analysis of soil heavy metal sources and environmental risk assessment in Rizhao city. J. Geogr. Sci. 2016, 26, 735–749. [Google Scholar] [CrossRef] [Green Version]
Figure 1. Location of: (A) Heilongjiang province, (B) Harbin city, (C) sampling points.
Sustainability 14 08007 g001
Figure 2. Cd Anselin local Moran’s I analysis results.
Sustainability 14 08007 g002
Figure 3. Pb Anselin local Moran’s I analysis results.
Sustainability 14 08007 g003
Figure 4. Cd-trend analysis results.
Sustainability 14 08007 g004
Figure 5. Pb-trend analysis results.
Sustainability 14 08007 g005
Figure 6. Spatial distribution of Cd content in road dust in the main urban area.
Sustainability 14 08007 g006
Figure 7. Spatial distribution of Pb content in road dust in the main urban area.
Sustainability 14 08007 g007
Figure 8. Results of Cd high-value partition.
Sustainability 14 08007 g008
Figure 9. Results of Pb high-value partition.
Sustainability 14 08007 g009
Figure 10. Estimated probability of heavy metal Cd.
Sustainability 14 08007 g010
Table 1. Characteristics of heavy-metal elements in roads in the main urban area of Harbin.
ElementsMaxMinMeanMedianSDCVBackground 1Excess Rate
Cd (mg/kg)2.230.120.960.930.3940.96%0.0887.30%
Pb (mg/kg)132.0016.0081.1482.0023.7730.00%22.001.59%
PH9.316.627.837.660.627.89%8.00- 2
1 Background level of soil in China. 2 pH values are dimensionless; “-” means no screening value and, therefore, no excess rate.
Table 2. Global Moran’s index and K-S hypothesis test results for heavy-metal content.
ElementMoran’s IZ Valuep-ValueCorrelation
Cd0.1751.8820.060Weak
Pb0.3513.5680.000Moderate
Table 3. Results of Kolmogorov–Smirnov test.
Elementp-ValueTransformed p-ValueProbability Distributions
Cd0.0040.200Normal distribution
Pb0.200No transformedNormal distribution
Table 4. Optimal fitting model and parameters of variation function of heavy-metal content.
ElementModelC0C0 + CRangeC0/(C0 + C)R2RSS
CdSpherical0.0200.1761260 m0.8860.7851.848 × 10−3
PbExponential180703.8008220 m0.7440.93113,674
Table 5. Cross-validation results of heavy-metal content in road dust.
ElementMEMSERMSSE
Cd−0.011−0.0231.029
Pb0.053−0.0011.119
Publisher’s Note: MDPI stays neutral with regard to jurisdictional claims in published maps and institutional affiliations.

