Abstract
This study aims to contribute to more sustainable mobility solutions by proposing robust and actionable methods to assess the resilience of a multimodal transport system. Resilience is seen in a dynamic lean setting, looking at aspects in the network topology and user’s flow and demand throughout a parameterizable period. We hypothesize that this network’s appropriate multi-layered and traffic-sensitive modeling can promote the integrated analysis of different transport modes and support an improved resilience analysis. We operationalize the lean resilience conceptual construct with the proposed muLtImodal traNsportation rEsilience aSsessment (LINES) methodological process. Using the city of Lisbon as a study case, we illustrate the relevance of the proposed methodology to detect actionable vulnerabilities in the bus–tram–subway network.
1. Introduction
The need for effective and transparent coordination between different transport modes as a means to reduce congestion and failures in different streams has been increasingly seen as a necessary and effective answer to ongoing mobility changes [1]. To further understand the usage of multimodal transport, the inclusion of resilience assessment models offers a crucial perspective to improving our public services. This requires a quantitative assessment of robustness [2]. Resilience in this setting measures how the system recovers from fluctuations in transportation demand. However, there is a need to go beyond a monomodal robustness assessment. Thus, here, we focus on a method to assess the resilience of a transportation network with different modalities. In other words, we aim to address how to measure the resilience of a multimodal transport network covering several transport modes. This research aims to propose a method to assess the resilience of a multimodal transportation network. After an initial assessment of multimodal topological resilience [3], we move to a more dynamic view of traffic vulnerabilities. To this end, we propose the usage of spatio-temporal data statistics to understand the passenger traffic flows within a complex multimodal transportation network. The search for patterns aims to improve the management of different transportation modalities by providing non-trivial usage patterns to the knowledge base of the public transportation’s information system.
In this context, we focus on lean resilience [4,5]; this is defined as an agile, data-driven approach to actively reconfigure a system as a means to manage resilience continually. The concept of lean resilience is focused on integrating the resilience measurement process into a continuous paradigm of decision making, instead of a measurement based on sporadic events. This is an emerging trend of research since the COVID-19 and post-COVID-19 changes are felt abruptly in the world of transportation [6]. This concept has been previously introduced in the context of supply chain management. However, here, we apply lean resilience for the first time in the context of public transportation and define it analytically. Hence, based on previous literature—Rad et al. [6]—we define public transportation lean resilience as a measurement of resilience integrating passenger flow and transportation supply with continuous adaptability. This research operationalizes this conceptual construct with the proposed muLtImodal traNsportation rEsilience aSsessment (LINES) methodological process. The acronym reveals the primary focus of the proposal: measuring resilience on line segments of network models. Using the city of Lisbon as a study case, we illustrate the relevance of the proposed methodology to detect actionable vulnerabilities in the bus–tram–subway network.
This document is divided into five sections. After introducing the research context, state-of-the-art contributions on the subject are described in Section 2. Section 3 details the proposal of the method for resilience measurement. Section 4 instantiates the proposed method in the city of Lisbon. Section 5 synthesizes the main contributions, implications, and possible follow-up research directions.
2. Background
The concept of multimodality is central to this research, commonly defined as “the use of more than one transport mode to complete a trip” [7], the undertaken stance in this work. The concept of crossmodality can also be used as synonymous with multimodality.
According to Buehler and Hamre [8], multimodality is a sub-field of the intrapersonal variability of travel behavior, characterized by four dimensions: modal, purpose, spatial, and temporal nature.
Sustainable urban mobility planning is a central policy concept and methodological approach in Europe [9,10] with an impact on several UN Sustainable Development Goals. The primary objective is to increase sustainable urban accessibility and deliver high-quality, long-term mobility and transportation to, through, and within cities [11]. This is achieved by understanding and measuring system imbalances to avoid energy wasting and promoting more equitable transportation for all. The more interconnected and diversified the sustainable mobility alternatives are, the more efficient and resilient the transportation system as a whole can be [12].
Transport resilience is classically defined according to four main dimensions: robustness, redundancy, resourcefulness, and rapidity, all with significant effects on fewer repercussions, reliability, and a quicker recuperation [13]. The way that these dimensions are understood and measured has been a fairly active research theme. Multilayer networks offer a convenient abstraction to describe interconnected communication systems, such as multimodal transport infrastructures. This representation allows for a description of many interconnected communication systems, such as multimodal transport infrastructures. In this case, a node represents a stop or a station, and an edge represents a path between them. In this context, we may start by looking at key topological features, such as centrality [14,15] and connectivity [2], all suitable measures to characterize robustness and how the network can be affected by perturbations. From a dynamic perspective, using edge weights to represent passenger flow, the throughput, travel time [16], and weighted networks [17] that result from these measurements may also characterize resilience in terms of functionality. Additionally, there is a stance firstly introduced by Bruneau et al. [18] where resilience is characterized by a curve based on the time to recover from an initial degradation event. Figure 1 shows an example of a curve (from the original study) that characterizes resilience by measuring the size of the degradation in terms of the infrastructure impact.
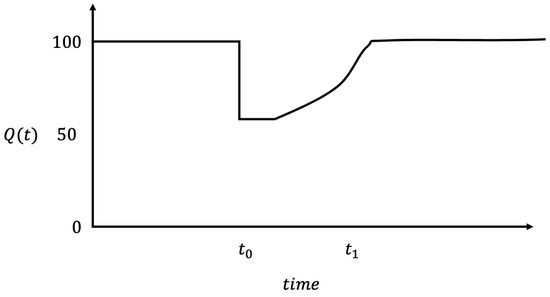
Figure 1.
Conceptual definition of measure of seismic resilience by Bruneau et al. adapted from [18]. This plot represents quality of infrastructure over time.
This stance originated the resilience triangle and the resilience index, later formalized by Reed et al. [19]. The resilience index in the context of a networked infrastructure can be calculated as
where is the system functionality between and . This index offers a generalization of the concept of resilience.
To understand the topological features that characterize the network and potentiate particular flow patterns, we look at assortativity and betweenness centrality. Assortativity means the attachment preference of the nodes in a network to other similar nodes. Similarity it can broadly refer to a specific set of characteristics referring to degree similarity; this property is commonly termed degree–degree correlation. Assortative mixing,
was mathematically defined by Piraveenan et al. [20], where is the standard deviation of the degree distribution, is the joint probability distribution of the remaining degrees of two nodes, k is the degree of a node, and
is the relationship between the degree distribution and the link distribution .
In this case, assortative behavior would correspond to stations with high degrees linked with other stations with high degrees, and disassortative would correspond to stations with high degrees linked with others with low degrees. Assortative behavior may lead to a high user flow in intermodal interchanges; for instance, since central stations may be only connected to one another.
Another important concept is betweenness centrality proposed by Linton Freeman [21],
which measures how important a node is in connecting communities of nodes. V is the set of nodes in the network, is the number of shortest paths in a network, and is the fraction that flows through the node v. A high betweenness centrality means that that node is an important bridge between communities, and, literally, it means the percentage of shortest paths in the network flow through that node. A high value for edge betweenness centrality may be a good indicator that the traveler flow will be high in that particular line segment.
To answer the need for measuring the resilience of networks, Klau and Weiskircher [22] noted that a network should be considered resilient if it sustains a high number of node failures before it turns disconnected. In that sense, performing node percolation tests is a way to measure resilience. Measuring this property in transport networks has been the focus of several studies. Sulivan et al. [23] have evaluated system-wide robustness by finding critical isolating links in road networks. They reduced the link capacity and measured the travel time as a means of measuring robustness. This allowed for a dynamic perspective as well. Later on, Zhou et al. [24] developed a similar study but induced vulnerabilities by blocking lanes instead, same as deleting an edge, which ranked the links by how critical they were, building upon the much earlier work that did just that [25].
The previously mentioned studies were highly related to the earlier study of reliability performed by Chen et al. [26], where the demand change gives the reliability of networks based on models of the route choice. This study extended the capacity reliability to network equilibrium models, as well as taking into account the route choice actions of drivers. Later on, Al-Deek and Eman [27] measured the reliability by the network capacity and travel time by changing the demand and inducing link degradation and non-persistent congestion. Previous studies are, in fact, critical because they showed how different demand levels affect the capacity reliability in an analytical way. It is important to note that reliability is fundamentally different from resilience. Reliability usually measures the interruption of service. Resilience, on the other hand, measures the ability to recover from such an interruption in service [28]. The importance of the study of system resilience increases due to the limited ways that systems are either successful or failed in a binary view of reliability and system efficiency.
A study of network resilience has also been conducted in the context of multimodal transport. Montes-Orozco [29] recently showed that the same idea of percolation could be used in multiplex networks. This notion opens this test for the world of multimodal transport network resilience.
Another view on resilience measurement on multimodal transport networks is given by Bocewicz [30], who postulates that a whirlpool network structure on a multimodal transport network leads to a cyclic steady state, unlike a tree structure. A whirlpool state is one that points towards another, and the following states recursively point to the following until they complete a circle. Then, the measurement of robustness is given by the ratio of states in a whirlpool structure and the total number of states in the multimodal transport network.
Besides a simpler network structure resilience test, a dynamic measurement of such a property has also been studied in multimodal urban transport. Stamos et al. [31] studied resilience to extreme weather events (EWE) in several European cities by measuring the percentage change during the EWE. Then, this could be used for prediction tasks by using past rail, air, and road usage data. However, this method was lacking in terms of actionable information because prevention is only attainable if we know where to act. Later on, Cats et al. [32] defined a framework to assess robustness. This helped the description of robustness assessment as an economic problem. This kind of assessment is very relevant for this study because it provides a baseline for understanding the impact of different disruption scenarios in specific links, quantifying the criticality. This is a type of assessment that provides specific enough data to be actionable in the real world.
Recently, Chen et al. [33] proposed new strategies to optimize a transport network structure, considering not only the cascade impacts of disturbances but also the simulated ability to repair from those disturbances. The accessibility and percentage of unaffected passengers are guiding criteria for the resilience assessment in this study. This research was followed with an effective betweenness centrality metric [34] able to disruptively incorporate the traveler’s path choice and travel time into the resilience assessment. In contrast with our work, capacity shortages are not considered, with the focus being placed on establishing time-invariable measurements of the criticality of the components of a transport network.
3. Materials and Methods
This work aims to objectively model and assess the resilience of a multimodal transportation system. This proposal is unique since it focuses on analyzing resilience based on usage data in a network-bounded way using a lean resilience measurement along modal–spatial–temporal–behavioral dimensions. We have seen that resilience is relevant since it is a stepping stone to minimizing the impact of vulnerabilities in the system caused by usage patterns or other disturbances such as natural disasters. By understanding the patterns of users’ flows and topological characteristics that weaken the system, we can plan better strategies to avoid and mitigate negative impacts. In this sense, we used a network representation to capture dynamic aspects, such as demand over time. The search for patterns in such a network allows for assessing the resilience of the network, both in responding to variations in demand and identifying vulnerabilities. To further understand how to adapt the current transportation systems to yield a better multimodality resilience, we combined the outputs from previous research works [3,4] to assess the resilience of the system with the available topological and usage information. This section describes a methodology that is able to address these challenges. Figure 2 presents the main components of the LINES process. The modeling and assessment phases have an impact on finding actionable patterns.
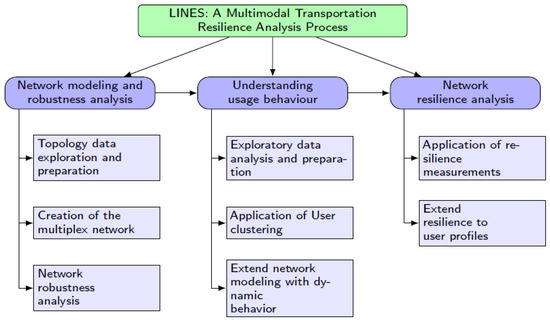
Figure 2.
Interconnectivity of each component of the LINES process for assessing the resilience of a multimodal transportation system using a work breakout structure (WBS) diagram.
3.1. Network Modeling and Robustness Analysis
To understand the structure of the multimodal transport network and how robust it is, a first methodological set of activities related to network science are proposed:
- Topology data exploration and preparation. This step involves the network topology inference based on each transport mode or operator’s network (GTFS) data. This includes calculating distances between stations and how the different layers connect to one another. To this end, we used the length of the pathways for intra layer distances and used geographic map distance for inter layer distance. This later distance was used to measure the length of intermodal interfaces.
- Creation of the multiplex network. Using the data prepared in the previous step, we could build the computational representation of the network. This allowed us to further understand how the network is structured. This step also includes meaningful data exploration, possibly comprising the visualization of a network map and the inference of network statistics. In this step, we understood the key features of the network.
- Network resilience testing and assessment. In this step, we tested different attack strategies described in previous literature [35]. A previous study was carried out detailing this activity [3].
3.2. Understanding Usage Behavior
Having understood the topological features of the data, we moved to another pivotal component of this methodology: discovering mobility patterns in the multiplex transportation network. We subdivided this task into the following steps:
- Exploratory data analysis and preparation. This step involves the exploration of the set of validations we have for CARRIS and METRO and possibly other transportation modalities. This is where we made key decisions involving missing data imputation and applied data mappings and feature extraction for more conducive pattern analysis in the subsequent steps. By the end of this stage, we developed a further understanding of the mobility patterns and expect to have mitigated different problems inherent to the data.
- Application of user clustering. Former variants of clustering algorithms were developed in the context of public transport data to understand user behavior [36,37,38,39]. Here, we aimed to understand what demand could be expected depending on the generated traveler profiles. The actionability of user profiles discovered along this stage should be validated with mobility experts. The clustering of users was carried out based on agglomerative hierarchical clustering of the spatiotemporal movements of the user. In its simpler form, each user and aggregated profile were given by time-series with hourly frequency of smart card validations. [4]
- Extend network modeling to capture dynamic behavior. Taking advantage of the network modeling in the first component of the methodology, we represented the spatial distribution of user demand decomposed according to clusters of user types. This promotes the understanding of the spatio-temporal nature of demand.
3.3. Network Resilience Analysis
The aggregation of previous results is key for further actionability. In this context, understanding how resilience is measured and how it is connected to the previous steps is of high importance. In particular, the study of flow dynamics of the travelers in the network is of interest in this step. As such, we proposed the following steps:
- Application of resilience measurements. In this step, we extended the previous results to include resilience analysis and the characterization of the transportation network in terms of its vulnerabilities in a dynamic way. In the context of our work, we instantiated as the ratio between the transportation demand and supply. The proposal of this section is to instantiate the concept of lean resilience on a network-bounded representation. We defined lean resilience aswhere the time intervals are based on the granularity of discrete demand and supply measurements. Since this concept is based on continuous measurements, it makes sense to measure it regardless of accidents or delays because we look at how the system recovers from demand.This metric was calculated per each edge belonging to the network modeled. However, since it is quite hard to estimate the capacity of intermodal interfaces, and we have no data regarding that, we did not calculate the lean resilience of those edges.
- Extending resilience to user profiles to further aid actionability. Having applied and explained the mobility patterns inherent to the multimodal transportation system, the subsequent knowledge transfer is crucial to bring more relevance to this work. By explaining the vulnerabilities in the supplied capacity vs. demand, we can assist the decision-making process.
3.4. Evaluation of Resilience
When the transport can recover from the overdemand of users, the transportation is seen as lean resilient. Thus, we measured lean resilience based on the centrality and the equilibrium between the transportation supply and the demand for the transportation. This was quantified with the resilience index as defined by Reed et al. [19]. Considering Equation (1) in Section 2, measure R as the ratio between the demand and the supply () for transportation in a defined time period () using a data-driven approach by measuring the smart card validations and estimating supply levels. The result of this approach is a better prescription of resilience in the context of multimodal networks.
4. Results
Following the modeling of Lisbon’s multimodal transportation network in the previous research [3], this next section focuses on applying the dynamic information on the networks. Below is the representation of the modeled network, including several transport modalities (Figure 3).
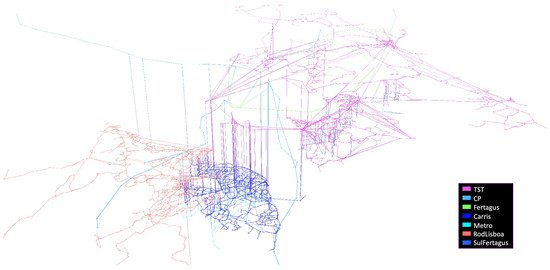
Figure 3.
Multilayer transport network topology of the Lisbon metropolitan area (LMA) on a 3D representation with all of the layers.
4.1. Extend Network Modeling with Dynamic Behaviour
This section explores the dynamics of the modeled network (Figure 3) using smart card data described in the previous section. Based on the origin–destination (OD) mapping developed by Cerqueira et al. [40], we mapped the origin and destination of each user and find the geographical shortest path within the pre-existing lines from one station or stop to another. Using this method, we weighted METRO and CARRIS networks with the number of users that go through each pathway (edge in the graph) at every hour of the day.
In Figure 4, we see the user demand in two of the 24 time-spans of the day, at 9 A.M. and 5 P.M. on a typical Tuesday. The generated weighted digraphs show a heavy flow of users towards the city center at 9 A.M. A high flow of users are going towards stations such as Marquês de Pombal, Picoas, Saldana, and São Sebastião. There is an apparent cumulative effect that happens within the line that causes congestion within some regions of the network, such as from Campo Grande to Picoas. On the extremities of the network, we see a much lower flux of users. In some cases, we see a relatively balanced number of users flowing both ways, such as the Alameda–Martim Moniz pathway and the Oriente–Chelas pathway. On the 5 P.M. weighted graph, we see the inverse pattern. Users are traveling outwards from the city center, and many of them are traveling from stations outlined before.
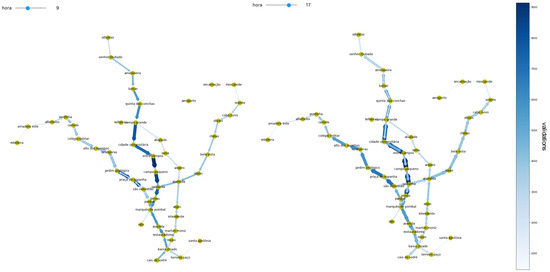
Figure 4.
METRO user demand throughout the network on 10 October 2019 at 9 A.M. on the left and 5 P.M. on the right.
This principled analysis may be extended with the average or median values along certain periods, such as a month. In this work, we show the flow of users in a single day, so we can later understand how the network is able to handle the users on a particular day. This is important since not all days have the same service levels, and the variation may have a high impact on the information that we perceive.
Following the different user mobility profiles devised in previous research [4], we can then associate these profiles with the network data. The method used to generate these clusters considers the number of user-specific card validations every hour, turning user profiles into time-series. Then, we applied a cross correlation distance with an agglomerative hierarchical clustering method and, in accordance with silhouette analysis, selected four predominant clusters. In Figure 5, we see the example of a user profile with two users that use METRO at similar hours.
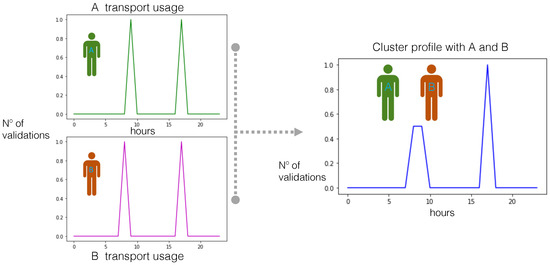
Figure 5.
Hypothetical usage cluster profile generation with transport users A and B.
Now, looking at the geographic distribution of the users by profile (Figure 6), we see that the line occupation of these users is considerably similar within this network. This is understandable since only the timestamps associated with smart card validations were considered, not explicitly capturing the spatial extent of the network usage. However, is this profiling more informative for service resilience? This is the focus of the next section.
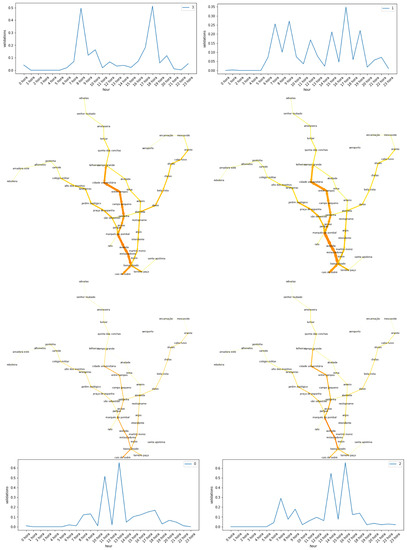
Figure 6.
Aggregated METRO user demand, according to profile throughout the network.
In terms of CARRIS usage (Figure 7), we find a much more complex network with many nuances in terms of passenger traffic flows differences between 9 A.M. and 5 P.M. At a higher-level analysis, we can see that the southern riverfront lines have the highest flows, and the magnitude of variation in user occupation is much higher in this mode, even though the total occupation per pathway is much lower. This is perceivable since METRO carriages can hold more people than CARRIS buses.
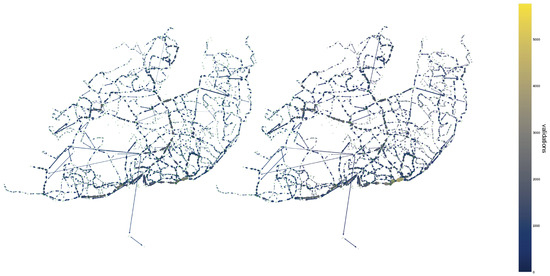
Figure 7.
CARRIS user demand throughout the network on the 10 October 2019 at 9 A.M. on the left and 5 P.M. on the right.
In this section, we have extended the classical resilience stances to incorporate the dynamic passenger behavior and its spatial distribution along with the network structure. With the generated data, we were able to better understand the passenger traffic flows on the network throughout the day. In this section, we aim to measure the resilience of a multimodal transportation system. Nevertheless, to measure the network’s resilience to demand changes, we need to measure the dynamics of the network transportation supply. Thus, we might ask if the supply for transportation is keeping up with the demand and what consequences the lack of equilibrium entails.
4.2. Application of Resilience Measurements
Having the schedule, we used the CARRIS official website for information regarding the fleet that is being used. The calculations were made based on the standard MAN 18.310 HOCL-NL bus since we had no further information regarding the bus type distribution. This is the most common bus type and is about the average capacity, with a maximum occupancy of 76 passengers. The highest possible occupancy is 155 passengers on the articulated kind and the lowest is 27 on the minibusses. Nevertheless, the occupancy numbers may greatly vary depending on safety measures imposed by COVID-19 restrictions. In this case, we used the schedule values for 2019 since the 2020 occupancy values are not representative of a typical year due to the lockdown and the civil emergency state [41]. Figure 8 depicts the CARRIS network, and the weighted edges represent the paths that each route has to go through. This was inferred based on the stop times, which allow us to know the progression of stops for each specific route (including the temporary buses). Since the nature of these data is spatio-temporal, we used two distinct hourly time-spans: 9 A.M. and 5 P.M.
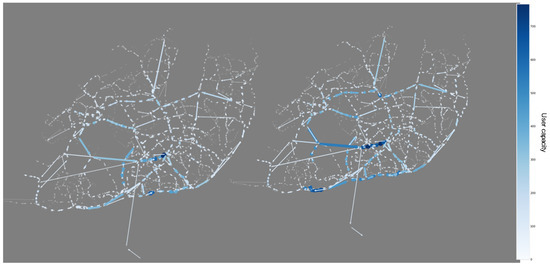
Figure 8.
CARRIS supply on the 10 October at 9 A.M. on the left and 5 P.M. on the right.
Complementary to the attained demand views, the weighted graph regarding the supply levels was calculated using the schedule with hourly granularity. Routes were calculated based on the succession of stations of each passage. Moreover, the weight of the segments of the graph that belong to the route was incremented with the vehicle capacity. This process was performed iteratively through the complete schedule. The representation of the weighted graph uses hue and line thickness, according to the segment’s weight, to accentuate the value and priority level of the segments.
Now, looking at the supply levels for CARRIS (Figure 8), we see higher supply levels for 5 P.M. than for 9 A.M. Most of the pathways support 100 passengers or less (per hour), possibly due to traffic constraints. However, these segments may be more susceptible to variations in demand. The planning seems to be congruent with the demand in many cases. For instance, the city center’s inward flow from Ponte 25 de Abril is prioritized in the morning and the outward flow in the afternoon.
Figure 9 shows resilience levels that are between 0 and 2 in most line segments. However, the demand is eight times higher than the supply in certain segments. We can see examples of this undesirable imbalance between the stations Marquês de Pombal and Av. Duque de Loulé, as well as Pina Manique and Cruz das Oliveiras. This may be due to a low tolerance to variance driven by a low bus frequency. However, the model assumes the provision of standard buses, and these segments may nevertheless be supplied with high-capacity buses.
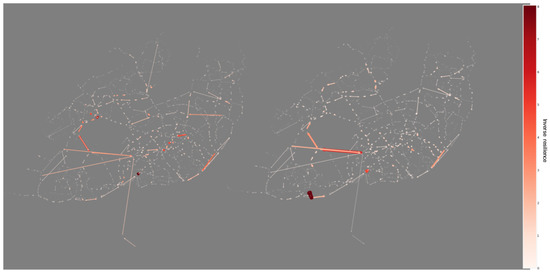
Figure 9.
CARRIS lean resilience using supply and demand on the 10 October at 9 A.M. on the left and 5 P.M. on the right.
We applied an analogous technique to the METRO network; however, we used the average carriage values that have much less variance. A carriage has, on average, approximately a maximum occupancy of 170 passengers, using the official METRO website data [42]. We also assumed a length of three carriages, totaling a 510 maximum occupancy. These assumptions were made since we were unable to obtain more detailed data.
The METRO supply levels seem identical at both periods (9 A.M. and 5 P.M.), see Figure 10. This may be adequate if the transport demand and user needs are similar at those hours. However, as we have seen, that is not the case, so this may be an indication of low resilience in the afternoon. The red line, Aeroporto to São Sebastião, also seems to have an exceptionally low level of service.
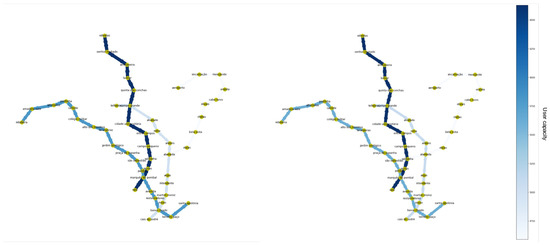
Figure 10.
METRO supply on the 10 October of 2019 at 9 A.M. on the left and 5 P.M. on the right.
The day of October 15 was selected as the day for this analysis due to the fact that it has perturbations reported by the metro users in all lines at 9 A.M., along with a train breakdown. Below, Figure 11 shows the reports from https://perturbacoes.pt [43]. This is important since it can give us a better understanding of where the failures may impact the transport users. In this context, this is adequate since we want to measure the resilience towards demand change. The metro system works with disturbances and we want to measure the ways in which it deals with the cumulative effect of demand from travelers from several hours.
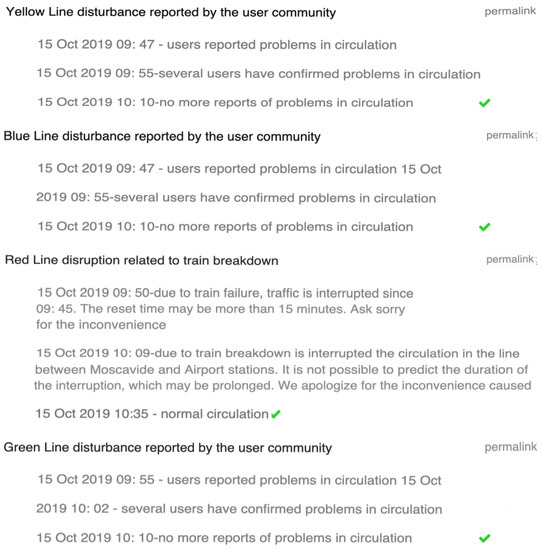
Figure 11.
METRO line incidents along all four lines: Yellow (Amarela), Blue (Azul), Red (Vermelha), and Green (Verde).
For the METRO lean resilience, Figure 12 discloses the ratio of user demand per service supply. Thus, the value of 1 means that the system has reached its full capacity in that particular network line segment. The left plot for 9 A.M. shows us that the service inwards to the city center is being overcrowded in particular segments, such as Entrecampos–Picoas and Jardim Zoologico–São Sebastião. Interestingly, the red line (Aeroporto to São Sebastião) has a high occupancy between Cabo Ruivo and Saldanha. However, the flow of users is fairly low on this line, which may be explained by the perturbation and the lowest level of service in the METRO. The 9 P.M. service levels, on the other hand, have even higher vulnerability levels than in the morning. Nevertheless, there are no reported incidents for this hour and day. This means that even with incidents in the morning in all lines, the afternoon demand–supply equilibrium is worse in the afternoon regular operation. This means that the levels of service need to be reinforced even in normal conditions. There is a clear pattern of outwards mobility from the city center with high congestion in the same zones and, yet again, an aggravated effect on the red line from Saldanha to Oriente. Even though the information in this document is static, we can easily transpose this to a real-time monitoring system that shows the over-demanded segments thorough the day, outputting a representation similar to the left graph on Figure 12, which highlights the low resilience links. This would bring further actionable information.
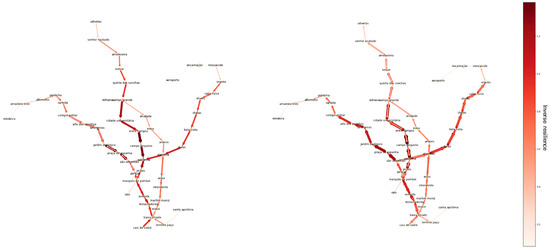
Figure 12.
METRO lean resilience using supply and demand on the 15 October 2019 at 9 A.M. on the left and 5 P.M. on the right.
4.3. Extending Resilience to User Profiles
Previously, we motivated the relevance of clustering passengers into different behaviors. The mobility profiles have different impacts on the network depending on the hours when each user uses the network and where they are. This means that even if there are few users of a particular type, the network may be less resilient to that particular demand. Below, we look at the different profiles and the lean resilience for each cluster of users. To produce these representations, we calculated the paths of users per cluster (based on the shortest path considering the pre-existing routes) and weighted the edges of the network based on the accumulated demand–supply ratio over an hourly basis. To understand the resilience towards a certain user (a user-centered resilience) behavior type, we used the sub-samples obtained from the clustering solution and weighted the edges based on the ratio of demand for the supply levels of a particular hour.
Figure 12 shows the lean resilience of all users at two particular timestamps, whereas Figure 13, Figure 14, Figure 15 and Figure 16 show the resilience of each particular user profile at 9 A.M.. This leads to significant differences due to the cumulative effect of users and the absence of normalization per visualization.
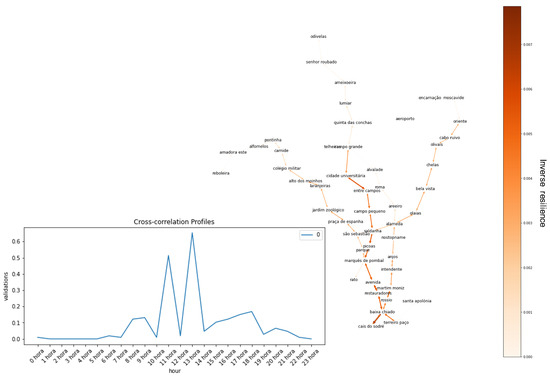
Figure 13.
METRO lean resilience to users cluster 0—Lunch time commuters.
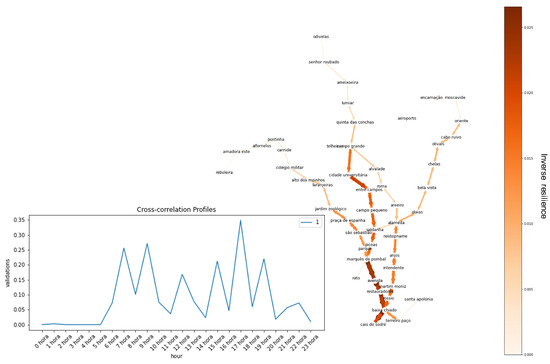
Figure 14.
METRO lean resilience to users cluster 1—Long workday commuters.
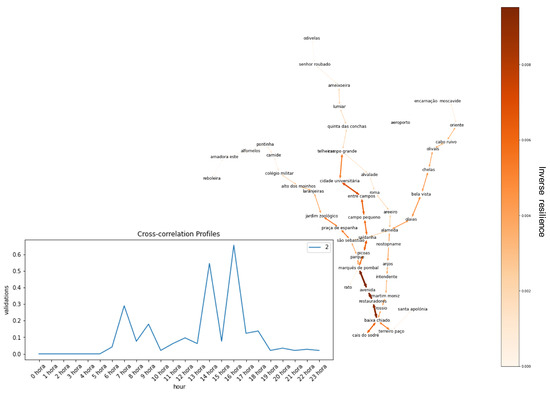
Figure 15.
METRO lean resilience to users cluster 2—part-time workday commuters.
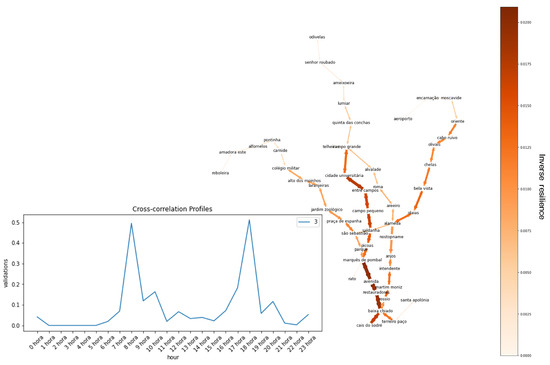
Figure 16.
METRO lean resilience to users cluster 3, 9-to-5 workday commuters.
The usage profile from cluster 0 is interpreted as “lunchtime commuters”. These exert more pressure on the system in the city center, particularly from Saldanha to Cais do Sodré and between Entrecampos and Cidade Universitária.
The usage profile from cluster 1, capturing long workday commuters, exerts higher overall stress levels on the system than user profile 0, for example. However, this is expected since the cardinality of users is considerably different. There is a lot of stress from Marquês de Pombal to Cais do Sodré and moderate levels in the pathways: Jardim Zoológico–Marquês de Pombal, Baixa Chiado–Alameda, and Alameda Oriente.
Cluster 2, previously understood as part-time workday commuters with shifted intervals, has strains along the Marquês de Pombal–Baixa Chiado pathway and generates medium strain levels from the city center to Laranjeiras, Campo Grande, and Oriente.
Lastly, users belonging to cluster 3 have a considerable presence in all lines, particularly from Campo Grande to Terreiro do Paço, with noticeable presence in Olivais to Alameda, Collegio Militar to São Sebastião, and Alameda to Cais do Sodré.
It is clear that, at this moment, there could be some incentives to alleviate the strain on transport by increasing the level of transport by the number of the demand–supply ratio achieved from this analysis. This could be achieved by vehicles with a higher capacity, higher frequency, or even a mixture of both. Another solution could be incentivizing the flow of users towards off-peak hours. This latter strategy can be achieved by implementing a gamification system that assigns usable points for good behavior, like in other smart city gamification systems [44]. This could also be integratively solved with the aid of alternative modes of transportation. It is important to note that, if incentives for adopting other transport modes are the desired solution, the strain of the target modes must be considered. Using a multimodal approach to transportation, we could induce transport users to shift to less-used modes by assigning points as incentives to change modal preferences that could be used for monthly fare discounts, for instance. The use of past and current data could be used to generate agent-based systems to decide under those circumstances [45]. The study of these incentives and the implementation of similar techniques to the ones used in this research yield interesting opportunities. These studies could answer questions such as: What incentives may be qualified as worthy? Can we model commuters based on data-driven behavior? Did the mobility profiles change after the application of incentives? Did the pathways become less strained after incentives?
To understand the fragility of the METRO and CARRIS networks, we rely on two perspectives: (1) a dynamic perspective, by identifying the low resilience links, and (2) a static perspective, the critical nodes (in case of layers). When comparing them side by side (in Figure 17 and Figure 18), on the left, we see the number of times each segment exceeded capacity throughout the day (these are regarded as low resilience since they were not resilient to user demand), and, on the right, we see the betweenness centrality of each edge.
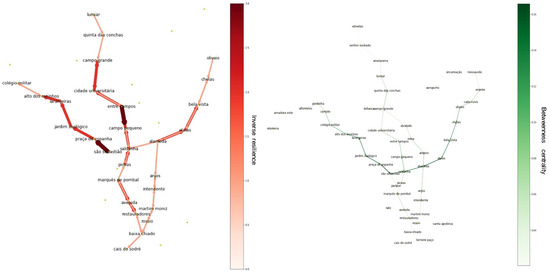
Figure 17.
METRO low resilience links in accordance with demand supply dynamics on the left and topological criticality on the right in accordance with betweenness centrality.
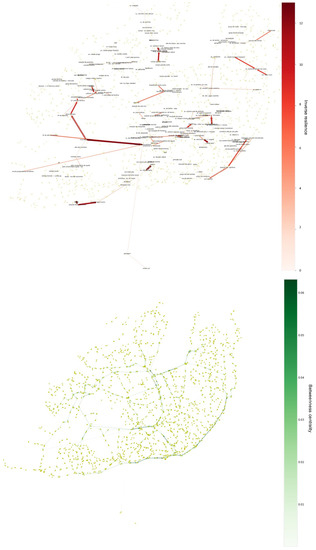
Figure 18.
CARRIS low resilience links on the left and topological criticality on the right.
We see that the betweenness centrality is important to understand the robustness impact. Nevertheless, without a data-driven perspective, this metric is insufficient to discern usage patterns. Although most of the pathways that exceeded the user capacity do not have a particularly high betweenness, there seems to be a positive relationship in the southwest part of the city in CARRIS (Figure 18). In METRO (Figure 17), this relationship is fairly evident in parts of the blue and red lines: São Sebastião to Alto dos Moinhos and Alameda to Boa Vista. Nevertheless, we see that resilience is mainly caused by the dynamic usage features. It emerges not only because of topology and cumulative effects but also because of a lack of equilibrium between the supply and demand in particular time frames (i.e., a low lean resilience). A good example of this is the yellow line (Odivelas to Rato) and the southern part of the blue line (Marquês de Pombal–Baixa Chiado), which have no station with a particularly high betweenness centrality but have a low resilience, according to the usage intensity. Still, it is important to note that edges with a very low betweenness centrality have high levels of lean resilience since they are not subject to the cumulative effect of the demand variation from other parts of the network.
5. Conclusions and Future Works
This study proposed an integrated view of multimodal public transport demand from consolidated smart card data validation to model actionable spatio-temporal mobility patterns.
The notion of transport supply was also introduced and modeled on a weighted network based on the schedule and data of the vehicles used by the two transportation layers. This allowed for a better understanding of the transport service levels during all-day periods. To contribute to the body of work regarding resilience measurements, we introduced the construct of lean resilience in public transportation and defined it analytically. This is distinct to current resilience measurements as it assesses the way levels of service recover from different fluctuations of traveler demand throughout the day. Complementarily to organic fluctuations and those motivated by externalities (e.g., large-scale gatherings), this analysis is of significant relevance to further study the patterns of failure of supply of service.
To assess the resilience of a multimodal transportation system, we applied the lean resilience metric on an hourly basis based on the equilibrium between the demand and supply of service. This allowed us to conclude that the network’s resilience is not only dependent on the topological features, such as the betweenness centrality, but a data-driven approach is also essential to understanding the user behavior.
The strain of different types of users on the network service was analyzed, yielding somewhat different results for each user type. This is important because different mobility patterns are observed along the same network paths with varying service levels throughout the day. It implies that the differentiation of user profiles can be induced to improve the distribution of users during off-peak hours. Gamification techniques are discussed as a possible future driver to motivate the shift of users between different transportation profiles. These techniques are yet to be tested in the city of Lisbon, yet offer a promising research direction to manage traveler flows sustainably. The generated resilience graphs for the city of Lisbon public transport aim to improve the lean resilience of the transport towards demand variation using real-time data. These can reproduce accurate representations regarding the absorbability of users in the system, an essential requirement toward lean resilience. The proposed approach is extensible to other cities and geographical locations since the only requirements are a model of the (multimodal) network together with the vehicle capacity and validation usage data, standard requirements for transport systems that comply with general transit feed specification and rely on automated fare collection (AFC) systems. Some challenges lie in managing massive AFC data, scalability needs, and real-time analytics. Regarding transport resilience measurements, complementary dimensions to lean resilience are expected to be further integrated into future research.
Author Contributions
Conceptualization, J.T.A.; Methodology, J.T.A.; Software, J.T.A.; Supervision, E.A. and R.H.; Validation, E.A.; Visualization, J.T.A.; Writing—original draft, J.T.A.; Writing—review & editing, F.C.S. and R.H. All authors have read and agreed to the published version of the manuscript.
Funding
This work is supported by national funds through Fundação para a Ciência e a Tecnologia (FCT) under project ILU (DSAIPA/DS/0111/2018), INESC-ID pluriannual (UIDB/50021/2020), and J.T.A. PhD grant supported by FCT and INESC-ID. F.C.S. also acknowledges the FCT grants PTDC/MAT-APL/6804/2020 and PTDC/CCI-INF/7366/2020.
Institutional Review Board Statement
Not applicable.
Informed Consent Statement
Not applicable.
Data Availability Statement
Software available at GitHub. Raw smart card data access subjected to NDA agreement.
Acknowledgments
The authors want to thank Câmara Municipal de Lisboa, CARRIS and METRO for data provision, support, and valuable feedback.
Conflicts of Interest
The authors declare no conflict of interest.
References
- Basu, R.; Ferreira, J. Sustainable mobility in auto-dominated Metro Boston: Challenges and opportunities post-COVID-19. Transp. Policy 2021, 103, 197–210. [Google Scholar] [CrossRef]
- Zhang, X.; Miller-Hooks, E.; Denny, K. Assessing the role of network topology in transportation network resilience. J. Transp. Geogr. 2015, 46, 35–45. [Google Scholar] [CrossRef]
- Aparicio, J.T.; Henriques, R.; Arsénio, E. Assessing Robustness in Multimodal Transportation Systems: A case study in Lisbon. In Proceedings of the European Transport Conference 2021, Online, 13–15 September 2021. [Google Scholar]
- Aparicio, J.T.; Henriques, R.; Arsénio, E. Advances in the spatio-temporal profiling of public transport users in the city of Lisbon. In Proceedings of the Transport Research Arena 2022, Lisbon, Portugal, 14–17 November 2022. [Google Scholar]
- Ivanov, D. Lean resilience: AURA (Active Usage of Resilience Assets) framework for post-COVID-19 supply chain management. Int. J. Logist. Manag. 2021. [Google Scholar] [CrossRef]
- Habibi Rad, M.; Mojtahedi, M.; Ostwald, M.J. The integration of lean and resilience paradigms: A systematic review identifying current and future research directions. Sustainability 2021, 13, 8893. [Google Scholar] [CrossRef]
- Diana, M.; Pirra, M. A comparative assessment of synthetic indices to measure multimodality behaviours. Transp. A Transp. Sci. 2016, 12, 771–793. [Google Scholar] [CrossRef]
- Buehler, R.; Hamre, A. An examination of recent trends in multimodal travel behavior among American motorists. Int. J. Sustain. Transp. 2016, 10, 354–364. [Google Scholar] [CrossRef]
- Arsenio, E.; Martens, K.; Di Ciommo, F. Sustainable urban mobility plans: Bridging climate change and equity targets? Res. Transp. Econ. 2016, 55, 30–39. [Google Scholar] [CrossRef]
- Buhrmann, S.; Wefering, F.; Rupprecht, S. Guidelines for Developing and Implementing a Sustainable Urban Mobility Plan, 2nd ed.; Rupprecht Consult-Forschung und Beratung GmbH: Koln, Germany, 2019. [Google Scholar]
- European Commission. A concept for sustainable urban mobility plans. In Annex to the Communication from The Commission to the European Parliament, the Council, the European Economic and Social Committee and the Committee of the Regions Together towards Competitive and Resource-Efficient Urban Mobility COM; European Commission: Brussels, Belgium, 2013; Volume 913. [Google Scholar]
- Wefering, F.; Rupprecht, S.; Bührmann, S.; Böhler-Baedeker, S. Guidelines. Developing and implementing a sustainable urban mobility plan. In Proceedings of the Workshop, Scottsdale, AZ, USA, 2–4 May 2013; p. 117. [Google Scholar]
- Sun, W.; Bocchini, P.; Davison, B.D. Resilience metrics and measurement methods for transportation infrastructure: The state of the art. Sustain. Resilient Infrastruct. 2020, 5, 168–199. [Google Scholar] [CrossRef]
- Cheng, Y.Y.; Lee, R.K.W.; Lim, E.P.; Zhu, F. Measuring centralities for transportation networks beyond structures. In Applications of Social Media and Social Network Analysis; Springer: Berlin/Heidelberg, Germany, 2015; pp. 23–39. [Google Scholar]
- Kim, H.; Anderson, R. An experimental evaluation of robustness of networks. IEEE Syst. J. 2013, 7, 179–188. [Google Scholar] [CrossRef][Green Version]
- Fotouhi, H.; Moryadee, S.; Miller-Hooks, E. Quantifying the resilience of an urban traffic-electric power coupled system. Reliab. Eng. Syst. Saf. 2017, 163, 79–94. [Google Scholar] [CrossRef]
- Mohmand, Y.T.; Wang, A. Weighted complex network analysis of Pakistan highways. Discret. Dyn. Nat. Soc. 2013, 2013, 862612. [Google Scholar] [CrossRef]
- Bruneau, M.; Chang, S.E.; Eguchi, R.T.; Lee, G.C.; O’Rourke, T.D.; Reinhorn, A.M.; Shinozuka, M.; Tierney, K.; Wallace, W.A.; Von Winterfeldt, D. A framework to quantitatively assess and enhance the seismic resilience of communities. Earthq. Spectra 2003, 19, 733–752. [Google Scholar] [CrossRef]
- Reed, D.A.; Kapur, K.C.; Christie, R.D. Methodology for assessing the resilience of networked infrastructure. IEEE Syst. J. 2009, 3, 174–180. [Google Scholar] [CrossRef]
- Piraveenan, M.; Prokopenko, M.; Zomaya, A.Y. Local assortativity and growth of Internet. Eur. Phys. J. B 2009, 70, 275–285. [Google Scholar] [CrossRef]
- Freeman, L.C. A set of measures of centrality based on betweenness. Sociometry 1977, 40, 35–41. [Google Scholar] [CrossRef]
- Klau, G.W.; Weiskircher, R. Robustness and resilience. In Network Analysis; Springer: Berlin/Heidelberg, Germany, 2005; pp. 417–437. [Google Scholar]
- Sullivan, J.L.; Novak, D.C.; Aultman-Hall, L.; Scott, D.M. Identifying critical road segments and measuring system-wide robustness in transportation networks with isolating links: A link-based capacity-reduction approach. Transp. Res. Part A Policy Pract. 2010, 44, 323–336. [Google Scholar] [CrossRef]
- Zhou, Y.; Wang, J. Critical link analysis for urban transportation systems. IEEE Trans. Intell. Transp. Syst. 2017, 19, 402–415. [Google Scholar] [CrossRef]
- Scott, D.M.; Novak, D.C.; Aultman-Hall, L.; Guo, F. Network robustness index: A new method for identifying critical links and evaluating the performance of transportation networks. J. Transp. Geogr. 2006, 14, 215–227. [Google Scholar] [CrossRef]
- Chen, A.; Yang, H.; Lo, H.K.; Tang, W.H. Capacity reliability of a road network: An assessment methodology and numerical results. Transp. Res. Part B Methodol. 2002, 36, 225–252. [Google Scholar] [CrossRef]
- Al-Deek, H.; Emam, E.B. New methodology for estimating reliability in transportation networks with degraded link capacities. J. Intell. Transp. Syst. 2006, 10, 117–129. [Google Scholar] [CrossRef]
- Clark-Ginsberg, A. What’s the Difference between Reliability and Resilience; Stanford University: Stanford, CA, USA, 2016. [Google Scholar]
- Montes-Orozco, E.; Mora-Gutiérrez, R.A.; Obregón-Quintana, B.; de-los Cobos-Silva, S.G.; Rincón-García, E.A.; Lara-Velázquez, P.; Gutiérrez-Andrade, M.A. Inverse Percolation to Quantify Robustness in Multiplex Networks. Complexity 2020, 2020, 8796360. [Google Scholar] [CrossRef]
- Bocewicz, G. Robustness of multimodal transportation networks. Eksploat. I Niezawodn. 2014, 16, 259–269. [Google Scholar]
- Stamos, I.; Mitsakis, E.; Salanova, J.M.; Aifadopoulou, G. Impact assessment of extreme weather events on transport networks: A data-driven approach. Transp. Res. Part D Transp. Environ. 2015, 34, 168–178. [Google Scholar] [CrossRef]
- Cats, O.; Koppenol, G.J.; Warnier, M. Robustness assessment of link capacity reduction for complex networks: Application for public transport systems. Reliab. Eng. Syst. Saf. 2017, 167, 544–553. [Google Scholar] [CrossRef]
- Chen, J.; Liu, J.; Peng, Q.; Yin, Y. Strategies to enhance the resilience of an urban rail transit network. Transp. Res. Rec. 2022, 2676, 342–354. [Google Scholar] [CrossRef]
- Chen, J.; Liu, J.; Peng, Q.; Yin, Y. Resilience assessment of an urban rail transit network: A case study of Chengdu subway. Phys. A Stat. Mech. Its Appl. 2022, 586, 126517. [Google Scholar] [CrossRef]
- Holme, P.; Kim, B.J.; Yoon, C.N.; Han, S.K. Attack vulnerability of complex networks. Phys. Rev. E 2002, 65, 056109. [Google Scholar] [CrossRef]
- Ma, X.; Liu, C.; Wen, H.; Wang, Y.; Wu, Y.J. Understanding commuting patterns using transit smart card data. J. Transp. Geogr. 2017, 58, 135–145. [Google Scholar] [CrossRef]
- Kung, K.S.; Greco, K.; Sobolevsky, S.; Ratti, C. Exploring universal patterns in human home-work commuting from mobile phone data. PLoS ONE 2014, 9, e96180. [Google Scholar] [CrossRef]
- He, L.; Agard, B.; Trépanier, M. A classification of public transit users with smart card data based on time series distance metrics and a hierarchical clustering method. Transp. A Transp. Sci. 2020, 16, 56–75. [Google Scholar] [CrossRef]
- Ghaemi, M.S.; Agard, B.; Trépanier, M.; Partovi Nia, V. A visual segmentation method for temporal smart card data. Transp. A Transp. Sci. 2017, 13, 381–404. [Google Scholar] [CrossRef]
- Cerqueira, S. Integrative Traffic Flow Analysis of Public Transport Data in the City of Lisbon. Master’s Thesis, University of Lisbon, Instituto Superior Tecnico, Lisbon, Portugal, 2021. [Google Scholar]
- Aparicio, J.T.; Arsenio, E.; Henriques, R. Understanding the Impacts of the COVID-19 Pandemic on Public Transportation Travel Patterns in the City of Lisbon. Sustainability 2021, 13, 8342. [Google Scholar] [CrossRef]
- Metro em números. Site do Metropolitano de Lisboa, EPE—Empresa. 17 March 2021. Available online: https://www.metrolisboa.pt/institucional/conhecer/metro-em-numeros/ (accessed on 27 June 2021).
- Segvault. Perturbações do Metro de Lisboa em Outubro de 2019. Perturbações.pt. Available online: https://perturbacoes.pt/d/2019/10 (accessed on 28 June 2021).
- Costa, C.J.; Aparicio, M.; Aparicio, S.; Aparicio, J.T. Gamification usage ecology. In Proceedings of the 35th ACM International Conference on the Design of Communication, Halifax, NS, Canada, 11–13 August 2017; pp. 1–9. [Google Scholar]
- Aparicio, J.T.; Trinca, M.; Castro, D.; Henriques, R. Vehicle Smart Grid Allocation using Multi-Agent Systems sensitive to Irrational Behavior and Unstable Power Supply. In Proceedings of the 2021 16th Iberian Conference on Information Systems and Technologies (CISTI), Chaves, Portugal, 23–26 June 2021; pp. 1–6. [Google Scholar]


Publisher’s Note: MDPI stays neutral with regard to jurisdictional claims in published maps and institutional affiliations. |
© 2022 by the authors. Licensee MDPI, Basel, Switzerland. This article is an open access article distributed under the terms and conditions of the Creative Commons Attribution (CC BY) license (https://creativecommons.org/licenses/by/4.0/).