
Hydrogen Production by the Thermophilic Dry Anaerobic Co-Fermentation of Food Waste Utilizing Garden Waste or Kitchen Waste as Co-Substrate

Abstract
:1. Introduction
2. Materials and Methods
2.1. Substrate and Inoculum
2.2. Thermophilic Dry Anaerobic Fermentation
2.3. Analytical Methods
3. Results and Discussion
3.1. Hydrogen Production
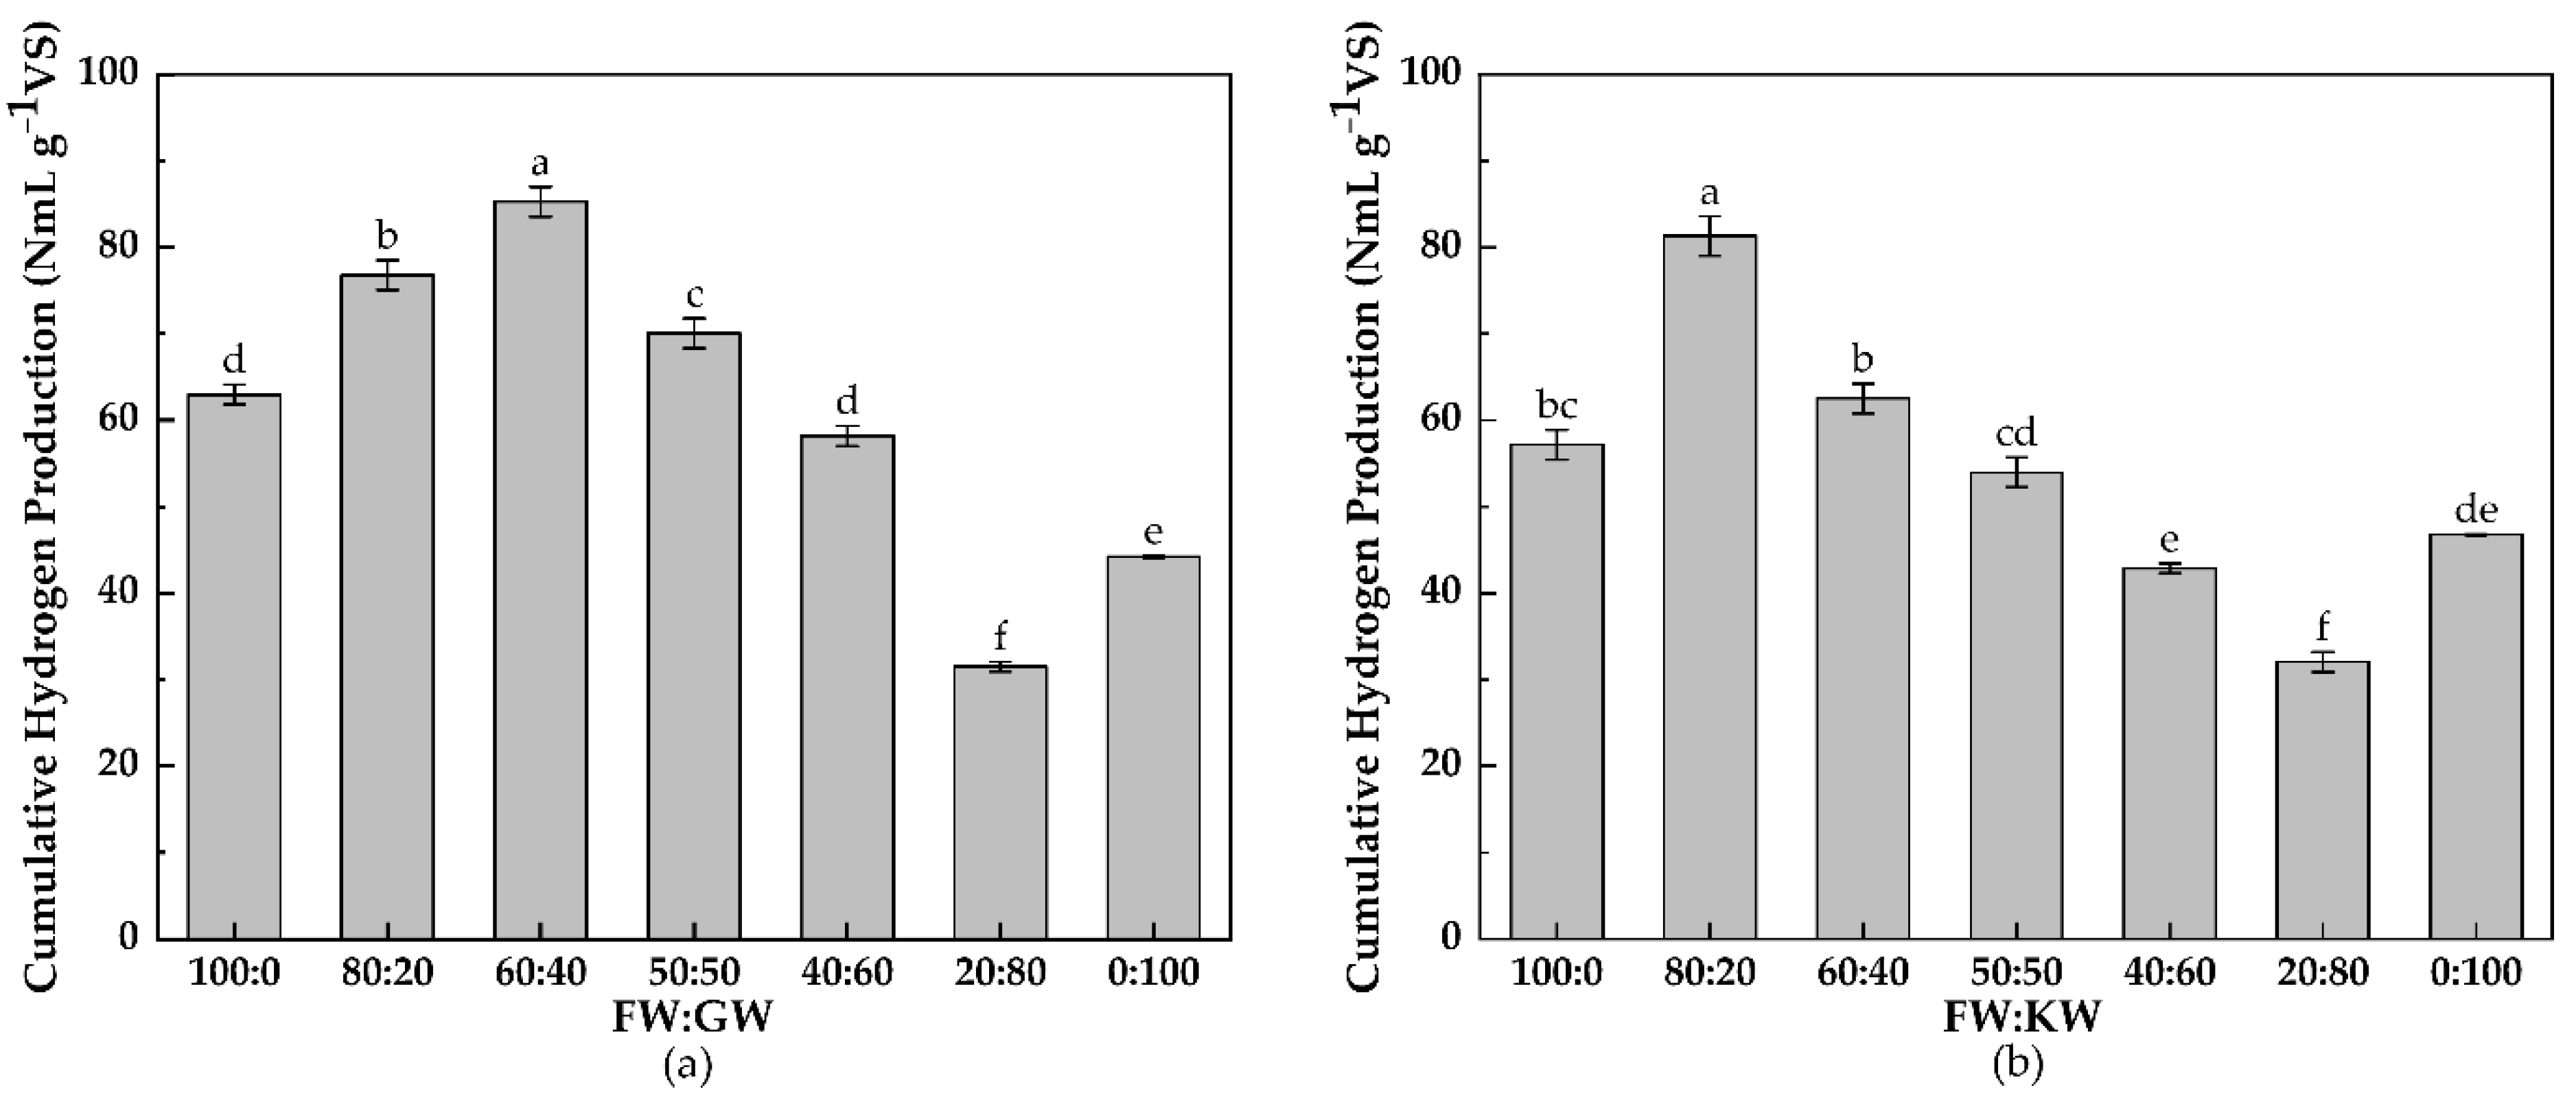
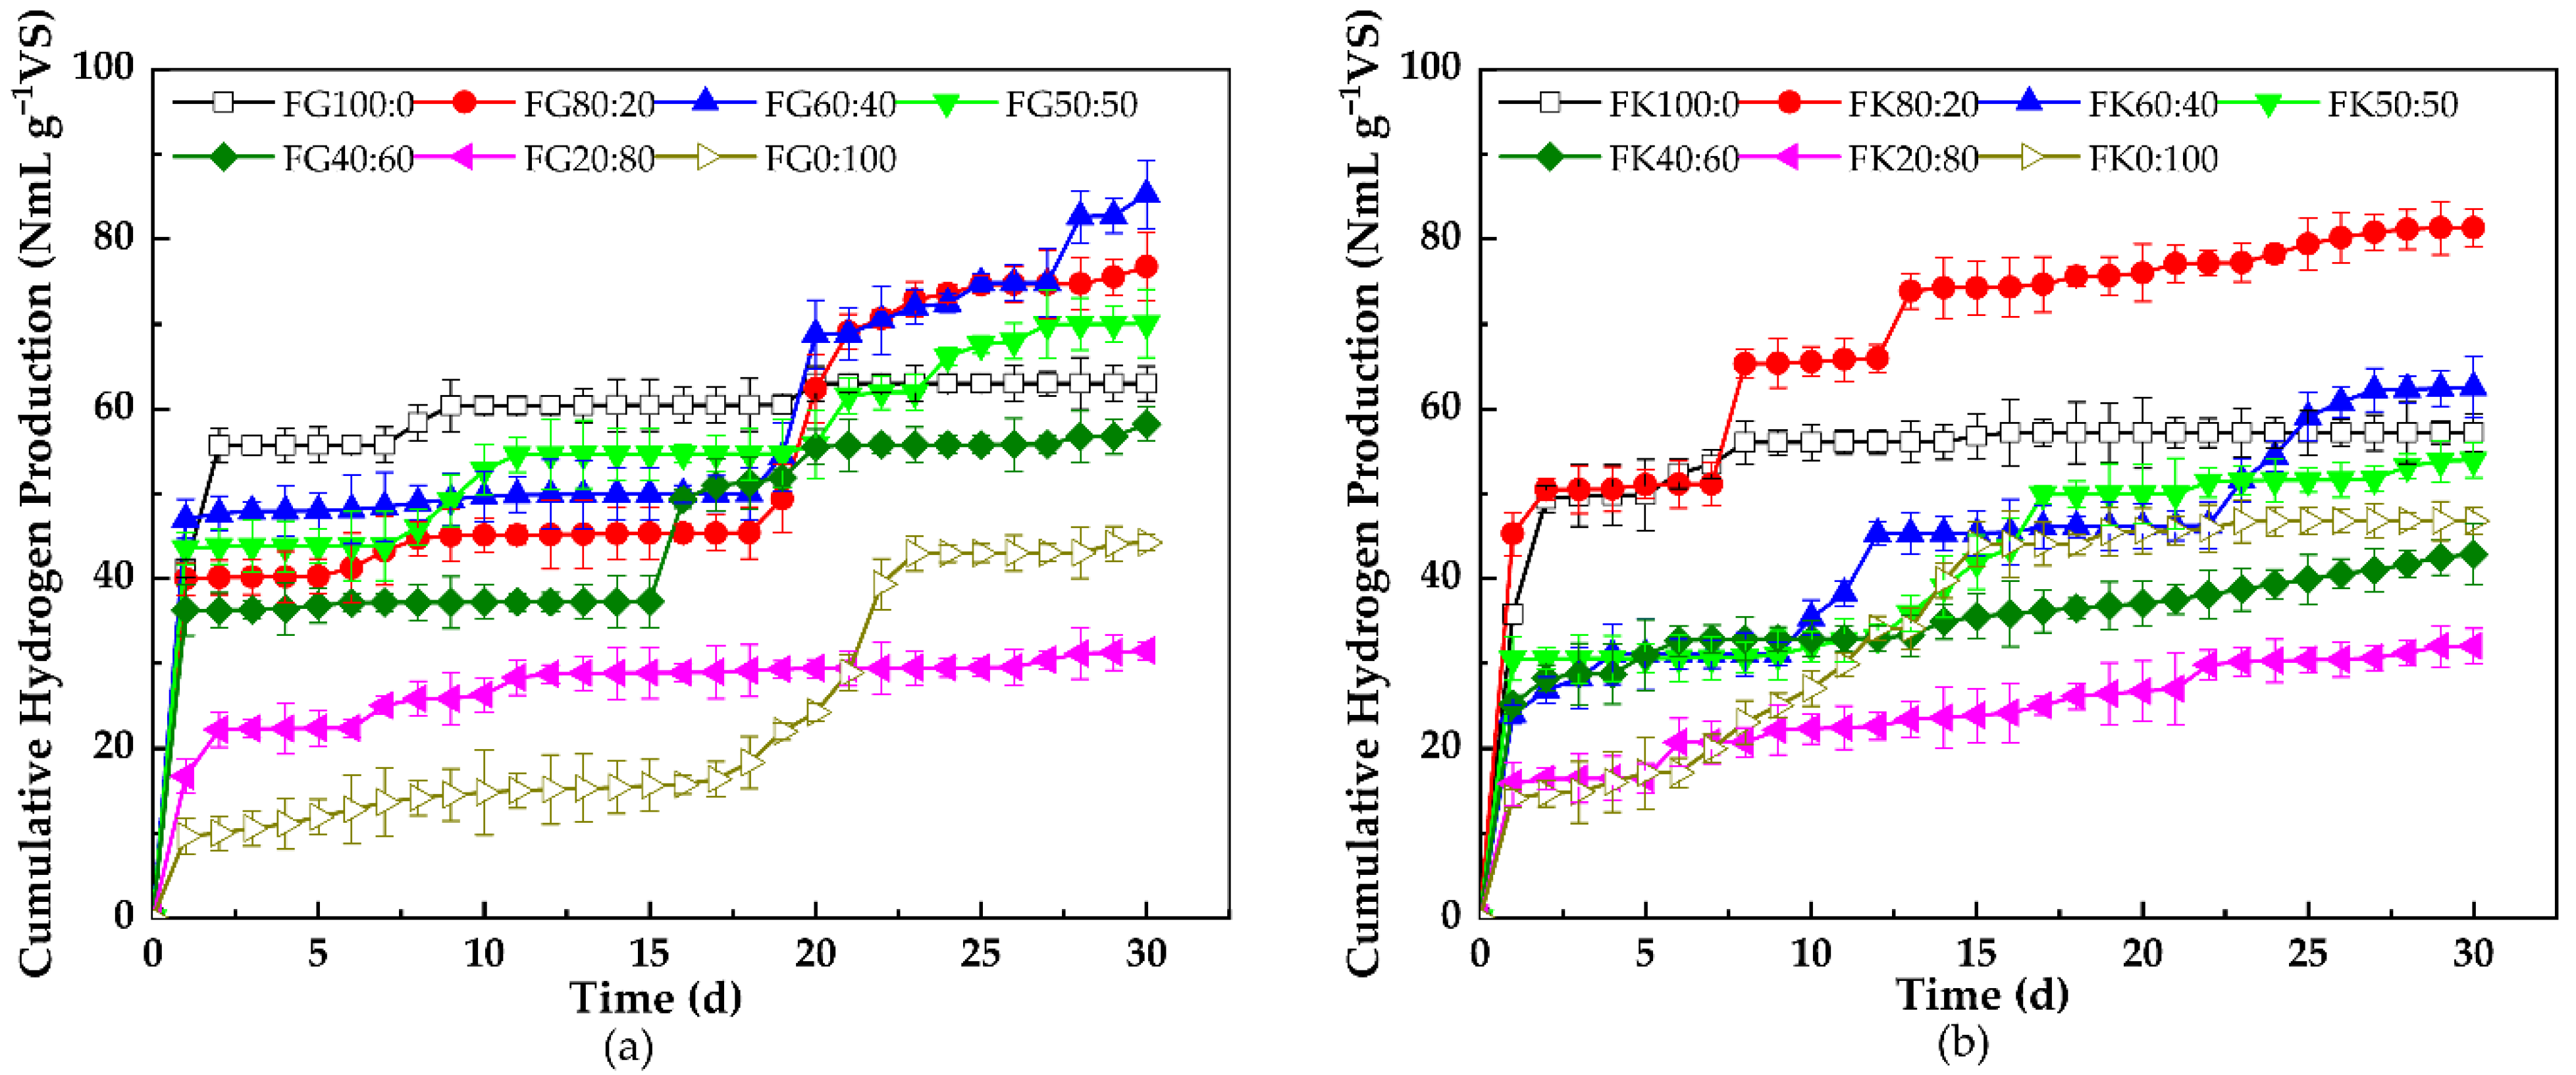
3.1.1. Cumulative Hydrogen Production
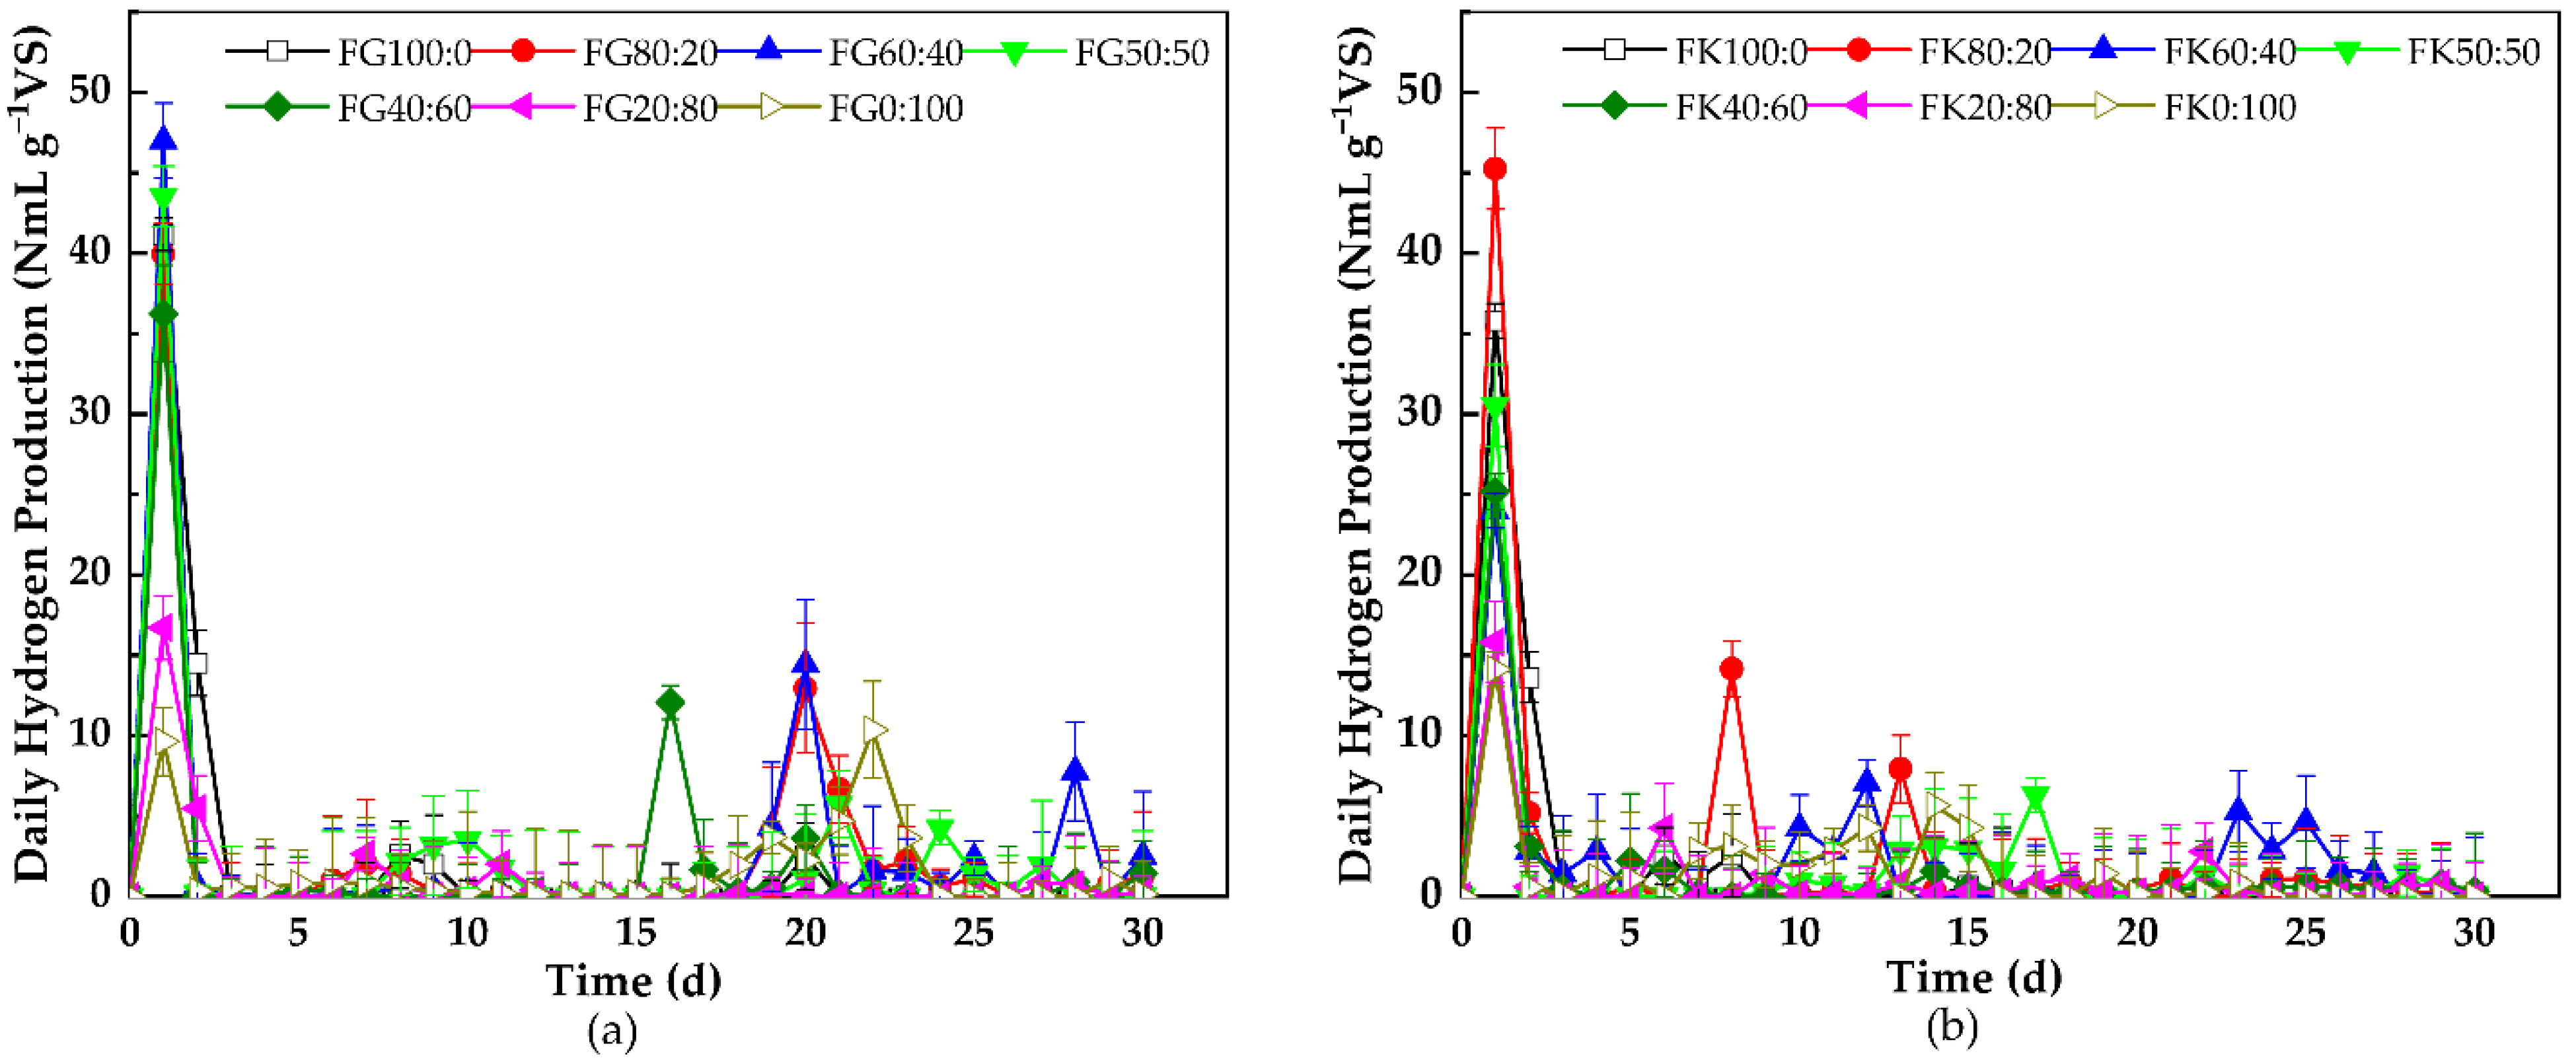
3.1.2. Daily Hydrogen Production
3.2. Change in Organic Matter
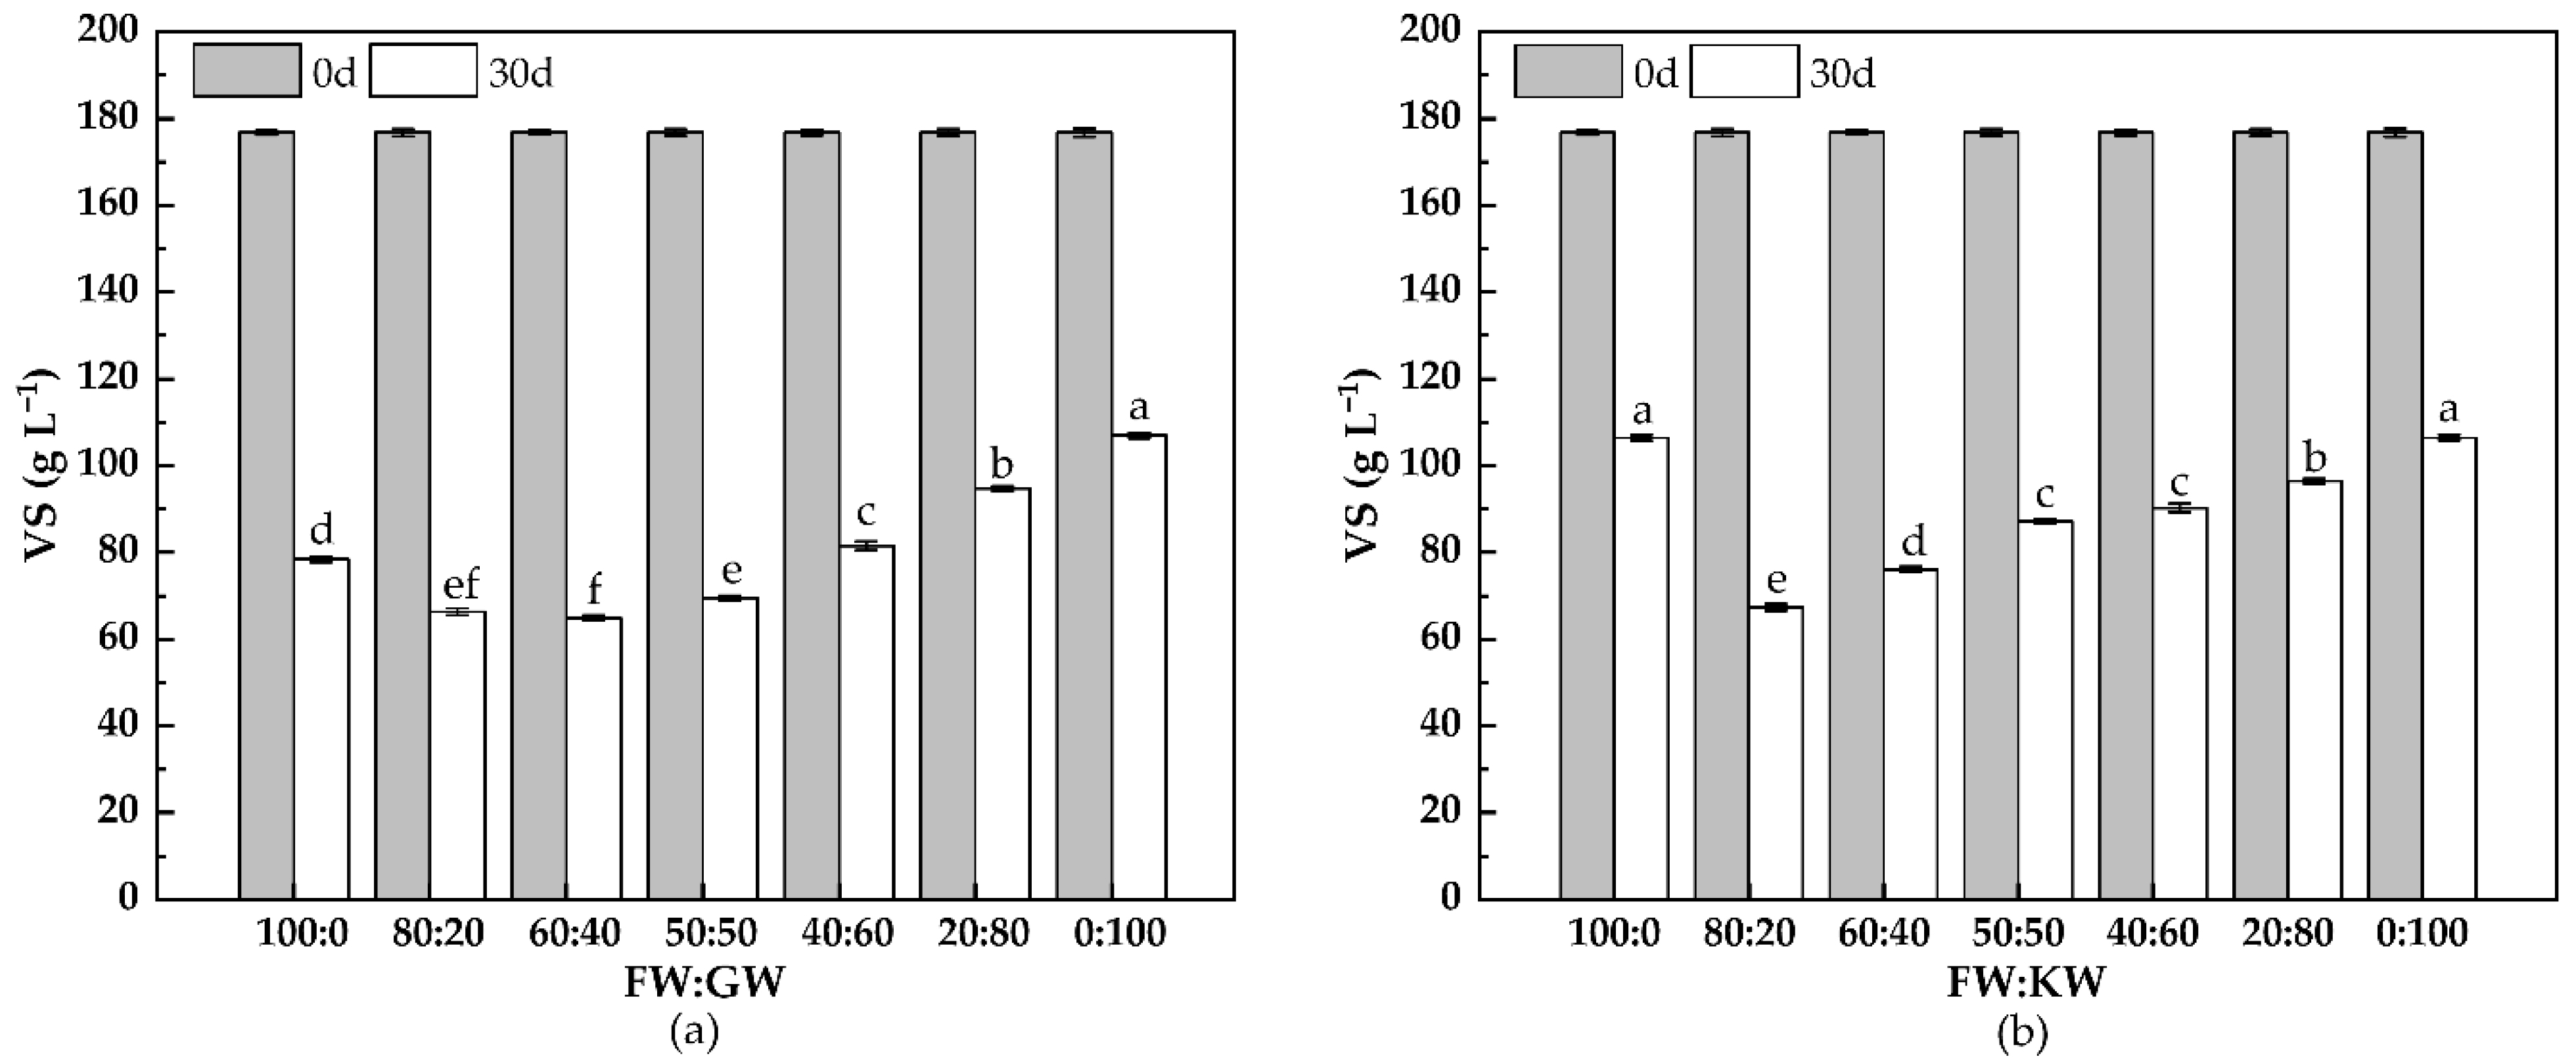
3.2.1. VS Change
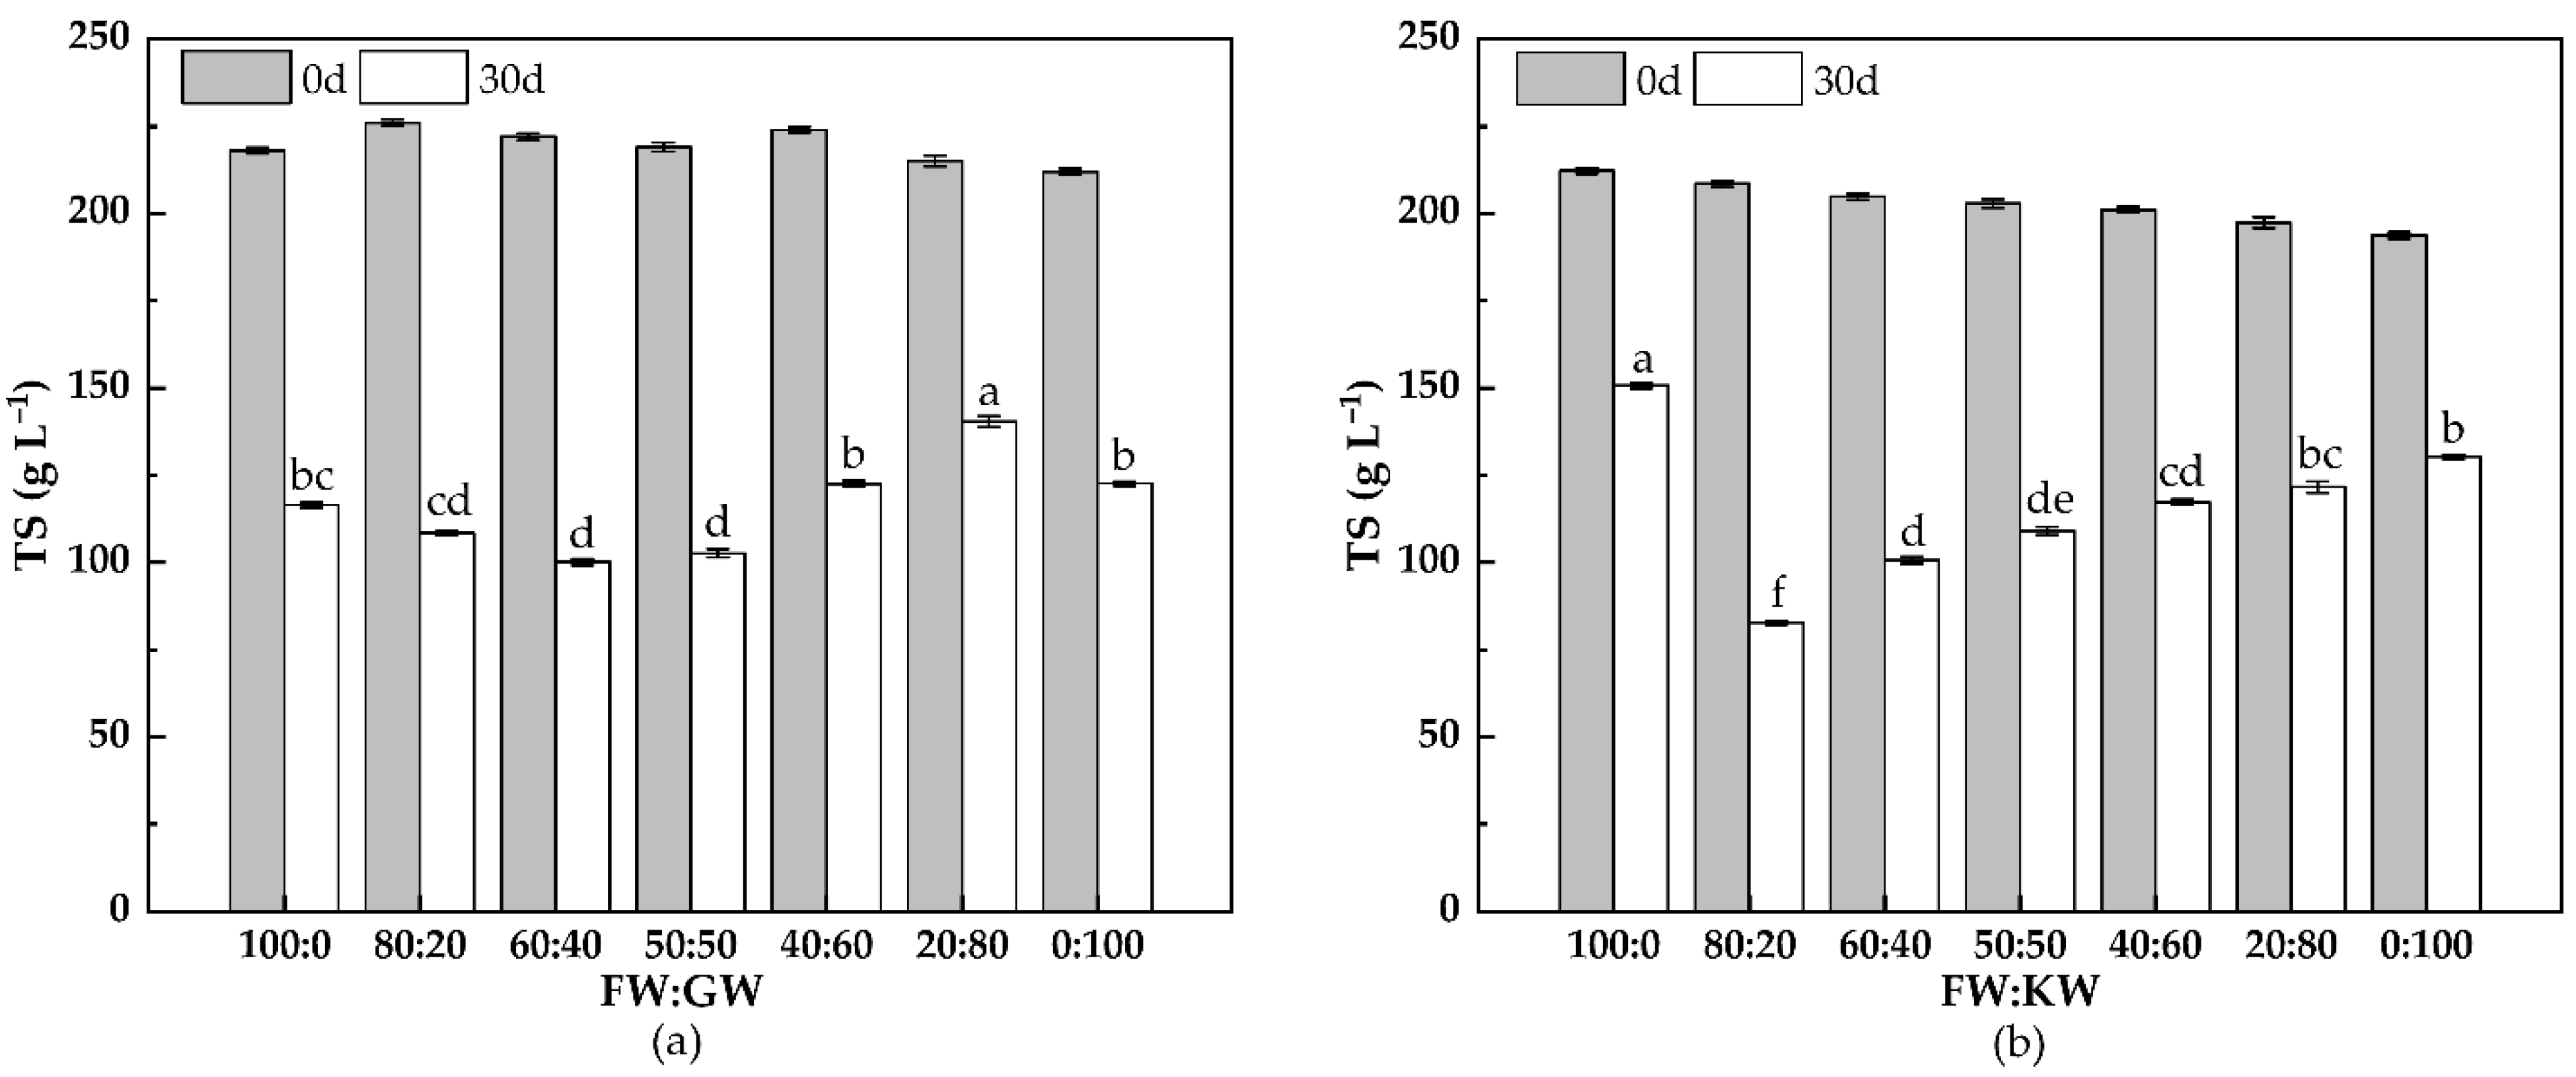
3.2.2. TS Change
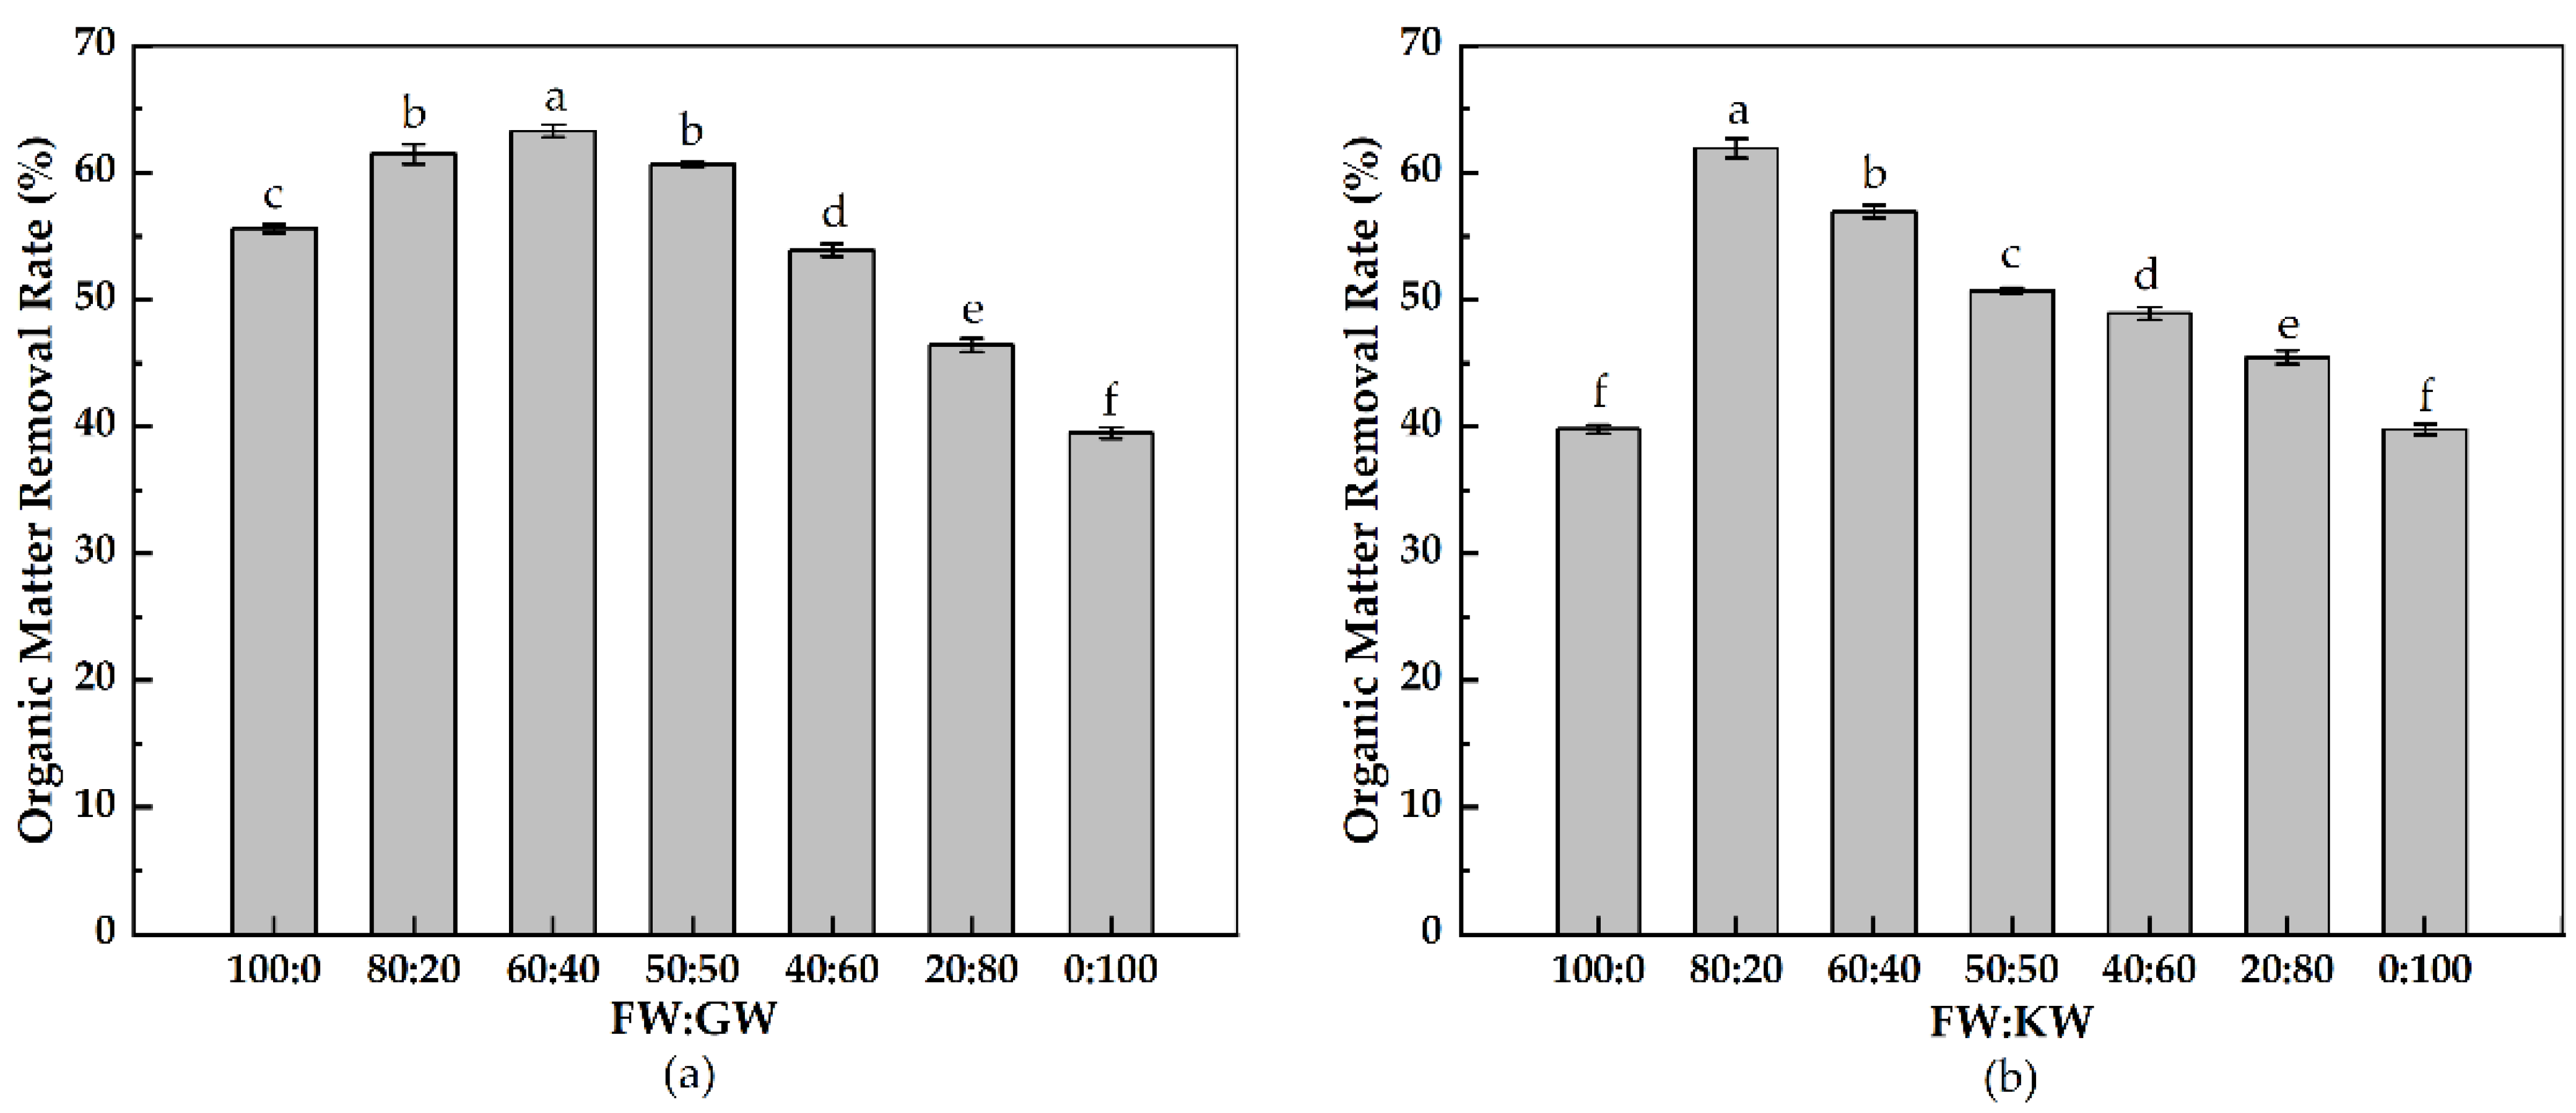
3.2.3. Organic Matter Removal
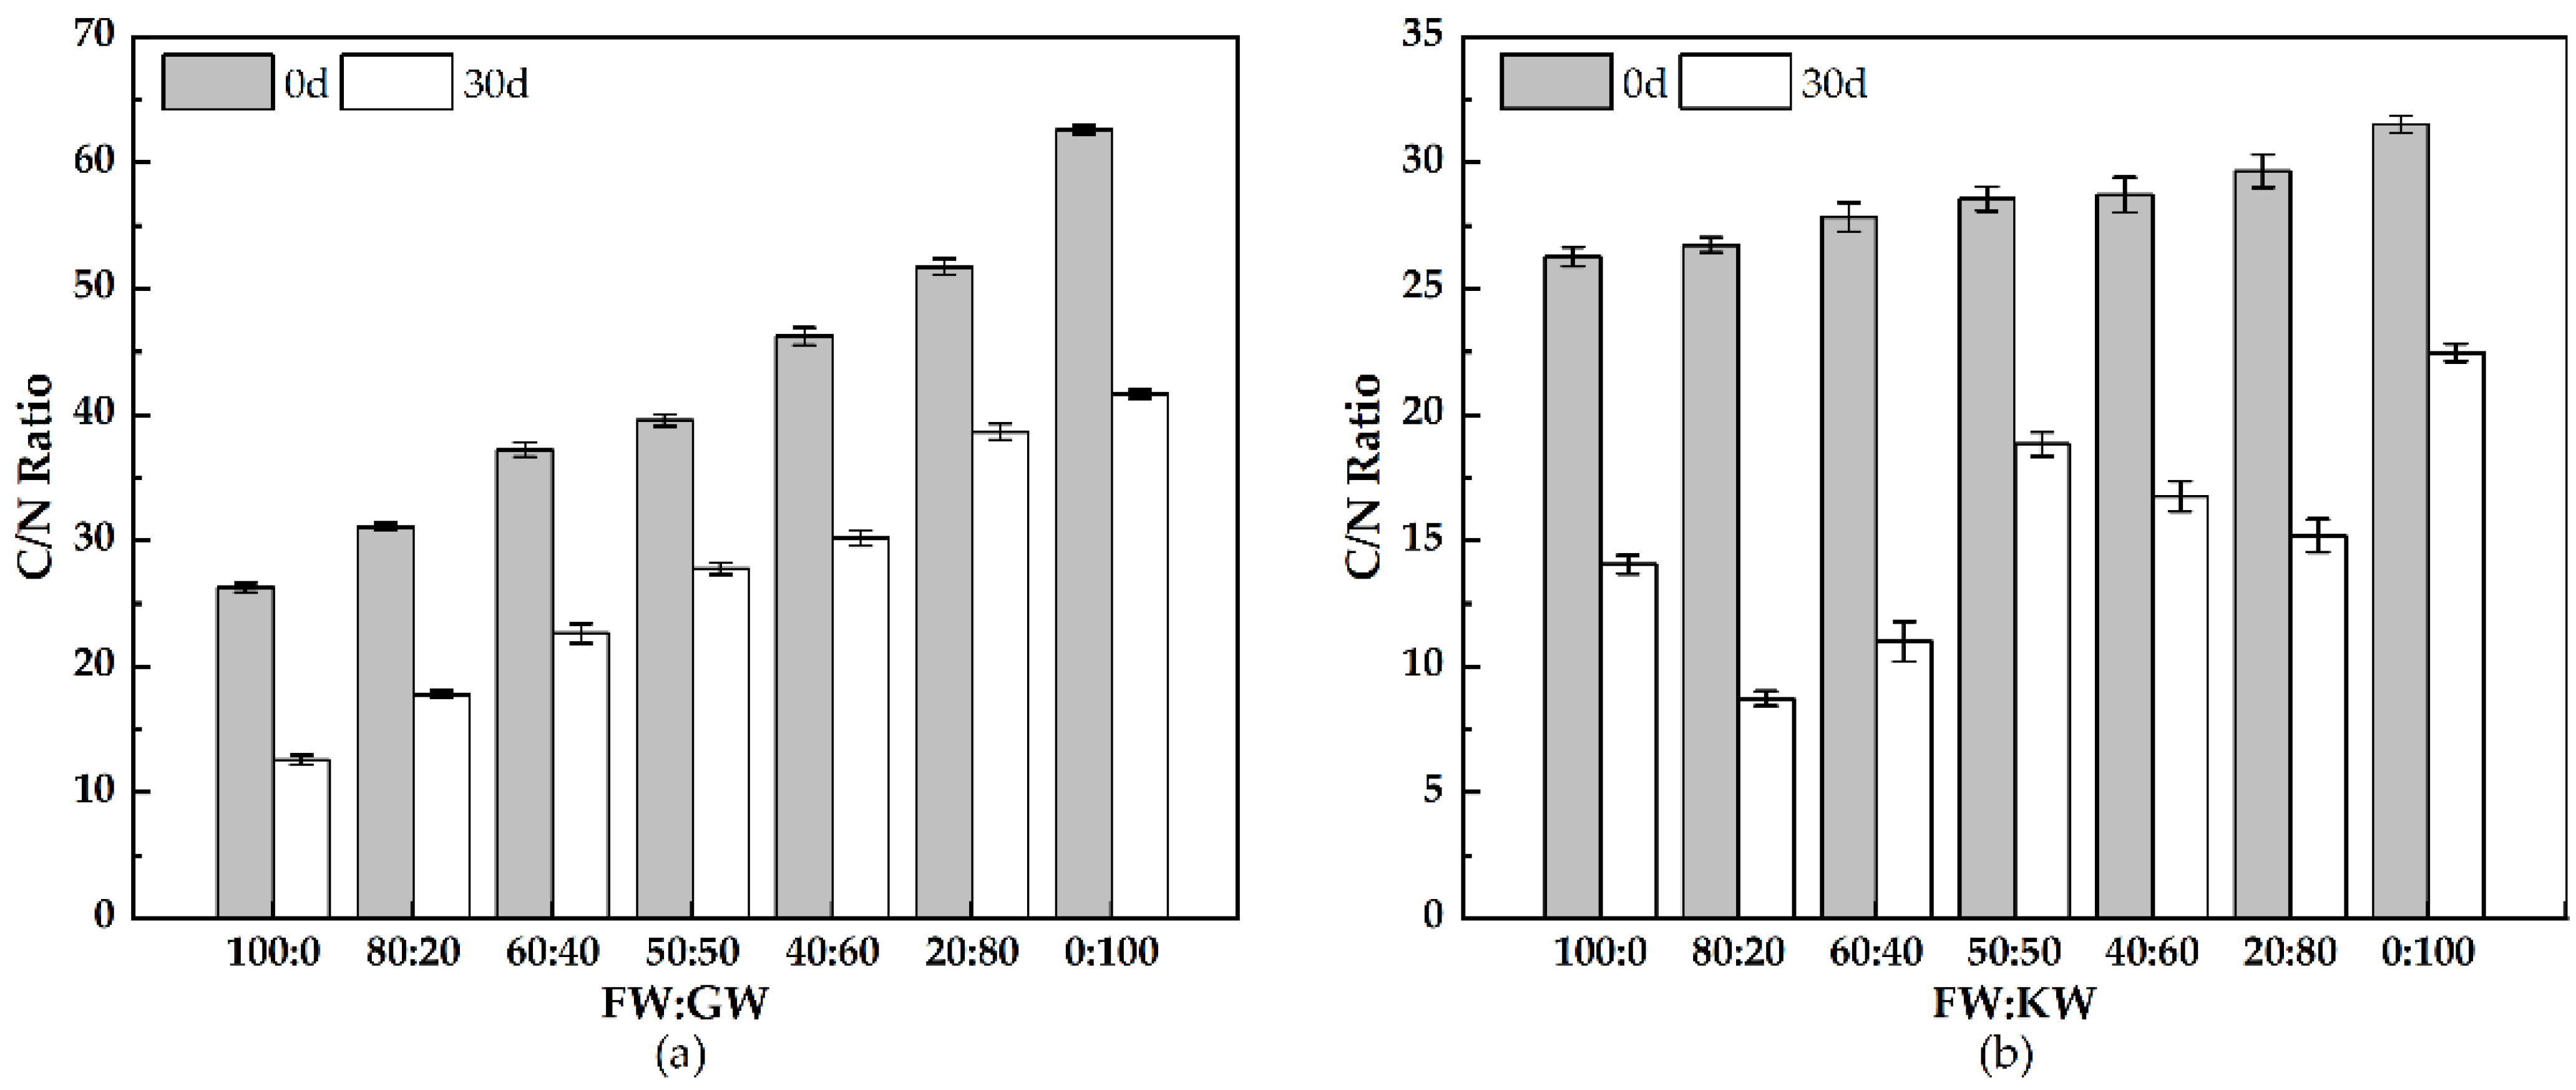
3.2.4. C/N Ratio
4. Conclusions
Author Contributions
Funding
Institutional Review Board Statement
Informed Consent Statement
Data Availability Statement
Conflicts of Interest
References
- Lv, Y.; Chang, N.; Li, Y.-Y.; Liu, J. Anaerobic co-digestion of food waste with municipal solid waste leachate: A review and prospective application with more benefits. Resour. Conserv. Recycl. 2021, 174, 105832. [Google Scholar] [CrossRef]
- He, X.Z.; Yin, J.; Liu, J.Z.; Chen, T.; Shen, D.S. Characteristics of acidogenic fermentation for volatile fatty acid production from food waste at high concentrations of NaCl. Bioresour. Technol. 2019, 271, 244–250. [Google Scholar] [CrossRef] [PubMed]
- Wang, P.; Li, X.; Chu, S.; Su, Y.; Wu, D.; Xie, B. Metatranscriptomic insight into the effects of antibiotic exposure on performance during anaerobic co-digestion of food waste and sludge. J. Hazard. Mater. 2022, 423, 127163. [Google Scholar] [CrossRef] [PubMed]
- Yin, C.H.; Dong, X.; Lv, L.; Wang, Z.G.; Xu, Q.Q.; Liu, X.L.; Yan, H. Economic production of probiotics from kitchen waste. Food Sci. Biotechnol. 2013, 22, 59–63. [Google Scholar] [CrossRef]
- Sun, C.; Xie, Y.; Hou, F.; Yu, Q.; Wang, Y.F.; Wang, X.X.; Miao, C.K.; Ma, J.; Ge, W.X.; Zhang, T.L.; et al. Enhancement on methane production and anaerobic digestion stability via co-digestion of microwave-Ca(OH)(2) pretreated sugarcane rind slurry and kitchen waste. J. Clean. Prod. 2020, 264, 121731. [Google Scholar] [CrossRef]
- Zhang, L.; Loh, K.-C.; Zhang, J. Enhanced biogas production from anaerobic digestion of solid organic wastes: Current status and prospects. Bioresour. Technol. Rep. 2019, 5, 280–296. [Google Scholar] [CrossRef]
- Zhai, N.N.; Zhang, T.; Yin, D.X.; Yang, G.H.; Wang, X.J.; Ren, G.X.; Feng, Y.Z. Effect of initial pH on anaerobic co-digestion of kitchen waste and cow manure. Waste Manag. 2015, 38, 126–131. [Google Scholar] [CrossRef]
- Izumi, K.; Okishio, Y.K.; Nagao, N.; Niwa, C.; Yamamoto, S.; Toda, T. Effects of particle size on anaerobic digestion of food waste. Int. Biodeterior. Biodegrad. 2010, 64, 601–608. [Google Scholar] [CrossRef]
- Xing, B.S.; Cao, S.F.; Han, Y.L.; Wen, J.W.; Zhang, K.D.; Wang, X.C.C. Stable and high-rate anaerobic co-digestion of food waste and cow manure: Optimisation of start-up conditions. Bioresour. Technol. 2020, 307, 122887. [Google Scholar] [CrossRef]
- Li, Y.Y.; Jin, Y.Y.; Li, J.H.; Chen, Y.X.; Gong, Y.Y.; Li, Y.Z.; Zhang, J.F. Current situation and development of kitchen waste treatment in China. In Proceedings of the 10th International Conference on Waste Management and Technology (ICWMT), Mianyang, China, 28–30 October 2016; pp. 40–49. [Google Scholar]
- Zhang, X.; Jiang, C.Z.; Shan, Y.X.; Zhang, X.Y.; Zhao, Y. Influence of the void fraction and vertical gas vents on the waste decomposition in semi-aerobic landfill: Lab-scale tests. Waste Manag. 2019, 100, 28–35. [Google Scholar] [CrossRef]
- Eriksson, M.; Osowski, C.P.; Malefors, C.; Bjorkman, J.; Eriksson, E. Quantification of food waste in public catering services—A case study from a Swedish municipality. Waste Manag. 2017, 61, 415–422. [Google Scholar] [CrossRef] [PubMed]
- Sun, S.K.; Lu, Y.J.; Gao, H.; Jiang, T.T.; Du, X.Y.; Shen, T.X.; Wu, P.T.; Wang, Y.B. Impacts of food wastage on water resources and environment in China. J. Clean. Prod. 2018, 185, 732–739. [Google Scholar] [CrossRef]
- Anjum, M.; Al-Talhi, H.A.; Mohamed, S.A.; Kumar, R.; Barakat, M.A. Visible light photocatalytic disintegration of waste activated sludge for enhancing biogas production. J. Environ. Manag. 2018, 216, 120–127. [Google Scholar] [CrossRef] [PubMed]
- Anjum, M.; Al-Makishah, N.H.; Barakat, M.A. Wastewater sludge stabilization using pre-treatment methods. Process. Saf. Environ. Protect. 2016, 102, 615–632. [Google Scholar] [CrossRef]
- Abubackar, H.N.; Keskin, T.; Arslan, K.; Vural, C.; Aksu, D.; Yavuzyilmaz, D.K.; Ozdemir, G.; Azbar, N. Effects of size and autoclavation of fruit and vegetable wastes on biohydrogen production by dark dry anaerobic fermentation under mesophilic condition. Int. J. Hydrog. Energy 2019, 44, 17767–17780. [Google Scholar] [CrossRef]
- Abreu, A.A.; Tavares, F.; Alves, M.M.; Cavaleiro, A.J.; Pereira, M.A. Garden and food waste co-fermentation for biohydrogen and biomethane production in a two-step hyperthermophilic-mesophilic process. Bioresour. Technol. 2019, 278, 180–186. [Google Scholar] [CrossRef] [Green Version]
- Giwa, A.S.; Cai, H.Y.; Memon, A.G.; Segun, B.; Adie, G.; Odey, E.A.; Wang, B.Z.; Shahin, A.M.D.; Xiong, X.Y.; Maurice, N.J. Characterization and Environmental Impacts of Kitchen Wastes from Food-Waste Disposer Device. Environ. Eng. Manag. J. 2022, 21, 137–144. [Google Scholar]
- Yang, G.; Hu, Y.M.; Wang, J.L. Biohydrogen production from co-fermentation of fallen leaves and sewage sludge. Bioresour. Technol. 2019, 285, 121342. [Google Scholar] [CrossRef]
- Gupta, P.; Singh, R.S.; Sachan, A.; Vidyarthi, A.S.; Gupta, A. Study on biogas production by anaerobic digestion of garden-waste. Fuel 2012, 95, 495–498. [Google Scholar] [CrossRef]
- Shen, F.; Yuan, H.R.; Pang, Y.Z.; Chen, S.L.; Zhu, B.N.; Zou, D.X.; Liu, Y.P.; Ma, J.W.; Yu, L.; Li, X.J. Performances of anaerobic co-digestion of fruit & vegetable waste (FVW) and food waste (FW): Single-phase vs. two-phase. Bioresour. Technol. 2013, 144, 80–85. [Google Scholar] [CrossRef]
- Gao, S.M.; Huang, Y.; Yang, L.L.; Wang, H.; Zhao, M.X.; Xu, Z.Y.; Huang, Z.X.; Ruan, W.Q. Evaluation the anaerobic digestion performance of solid residual kitchen waste by NaHCO3 buffering. Energy Convers. Manag. 2015, 93, 166–174. [Google Scholar] [CrossRef]
- Elsamadony, M.; Tawfik, A. Potential of biohydrogen production from organic fraction of municipal solid waste (OFMSW) using pilot-scale dry anaerobic reactor. Bioresour. Technol. 2015, 196, 9–16. [Google Scholar] [CrossRef] [PubMed]
- Zhao, G.; Ma, F.; Wei, L.; Chua, H. Using rice straw fermentation liquor to produce bioflocculants during an anaerobic dry fermentation process. Bioresour. Technol. 2012, 113, 83–88. [Google Scholar] [CrossRef]
- Chen, X.; Yan, W.; Sheng, K.C.; Sanati, M. Comparison of high-solids to liquid anaerobic co-digestion of food waste and green waste. Bioresour. Technol. 2014, 154, 215–221. [Google Scholar] [CrossRef] [PubMed] [Green Version]
- Xu, F.Q.; Li, Y.Y.; Ge, X.M.; Yang, L.C.; Li, Y. Anaerobic digestion of food waste—Challenges and opportunities. Bioresour. Technol. 2018, 247, 1047–1058. [Google Scholar] [CrossRef]
- Wang, Y.; Xi, B.D.; Li, M.X.; Jia, X.; Wang, X.; Xu, P.; Zhao, Y.J. Hydrogen production performance from food waste using piggery anaerobic digested residues inoculum in long-term systems. Int. J. Hydrog. Energy 2020, 45, 33208–33217. [Google Scholar] [CrossRef]
- Baird, R.B.; Eaton, A.D.; Rice, E.W. Standard Methods for the Examination of Water and Wastewater, 23rd ed.; American Public Health Association: Washington, DC, USA, 2017. [Google Scholar]
- Mizuta, K.; Taguchi, S.; Sato, S. Soil aggregate formation and stability induced by starch and cellulose. Soil Biol. Biochem. 2015, 87, 90–96. [Google Scholar] [CrossRef]
- Holm, J.; Bjorck, I.; Drews, A.; Asp, N.G. A rapid method for the analysis of starch. Starch-Starke 1986, 38, 224–226. [Google Scholar] [CrossRef]
- He, Y.F.; Pang, Y.Z.; Liu, Y.P.; Li, X.J.; Wang, K.S. Physicochemical characterization of rice straw pretreated with sodium hydroxide in the solid state for enhancing biogas production. Energy Fuels 2008, 22, 2775–2781. [Google Scholar] [CrossRef]
- Sluiter, A.; Hames, B.; Ruiz, R.; Scarlata, C.; Sluiter, J.; Templeton, D.; Crocker, D. Determination of structural carbohydrates and lignin in biomass. Lab. Anal. Proced. 2008, 1617, 1–16. [Google Scholar]
- Thiex, N.J.; Anderson, S.; Gildemeister, B. Crude fat, diethyl ether extraction, in feed, cereal grain, and forage (Randall/Soxtec/submersion method): Collaborative study. J. Aoac Int. 2003, 86, 888–898. [Google Scholar] [CrossRef] [PubMed] [Green Version]
- Hall, N.G.; Schonfeldt, H.C. Total nitrogen vs. amino-acid profile as indicator of protein content of beef. Food Chem. 2013, 140, 608–612. [Google Scholar] [CrossRef] [PubMed] [Green Version]
- Yang, L.; Chen, L.; Li, H.; Deng, Z.; Liu, J. Lactic acid production from mesophilic and thermophilic fermentation of food waste at different pH. J. Environ. Manage. 2022, 304, 114312. [Google Scholar] [CrossRef] [PubMed]
- Chui, C.; Zhang, S.; Wang, N.; Liu, Q.; Li, B.; Liu, L. Hydrogen production by thermophilic dry anaerobic fermentation of food waste and fruit and vegetable waste. Food Ferment. Ind. 2021, 47, 240–245. [Google Scholar]


| Characteristics | FW | GW | KW | Inoculum |
|---|---|---|---|---|
| TS (%, wet basis) | 28.83 ± 0.49 | 59.03 ± 0.81 | 26.19 ± 0.27 | 3.45 ± 0.08 |
| VS (%, wet basis) | 24.33 ± 0.44 | 46.77 ± 1.10 | 24.32 ± 0.67 | 2.15 ± 0.04 |
| VS/TS (%) | 84.41 | 79.23 | 92.90 | 62.32 |
| TOC (%, dry basis) | 39.67 ± 1.66 | 58.10 ± 1.23 | 33.48 ± 0.75 | 29.29 ± 0.58 |
| TN (%, dry basis) | 2.03 ± 0.04 | 1.04 ± 0.01 | 1.35 ± 0.07 | 4.36 ± 0.11 |
| C/N | 19.54 | 55.89 | 24.80 | 6.72 |
| pH | 5.51 ± 0.05 | 6.98 ± 0.09 | 4.80 ± 0.03 | 8.47 ± 0.06 |
| Soluble salt (%, dry basis) | 7.68 ± 0.74 | 1.25 ± 0.32 | 2.86 ± 0.88 | 1.18 ± 0.57 |
| Starch (%, dry basis) | 37.61 ± 1.91 | 0 | 27.33 ± 0.78 | N.D. |
| Cellulose (%, dry basis) | 7.52 ± 0.55 | 31.91 ± 1.23 | 10.45 ± 0.85 | N.D. |
| Hemicellulose (%, dry basis) | 4.52 ± 0.06 | 8.52 ± 0.15 | 6.40 ± 0.23 | N.D. |
| Lignin (%, dry basis) | 3.34 ± 0.12 | 28.67 ± 1.33 | 3.77 ± 0.06 | N.D. |
| Crude fat (%, dry basis) | 30.66 ± 2.11 | 1.40 ± 0.96 | 23.77 ± 2.07 | N.D. |
| Crude protein (%, dry basis) | 12.69 ± 0.93 | 6.50 ± 0.07 | 8.44 ± 0.16 | N.D. |
| Item | Exp. Ⅰ | Item | Exp. Ⅱ | ||
|---|---|---|---|---|---|
| FW + GW | Inoculum/g | FW + KW | Inoculum/g | ||
| FG100:0 | 100% FW + 0% GW | 120 | FK100:0 | 100% FW + 0% KW | 120 |
| FG80:20 | 80% FW + 20% GW | 120 | FK80:20 | 80% FW + 20% KW | 120 |
| FG60:40 | 60% FW + 40% GW | 120 | FK60:40 | 60% FW + 40% KW | 120 |
| FG50:50 | 50% FW + 50% GW | 120 | FK50:50 | 50% FW + 50% KW | 120 |
| FG40:60 | 40% FW + 60% GW | 120 | FK40:60 | 40% FW + 60% KW | 120 |
| FG20:80 | 20% FW + 80% GW | 120 | FK20:80 | 20% FW + 80% KW | 120 |
| FG0:100 | 0% FW + 100% GW | 120 | FK0:100 | 0% FW + 100% KW | 120 |
Publisher’s Note: MDPI stays neutral with regard to jurisdictional claims in published maps and institutional affiliations. |
© 2022 by the authors. Licensee MDPI, Basel, Switzerland. This article is an open access article distributed under the terms and conditions of the Creative Commons Attribution (CC BY) license (https://creativecommons.org/licenses/by/4.0/).
Share and Cite
Wang, N.; Chui, C.; Zhang, S.; Liu, Q.; Li, B.; Shi, J.; Liu, L. Hydrogen Production by the Thermophilic Dry Anaerobic Co-Fermentation of Food Waste Utilizing Garden Waste or Kitchen Waste as Co-Substrate. Sustainability 2022, 14, 7367. https://doi.org/10.3390/su14127367
Wang N, Chui C, Zhang S, Liu Q, Li B, Shi J, Liu L. Hydrogen Production by the Thermophilic Dry Anaerobic Co-Fermentation of Food Waste Utilizing Garden Waste or Kitchen Waste as Co-Substrate. Sustainability. 2022; 14(12):7367. https://doi.org/10.3390/su14127367
Chicago/Turabian StyleWang, Na, Chunmeng Chui, Siying Zhang, Qianjing Liu, Baoguo Li, Jiping Shi, and Li Liu. 2022. "Hydrogen Production by the Thermophilic Dry Anaerobic Co-Fermentation of Food Waste Utilizing Garden Waste or Kitchen Waste as Co-Substrate" Sustainability 14, no. 12: 7367. https://doi.org/10.3390/su14127367
APA StyleWang, N., Chui, C., Zhang, S., Liu, Q., Li, B., Shi, J., & Liu, L. (2022). Hydrogen Production by the Thermophilic Dry Anaerobic Co-Fermentation of Food Waste Utilizing Garden Waste or Kitchen Waste as Co-Substrate. Sustainability, 14(12), 7367. https://doi.org/10.3390/su14127367