
Upgrading Strategy, Warranty Policy and Pricing Decisions for Remanufactured Products Sold with Two-Dimensional Warranty


Abstract
:1. Introduction
2. Model Assumptions and Notation
Assumptions
- The base-warranty of an end-of-life product has expired when it is sold by a user to a dealer.
- The purchasing price of an end-of-life product depends on the reliability of the product, which is considered to be dependent on its age and usage.
- Each end-of-life product is disassembled into parts, and after an appropriate upgrading process, the parts will be reused.
- The warranty coverage offered by the dealer for remanufactured products is two-dimensional (2D), i.e., both the product’s age and usage will be used to characterise the warranty.
- Customers will have the option to choose the upgrading strategy as well as the warranty policy for the products that they purchase.
- The number of product failures during a given operation period is assumed to follow a non-homogeneous Poisson process (NHPP).
- All the product failures during warranty are repaired minimally by the dealer with no charge to the consumer.
- The time to repair a faulty item is considerably smaller than the mean inter-failure time, so the repair time is assumed to be negligible.
- Customers are considered to be the market leader, aiming to minimise their expected costs during the remaining life of the product by choosing the most affordable upgrading strategy and warranty policy.
- The dealer is considered to be the market follower, aiming to maximise his/her profit margin based on customer preferences about the upgrading and warranty.
- The demand for the remanufactured product is a nonlinear function of its selling price, as well as the expected warranty servicing costs.
3. Components of the Model
3.1. The Purchasing Price of an End-of-Life Product from an End-User
3.2. The Upgrading Cost
3.3. Dealer’s Expected Costs during the Warranty Period
3.4. The Expected Price of Upgrading and Warranty for Customers
3.5. The Dealer’s Expected Cost for Post-Warranty Services
3.6. The Expected Price of Post-Warranty Service for Customers
4. The Proposed Model and Solution Approach
4.1. The Customer–Dealer Stackelberg Game Model
4.2. The Solution Approach
5. Numerical Example
- (1)
- As the past usage of the remanufactured product increases, the customer’s expected cost decreases and, as a result, demand for the product increases. This also results in an increase in the dealer’s expected profit. At lower usage levels, the rate of cost decrease and the rate of demand increase are lower than those at higher usage levels. This means that between two products having same age, customers will prefer the one with larger/longer past usage because it is less expensive. Moreover, the upgrading cost is lower compared to the purchasing price from an end user.
- (2)
- Considering the product’s reliability at the time of purchase, it is found that the reliability decreases with an increase in the product’s usage. Therefore, the purchasing price from an end user also decreases.
- (3)
- The upgrading cost increases with an increase in the upgrade level and decreases with an increase in the product’s reliability.
6. Conclusions
Author Contributions
Funding
Institutional Review Board Statement
Informed Consent Statement
Data Availability Statement
Conflicts of Interest
Notation
| L | Maximum life of a product in terms of ‘age’ |
| U | Maximum life of a product in terms of ‘usage’ |
| p0 | Sale price of a new product |
| csv | Disposal or salvage value of a product |
| x | Past age of the remanufactured product, where 0 < x < L |
| y | Past usage of the remanufactured product, where 0 < y < U |
| Ω0 | Past 2D life region of the remanufactured product = [0, x] × [0, y] |
| cp | Purchasing price of a product with age x and usage y |
| u = (ut, us) | Upgrading strategy, where 0 ≤ ut ≤ x and 0 ≤ us ≤ y |
| cu(.) | Upgrading cost function |
| cs, cu, ζ, ψ, φ | Parameters of the upgrading cost function |
| w1, v1 | Age and usage limits of the warranty coverage for the remanufactured products, where 0 < w1 ≤ L − x, 0 < v1 ≤ U − y |
| r | Costumer’s usage rate, where r > 0 |
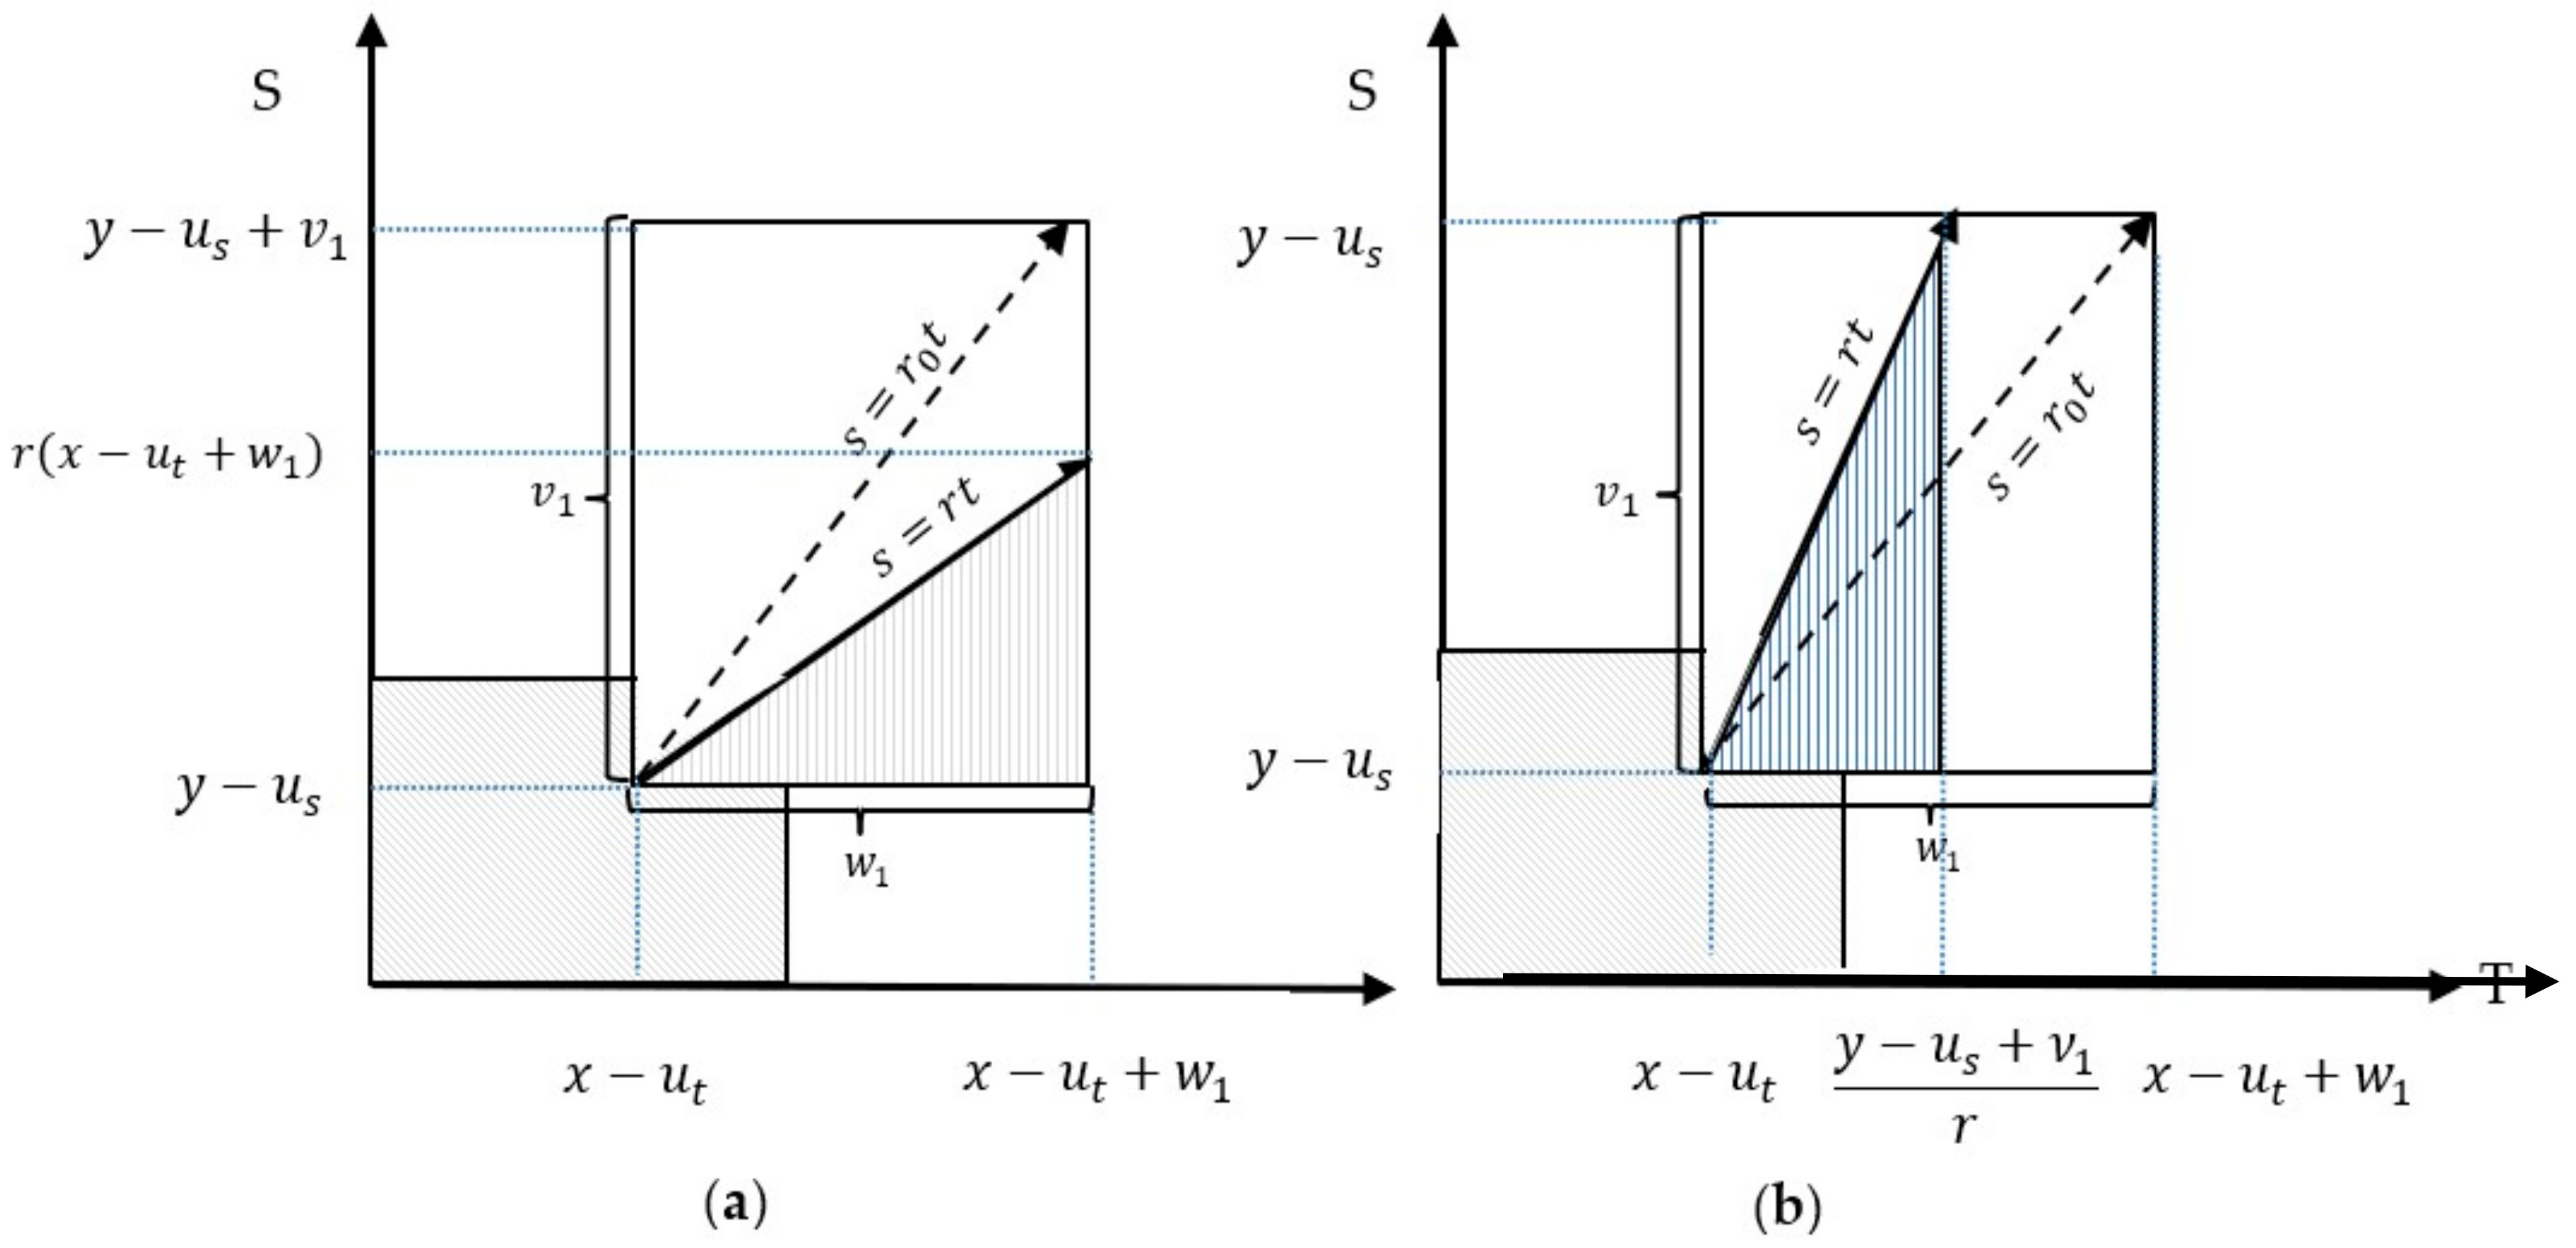
| Ωw | Warranty region for the remanufactured product = [x − ut, x − ut + w1] × [y − us, y − us + v1] |
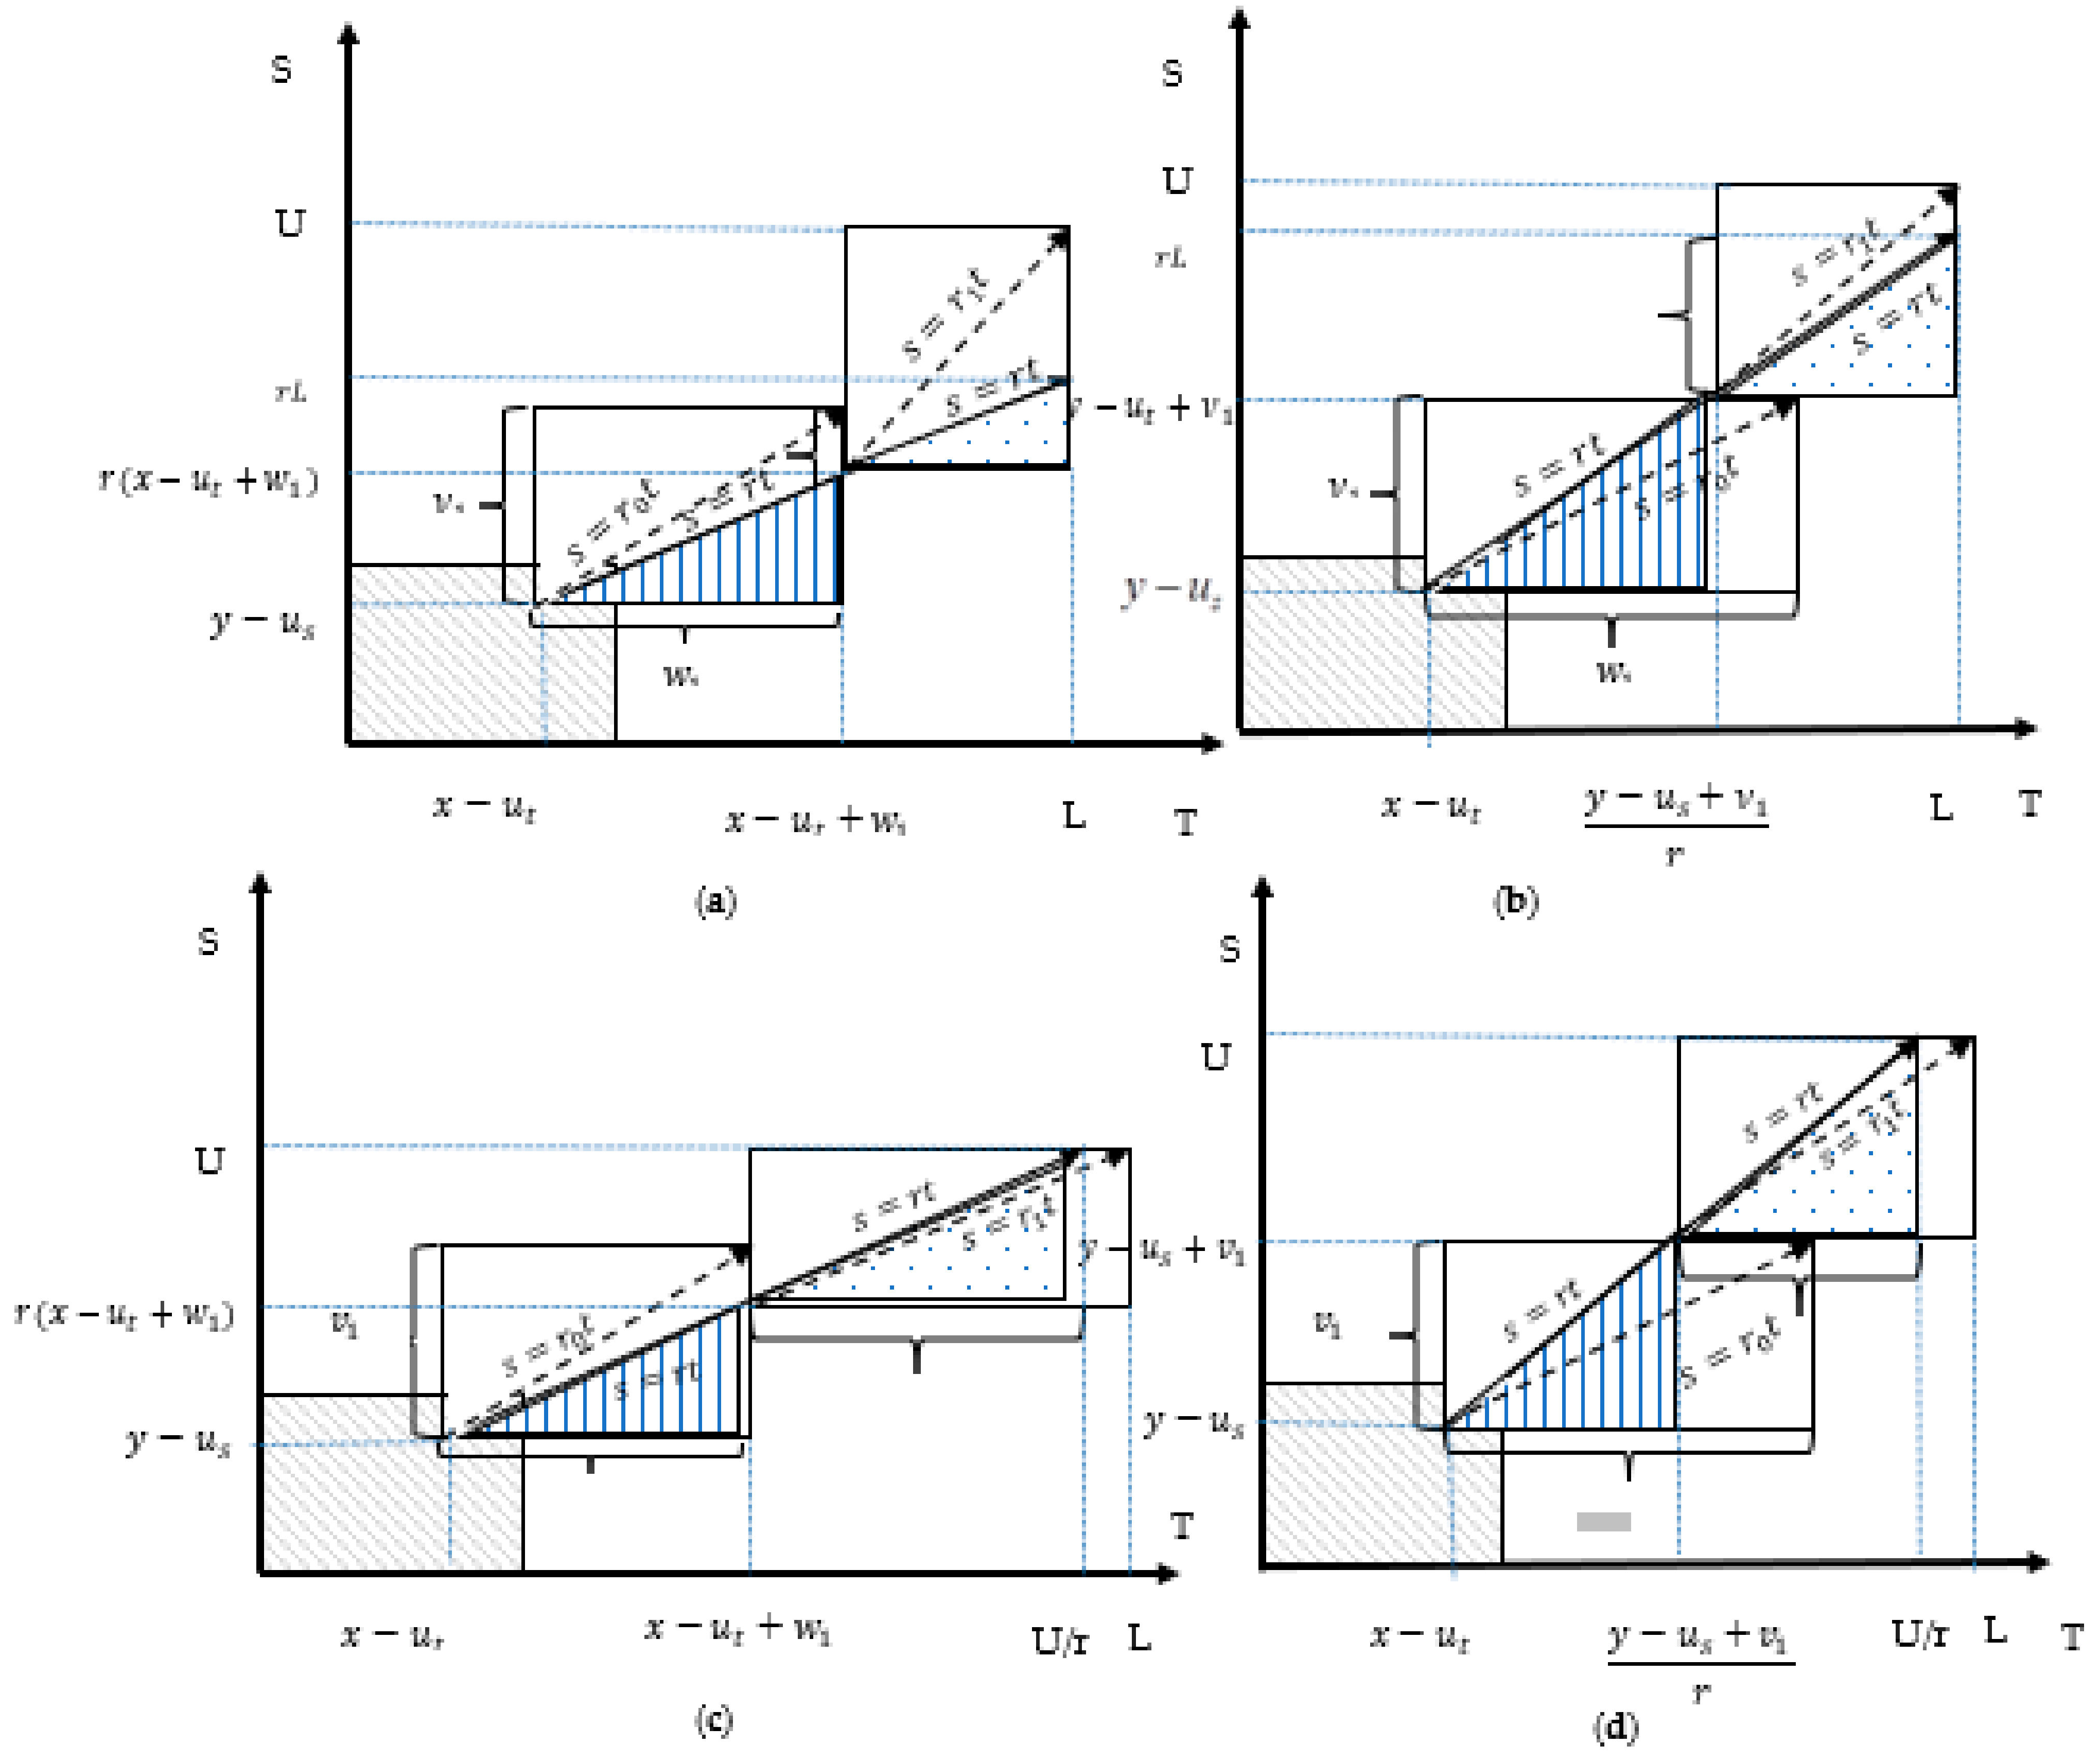
| Ωpw | Post-warranty region for the remanufactured product = [x − ut + w1, L] × [r(x − ut + w1), U] ∪ [(y − us + v1)/r, L] × [y − us + v1, U] |
| gR(.), GR(.) | Probability density function (PDF) and cumulative distribution function (CDF) of variable R |
| T | A random variable describing the time to failure of the product |
| S | A random variable describing the usage to failure of the product |
| f(t,s;u), F(t,s;u) | PDF and CDF of the variables T and S after applying the upgrading strategy u |
| r(t,s;u) | Failure rate function of the variables T and S after applying the upgrading strategy u |
| γ [τ] | Effectiveness of the update action in ‘age’ [‘usage’] reduction |
| B(.) | PDF of Beta distribution |
| cr | Expected cost of a repair action at any point of time |
| δu,w | Dealer’s profit margin percentage for offering the warranty and upgrading services to customers, where δu,w ≥ 0 |
| δpw | Dealer’s profit margin percentage for offering the post-warranty services to customers, where δpw ≥ 0 |
| cw(ut, us, w1, v1) | Dealer’s expected cost within the warranty coverage region |
| cpw(ut, us, w1, v1) | Dealer’s expected cost within the post-warranty region |
References
- Kwak, M. Optimal line design of new and remanufactured products: A model for maximum profit and market share with environmental consideration. Sustainability 2018, 10, 4283. [Google Scholar] [CrossRef] [Green Version]
- Neto, J.Q.F.; Bloemhof, J.; Corbett, C. Market prices of remanufactured, used and new items: Evidence from eBay. Int. J. Prod. Econ. 2016, 171, 371–380. [Google Scholar] [CrossRef]
- Wahjudi, D.; Gan, S.S.; Anggono, J.; Tanoto, Y.Y. Factors affecting purchase intention of remanufactured short life-cycle products. Int. J. Bus. Soc. 2018, 19, 415–428. [Google Scholar]
- Shafiee, M.; Saidi-Mehrabad, M.; Naini, S.G.J. Warranty and sustainable improvement of used products through remanufacturing. Int. J. Prod. Lifecycle Manag. 2009, 4, 68–83. [Google Scholar] [CrossRef]
- Saidi-Mehrabad, M.; Noorossana, R.; Shafiee, M. Modeling and analysis of effective ways for improving the reliability of second-hand products sold with warranty. Int. J. Adv. Manuf. Technol. 2010, 46, 253–265. [Google Scholar] [CrossRef]
- Jalali-Naini, S.G.; Shafiee, M. Joint determination of price and upgrade level for a warranted second-hand product. Int. J. Adv. Manuf. Technol. 2011, 54, 1187–1198. [Google Scholar] [CrossRef]
- Shafiee, M.; Chukova, S.; Yun, W.Y.; Niaki, S.T.A. On the investment in a reliability improvement program for warranted second-hand items. IIE Trans. 2011, 43, 525–534. [Google Scholar] [CrossRef]
- Shafiee, M.; Finkelstein, M.; Chukova, S. On optimal upgrade level for used products under given cost structures. Reliab. Eng. Syst. Saf. 2011, 96, 286–291. [Google Scholar] [CrossRef]
- Shafiee, M.; Chukova, S. Optimal upgrade strategy, warranty policy and sale price for second-hand products. Appl. Stoch. Models Bus. Ind. 2013, 29, 157–169. [Google Scholar] [CrossRef]
- Su, C.; Wang, X. Optimizing upgrade level and preventive maintenance policy for second-hand products sold with warranty. J. Risk Reliab. 2014, 228, 518–528. [Google Scholar] [CrossRef]
- Kim, D.-K.; Lim, J.-H.; Park, D.H. Optimal maintenance level for second-hand product with periodic inspection schedule. Appl. Stoch. Models Bus. Ind. 2015, 31, 349–359. [Google Scholar] [CrossRef]
- Liao, B.; Li, B.; Cheng, J. A warranty model for remanufactured products. J. Ind. Prod. Eng. 2015, 32, 551–558. [Google Scholar] [CrossRef]
- Otieno, W.; Liu, Y. Warranty analysis of remanufactured electrical products. In Proceedings of the 2016 International Conference on Industrial Engineering and Operations Management, Detroit, MI, USA, 23–25 September 2016; pp. 734–743. [Google Scholar]
- Alqahtani, A.Y.; Gupta, S.M. Warranty as a marketing strategy for remanufactured products. J. Clean. Prod. 2017, 161, 1294–1307. [Google Scholar] [CrossRef]
- Kim, D.-K.; Lim, J.-H.; Park, D.-H. Optimization of post-warranty sequential inspection for second-hand products. J. Syst. Eng. Electron. 2017, 28, 793–800. [Google Scholar]
- Darghouth, M.N.; Chelbi, A.; Ait-kadi, D. Investigating reliability improvement of second-hand production equipment considering warranty and preventive maintenance strategies. Int. J. Prod. Res. 2017, 55, 4643–4661. [Google Scholar] [CrossRef]
- Darghouth, M.N.; Chelbi, A. A decision model for warranted second-hand products considering upgrade level, past age, preventive maintenance and sales volume. J. Qual. Maint. Eng. 2018, 24, 544–558. [Google Scholar] [CrossRef]
- Tang, J.; Li, B.-Y.; Li, K.W.; Liu, Z.; Huang, J. Pricing and warranty decisions in a two-period closed-loop supply chain. Int. J. Prod. Res. 2019, 58, 1688–1704. [Google Scholar] [CrossRef]
- Zhu, X.; Yu, L. The impact of warranty efficiency of remanufactured products on production decisions and green growth performance in closed-loop supply chain: Perspective of consumer behavior. Sustainability 2019, 11, 1420. [Google Scholar] [CrossRef] [Green Version]
- Cao, K.; Xu, B.; Wang, J. Optimal trade-in and warranty period strategies for new and remanufactured products under carbon tax policy. Int. J. Prod. Res. 2020, 58, 180–199. [Google Scholar] [CrossRef]
- Shafiee, M.; Chukova, S.; Saidi-Mehrabad, M.; Niaki, S.T.A. Two-dimensional warranty cost analysis for second-hand products. Commun. Stat. Theory Methods 2011, 40, 684–701. [Google Scholar] [CrossRef]
- Su, C.; Wang, X. Optimal upgrade policy for used products sold with two-dimensional warranty. Qual. Reliab. Eng. Int. 2016, 32, 2889–2899. [Google Scholar] [CrossRef]
- Su, C.; Wang, X. Modeling flexible two-dimensional warranty contracts for used products considering reliability improvement actions. J. Risk Reliab. 2016, 230, 237–247. [Google Scholar] [CrossRef]
- Alqahtani, A.Y.; Gupta, S.M. Evaluating two-dimensional warranty policies for remanufactured products. J. Remanufacturing 2017, 7, 19–47. [Google Scholar] [CrossRef] [Green Version]
- Wang, Y.; Liu, Y.; Liu, Z.; Li, X. On reliability improvement program for second-hand products sold with a two-dimensional warranty. Reliab. Eng. Syst. Saf. 2017, 167, 452–463. [Google Scholar] [CrossRef]
- Kijima, M.; Morimura, H.; Suzuki, Y. Periodical replacement problem without assuming minimal repair. Eur. J. Oper. Res. 1988, 37, 194–203. [Google Scholar] [CrossRef]
- Malik, M.A.K. Reliable preventive maintenance scheduling. AIIE Trans. 1979, 11, 221–228. [Google Scholar] [CrossRef]
- Brown, M.; Proschan, F. Imperfect Repair. J. Appl. Probab. 1983, 20, 851–859. [Google Scholar] [CrossRef]
- Shafiee, M.; Chukova, S.; Yun, W.Y. Optimal burn-in and warranty for a product with post-warranty failure penalty. Int. J. Adv. Manuf. Technol. 2014, 70, 297–307. [Google Scholar] [CrossRef]
- Luptácik, M. Mathematical Optimization and Economic Analysis; Springer: New York, NY, USA, 2010. [Google Scholar]
- Lv, Y.; Hu, T.; Wang, G.; Wan, Z. A penalty function method based on Kuhn–Tucker condition for solving linear bilevel programming. Appl. Math. Comput. 2007, 188, 808–813. [Google Scholar] [CrossRef]


| Product’s Maximum Lifetime | L = 10 Years, U = 10 (×105) Miles |
|---|---|
| Sale price of a new product | p0 = 2500 |
| Disposal or salvage value of a product | Csv = 100 |
| Parameters of the Beta distribution | a1= x, a2 = 1/y, α1 = 1, α2 = 1, β1 = 1, β2 = 1 |
| Parameters of the Weibull distribution | α3 = 1/0.345, α4 = 1/0.354, β3 = 2, β4 = 2 |
| Parameters of the upgrade action cost | cs = 10, cu = 500, ζ = 0.2, ψ = 0.25, φ = 0.25 |
| Parameters of the Uniform distribution | [0, 1] |
| Parameters of the Gamma function | λ = 1, ρ = 4 |
| Parameters of the demand function | k1 = 1011, ω = 1.15, µ = 1.15, k2 = 0.01 |
| Expected cost of a repair action at any point of time | cr = 100 |
| x = 1 | |||||||
|---|---|---|---|---|---|---|---|
| y = 0.5 | y = 1 | y = 2 | y = 2.5 | y = 3 | y = 3.5 | y = 4 | |
| ut* | 0 | 0.78 | 0.68 | 0.89 | 0.98 | 0.28 | 0.14 |
| us* | 0 | 0.03 | 1.93 | 2.49 | 2.96 | 3.49 | 3.89 |
| w1* | 0.80 | 2.86 | 1.90 | 2.14 | 2.18 | 1.38 | 0.95 |
| v1* | 9.47 | 8.15 | 6.06 | 4.06 | 3.17 | 3.00 | 2.10 |
| δu,w* | 4.05 | 2.08 | 1.38 | 1.49 | 1.40 | 1.87 | 0.83 |
| δpw* | 1.59 | 1.16 | 1.28 | 1.11 | 1.08 | 0.97 | 2.35 |
| cp | 1700 | 1300 | 900 | 785 | 700 | 633 | 580 |
| cu(x,y) | 10.03 | 178 | 393 | 417 | 418 | 303 | 250 |
| E[Nw (ut*, us*, w1*, v1*)] | 1.47 | 2.28 | 0.32 | 0.05 | 0.01 | −0.02 | −0.02 |
| E[cw (ut*, us*, w1*, v1*)] | 147 | 228 | 32 | 5.1 | 1.88 | −2.40 | −2.42 |
| E[pu,w (ut*, us*, w1*, v1*, δu,w*)] | 795 | 1257 | 1015 | 1053 | 1011 | 865 | 831 |
| E[P(ut*, us*, w1*, v1*, δu,w*)] | 2495 | 2557 | 1915 | 1839 | 1711 | 1498 | 1411 |
| E[Npw (ut*, us*, w1*, v1*)] | 9.63 | 11.8 | 8.39 | 8.71 | 8.40 | 7.60 | 7.67 |
| E[cpw (ut*, us*, w1*, v1*)] | 963 | 1183 | 839 | 871 | 840 | 760 | 767 |
| E[ppw (ut*, us*, w1*, v1*, δpw*)] | 2495 | 2557 | 1915 | 1839 | 1748 | 1498 | 1411 |
| d(E[P(ut*, us*, w1*, v1*, δu,w*)], E[ppw (ut*, us*, w1*, v1*, δpw*)]) | 1537 | 1452 | 2822 | 3098 | 3568 | 4962 | 5695 |
| E[Profitdealer (ut*, us*, w1*, v1*, δu,w*, δpw*)] | 3,334,949 | 3,230,301 | 4,702,092 | 4,956,658 | 5,356,424 | 6,468,434 | 6,992,316 |
| E[Ccustomer (ut*, us*, w1*, v1*, δu,w*, δpw*)] | 4990 | 5114 | 3831 | 3679 | 3460 | 2997 | 2823 |
Publisher’s Note: MDPI stays neutral with regard to jurisdictional claims in published maps and institutional affiliations. |
© 2022 by the authors. Licensee MDPI, Basel, Switzerland. This article is an open access article distributed under the terms and conditions of the Creative Commons Attribution (CC BY) license (https://creativecommons.org/licenses/by/4.0/).
Share and Cite
Baghdadi, E.; Shafiee, M.; Alkali, B. Upgrading Strategy, Warranty Policy and Pricing Decisions for Remanufactured Products Sold with Two-Dimensional Warranty. Sustainability 2022, 14, 7232. https://doi.org/10.3390/su14127232
Baghdadi E, Shafiee M, Alkali B. Upgrading Strategy, Warranty Policy and Pricing Decisions for Remanufactured Products Sold with Two-Dimensional Warranty. Sustainability. 2022; 14(12):7232. https://doi.org/10.3390/su14127232
Chicago/Turabian StyleBaghdadi, Esmat, Mahmood Shafiee, and Babakalli Alkali. 2022. "Upgrading Strategy, Warranty Policy and Pricing Decisions for Remanufactured Products Sold with Two-Dimensional Warranty" Sustainability 14, no. 12: 7232. https://doi.org/10.3390/su14127232
APA StyleBaghdadi, E., Shafiee, M., & Alkali, B. (2022). Upgrading Strategy, Warranty Policy and Pricing Decisions for Remanufactured Products Sold with Two-Dimensional Warranty. Sustainability, 14(12), 7232. https://doi.org/10.3390/su14127232