Review

Natural Source Zone Depletion (NSZD) Quantification Techniques: Innovations and Future Directions

by
Roya Pishgar
1,2,*,
Joseph Patrick Hettiaratchi
1 and
Angus Chu
1
1
Department of Civil Engineering, University of Calgary, Calgary, AB T2N 1N4, Canada
2
Associated Engineering, Calgary, AB T3G 0B4, Canada
*
Author to whom correspondence should be addressed.
Sustainability 2022, 14(12), 7027; https://doi.org/10.3390/su14127027
Submission received: 25 March 2022 / Revised: 5 May 2022 / Accepted: 18 May 2022 / Published: 8 June 2022

Abstract

:
Natural source zone depletion (NSZD) is an emerging technique for sustainable and cost-effective bioremediation of light non-aqueous phase liquid (LNAPL) in oil spill sites. Depending on regulatory objectives, NSZD has the potential to be used as either the primary or sole LNAPL management technique. To achieve this goal, NSZD rate (i.e., rate of bulk LNAPL mass depletion) should be quantified accurately and precisely. NSZD has certain characteristic features that have been used as surrogates to quantify the NSZD rates. This review highlights the most recent trends in technology development for NSZD data collection and rate estimation, with a focus on the operational and technical advantages and limitations of the associated techniques. So far, four principal techniques are developed, including concentration gradient (CG), dynamic closed chamber (DCC), CO2 trap and thermal monitoring. Discussions revolving around two techniques, “CO2 trap” and “thermal monitoring”, are expanded due to the particular attention to them in the current industry. The gaps of knowledge relevant to the NSZD monitoring techniques are identified and the issues which merit further research are outlined. It is hoped that this review can provide researchers and practitioners with sufficient information to opt the best practice for the research and application of NSZD for the management of LNAPL impacted sites.

1. Introduction

Natural source zone depletion (NSZD) includes natural loss of light non-aqueous phase liquid (LNAPL) hydrocarbon contamination in oil spill sites. With the current focus of the global market on fossil fuel as the main source of energy [1], oil spills are inevitable. Oil spills have been happening from the 1900s [2,3,4], when a gradual shift from coal to oil consumption occurred [5], to this date [6,7]. For example, South Korea suffers from over 300 cases of marine oil spill incidents annually [8]. On 21 July 2016, a damaged Husky Energy pipeline (16 TAN line) resulted in leakage of 225 m3 heavy crude oil, of which about 40% ended up in the North Saskatchewan River [7].
Management of oil spill sites cannot be ceased even after a major shift to renewable sources has happened. Evidences show that petroleum hydrocarbon (PHC) contamination lasts for decades to over a century [3,4,9,10,11,12]. A zero-order NSZD rate model (The Glide Path Model developed by [13]) suggested that on average, LNAPL longevity can range 35 to 105 years, with plus or minus factors of 2 and ½ respectively [13]. Stable isotope analysis estimated a minimum life expectancy of 110 years for an oil plume near Bemidji, Minnesota [14].
Compared to the conventional “active” remedial techniques, NSZD can be an efficient and sustainable soil and groundwater bioremediation alternative. Some examples of active systems include: excavation (dig and haul, D&H), skimming, multi-phase extraction (MPE), water flooding, surfactant-enhanced subsurface remediation (SESR), air sparging/soil vapor extraction (AS/SVE), physical or hydraulic containment, in situ chemical oxidation, in situ soil mixing (stabilization) and steam injection [15,16]. These remediation strategies are typically costly, energy intensive and environmentally disruptive [17] and often leave behind significant LNAPL residues [18]. More importantly, they are generally associated with large greenhouse gas (GHG) emissions. Clean-up of 1 kilogram (kg) of soil and groundwater contaminants using these methods can emit up to 5 and 130 tonnes of CO2 to the atmosphere, corresponding to geometric means of 0.015 and 1.3 tonnes, respectively [19]. To put it into context, in 2019, about one (0.975) billon kg of toxic chemicals was released into land due to industrial activities in the United States (U.S.) only [20]. The issue is compounded given the consistency in release (e.g., substance release of 1.045 billion kg happened in the U.S. about ten years earlier, in 2010 [20]) as well as the persistence of PHC contamination.
The NSZD is a passive LNAPL bioremediation technique; hence, it does not contribute more to GHG emissions than what LNAPL contaminated sites are already emitting to the atmosphere. The NSZD is mainly a method of monitoring the current CO2/heat emissions and correlating these emissions stoichiometrically with LNAPL decomposition in the subsurface, rather than actively interfering with the LNAPL removal. As such, developing the knowledge and utilizing NSZD technique can closely tie into Sustainable Development Goal (SDG) #13-Climate Change. More specifically, study and application of NSZD bioremediation technique can meet one of the objectives of SDG #13, “improvement of education and institutional capacity on climate change mitigation, adaptation, impact reduction” [21].
Since NSZD seems to be a less expensive remediation technique compared to active methods, it can help to reinforce the capacity of institutions, including governments, businesses and non-governmental groups involved in remediation, decommissioning and restoration research and industry, in ways that they can improve and use the technique, as well as plan and manage LNAPL sites cost effectively.
The NSZD consists of a series of natural processes (refer to Section 2 for further information), with minimal environmental footprints and diverse desirable impacts on the LNAPL body, including decreasing LNAPL mass, saturation and mobility, shortening LNAPL longevity and altering LNAPL composition [22]. Depending on spill magnitude, site conditions and regulatory requirements, the NSZD can either help to reduce the deployment time of active remedial techniques or can be completely substituted for these methods [23]. Although NSZD is an ongoing process in almost all LNAPL release sites, caution must be taken when considering it as the sole or primary remediation strategy. Careful assessment is required to determine if the NSZD occurring at the site is effective enough to meet the regulatory objectives or if it requires the support of auxiliary techniques [24].
This natural phenomenon has certain characteristic features (see Section 2) that can serve as NSZD fingerprints and be surrogates for the quantification of NSZD rate (i.e., rate of bulk LNAPL mass depletion; see Section 2.2 for more information) [22]. The question is how to collect NSZD data with the highest accuracy (close to true values) and precision (reproducible data) in the most cost-effective way, to ensure that continuous monitoring of NSZD is feasible, efficient and economical. Yearlong data collection is critical given the temporal (seasonal and diurnal) and spatial (vertical and horizontal) variability of NSZD rates [25,26] for numerous, inherent reasons (which are discussed in this paper). When NSZD is used as the primary or sole remedial technique, analyzing the longevity and the composition of LNAPL body that both can be estimated by NSZD rates is an integral part of the remediation strategy [22].
This review highlights the most recent trends in technology development for NSZD data collection and rate estimation. The objectives of this literature review and analysis were to provide a state of the knowledge revolving around the available NSZD rate quantification techniques, including an overview of the underlying NSZD concept, definition of NSZD rate, influencing factors and operational and technical advantages and limitations of the techniques. Discussions revolving around two techniques, “CO2 trap” and “thermal monitoring”, are expanded (see Section 4 and Section 5, respectively), due to particular attention to them in the current industry. The gaps of knowledge relevant to the NSZD monitoring techniques are identified and the issues which merit further research are outlined. A few items were out of the scope of this article including: (i) critical review of the underlying factors and providing thorough explanation of the underlying phenomena; (ii) analyzing techno-economic aspects of NSZD rate quantification techniques; (iii) bibliographic analysis of the topic. These are included in the concluding remarks (Section 6) as a few additional directions for future studies.
A review article with this scope sounds to be an important and a much-needed addition to the current literature. The NSZD is an emerging technology at embryonic stage and the literature currently lacks a document that can provide the audience with a snapshot of the available techniques developed for resolving NSZD rates and the associated gaps of knowledge. The audience of this paper are researchers from Research and Development (R&D) businesses and academia as well as practitioners from remediation and reclamation industry who are interested to learn more about and use the NSZD for regulatory advisory and services. The NSZD has the potential to be used as an effective and sustainable oil spill management technique. However, its rate should be quantified reliably, accurately and precisely, to avoid the risk of regulatory non-compliance resulted from inaccurate rate estimations. Identifying and discussing the gaps of knowledge pertaining NSZD rate quantification is prudent to give direction to academicians for further research and to increase the acceptance of this emerging technique in the industry. It is hoped that this review article can provide researchers and practitioners with enough information to opt the best practice for the research and application of this sustainable LNAPL management technique.

2. Overview of NSZD

The current literature carries a wealth of information about NSZD concept, microbiology and mechanisms [22,25,27,28,29,30,31,32,33,34,35,36,37,38], reviewed by a number of researchers [10,25,36,39,40]. As such, this section only intends to provide an overview of these NSZD aspects, to give context to the next discussions pertaining to NSZD rate quantification techniques. For further information, the readers may refer to the sources introduced above and cited in the following sub-sections.

2.1. NSZD Conceptual Model

Figure 1 illustrates NSZD conceptual model which has been developed based on observations and efforts of a number of researchers [25,27,33,35,40,41,42,43,44,45].
According to evidences gathered about microbial community structure and geochemical properties of a shallow hydrocarbon-contaminated aquifer at a former petroleum refinery, Irianni-Renno et al. [41] identified four distinct zones at an LNAPL impacted subsurface:
  • An aerobic, low LNAPL mass zone at the upper part of unsaturated (vadose) zone, extending to ground surface. This is where only soil respiration and modern carbon (modern-C) generation occurs (Region I in Figure 1);
  • A moderate to high LNAPL mass zone in the middle of the vadose zone where low-oxygen environment transitions to an anaerobic condition (Region II in Figure 1);
  • An anaerobic, high LNAPL mass zone, encompassing the lower part of the vadose zone including capillary fringe and smear zone and the upper portion of saturated zone (Region III in Figure 1);
  • An anaerobic, low LNAPL mass zone below LNAPL plume (Region IV in Figure 1).
The term “source zone” was coined by Amos et al. [27] referring to the subsurface area including saturated and unsaturated zones where free-phase oil is present (Regions II & III in Figure 1).
Natural loss of LNAPL occurs in these regions through diverse physicochemical and biogeochemical processes, including volatilization, dissolution and most importantly biodegradation. The extent to which each of these processes occurs greatly depends on geologic and microbial conditions of each region [11,41,46]. LNAPL composition is an important influencing factor as well [39]. Equilibrium simulations conducted on water–oil and air–water systems indicated that volatilization and biodegradation were dominant removal pathways for C6–C9 n-alkanes and cyclohexanes and dissolution and biodegradation were principal removal pathways for the other PHCs [9].
The NSZD begins with methanogenesis and anaerobic reduction of nitrate (NO3), iron (Fe3+) or sulfate (SO42−), if present, in saturated and anaerobic parts of vadose zones (Regions III & IV). A syntrophic consortium of bacteria and archaea (fermenters and methanogens) converts hydrocarbons to acetate (CH3OOH) and then methane (CH4) and carbon dioxide (CO2) [11,41,46]. Fermenters convert LNAPL to acetate (reaction 3) which can be taken up by acetate-using methanogens (reaction 4, known as acetotrophic or acetoclastic methanogenesis). Syntrophic organisms oxidize acetate as well, converting it to hydrogen (reaction 5) which serves hydrogenotrophic methanogenesis (reaction 6) as the main substrate [36].
Biogenic gases generated through biodegradation (i.e., CH4 and CO2) are released to the gaseous phase of the subsurface through two fundamental phenomena: direct outgassing and degassing [25,44]. Direct outgassing pertains to less soluble yet biodegradable PHCs (e.g., tri- and tetra-methylbenzenes, naphthalenes and cyclohexanes [27]). Due to low solubility, these hydrocarbons are most likely physically isolated and distant from the groundwater body and are removed through a distinct pathway in soil pore spaces adjacent to the entrapped oil, which is referred to as “oil-contact biodegradation” and is defined as “biodegradation near the oil without significant migration”. The gaseous by-products of oil-contact biodegradation are emitted directly to the gaseous phase, without an intermediate dissolution step into the bulk aqueous body (i.e., the groundwater) [44]. The mechanisms of PHC uptake by microorganisms in the pore spaces are described by Hua and Wang [40] (in particular, refer to Figure 3 of Hua and Wang [40]). Briefly, to take up hydrophobic hydrocarbons, microorganisms “pseudo-solubilize” the hydrocarbons to pass them through their membranes. Pseudo-solubilization of hydrocarbons is performed by producing biological surfactant molecules (in short, biosurfactants), to emulsify hydrocarbons and produce micro-droplets suitable for microbial assimilation [40].
Degassing, in contrast, includes gas–liquid partitioning and bubble formation in the groundwater. Degassing is followed by ebullition which happens when gas saturation increases, bubbles enlarge and buoyancy outcompetes capillary forces [27]. While gas release in the pore spaces in the smear zone happens mainly through direct outgassing, gas release in the saturated zone can happen through both mechanisms [25,44]. Direct outgassing in groundwater is due to the hydrophobic nature of LNAPL which positions them atop the water table, exposing them to the gaseous phase of the aquifer [44].
Garg et al. [25] argues that direct outgassing is different from degassing. While this is true at macroscopic level, these two phenomena seem to share the same principles at microscopic levels. In smear zone, microorganisms reside either in the water droplets entrapped inside the oil patches or the water entrapped in the pore spaces which surrounds the oil droplets/patches. With the help of advanced analytical techniques (e.g., nuclear magnetic resonance and Fourier transform ion cyclotron resonance mass spectrometry), it is found that the microorganisms remain metabolically active in miniscule water droplets (1 to 3 μL) encased within oil [43]. In either case, biogenic gases must partition and bubble out of the liquid phase whether it is water or oil.
Dissolution of CH4 and CO2 causes exceeding local liquid-phase gas solubilities, which results in bubble formation, ebullition of gas bubbles and upward gas fluxes [25,46]. Thereafter, advection and diffusion transport the released gases toward the ground surface [47]. According to Irianni-Renno et al. [41], upward flux of CH4 is most likely the cause of anaerobic zone formation in the vadose zone because it limits downward flux of O2. As depicted in Figure 1, CH4 and O2 fronts converge at the plane ZA/A in the subsurface. In the presence of oxygen diffused into the subsurface (i.e., O2 influx), aerobic methanotrophic bacteria oxidize CH4 as the source of carbon and energy and O2 depletion occurs (reaction 1). Due to low solubility, CO2 produced through methanogenesis and methane oxidation diffuses upward to escape to the atmosphere (i.e., CO2 efflux) [41].
Aerobic processes (reaction 2) can partially contribute to PHC degradation and O2 depletion. Oxygen can find its way into the subsurface through surface recharge of oxygen-bearing meteoric waters [48] and directly from the atmosphere in gaseous form. Highly soluble benzene, toluene, ethylbenzene and the xylenes (BTEX) and less soluble PHCs such as tri- and tetra-methylbenzenes, naphthalenes and cyclohexanes are susceptible to aerobic and anoxic biodegradation [49]. Nonetheless, in NSZD sites where a significant mass of LNAPL exists, the dominant long-term PHC degradation pathway is supposed to be methanogenesis [27]. Methanogenesis was estimated to contribute 16% to PHC degradation in 38 sites, indicating the general importance of anaerobic degradation in PHC contaminated sites [50]. It agreed with the laboratory study of Salminen et al. [51] which suggested that anaerobic processes played key roles in PHC degradation at a boreal, lightweight fuel and lubrication oil contaminated site. However, it seems that biodegradation can only degrade lighter hydrocarbons. Only 10% of n-alkanes that were depleted through aerobic and anaerobic processes belonged to a C15–C40 group, while ~90% were lighter n-alkanes with shorter carbon chains (C10–C15) [51]. The methanogenic process starts with the degradation of longer chain, biodegradable n-alkanes, working through to the degradation of shorter chain consecutively. Whereas, the aerobic degradation sequence is the opposite [28]. Similar to long chain PHCs, branched alkanes are refractory, tending to remain in source zone for a longer period than n-alkanes [52,53]. Garg et al. [25] suggest that aerobic degradation of PHC is likely an important process in the vadose zone of sites with recent spills. On the contrary, at sites with relatively old releases, an anaerobic core forms in the vadose zone [25]. Aerobic processes are likely predominant in shallow depths (e.g., up to 1.4 m below ground surface, bgs) on NSZD sites [41] where major oxygen sink in an unsaturated zone is linked to methane oxidation [27].
Aerobic and anaerobic degradations of LNAPL and the associated metabolites (e.g., methane oxidation) produce heat ( symbol in Figure 1). Biogenic heat can be used as a signature of these exothermic processes occurring at NSZD sites (read more in Section 5). Heat produced through aerobic methane oxidation and aerobic LNAPL degradation varies between 45–50 KJ/g, while anaerobic LNAPL degradation generates 300–800 times less energy (0.06–0.16 KJ/g), depending on the representative PHC chosen for conceptual model construction. In thermal monitoring technique (read more in Section 4.4), this heat is measured and stoichiometrically translated to NSZD rate [11,12,23,25,41,46].
It should be noted that what is described here only constitutes the components of a general model. Prior to customizing this model for any NSZD site, it is imperative to develop a site-specific LNAPL Conceptual Site Model (LCSM) through careful assessment of the site geology (soil type, soil particle size, subsurface fractures, stratigraphy, etc., which can limit or enhance LNAPL migration in the vadose zone), hydrostratigraphy (groundwater characteristics, such as flow pattern, capillary fringe and seasonal water table fluctuations), LNAPL spatial distribution (horizontal extent, vertical extent, smear zone, dissolved-phase plume and vapor plume) and residual LNAPL mass and composition [54,55]. Site-specific LNAPL fingerprinting and LCSM development is a critical step before embarking NSZD technique for LNAPL site management, as LNAPL compositional changes (i.e., transitioning between different dominant classes of chemicals) influence short-term NSZD rates by shifting between dominant processes (i.e., volatilization, dissolution and biodegradation) at different site stages, which consequently dictate long-term NSZD rates, overall LNAPL mass loss and the transition points [39]. Other information that should be considered for LCSM development include: (i) potential exposure pathways and receptors; (ii) potentials of explosivity; (iii) LNAPL recoverability [54,55], which define the longevity of risk factors. As an example, the development of the LCSM model is practiced in Sihota et al. [26].

2.2. Definitin of NSZD Rate

NSZD rate is defined as the rate of bulk LNAPL mass depletion [22], expressed as LNAPL volume degraded per unit area per year (in U.S. gallons/acre/year or liters/hectare/year) [56]. NSZD rate is affected by many factors, which are discussed in the next section. To understand how these factors affect NSZD rates, a distinction should first be made between actual and apparent NSZD rates.
Microbial NSZD degradation rate is defined as “actual NSZD rate” [13,46]. The sequence of anaerobic methanogenesis and aerobic methane oxidation is the major PHC biodegradation pathway at NSZD sites, which seems to contribute over 99% to overall LNAPL volume degraded per unit area per year. The remainder (<1%) is attributed to biodegradation capacity of electron acceptors, such as oxygen, nitrate, iron and sulfate. Methanogenesis is the rate-limiting process and thus it is supposed that the actual NSZD rate is roughly equal to the methanogenesis rate [25].
There is a time lag (5–7 months) between the occurrence of the actual NSZD rate and the manifestation of NSZD as surficial CO2 efflux. This is attributed to CO2 travel time in the subsurface [26]. This concept is extrapolated to thermal monitoring quantification technique as well, assuming that a gap also exists between the actual rate and thermal expression of NSZD due to heat transport mechanisms [46]. As such, an additional parameter, “apparent NSZD rate”, is defined to account for this delay [26,46]. Drawing from the information in the literature [25,26,46], apparent NSZD rate can be defined as the rate associated with a measurement performed at a certain time with a certain quantification technique.

2.3. Factors Affecting NSZD Rates

Factors regulating actual and apparent NSZD rates are shown in Figure 2 and are divided into three categories:
  • Factors regulating actual NSZD rate;
  • Factors regulating apparent NSZD rate;
  • Factors regulating actual and apparent NSZD rates simultaneously.
Figure 2 depicts a brief description of these factors and how they regulate NSZD rates. Appendix A provides the state of the knowledge about these factors available in the current literature. The readers interested in additional information are referred to this Appendix A.
It seems that interactions exist between these factors. These interactions are shown in Figure 3 with dash lines. The anticipated principles of these interactions are underpinned in the discussions provided in Appendix A.
The entangled effects of factors can explain temporal and spatial heterogeneity in the subsurface, which results in variability of the NSZD rate from site to site, spot to spot (in a single site) or even time to time (at one spot). The degree of subsurface heterogeneity and NSZD rate variability depends on how many factors are interacting at a certain time in a single location. This emphasizes the challenges that one might face in driving site-specific LCSM and NSZD conceptual models. If the effects of factors affecting apparent NSZD rate are minimized, actual and apparent NSZD rates converge and the accuracy of the relevant quantification techniques improve.

2.4. Microbiology of NSZD Sites

Understanding microbial ecology of NSZD sites is critical for optimizing LNAPL bioremediation plans and developing NSZD conceptual and LNAPL longevity models [41]. Many factors affect microbial NSZD degradation rates (i.e., actual NSZD rate; see Section 2.2 for the difference between actual and apparent NSZD rates) which in turn regulates LNAPL longevity. Those factors are thoroughly discussed in Section 2.2.

2.4.1. Microbial Ecology in Recent and Aged Oil Spill Sites

During the early stages of petroleum release, indigenous microbial communities are most likely not equipped with the metabolic tools (e.g., enzymatic system, bio-surfactants producing abilities, etc.) or physical arrangements (e.g., biofilm structure, physical distance from LNAPL body) to decompose LNAPL. Over time, these abilities are developed through shifting the microbial community structure [13,62,63]. The rate of acclimation greatly depends on: (i) LNAPL composition; for example, the degradation of paraffins (n-alkanes) and non-n-alkanes (branched and aromatic constituents) with carbon numbers of C10 and less are metabolically preferred to non-n-alkanes with C11 and more [11]; (ii) inhibition by certain LNAPL components (e.g., gasoline [55]) and other sources (e.g., volatile hydrocarbons (VHCs) and acetate [25]); (iii) temperature; seasonal fluctuations in temperature equal to or greater than 4 °C can affect NSZD rates [64]. Due to subsurface temperature changes caused by LNAPL degradation, NSZD can be a self-stimulatory process [13,64]. Hence, the acclimation phase can last days, weeks, or even months based on site-specific characteristics [13], during which hydrocarbon oxidation is concomitant with microbial growth [52].
NSZD mathematical simulations are mostly based on a biofilm concept, with a few models considering motile or suspended microorganisms [39]. Microbial agglomeration in porous media (e.g., subsurface soil and rocks and riverine hyporheic zones) has been observed and studied, albeit mostly without the NAPL phase [65,66,67,68]. Mapping physiologic zones of an LNAPL plume suggested that only 15% of the total population was in suspended form [69]. Through scanning electron microscopy (SEM), extensive biofilm development was observed on the mineral surfaces of an LNAPL contaminated site adjacent to a former refinery in Carson City, Michigan [10,70]. In a laboratory experiment, biofilm development was observed in a bio-stimulated column which was packed with 20–30 mesh silica sand and fed with nutrient broth and diesel fuel. Bio-stimulation included seeding the column with a mixed bacterial culture that was retrieved from a refinery contaminated site and had hydrocarbon-degrading strains from Variovorax and Stenotrophomonas genera [65].
Biofilm formation reduces soil porosity and alters soil tortuosity due to biofilm growth and sloughing (pore clogging). This problem is compounded by the presence of LNAPL which have adverse effects on electrical conductivity and permittivity of soil. LNAPL have high electrical resistivity and act as insulators (0.001 mS/m) when compared to highly conductive, natural formation fluids, such as freshwater (0.1–1 mS/m). LNAPL also show low permittivity (e.g., 2–3) relative to those of clean water (~80) and water-saturated sands (20–30) [10,63]. Spatial distribution of attached microorganisms influences the structure of interfaces, the connectivity of pore spaces and the bulk geometric properties of the medium [67]. Interfacial properties of the sediment grains are altered by microbial colonization and biofilm development, production of extracellular polymeric substances (EPS) and formation and precipitation of mineral complexes (e.g., metal sulfides) due to microbial activity [71,72]. Biofilm distribution can be either continuous or patchy (in the latter form, they mainly accumulate in pore throats), depending on physical, chemical and biological properties and history of the medium [73,74,75]. In an LNAPL impacted subsurface, site history can be divided into two fundamental eras: before and after LNAPL release. The combined effects of the LNAPL presence and biofilm formation modify subsurface mass and momentum transport dynamics, potentially leading to biofilm isolation from LNAPL plume [13,63]. As a consequence, not only geologic features but also microbial characteristics of biofilm-dominated zones in an LNAPL contaminated subsurface can be distinct from those areas conquered by motile, free-floating microorganisms which can actively “chase” food regardless of flow directions or may precipitate to the bottom of the aquifer due to Stokes law [39,63].
In the mid and late stages of LNAPL release, thermodynamic principles and diauxie may govern microbial ecology of NSZD sites. Coined by Jacques Monod, the term “diauxie” refers to preferential microbial metabolism in a dual-substrate medium which promotes a relatively fast and less energy-intensive growth pathway [13,62]. When more than two substrates are available, microbial culture encounters a “multiauxic” situation [76]. In multiauxic media, a cascade of reactions happens from the most to the least thermodynamically favorable substrate [13,62,77,78]. The example provided above about the comparison between paraffins and non-n-alkenes with C11 and more is relevant to this concept as well. Thermodynamics of NSZD sites are discussed in the next section.

2.4.2. NSZD Thermodynamics

Among possible metabolic pathways in an LNAPL contaminated subsurface (Table 1), methanogenesis is the least thermodynamically favorable because as demonstrated by ΔGro values in Table 1, it yields least energy for cell growth. Due to limited concentrations of electron acceptors in most contaminated zones (see Table 2.3 in Wiedemeier et al. [79]), reductive pathways associated with these electron acceptors most likely leave a significant portion of LNAPL unprocessed for methanogenesis. It is anticipated that methanogenesis is responsible for depletion of up to two orders of magnitude greater PHC degradation than it is typically estimated by monitored natural attenuation (MNA) models (e.g., BIOSCREEN model [80]). The MNA is the predecessor of NSZD and only considers electron-acceptor-mediated degradation of dissolved BTEX [25].
If we base the discussion on thermodynamic principles, methanogenesis can theoretically begin when all electron acceptors (i.e., oxygen, nitrate, manganese, iron and sulfate) are depleted [78], which might make the impression that methanogenesis can only occur in mature oil spill sites. However, recent studies showed that syntrophic PHC degradation can proceed even in the presence of electron acceptors such as nitrate, Fe(III) and sulfate [36,82,83,84]. Using most probable number (MPN) technique, Bekins et al. [69] determined population distributions of six physiologic types (i.e., aerobes, denitrifiers, iron-reducers, heterotrophic fermenters, sulfate-reducers and methanogens) in the anerobic portion of an LNAPL plume. Culturable methanogenic and iron-reducing bacteria were found together, albeit with a strong inverse relation between their populations. These observations anticipated that the methanogenic condition evolved transitioning from iron-reduction to methanogenic condition through more than 20 years of contamination [69]. Finding iron-reducing and methanogenic organisms usually together [69,85,86] suggests that the associated processes can be active simultaneously [69,87].

2.4.3. Microbial Community Structure and Syntropy

The methanogenic process is not as straightforward as Equation (7) (see Section 2.4.2). In anaerobic groundwater aquifers, like any other anaerobic ecosystem, syntropy exists to ensure microbial consortia perform as a single catalytic unit for the community’s common benefit [36]. According to metagenomic and metaproteomic analyses, Pelotomaculum first degrades terephthalate via decarboxylation, producing intermediates such as acetate and butyrate. Secondary syntrophs (Candidatus Cloacamonas acidaminovorans affiliated with Thermotogae and OP5) oxidize butyrate to acetate and H2. Butyrate oxidizers can also be fed by Caldiserica (WWE1) which fixes H2/CO2 to butyrate. Thereafter, methanogens such as Methanosaeta and Methanolinea produce CH4 and water from processing H2 and CO2 [88,89]. Although terephthalate is not a hydrocarbon, its methanogenic degradation can be used as a model to shed light on possible PHC contamination pathways in a contaminated subsurface [36].
Studying soil core at 15-cm intervals, Irianni-Renno et al. [41] demonstrated that LNAPL degradation was mediated by the syntrophic relation of fermenters and methanogens in Region III and methanogens and sulfate-reducing bacteria in Region IV (refer to Figure 1 to see these Regions). This supports Bekins et al. [69] who observed that methanogenic and iron-reducing organisms coexist in anaerobic LNAPL plume (see Section 2.4.2). It posited that anaerobic benzene degradation completes through unusual, complex syntropies formed between the microorganisms present in iron-reducing enrichment cultures [86,90], such as Peptococcaceae and Desulfobulbaceae [86] and Cryptanaerobacter and Pelotomaculum phylotypes [91]. Benzene degradation can happen under denitrifying conditions in enrichment dominated by syntrophic Peptococacceae and Betaproteobacteria species [92]. Gram-positive Peptococcaceae species are closely related to clones globally recovered from contaminated aquifers [86].
Syntropy can exist at deeper levels, i.e., among methanogens. Syntrophaceae spp. (e.g., Syntrophus and Smithella) are thought of as key players in syntrophic hydrocarbon metabolism, as they are frequently found in PHC impacted environments [93,94]. Molecular analysis of PHC plume at a former refinery in Carson City, Michigan, indicated that 21% and 32% of the microbial communities which were respectively isolated from free-phase and dissolved-phase contaminated zones had over 97% similarity to Syntrophus sp. strain B2 from Deltaproteobacteria subdivision [95]. In a shallow PHC contaminated aquifer, Syntrophus- and Methanosaeta-related species were respectively dominant bacterial and archaeal organisms below the water table [41]. Members of the Syntrophus genus bridge hydrocarbon fermentation and hydrogenotrophic methanogenesis through converting fermentation by-products (propionate, acetate and butyrate) to CO2, H2 and formate [95]. Callaghan et al. [96] studied Desulfatibacillum alkenivorans AK-01 as a model organism for anaerobic alkane biodegradation due to its versatile metabolism (e.g., sulfate reduction and n-alkane biodegradation via fumarate). In the lack of sulfate, this strain could produce methane from n-hexadecane when cocultured with H2/formate-using methanogens. Its genetic signatures suggested that interspecies formate transfer might play a critical role in the syntrophic pairing of this strain and other species [96]. Syntrophus buswellii and Syntrophus gentianae are characterized as bacteria catalyzing syntrophic oxidation of aromatic compounds (e.g., benzoate, crotonate, gentisate, hydroquinone) via interspecies hydrogen transfer [57]. In a binary mixed culture composed of Syntrophus gentianae and Methanospirillum hungatei, the former almost completely converted benzoate to acetate, methane and CO2, while the latter scavenged on hydrogen [57].
Microbial evidences suggest that temporal and spatial fluctuations of NSZD rates (refer to Garg et al. [25] and Sihota et al. [26] to see variable NSZD rates) are not necessarily rooted in the limitations or “inaccuracy” of NSZD rate quantification techniques, but are either inherent or caused by environmental conditions (see Section 2.3 and Section 3). Multiple methanogenic pathways may occur in an LNAPL impacted subsurface, with temporospatial preference for one over another due to many factors which cause variable microbial NSZD degradation rates over time and space. For instance, it is proposed that acetate depletion in PHC contaminated environments is mostly due to acetate oxidation coupled with hydrogenotrophic methanogenesis (reactions 5 and 6 in Figure 1), rather than acetotrophic methanogenesis (reaction 4 in Figure 1) [89,93,97,98]. High CO2 concentrations can disrupt this syntropy and shift the metabolic reactions towards acetotrophic methanogenesis [99]. Extrapolating from the dynamics of redox reactions in rumen fermentation dictated by the balance between hydrogen ions and H2 [100], it is thought that high H2 partial pressure can impose similar effects on fermentation pathways as high CO2. A variable CO2 concentration of 6–14 v/v% (the denominator is defined as overall vadose zone gases) has been observed in soil column over LNAPL body [26], which can be one of the many reasons for spatial heterogeneity of microbial community observed in LNAPL impacted areas. Temperature is another factor altering syntropic microbial relationships at NSZD sites. In a laboratory study, molecular analysis demonstrated that not only microbial composition but also microbial activity (i.e., biodegradation rates) shifted with temperature. One-year exposure to temperatures 4 and 9 °C ceased biogas generation and sulfate reduction took over. At temperatures 22 °C and 30 °C, dominant archaeal genera included Methanosaeta, Methanobacterium and Methanosarcina. Based on the presence of these species, it was inferred that acetoclastic methanogenesis was the main methane generation mechanism [64], with the possibility of hydrogenotrophic methanogenesis by Methanosarcina [101].
These implications are further supported by the findings of Allen et al. [95], where clone libraries of 16S rRNA gene sequences retrieved from four depths of a contaminated field site and two depths of an uncontaminated background site were examined. Correspondence analysis proposed vertical microbial gradients, composed of various aromatic hydrocarbon-degraders (e.g., Sphingomonas aromaticivorans and Brachymonas petroleovorans); syntrophic hydrocarbon-degrading, sulfate-reducing and dissimilatory iron-reducing species; large populations of methylotrophs and methanotrophs; and fermenting bacteria. This diverse microbial community contrasted with the background’s common soil microbiology (e.g., Acidobacteria and Actinobacteria). On a side note, this change in microbial structure was concomitant with a spectrum of geoelectrical properties at the examined area, suggesting that the evolution of microbial populations in a subsurface imposes strong effects on their geophysical surroundings. Multivariate statistical analysis revealed that a specific microbial culture composed of syntrophic δ- and ε-Proteobacteria caused elevated bulk electrical conductivity. This observation pinpointed that geoelectrical measurements may be used as a cost-effective monitoring tool for investigating the microbial ecology of remediation sites [95].

3. NSZD Rate Quantification Techniques

So far, four principal methods are developed to resolve NSZD rate, including concentration gradient (CG), dynamic closed chamber (DCC) and CO2 trap and thermal monitoring. The first three methods use either at-grade reactant gas fluxes (e.g., O2 [11]) or product gas fluxes (i.e., CO2) associated with LNAPL degradation as a surrogate for NSZD rate measurement. Thermal monitoring adopts biogenic heat as an NSZD signature.
The CG method is based on Fick’s law of diffusion and quantifies LNAPL mass loss due to volatilization and biodegradation. Nested gas probes in a soil column or multi-level samplers are used to develop vertical soil gas concentration profiles in the subsurface [23,29,47]. The DCC measures surficial CO2 effluxes and the associated device consists of a soil gas chamber which is placed at grade and seals over a soil collar. It is connected to an infrared gas analyzer (IRGA) which measures CO2 concentration accumulated in the chamber. An increase in CO2 in the chamber’s headspace is concomitant with an increase in absorption of infrared light and a decrease in light transmission which is correlated to CO2 accumulation. Using the in situ readings, CO2 efflux can be quantified [102]. The device and principles of CO2 trap and thermal monitoring are thoroughly discussed in detail in Section 4 and Section 5, respectively. The discussion about these two techniques is expanded due to particular interest in them in the current remediation and reclamation industry.
Advantages, limitations and niche applications of these methods are presented in a matrix presented in Table 2 and the supporting literature information is discussed in Appendix B.

4. Passive CO2 Trap: A Cost-Effective Technique

Due to simplicity and cost-effectiveness, use of CO2 trap for NSZD rate quantification is economically advantageous over other techniques presented in Section 3. Additionally, this method allows board-scale, replicated measurements for resolving not only NSZD rate but also natural ecosystem carbon exchange at a global scale [30]. As such, it is worth giving additional attention to details associated with its usage, such as device configuration, method accuracy and deployment conditions.

4.1. Components and Configurations

The main component of CO2 trap is an alkali chemical that CO2 is absorbed into. The predecessor of this method, which was mostly used for studying soil CO2 evolution in agricultural ecosystems, was equipped with a caustic solution, such as NaOH/BaCl2 and KOH (see [103] and the references therein). Porous alkaline solid (i.e., soda lime) has been used as a replacement for caustic solution [104,105], to eliminate handling, freezing and spillage of the liquid [105,106].
Soda lime is a variable mixture of sodium hydroxide (NaOH), calcium hydroxide (Ca(OH)2), water (~20 wt%) and in some cases potassium hydroxide (KOH) which forms (sodium, potassium and calcium) carbonates when reacting with CO2 [104]. Water is a crucial constituent [107] because, as shown in Equations (8)–(10), it initiates CO2 absorption reactions to form the different forms of carbonate [30].
CO 2 ( g ) +   H 2 O     H 2 CO 3
2 H 2 CO 3 + 2 NaOH + 2 KOH     Na 2 CO 3 +   K 2 CO 3 + 4 H 2 O  
2 Ca ( OH ) 2 +   Na 2 CO 3 +   K 2 CO 3   2 CaCO 3 ( s ) + 2 NaOH + 2 KOH
Soda lime should be placed in a confined space, like beneath a chamber, to capture gas emissions at grade. Two main configurations of CO2 trap used for NSZD rate estimation are proposed by McCoy [56] and Keith and Wong [30] (Figure 4). The McCoy model resulted in a patent in 2014 [108], which has been commercialized by E-Flux [109] and its performance has been compared to other NSZD rate quantification techniques [11,46,47]. This model is a cylindrical device composed of a Schedule 40 polyvinyl chloride (PVC), with internal diameter (ID) of 10 cm, surface area of 0.008 m2, height of 30 cm and rubber O-rings to create air-tight seals [56]. It is featured with two novel characteristics, incorporated into the design patented by Zimbron et al. [108]: (1) an unrestricted advective flow-through (in simpler terms, an open-top design); (2) top and bottom trap elements. It is supposed that the open-top design prevents interferences of concentration and/or pressure build up in the sealed chamber [56]. Two soda lime absorbent elements mounted at two cross sections of the pipe and each containing 50.0 g of granular soda lime convert gaseous CO2 to solid carbonate. While the bottom element absorbs the soil efflux, the top element prevents atmospheric “contamination” by intercepting air CO2. The trap is placed on a PVC receiver (typically 10-cm ID, or 20-cm ID for added sensitivity as it can increase the covered surface area [22]) which penetrates the soil a few centimeters (≤18 cm). To protect against precipitation, a cover made of a larger, perforated pipe (e.g., thin-wall PVC pipe with an ID of 15 cm) is integrated into the trap design [47].
The Keith and Wong [30] model is simpler than McCoy’s design. It is based on the configuration previously used in forestry studies [106]. This model is composed of a large, bowl-shape chamber, with dimensions shown in Figure 4b and a surface area of 0.08 m2. However, based on the researcher’s recommendations, dimensions are flexible as long as the chamber size is large enough to capture soil spatial heterogeneity. Granular soda lime (50 g, 2.4–4.8 mm diameter per granule, mesh size of 4–8) is exposed to CO2 efflux by placing it in a sufficiently wide, inert (e.g., glass) dish which provides a surface density of 0.06 g soda lime per cm2 of soil surface in chamber. A white color should be opted for the trap body, to reflect sunlight and minimize overheating. Reflective coating or a shield can be used instead as a more effective strategy. The chamber should penetrate the soil to 1 cm [30].
Both designs should be optimized to improve the method reliability. Based on preliminary experiments, Tracy [47] provided recommendations for optimizing the McCoy model, about sorbent mass, CO2 breakthrough from the bottom to the top element and height of the bottom sorbent element from the soil surface and insertion depth [47]. Method verification with respect to different influencing parameters was performed on the model developed by Keith and Wong [30]. However, in both cases, conclusive results were not achieved to optimize the design properly and comprehensively. Additionally, relative accuracy of these configurations is not known. This warrants further research, especially given that the Keith and Wong model has a closed top and a 10-time larger surface area than that of the McCoy model. These differences can impose negative or positive influence on precision and accuracy of CO2 efflux measurements (see Section 4.2). Method verification and optimization are a must, considering that many factors which are discussed in Section 2.3 influence surface fluxes. Chamber design and installation can cause deviating from natural environmental conditions.

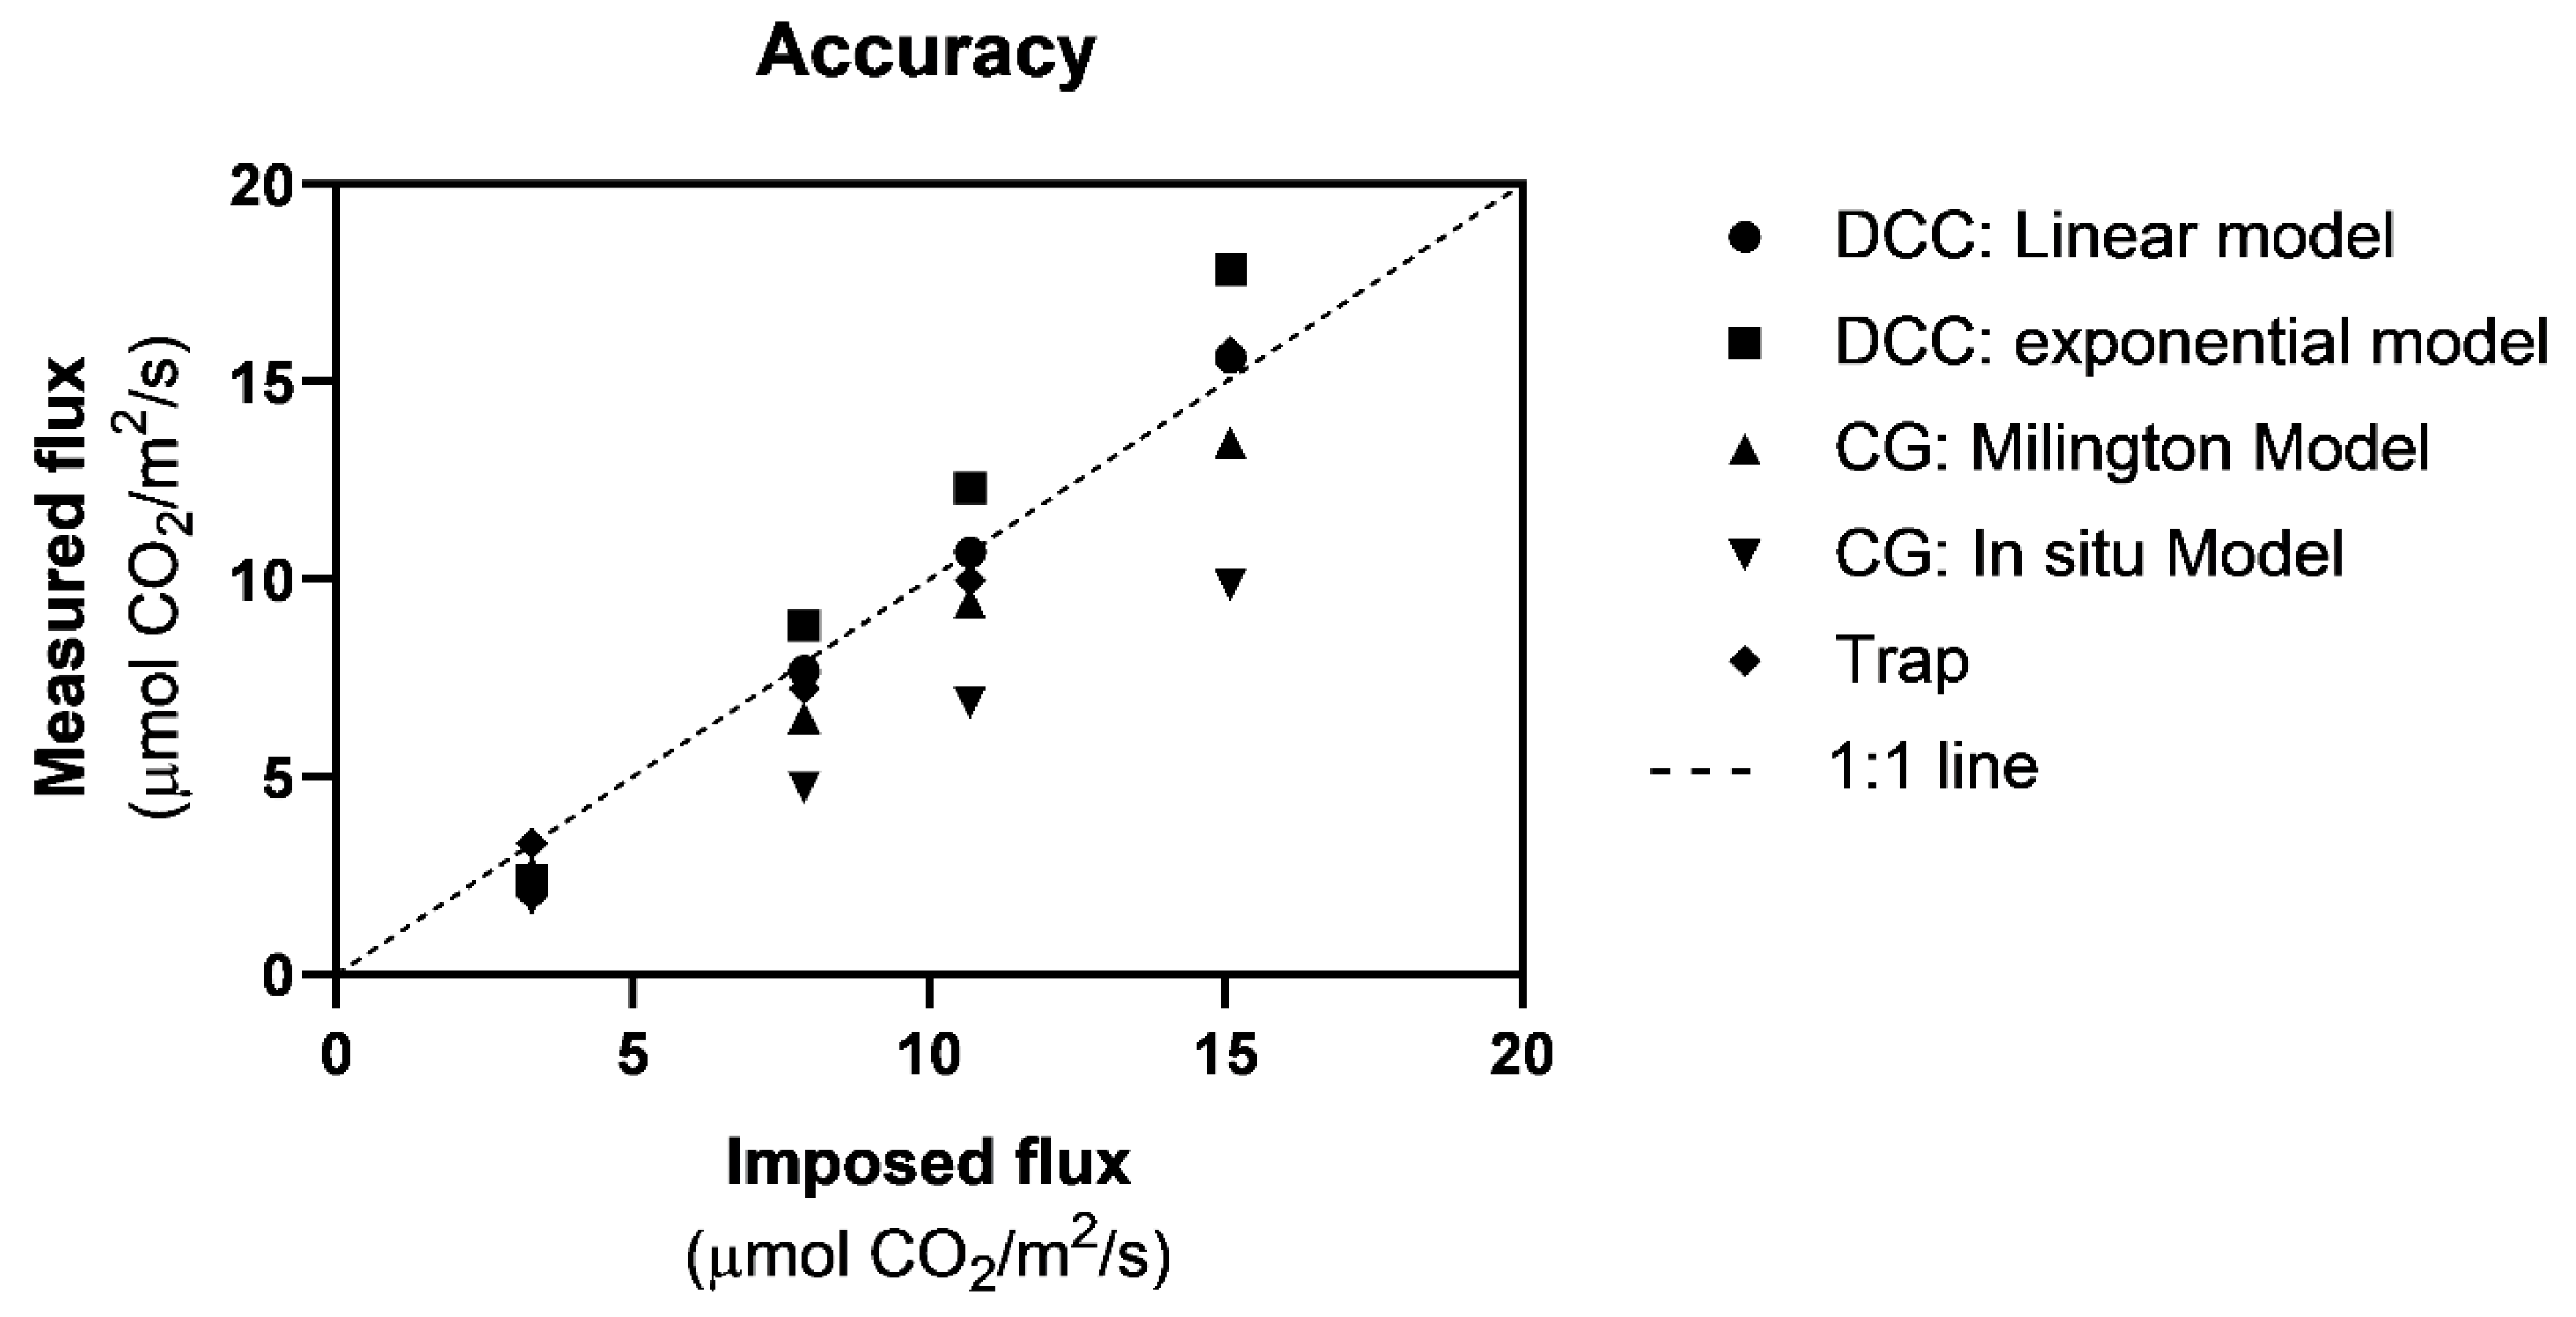
4.2. Accuracy and Precision

Many researchers attempted to determine the precision of CO2 trap, equipped with either caustic solution [103,110,111,112] or soda lime [11,46,47,113], relative to other NSZD quantification techniques, such as DCC [30,47,103,110,111,112,114], thermal monitoring [11,46,113], CG [47,114] and absorbent Solvita gel [112], which is a patented environmental measurement system and is sensitive to certain gases [112].
Linear regression analysis and coefficient of determination (R2) indicated that the data of alkali CO2 trap collected from different literature sources agreed well with those obtained by other methods, especially DCC (R2 = 93%) and CG (R2 = 94%) (Figure 5). R2 for CO2 trap versus thermal monitoring varied 11–51% (Figure 5c). A low R2 value of 11% was due to a large discrepancy between December 2014 data points. At this time of the year, traps were unable to capture CO2 efflux most likely due to frozen surfaces. Upon removing December 2014 data points, R2 value bounced to 51%. In all the cases, regression curves diverged from 1:1 line, with a tendency toward the trap data (i.e., x-axis), indicating that trap tends to overestimate NSZD rate compared to the other techniques. However, this finding should be validated with more data points, especially with those concentrated at higher CO2 effluxes and that these supplementary data points (and generally any precision study) should be collected systematically at a given time and location to improve the comparability of the results.
However, studying the literature sources individually revealed contradictions. At a geologically heterogeneous site, the most consistent NSZD data was collected using carbon traps and thermal method [11]. Apparent NSZD rates estimated using these two techniques showed a difference of 8.4%, indicating validity of both methods [46]. Comparing DCC and trap, R2 was 0.61–0.82 for field data [30,110,111] and 95% under controlled laboratory conditions [112]. In Rochette et al. [110], a negative exponential relation (R2 = 0.61−0.74, depending on the soil texture) was established between CO2 fluxes captured by DCC and trap. Paired t-test indicated that the values captured by alkali traps were on average 0.008–0.016 mg CO2/m2/s higher than those determined using DCC, which was occasionally statistically insignificant (p > 0.05) [111]. On the other hand, Freijer and Bouten [103] reported an underestimation of CO2 efflux by alkali traps and explained it by low absorption velocity in traps, dictated by slow diffusion due to lack of proper contact between the gas and sorbent. In Rochette et al. [111], trap occasionally underestimated CO2 efflux by about 22%, compared to DCC. Rochette et al. [110,111] identified that changes in soil temperature and CO2 concentration inside trap did not establish any relation with lower respiration captured by alkali traps, compared to DCC.
Precision does not necessarily guarantee accuracy [115]. All these techniques can introduce bias into NSZD rate measurements. This argument can be supported by the findings of a controlled lab study performed by Tracy [47], where DCC and alkali trap almost accurately captured the imposed flux (with an error of ±7%). Whereas, CG underestimated the imposed flux within 38% (see Figure 6). It is because almost all these methods are more or less disruptive and their measurements are affected by different factors. As discussed earlier (see Section 2.3), these factors can affect microbial processes which advance the NSZD and/or gas transport mechanisms in the subsurface. Tracy [47] explains that underestimation of the CG method (which can be understood from Figure 6b) was due to: (i) the CG results largely depending on accurate estimation of effective diffusion coefficients; (ii) the CG method only incorporating diffusive gas transport, overlooking the effect of advection [47]. In the field study of Eichert et al. [114], CG showed the highest sensitivity to input parameters compared to CO2 trap and DCC, while CO2 trap indicated relatively high intersample variability [114]. It is argued that DCC, thermal monitoring and CO2 trap are likely similarly biased by water table fluctuations and soil moisture. However, the available CO2 trap data in the literature does not necessarily reflect this, partly due to scarcity of CO2 trap data [46].
It is proposed that continuous monitoring of NSZD rate (e.g., at least a year) can average out positive and negative biases and converge the apparent and actual NSZD rates [46]. This approach can specifically become important in using CO2 traps, as NSZD rates and gas transport processes substantially vary seasonally. Seasonal variations resulted in a lag time of 5–7 months between peak NSZD-driven subsurface CO2 concentration (happened in fall–winter) and peak CO2 efflux at grade (observed in summer). In cold regions like Canada, long-term periods of frozen soil can inhibit gas emissions and exacerbate the situation [26].

4.3. Field Deployment and Grid Design

Use of CO2 trap for quantifying NSZD rate (as opposed to its usage in agriculture and forestry research) is quite recent [11,30,37,46,47,56,108]. In the last two decades (from 2005 to present), there have been numerous studies about NSZD concept and mechanisms [25,27,28,29,30,31,32,33,34,35,36,37,38]. Based on these studies, Interstate Technology and Regulatory Council (ITRC) has updated its guideline with NSZD, where CO2 trap is incorporated as one of the frequently-used NSZD assessment methods [22]. The ITRC is a state-led coalition in the U.S. that works closely with the legislative bodies (e.g., U.S. Environmental Protection Agency (US EPA)) and other institutions (e.g., Environmental Council of the States (ECOS)) to reduce barriers in adopting innovative air, water, waste and remediation environmental technologies and processes.

4.3.1. Field Deployment

The main part of trap body or its receiver (depending on the design; see Section 4.1) should be installed prior to trap deployment (i.e., commencing CO2 absorption into sorbent). For the Keith and Wong model, it is recommended that CO2 trap is installed and left uncovered several weeks before starting the measurements [30], while for the McCoy model, this time has been limited to a few days (≥1 day) [56]. Regardless of this discrepancy in the recommended duration, this procedure is to offset adverse effects of field installation, by allowing soil to recover from disturbances. The mechanical disturbance of soil may alter the diffusion coefficient and can also cause a flush of CO2 due to provoked microbial activity [30,56]. During installation, care should be taken to have minimal deviation from natural conditions. It is recommended that the soil within and around the receiver (with the McCoy model) is recompacted back to its original level [22,56]. This strategy can be adopted when the Keith and Wong model is used, which includes recompacting soil around the edges of trap body penetrated 1 cm into the soil (see Section 4.1).

4.3.2. Deployment Grid Design: Number and Distribution Pattern

The number and distribution pattern of CO2 traps at NSZD fields (hereinafter, the deployment grid) are not defined to this date. In the field studies conducted so far, CO2 traps seemed to be randomly distributed over the anticipated LNAPL area, with almost no clarification about the decision-making process and considerations for the development grid design [11,37,46,56]. In a multiple-site study (six sites), 10–23 traps were deployed per site, with the traps placed at 1 to 3 m distance from each other and a few traps (2–3 traps) reserved for background location (non-impacted areas) [56]. As part of this review, we performed an area estimation analysis on the examined sites in McCoy [56] using ImageJ 1.52 v. The LNAPL impacted areas varied in a wide range of 6.2–188.2 ha (15.3–465.2 acres). This area was 28.5, 188.2 and 66.6 ha at those sites where similar number of traps (i.e., 23 traps) were deployed (Sites A, E, F, respectively in McCoy [56]), indicating that the area covered by each trap was not chosen equally. In each site, there was at least one spot with replications (e.g., at Site A, three traps were placed 2 m apart) to capture CO2 efflux variability at a single spot [37,56]. In other studies, a limited number of traps (i.e., three to five CO2 traps) were only deployed at the LNAPL zones, with sporadic trap distribution pattern and no replication. Limited information was provided about LNAPL distribution in the subsurface and the impacted area [11,46]. Thus, an urgent need exists to develop a grid design protocol for this technique if the method is to be used frequently and is expected to provide accurate representation of the field conditions.
In the relevant studies [11,37,46,56], we anticipate that the researchers have most likely considered a few factors to define the grid design: (i) historical LNAPL contamination data (gas and liquid analyses); (ii) anticipated shape of LNAPL body; (iii) relative distance in each pair of deployed traps (1–3 m). These have not been explicitly confirmed in those studies. In these sources, relevant information about the deployment grid is merely an informative piece of methodology, rather than a detailed description of a systematic experimental design for determining/optimizing the deployment grid design [11,37,46,56]. Hence, it is not feasible to develop a grid design protocol based on the information in the current literature. It is hypothesized that the density of CO2 traps (i.e., the number of traps per unit LNAPL impacted area) and the grid pattern (the relative distance and placement of the traps) can alter the obtained NSZD rates. Additionally, the required number of CO2 traps might depend on not only distribution of the LNAPL body (the magnitude and shape of LNAPL area) but also the LNAPL composition (e.g., light vs. heavy LNAPL). Therefore, the outstanding question is “what an optimized grid design protocol is to resolve NSZD rate most accurately and precisely”. Further research on this topic is critical for amending the current guidelines to include the most comprehensive information about this site assessment technique and a consistent protocol for the deployment grid design. The outcome of such research will help practitioners to adopt this technique with utmost certainty and provides researchers with a consistent protocol which will ultimately increase the comparability of the results obtained in different trap studies.

4.3.3. Preliminary Site Delineation

CO2 traps should be deployed over the LNAPL affected zone to capture CO2 efflux originated from the contamination source, leading to a necessity for the spatial extent of LNAPL body to be known. Site characterization and LNAPL mapping, also referred to as subsurface investigation or site delineation, can be performed through analyzing historical data. Different data collection methods exist, which are generally referred to as direct push technologies [116]. These methods include: (i) rapid optical screening tool (ROST) laser-induced fluorescence (LIF) system (in short, the LIF) [117,118,119,120,121,122]; (ii) geophysical, non-destructive techniques, such as electrical resistivity (EC), electromagnetic induction and ground penetrating radar (GPR), which all take advantage of perturbations in subsurface physical characteristics (e.g., EC and permittivity) due to the presence of LNAPL—the LNAPL act as an insulator (low EC of ~0.001 μS/m, as opposed to ~0.1–1 μS/m of formation fluids) and have low permittivity (2–3) compared to clean water (~80) and water-saturated sands (20–30) [10,123]; (iii) soil vapor surveys [29,31] which can detect the hotspots of LNAPL biodegradations via in situ CO2, CH4, organic vapor readings; (iv) soil borings and soil sample collection [124] which can reveal contaminant composition and distribution and microbial community structure in a soil column; (v) installation of groundwater monitoring wells, followed by groundwater (and possibly gas) sample collection and analysis [125].
Site delineation in the majority of NSZD studies was performed using LIF, either solely or in combination with soil core and monitoring well data [37,46,56,64]. Adopting LIF technique, McCoy refined the extent of LNAPL body which was primarily approximated using other methods. When only limited monitoring well data was utilized for site delineation [11,56], a “blob shape” could only be distinguished for LNAPL impacted areas [56].
The LIF is adopted not only for determining NAPL mobility (migration and distribution) [118], but also for volume quantification (saturation of NAPL in soil porous structure) [117]. The LIF response has shown to correlate to LNAPL transmissivity (Tn) up to a greater extent than LNAPL saturation (Sn) [118]. Teramoto et al. [117] ascertained that relation between LIF response and LNAPL saturation followed an exponential function, where the empirical coefficients highly depended on the composition and the weathering stage of LNAPL, suggesting that these coefficients were site-specific [117]. The traditional site delineation techniques may not quantify actual NAPL volume appropriately, which can in turn result in false interpretation of the effectiveness of remediation techniques [117], such as NSZD. Use of LIF is a step forward in effective site management, providing accurate LNAPL volume and distribution, even at sites with complex commingled NAPL contamination [117,118].
Contamination with chlorinated solvents is often classified as dense non-aqueous phase liquid (DNAPL) [126]. Presence of DNAPL in groundwater is associated with historical release due to storage or use of these chemicals for metals degreasing, dry cleaning and other uses. These solvents are denser than water and often penetrate deep into permeable soil. They penetrate deep, sinking to the bottom of the water body. When capillary pressure does not allow further penetration, they move laterally along the top of finer-grained soil layers. Under the water table, they slowly dissolve in water. Due to aging, DNAPL dissolution reduces over time, decreasing DNAPL saturations and the likely disappearance of part of the residual DNAPL in groundwater [127]. The term commingled NAPL is also used to refer to DNAPL contamination. Commingled NAPL is composed of LNAPL detected under the water table along with solvent DNAPL constituents, where it is atypical to detect concentrated LNAPL. Commingled NAPL is very common as most halogenated solvent discharges are not pure. These releases mainly consist of trichloroethylene/tetrachloroethylene (TCE/PCE) combined with polyaromatic petroleum constituents released into the commingled NAPL due to industrial processes, disposal and/or transport [119].
A new variant of LIF “DyeLIFTM” can provide high-resolution, three-dimensional subsurface mapping of all types of NAPL (LNAPL, DNAPL and commingled NAPL), including chlorinated solvents and other dense, non-naturally fluorescing NAPL [120,127]. The DyeLIFTM method showed excellent (98%) agreement with the results obtained through aboveground soil core analysis. This method could detect DNAPL even in samples with relatively low DNAPL pore saturation (e.g., 0.7%) [127].

4.4. Downstream Laboratory Analyses and Result Interpretation

4.4.1. Recovery and Quantification of Absorbed CO2

CO2 absorption is proportional to weight gain of the sorbent [30,105]. Acid-base titration is utilized for estimating CO2 absorption in caustic solutions [103] and dry weight change analysis has been mainly adopted when soda lime is used [30,104,105]. However, in most literature sources focused on the use of CO2 traps for NSZD rate resolution, the concept of titration has been incorporated into weight-change analysis [37,47,56,108]. A strong acid, like HCl, has been utilized to convert solid CO2(s) (carbonate) to gaseous CO2(aq). This is an adoption of “gravimetric acid analysis” developed by Bauer et al. [128] for determination of carbonates in soil samples. A weight difference determines the amount of CO2 released through acid recovery [128].
The weight-change method with no acid addition is simpler and safer, compared to gravimetric acid analysis. However, it has the risk of exposure to atmospheric CO2 contamination during drying and weighing. Drying is recommended to be performed at 104 °C for 14 h in a fan-forced oven before and after deployment [30]. For shorter drying duration, we recommend that weight measurement is repeated every 1–2 h until no weight change is observed between two consecutive weighings. It is hypothesized that soda lime’s water content completely evaporates within the first few hours. Based on our lab experience (unpublished data), drying can be performed in a microwave oven within 3–4 min only, which eliminates the risk of exposure to atmospheric CO2. Fan-forced drying can particularly increase the possibility of sample contamination in the first few hours before water content is substantially removed. As illustrated in Equation (1), water initiates the cascade of reactions required for CO2 absorption to soda lime. Correct understanding of the error associated with the laboratory procedure of dry weight change analysis requires further quality assurance/quality control (QA/QC) analysis.
Dry weight change analysis requires an important correction. According to Equation (4), which is the sum of Equations (1)–(3), the absorption process generates 1 mole water (H2O) per 1 mole CO2 absorbed, which was originally bound to soda lime through chemical bonds in the form of two hydroxyl (-OH) groups [104]. Evaporation of this water during the drying process causes underestimation of CO2 efflux. To account for this error, a correction factor of 1.69 is recommended to be applied on the weight difference [104].
CO 2 ( g ) + Ca ( OH ) 2     CaC O 3 ( s ) + H 2 O
Field, travel and laboratory blanks should be incorporated into the protocol, to respectively correct for any error during field deployment/retrieving, transfer process and downstream laboratory analyses [30,104,108].
Thus far, there is no study to validate the relative accuracy of these two analytical procedures (i.e., dry weight-change method and gravimetric acid analysis). A brief literature review of Freijer and Bouten [103] demonstrated that mass balance error resulted from using acid titration was −9.1% to −0.6% [129,130,131], while it was −33% with weight change (without acid addition) technique [132]. However, in this source, weight change analysis was applied to NaOH fixed on carriers [132], making it difficult to extrapolate this observation to the weight change analysis of soda lime.

4.4.2. Origin of Absorbed CO2

As depicted in Figure 1, a portion of emitted CO2 at grade is associated with modern carbon (modern-C) which can lead to overestimation of NSZD rate if not accounted for appropriately. Modern-C is due to respiration of plant roots, rhizosphere, microbes and fauna residing in the surficial soil zone [34,133]. To distinguish between the carbon emitted from LNAPL biodegradation (ancient-C) and modern-C, background subtraction, isotopic analysis or both should be incorporated into alkaline trap technique [34,35,38,56].
Background subtraction is based on the assumption that total soil respiration (TSR) is the sum of contaminant-driven respiration (CSR) and natural soil respiration (NSR) [34]. Background CO2 efflux measurements are collected by traps deployed over “unaffected” areas. Thus far, background correction is the simplest and least expensive approach and is most suitable for sites where CSR >> NSR, either due to high CSR rates or low NSR rates. Otherwise, a similarity between CO2 effluxes of background locations and LNAPL areas can be seen which can lead to ambiguity about the occurrence of NSZD at sites with relatively low LNAPL loss rates. In addition, spatial variability between background readings (due to soil heterogeneity and/or variable NSR) can result in additional uncertainty in determining NSZD rates [35,56]. Moreover, due to uncertainty about the mobility and areal extend of LNAPL in many active and decommissioned industrial sites, selecting a true background location poses a great challenge [56].
Analyzing stable (δ12C and δ13C) and radioisotope (14C) carbon signatures can significantly improve the method accuracy through identifying the origin of captured CO2 most appropriately. Prior to its application to NSZD rate resolution [34,35,38,56], isotopic analysis was used to: (i) monitor natural attenuation (MNA) at hydrocarbon and chlorinated solvent contaminated sites [133,134,135]; (ii) study weathering of petroleum reservoirs [136]; (iii) determine contribution of anthropogenic and natural sources to atmospheric gases, including CO and CO2 [137,138,139]. In MNA, changes in δ13C of CO2 could indicate the dominant microbial (e.g., methanogenesis vs. aerobic methane oxidation) and metabolic (e.g., acetotrophic vs. hydrogenotrophic methanogenesis) pathways [35,133,135,140]. Differences in δ13C content of organic matter species are used as a tracer to understand the contribution of PHC to metabolic end products found at MNA sites [135].
Nevertheless, interpretation of stable isotopic data is often complicated due to, most likely than not, simultaneous influence of multiple reaction pathways [35]. Using stable carbon isotope technique requires knowing fractionation factors for the possible metabolic pathways (e.g., simultaneous conversion of CO2/H2 and acetate to CH4 in methanogenesis). These factors are not constant and sometimes largely differ from site to site and condition to condition. This effect highlights that site-specific circumstances can greatly impact the structure of natural microbiomes and that these factors should be determined for each individual site independently [141]. In addition, isotopic fractionation during acetate turnover poses an additional challenge as acetate can enter multiple competing reactions as either reactant or product [141]. Acetate can be produced from organic matter (i.e., heterotrophic acetogenesis [36]) and CO2 (i.e., autotrophic acetogenesis [141,142]). It can be utilized for biomass generation as well as CH4 and/or CO2 production [36,141]. Another issue associated with stable isotope technique is that a significant overlap exists between δ13C contents of PHC, some indigenous soil carbon sources (e.g., plant root respiration and soil carbonates) and metabolites of methanogenesis [134,135]. In biochemical processes, the ratio of stable isotope of metabolic end-products per substrate materials changes. This fractionation effect is much smaller in aerobic metabolism (<6‰) than in anaerobic processes. Even in anaerobic processes, this ratio can be significantly different considering different by-products. For instance, δ13C of CO2 and CH4 produced through acetotrophic methanogenesis is respectively 20–30% higher and 20–30% lower than the substrate, i.e., acetate (see Conrad et al. [135] and the references therein). Thus, the use of stable isotope δ13C technique without supporting information can produce ambiguous results. For example, high δ13C CO2 produced through methanogenesis can be mistakenly taken for high δ13C atmospheric CO2. As such, radioisotope 14C technique is used as a complementary analysis [135].
Use of radiocarbon as a tracer relies on the fact that modern-C is rich in 14C. Whereas, ancient-C is entirely depleted of 14C due to long-term weathering. This results in a distinguishing feature between carbons with different ages (in this case, biogenic vs. fossil sources) [11,35,37,56,134,135,138,140,143]. Radiocarbon is a cosmogenically produced radionuclide, with a half-life of 5730 ± 40 yr. It is produced in the upper layers of the atmosphere (troposphere and stratosphere) through bombardment of nitrogen atoms. Nitrogen atoms are converted to 14C isotope (n + 147N → 146C+ p) when they react with thermal neutrons (n) produced by cosmic rays interfacing with Earth’s atmosphere. Radiocarbon enters the nutrient cycle of Earth through photosynthesis afterwards [138,143].
Correction based on 14C can identify NSR outliers and resolve the upper boundary of CSR more accurately, compared to background correction [35]. Sitewide average NSZD rate estimated using location-specific 14C correction was 2.5 times less than that achieved using background correction (1.2 vs. 3.0 μmol CO2 m−2 s−1, respectively) [114]. A radiotracer study using [14C]-bicarbonate and [2–14C]-acetate could provide an understanding about methanogenic biodegradation of crude oil under high temperature and pressure, demonstrating that syntrophic acetate oxidation coupled with hydrogenotrophic methanogenesis was the dominant metabolic pathway under this circumstance [97]. Nonetheless, 14C analysis is a costly and labor-intensive method and requires special laboratory equipment [35]. CO2 should be physically recovered from soda lime using an acid extraction method, which requires an additional laboratory step [47,56]. Furthermore, this method tends to overpredict CSR because the gas transport distance between contaminant source and emission at grade is not accounted for in the underlying calculations; it is assumed that the percent of modern-C (pMC) does not change as gas travels in the subsurface. To minimize the associated error, it is recommended that only the pMC values which were measured most closely to the surface are incorporated into data analysis [35]. Isotopic fractionation can influence 14C as well. However, unlike δ13C, this effect is so small (within the analytical precision of the measurement, e.g., ±0.01 times pMC) that it can be safely overlooked [135].

4.4.3. Conversion of CO2 Efflux to NSZD Rate

NSZD rate is estimated stoichiometrically using the quantified CO2 efflux. ITRC recommends using octane (C8H18) as the representative PHC (Equation (12)) [22]:
2   C 8 H 18 + 25   O 2   16   C O 2 + 18   H 2 O
2   C 10 H 22 + 31   O 2   20   CO 2 + 22   H 2 O
However, ITRC clarifies that a different PHC can (and in fact should) be selected to suit the site-specific hydrocarbon compositional profile [22]. Decane (C10H22) has been widely used as the representative PHC in NSZD studies [11,13,29,34,37,46,47]. Ten moles of CO2 are produced per one mole of decane degraded (see Equation (8)) [29,37]. Given decane density of 0.73 g/mL, 1 μmol CO2/m2/s is equivalent to 6138 L LNAPL/Ha/yr [37]. NSZD rate is commonly reported as L LNAPL degraded/Ha/year or U.S. gallon LNAPL degraded/acre/yr [25].

5. Thermal Monitoring: A Recent Technique

Thermal monitoring is an emerging technique that uses subsurface biogenic heat as a surrogate for NSZD rate measurement [12,22,26,46,78,81,144,145,146]. Temperature was first used in 2014 as a tool to evaluate aerobic degradation of PHC within a subsurface [146]. However, due to the similarity between enthalpies (ΔHro) of aerobic PHC degradation and methane oxidation (see Table 1), it is likely that the temperature anomalies captured by Sweeney and Ririe [146] attributed to aerobic PHC decomposition were in fact due to NSZD by methanogenesis that progressed through methane oxidation consecutively (see Section 2.1).
The primary source of heat in both saturated and unsaturated zones of an LNAPL contaminated subsurface is methane oxidation [12]. It can be understood from NSZD thermodynamics discussed in Section 2.4.2. The enthalpy of methane oxidation is 32 to 750 times higher (with decane and hexadecane as representative LNAPL, respectively [12,22,78]) than the enthalpy of methanogenesis, rendering the heat generated from the latter negligible (0.2% of the overall heat generated from LNAPL degradation [12]). It is therefore thought that thermal groundwater plume which overlaps the center of the oil body is most likely transported from the overhead unsaturated zone where methane oxidation occurs [12]. Using Gaussian process regression (GPR), Warren and Bekins [12] showed that a thermal plume forms near the center of oil body and expands along the groundwater flow path, without the temperature retrieving background values (6.3–6.5 °C) even up to 250 m downgradient.
This technique was advanced by a number of researchers [46,78,81,144] and patented in 2015 [145]. Other researchers noticed subsurface temperature anomalies in LNAPL contaminated areas as well [12,26,146,147,148]. Biogeochemical processes cause marked effects in a contaminated subsurface including alteration in temperature, among many other signatures (e.g., changes in petrophysical properties, mineralogy, solute concentration of pore fluids, etc.) [10]. At LNAPL spill sites, the vadose zone temperature establishes a correlation with contaminant respiration [26], which was about 2.7 °C greater than background temperature [12]. A thermal plume forms at the contamination source zone in the saturated zone, with the highest temperature overlapping the center of oil body A temperature difference of 1.2–2.9 °C between the thermal plume and background location has been recorded [12]. The temperature of the smear zone is consistently higher (2–2.5 °C) than that out of the LNAPL footprint [146].
A variety of devices are used for monitoring subsurface temperature, including thermocouples [12,26,46,78,81], thermistors [12,146], resistance temperature detectors (RTDs) [149] and bandgap-based digital temperature detectors [150], with thermocouples being used most frequently in NSZD studies. However, a standard approach or protocol to select for a preferred device does not exist [22]. Analog thermistors are suitable for preliminary assessments to have a snapshot of site conditions. The use of thermocouples, RTDs and band-gap sensors allows simple remote data acquisition, less human error and yearlong measurements [150]. Data collected using thermistors and bandgap sensors agreed well, with a difference of 0.02–0.03 °C which was within the sensors’ resolution limits [150]. Comparing RTDs and thermocouples, the former is preferred especially in cold climates, because: (1) they result linear data over wide temperature ranges, hence linearizing will be less challenging; (2) they do not need cold junction compensation due to their electric characteristic features [151].
Data reduction and analysis steps include: (1) background correction—correcting the recorded temperatures by removing background thermal effects; (2) applying energy balance to the background-corrected temperature profile of a reference volume in the monitored zone—this reference volume usually has the ground surface as the upper boundary and the lower boundary is chosen below the LNAPL source zone; (3) combining the results of energy balance and LNAPL degradation stoichiometry using Equation (8), to resolve the NSZD rates [46,145]. Key assumptions of the energy balance are outlined by Karimi Askarani et al. [46]. Similar to CO2 trap method (Section 4.4.3), decane is commonly selected as generic hydrocarbon in this technique [22,46,78,81]. Although, other sources are used as the representative PHC as well, such as hexadecane in Warren and Bekins [12]. Finding the most appropriate PHC representative for this substitution is necessary to establish an appropriate understanding of site-specific LNAPL composition and realistic NSZD rates. Advantages and limitations of this method are discussed in Section 3.

6. Conclusions and Outlook

NSZD is an emerging sustainable and cost-effective in situ technique for monitoring and regulatory compliance of LNAPL bioremediation in decommissioning and reclamation industry. Depending on restoration objectives, NSZD can be used as either the primary or sole LNAPL management technique. To achieve this goal, the NSZD rate should be quantified accurately and precisely.
Based on the characteristic features of NSZD sites, four principal methods are developed so far to resolve NSZD rates, including CG, DCC, CO2 trap and thermal monitoring. Each of these methods has a number of advantages and limitations, which are either common between them or unique to them. For instance, both CG and DCC can provide instantaneous site readings. However, data reduction and analysis are time consuming and labor intensive in both methods. While CG can only account for diffusion, DCC can capture gas effluxes caused by diffusive and advective gas transport mechanisms. Thus, CG data are not representative of site conditions where advection is the dominant gas transport mechanism. Refer to Table 2 to learn more about advantages and limitations of each method.
Part of the limitations are caused by the equipment or the method protocol. However, a significant portion of disadvantages lies in environmental conditions, such as wind, barometric pumping, precipitation, solar radiation, soil texture and moisture, water table fluctuations, etc. The subsurface constantly interacts with these environmental factors, resulting in substantial changes in the subsurface characteristics even at high-resolution timescales. To that end, these factors introduce high degrees of temporospatial heterogeneity into the site conditions. This introduces considerable variations in NSZD rate measurements temporally and spatially. This can be interpreted as an inherent characteristic of NSZD phenomenon rather than shortcoming of the quantification techniques per se.
Investigations performed on relative precision and accuracy of these four techniques indicated that CO2 trap data agreed well with those obtained by DCC and CG (linear regression analysis: R2 > 90%). It fluctuated considerably for thermal monitoring (R2 = 10–50%), depending on the time of the year these methods were used. It is because CO2 trap data is more sensitive to seasonal circumstances, especially those affecting ground surface characteristics. Trap seems to overestimate NSZD rate compared to all other techniques. However, this should be validated with more data points, especially at higher CO2 efflux ranges. In the future, precision studies on all these techniques should be performed systematically. All four methods should be investigated simultaneously at the same location to improve comparability of the results. All these techniques can introduce bias into NSZD rate measurements, as all of them are affected by certain factors (outlined in Section 2.3 and discussed in Appendix B) one way or another. It is proposed that continuous monitoring of NSZD rate (e.g., at least a year) can average out positive and negative biases and converge the apparent and actual NSZD rates [46]. This is the point where thermal monitoring becomes an interesting technique, as this method is deemed to introduce fewer biases due to climatic factors into NSZD rate measurements, reduces field work and is cost-effective for yearlong studies.
Certain outstanding questions and concerns include the following, which can provide directions for future research:
  • The role of predatory organisms on biotic processes at NSZD sites has not been studied and comprehended so far. Predation has been categorized as a less critical factor on biotic processes at NSZD sites [39]. This assumption can be due to difficulties in culturing strictly anaerobic protozoa, which may have caused lack of experimental proof for the speculations about protist roles in anaerobic ecosystems.
  • Nutrient amendment as a site management strategy should be further investigated. These questions should be answered first: does nutrient supplementation increase NSZD rates in the subsurface? What are the most effective nutrient compositions to improve natural biogeochemical processes at NSZD sites? Does optimal nutrient composition vary from site to site and does it depend on LNAPL composition? Secondly, it should be deduced if nutrient addition will have any adverse effect on NSZD rate, either through inhibiting the microbial processes or interfering with measurements.
  • Methanotrophs are seen to thrive in micro-aerobic environments (0.5–2% O2) rather than highly oxygenated environments. Oxygen inhibition at higher O2 concentration is suspected and is recommended to be quantified [152]. This should be validated through further investigation.
  • Anaerobic methanotrophy occurs at considerable rates in anoxic coastal and wetland sediments, presumably via syntrophic relationship between methanotrophic archaea and sulfate-reducing bacteria with elemental sulfur transfer [153,154,155]. The question is whether anaerobic methane oxidation (AOM) can be happen at NSZD sites. Additionally, it should be further investigated whether it can be responsible for significant methane oxidation, given that the bottom layers of the unsaturated zone, confined between the aerobic vadose zone and the water table, constantly experience anaerobic condition.
  • Systematic, comprehensive studies should be planned to investigate not only the main effect of influencing factors, but also the interactions between them. The existence and the degree of these interactions should be validated to improve the accuracy of NSZD rate quantification protocols (i.e., actual NSZD rate ≌ apparent NSZD rate).
  • These systematic studies (explained in the previous numbered point) should attempt to study the influencing factors methodologically and analyze the main and interaction effects quantitively and qualitatively. The current literature requires more data to validate and make solid conclusions about the effect of each influencing factor.
  • As described in the Introduction section, critical review of the underlying factors and providing thorough explanation of the underlying phenomena was out of the scope of this literature review article. There is a need in the current literature for critical review articles regarding different aspects of NSZD, which can explain the underlying phenomenon relevant to each factor.
  • How significant is the contribution of “signal shredding” to high temporospatial variability of NSZD rates? This question merits further research given that no study has been dedicated to this phenomenon at NSZD sites to date.
  • It is hypothesized that surface properties can influence actual NSZD rate. Tracy [47] argues that based on Le Chatelier’s principle, accumulation of reaction by-products (i.e., gas vapors) due to surface capping can establish an equilibrium at lower rates, resulting in decreased rates of all forward reactions (i.e., biodegradation, dissolution and volatilization) [47]. Although this hypothesis is theoretically valid, it requires further investigation to determine whether and how subsurface heterogeneity and complexity can determine the importance of this factor in regulating actual NSZD rates.
  • What is the magnitude of the effect of precipitation on CO2 trap readings? It is anticipated that CO2 trap deployment during precipitation can form preferential gas transport pathways, resulting in NSZD rate overestimation. Deployment immediately after precipitation can cause underestimation, as soil saturation can prevent gas emission at grade.
  • What is the relative accuracy of CO2 trap models, given that the two available models (i.e., the Keith and Wong model and the McCoy model) have some differences in scale (the former has a 10-time larger surface area than the latter) and configuration (closed top in the Keith and Wong model)?
  • Based on what criteria, protocol or standard should CO2 traps be distributed at site to resolve the most accurate NSZD rate and also result in consistency in the use of trap and an improvement in comparability of the results of different studies? Do the density of CO2 traps (i.e., number of traps per unit LNAPL impacted area) and the grid pattern (relative distance and placement of the traps) alter the results (i.e., the obtained NSZD rates)? Does the required number of traps depend on distribution (i.e., the magnitude and shape of LNAPL area) and composition (e.g., light vs. heavy LNAPL) of the LNAPL body? An urgent need exists to develop a grid design protocol and standard for this technique if the method is to be used frequently and is to be expected to provide accurate representation of the field conditions.
  • Accuracy of the downstream analyses of the retrieved CO2 trap from the field (e.g., dry weight change analysis and radiocarbon isotope analysis of the soda lime) merits further research. This is to establish a correct understanding of the error introduced into data during laboratory procedures.
  • In thermal monitoring technique, a variety of devices can be used for monitoring the subsurface temperature, including thermocouples, thermistors, RTDs and bandgap-based digital temperature detectors. The thermocouples are used most frequently. A standard approach or protocol to select for a preferred device does not exist [22].
  • Further research should be dedicated to eliminating or reducing the dependency of all methods on background correction. Background correction is the simplest and least expensive approach that resolves the origin of CO2 efflux or biogenic heat used as NSZD rate surrogates. Nonetheless, finding the most reliable background location can be challenging, due to a number of reasons: (1) uncertainty about the mobility and areal extent of LNAPL in many active and decommissioned industrial sites; (2) similarity between CO2 effluxes of background location and LNAPL impacted area. The latter can lead to ambiguity about the occurrence of NSZD at sites with relatively low LNAPL loss rates. It can result in negative background-corrected values making the impression that the LNAPL compounds are being produced.
  • The NSZD is a bioremediation and reclamation technique at an embryonic stage. Therefore, enough information was not available in the current literature about capital cost, operating cost and revenue based on the technical and financial input parameters to feed into a techno-economic analysis of NSZD. It can be fit into the scope of the future literature review analysis of NSZD. In addition, it is recommended that the future critical literature review articles include a bibliographic analysis of the topic, to determine the new knowledge and the direction of the future research closer to the most recent updates that are being released to the public every day.

Author Contributions

Conceptualization, R.P.; methodology, R.P.; validation, R.P.; investigation, R.P.; resources, R.P.; data curation, R.P.; writing—original draft preparation, R.P.; writing—review and editing, R.P. and A.C.; visualization, R.P.; supervision, J.P.H. and A.C.; project administration, J.P.H.; funding acquisition, J.P.H. All authors have read and agreed to the published version of the manuscript.

Funding

This research was funded by Mitacs, under Mitacs Accelerate Postdoctoral Fellowship program (grant number: not applicable).

Acknowledgments

This research was completed with the support of Worley Canada Services Ltd. operating as Advisian as the partner organization in this program. The review and revision process were supported by Associated Engineering Alberta Ltd.

Conflicts of Interest

The authors declare no conflict of interest.

Appendix A. Factors Regulating NSZD Rates

Appendix A.1. Factors Regulating Actual NSZD Rate

Appendix A.1.1. Temperature

The effect of temperature can be grouped into two categories: subsurface temperature and ambient temperature. Subsurface temperature is mainly a function of surface heating/cooling (driven by solar radiation, black body radiation, incident precipitation, etc.) and heat generated by NSZD. Heat received at the ground surface moves inward when net surficial inflow of energy exceeds energy loss and vice versa [81].
Although hydrocarbon degradation can happen in a wide temperature range (0–70 °C), temperature fluctuation can have marked effects on the associated rates [52]. Field assessments of more than 2000 hydrocarbon sites and a 1 year lab-scale study demonstrated a positive, statistically-significant relation between NSZD rate and ambient temperature [52,64,156]. Each 10 °C increase in air temperature increases the hydrocarbon degradation rate between 1.1 and 4 times (Q10), depending on the type of the contaminated site (whether it is a subsurface, seawater or beach gravel) [52,156]. It was seen that increase in NSZD rate due to temperature resulted in a higher dissolved methane concentration in LNAPL impacted subsurfaces [156].
Investigating the effect of temperature is not as straightforward as the sole consideration of Q10. Influence of temperature should be evaluated in conjunction with water table fluctuations, microbial structure and substrate bioavailability and inhibition. The relationship between temperature and NSZD rate was pronounced at deep water tables (>9 m versus <4.5 m) [156]. Elevated temperature can increase microbial activity, causing episodes of greater LNAPL removal rates [60]. A rapid temperature increase (e.g., 1 to 10 °C over 2 months) observed during thawing periods in sub-Arctic regions caused a burst in microbial respiration, leading to rapid biodegradation of semi- and non-volatile hydrocarbons [157]. Significant shifts in microbial populations occurred when transitioning from low to higher temperature ranges (i.e., from 4–9 °C to 22–30 °C or 35–40 °C) [64]. The optimal temperature for methanogenesis at NSZD sites is supposed to be 22–30 °C [64,156]. Low temperatures retard the volatilization rate of light hydrocarbons which pose toxic effects on microorganisms [52]. At low temperatures, co-metabolism is suggested to play a key role in hydrocarbon depletion rates (see Atlas [52] and the references therein).
Thermal stimulation is considered as a management strategy to enhance NSZD rate. For this purpose, temperature variation is recommended to remain within ±5 °C of the site-specific natural temperature range [64].

Appendix A.1.2. Microbial Structure and Acclimation

Microbial acclimation, structure and syntropy at NSZD sites are thoroughly discussed in Section 2.4.

Appendix A.1.3. Predation

The effect of protozoans on the microbial community of NSZD sites is still open to debate. Protozoa have been detected in vadose and saturated zones of sites contaminated with jet fuel [158] and monoaromatic hydrocarbons [159]. Anaerobic protists are generally known as major predators of prokaryotes in anaerobic ecosystems [58]. A high population of protozoan community detected in subsurface sediments and aquifers contaminated with jet fuel and monoaromatic hydrocarbons (i.e., 1:107–1:103 [158,159]) was expected to markedly reduce the population of hydrocarbon-degrading species [158]. Notwithstanding, PHC degrading organisms seem to counteract the anticipated adverse effects. A study on a protozoan predator (Acanthamoeba castellanii) and its bacterial prey Bacillus in aquifer microcosms indicated that reduction in bacterial culture due to predation was a short-term effect, because bacteria could survive by moving and distancing themselves from immotile amoeba [160]. It should be noted that the Bacillus genus has been putatively characterized as a hydrogen-degrading species, as Bacillus subtilis has been isolated from automobile workshops and has shown the ability to degrade gasoline [161].
On the other hand, it is suggested that anaerobic protozoa establish endosymbiotic relationships with methanogenic organisms [57,58]. It has been observed that ciliates residing in strictly anoxic, eutrophic sediments host hydrogenotrophic methanogens [162,163]. In anaerobic systems, the fermentation step can be performed by eukaryotic organisms such as fungi, ciliates and flagellates, whose metabolic systems are compatible with reducing conditions of anoxic environments. Anaerobic protozoa traverse particles (especially some bacteria which serve these organisms as food, known as “food bacteria”) through their membrane, ingesting them into their food vacuoles and digesting them via consecutive hydrolysis and fermentation. These anaerobic protozoa have intracellular organelles called hydrogenosomes, which can release and accumulate hydrogen intracellularly. These protists establish a cooperation with intracellular or extracellular partner hydrogenotrophic methanogens, to maintain low hydrogen and formate concentrations in their cells. Endosymbiotic methanogens remove hydrogen and the associated reducing equivalents so that the eukaryotic host cell can benefit from running a fermentative metabolism with maximum adenosine triphosphate (ATP) yield [57]. Tracer experiments conducted recently on three isolates from anaerobic granular sludge (i.e., Cyclidium sp., Trichomitus sp. and Paracercomonas sp.) confirmed that anaerobic protist Cyclidium sp. provided the endosymbiotic methanogenic partners with CO2 and hydrogen. These anaerobic protozoans showed different food selectivity (the two former consumed both Gram-negative and Gram-positive bacteria as food while the latter only ingested Gram-positive bacteria) which regulated distinct metabolite patterns in these species [58].
The ecological roles of protists in anaerobic ecosystems are still in the shadows due to extreme difficulties in culturing strictly anaerobic protozoa [57,58], which has caused almost no anaerobic protozoan to be cultured to date [58]. Predation has been categorized as a less critical factor on biotic processes at NSZD sites [39], which might root in the lack of experimental proof of all the aforementioned assumptions. As such, this implication warrants further research, given the limited studies in the literature pertaining to bacteria–protozoa interactions at LNAPL release sites.

Appendix A.1.4. Nutrients (e.g., Nitrogen, Phosphorus, Potassium)

Microbial community in contaminated aquifers are known to aggressively scavenge phosphorus from phosphorus-bearing minerals (e.g., feldspars) which generally contain less than 1 μmol NH4+/g. This suggests that phosphorus might be the limiting nutrient for the growth of subsurface microorganisms [59]. Increased NSZD rates coinciding with heavy precipitation and recharge events are commonly explained by a flush of nutrients downward into the oil body [9,28,60], which has been used to also explain the contrasting degradation rates at different depths (greater rates at 2–8 m bgs, compared to those at shallow depths such as 1.5 m bgs) [28]. In the laboratory, nutrient supplementation combined with a high temperature (28 °C) could increase aerobic and anaerobic first-order biodegradation rates of diesel fuel contamination in groundwater, from 0.0002 d−1 to 0.0066 d−1 and 0.0005 d−1 to 0.0016 d−1, respectively [164]. Deducing from these evidences, nutrient amendment is proposed as a strategy to enhance natural biogeochemical processes at NSZD sites [25].
However, in investigating nitrogen, phosphate and potassium amendments in laboratory-scale columns, the results of Emerson [13] suggested that nutrients might not be rate-limiting factors for NSZD rate in middle-stage and aged sites. In Swindoll et al. [165], inorganic nutrient amendments (NH4NO3, NaNO3, NH4Cl, KH2PO4 and K2HPO4) did not show consistent effects on the mineralization rates of ethylene dibromide, p-nitrophenol, phenol and toluene; an inoculum collected from the same aquifer layer was used in replicate experiments [165]. The same controversy was observed among the studies focusing on hydrocarbon degradation in seawater as well (see Atlas [52] and the references therein). These observations suggest variable metabolic abilities and nutrient requirements of groundwater microorganisms, even in the same aquifer. Therefore, if a nutrient amendment approach is chosen as a site management strategy, the use of multiple inorganic nutrients instead of a single substrate is recommended [165]. In addition, it is recommended to select the nutrient type and dose after site-specific studies on the existing microbial community in the subsurface and bench-scale studies on the site samples.
Nutrient supplementation, however, might impose adverse effects and thus should be adopted with caution. Alternating carbon sources (e.g., glucose and amino acids) impeded degradation of xenobiotics, possibly due to metabolic preferences for more readily biodegradable carbon amendments [165]. Further, mineral nutrient amendment was accompanied with a 20% decrease in hydraulic conductivity, due to overgrowth of bacteria in nutrient-rich porous media and thus aquifer clogging, which could prevent nutrient pumping through the affected zone [158]. Bacteria have shown to migrate up nutrient gradients, even against the flow direction, to position themselves at nutrient-rich environments such as the inlet point [160], raising the question whether nutrient amendment of an LNAPL contaminated subsurface can cause clogging of the inlet design (if any inlet is going to be used from practical standpoints) and the subsurface, which can offset the benefits of nutrient amendment strategy.
The rate of hydrocarbon degradation in temperate lakes was the greatest when nutrient concentrations and temperature were jointly optimal [166], suggesting an interaction between these two factors.

Appendix A.1.5. Substrate Bioavailability and Inhibition

This factor reflects the influence of LNAPL composition, residues and metabolite buildups that all can serve as NSZD substrates. Hydrocarbon compounds originally present in crude oil and their degradation metabolites can have different inhibitory effects on NSZD microbial activities. Inhibition can impact biogeochemical processes at NSZD sites through: (1) substrate toxicity; (2) metabolite toxicity; or (3) higher affinity for one compound (either a substrate or metabolite) over another which decreases the thermodynamic feasibility of competing reactions. Interactions can exist between different compounds. Kinetic studies have shown that in a binary substrate medium (i.e., under diauxic condition), four interaction patterns may occur: (i) competitive cross-inhibitory; (ii) uncompetitive cross-inhibitory; (iii) competitive partially inhibitory; (iv) uncompetitive partially inhibitory [167,168]. This has been extrapolated to n-multiple mixed substrate media [169], such as those encountered in an LNAPL impacted subsurface. This extrapolation has resulted in development of a “sum kinetics with interaction parameters (SKIP)” model [170] that has been used to predict microbial growth and substrate utilization in diauxic and maultiauxic conditions [169,170,171]. Yoon et al. [169] proposed that substrate diversity and abundance may play a key role in supporting a heterogenous microbial population. This can potentially reduce interspecies competition and thus decrease competitive inhibitory effects [169].
At NSZD sites, all the constituents of LNAPL body, biodegradation metabolites and even the supporting nutrients (e.g., nitrogen and phosphorus) can be considered as substrate of PHC biodegradation. This indicates the possibility of many forms of interactions between different influential factors discussed here, including substrate bioavailability and inhibition, nutrients and microbial structures and metabolic pathways at LNAPL contaminated sites. The traces of interaction between these factors can be seen in different studies [41,172,173]. In Siddique et al. [172], primary PHC substrate determined the dominant microbial community and the main carbon flow pathway in oil sands tailing ponds. While n-alkanes could enrich acetoclastic methanogenic archaea (Methanosaetaceae), BETX could provide a competitive advantage for hydrogenotrophic methanogenic archaea (Methanomicrobiales) and naphtha-rich environments could host a blend of these two archaeal communities [172]. Release of a dissolved ethanol blend (10% v:v ethanol, 50 mg/L benzene and 50 mg/L toluene) was concomitant with an increase in enrichment of extracellular polymeric substance (EPS) production genes which stimulated EPS production and increased the organic matter content [173], demonstrating interaction between microbial structure, metabolic activity and LNAPL composition.
As biodegradation of PHCs proceeds, concentration of the original compounds, mostly those readily biodegradable (e.g., ethylbenzene and xylene), gradually decreases [174]. These compounds are mainly low molecular weight PHCs, also referred to as volatile hydrocarbons (VHCs), that are generally toxic for microorganisms. The VHCs such as nC5–nC10, methylcyclohexane, benzene, toluene and xylenes have shown to slow down methanogenic alkane degradation [175]. This effect is exacerbated at low temperatures which reduces the volatilization rate of VHCs, leading to VHC accumulation in the source zone (see Atlas [52] and the references therein), suggesting an interaction between temperature and substrate inhibition. The VHCs are prevalently present in non-weathered NSZD sites, i.e., the sites which are at the early stages of an oil spill [9]. Therefore, Garg et al. [25] argue that many NSZD sites might not suffer from VHC inhibition, because most sites are aged enough that the weathering process has depleted a significant proportion of VHCs. This agrees with Baedecker et al. [9] who observed that the VHCs experienced 13–64% depletion in about 30 years from LNAPL spill.
In parallel with PHC degradation, metabolite concentrations increase. LNAPL biodegradation metabolites include CO2 and CH4; non-volatile dissolved organic carbon (NVDOC) compounds that are mainly composed of partial transformation by-products; volatile fatty acids (VFAs) such as acetate; and EPS [173,176]. Due to greater polarity and less volatility, NVDOCs are more soluble than the parent PHCs and are suspected to pose toxic effects on aquatic and mammalian species [176]. Microbial analysis of a contaminated field indicated that the population of acetate-utilizing microorganisms were limited close to the center of the crude-oil source zone. Lab-scale batch assays corroborated this observation, demonstrating an inhibition effect of crude oil on acetate utilization [177]. Stasik et al. [174] investigated the effect of labile organic compounds (i.e., fermentation by-products including lactate, acetate, formate, propionate and butyrate) on BTEX removal in tailing ponds. BTEX removal reduced by 70–90% in the presence of these VFAs, presumably due to acetate accumulation [174]. Inhibition of PHC biodegradation by fatty acids are repeatedly reported in other sources [173,178,179], which is in contradiction with the general assumption that the presence of VFAs may stimulate methanogenic PHC degradation.
A sum of these findings suggests that a cross-inhibition exists between acetate consumption and PHC degradation at NSZD sites. These observations alongside corroborating molecular data propose that the major methanogenic PHC degradation pathway is hydrogenotrophic, rather than acetoclastic [36,48,57,174,175,177]. Acetoclastic is a thermodynamically favorable reaction. However, it is deemed that inhibition plays the primary role in dictating the methanogenic pathway under many circumstances, rather than the thermodynamic principles [25]. For example, excess supply of fermentable substrate or the presence of toxic compounds can inhibit hydrogenotrophic methanogenesis which results in a cascade of reactions that, under extreme circumstances, can entirely fail the methanogenic process (fermentable substrate accumulation → decrease in pH < 6.0 → disruption of hydrogenotrophic methanogenesis performed by hydrogen and formate-utilizing methanogens → hydrogen accumulation and increase in hydrogen partial pressure → further increase in fatty acid pool → further decrease in pH → further inhibition of hydrogenotrophic methanogens → system failure) [57]. This can be an indication that acetate is a catabolite repressor rather than an inhibitor. However, this assumption is subject to further investigation to be verified and confirmed.

Appendix A.1.6. Water Table Fluctuations

It is proposed that water table fluctuations can affect not only NSZD rate but also the dominant LNAPL removal pathway, through elevating/lowering LNAPL body and altering the degree of LNAPL exposure to oxygen influx. These phenomena happen in the vadose zone. Contribution of vadose to LNAPL depletion is mainly due to volatilization which is deemed to be substantial (>90% of overall LNAPL removal) [180]. However, since methane upward flux is supposed to restrict oxygen downward flux, such phenomenon might not happen in many sites [41], especially when the aquifer is deep. From a different perspective, McAlexander and Sihota [60] argue that water table elevation can submerge the smear zone and decrease hydrocarbon volatilization and aerobic respiration in this zone, resulting in an overall reduction in NSZD rate.
However, univariate and multivariate analysis could not support a relationship between NSZD rate and groundwater elevation [60], raising questions about the aforementioned implications. As such, the role of temporal flooding of the smear zone by water table fluctuations is largely speculative and unverified [60]. Additionally, NSZD mainly proceeds through methanogenesis followed by methane outgassing [44,45]. Since these mechanisms can occur in both saturated and unsaturated zones (read more in Section 2.1), actual NSZD rate might be immune to groundwater level fluctuations. Thus, it is not expected that combining the active remedial technology “pump and treat” and NSZD will greatly influence LNAPL mass loss rates through NSZD [60].
The effect of water table fluctuations is linked to precipitation and groundwater recharge which also causes the downward transport of micronutrients such as phosphorus and metal ions [9,25,28,60], or the flush of toxic metabolites [25], possibly removing inhibition and providing favorable conditions for microbial activities. This indicates interactions between water table changes, nutrients and substrate inhibition.

Appendix A.1.7. Electron Acceptors

Electron acceptors, such as oxygen (even at low concentrations), nitrate, manganese, iron and sulfate, were initially thought to hinder methanogenesis [25]. This argument was based on thermodynamic principles outlined by Wiedemeier et al. [79] (which is further discussed in Section 2.4.2) as well as some studies that justified major PHC degradation with relatively high oxygen reduction potential (ORP) of the environment as an indication of aerobic condition [181,182].
Though, a few culture studies conducted in the 1960s and 1970s (e.g., [183,184,185]) alongside many recent molecular studies (e.g., [86,92]) suggested that anaerobic PHC degradation can occur in the presence of sulfate, nitrate or Fe(III) [36,52]. Under these circumstances, sulfate and nitrate can act as alternate electron acceptors during anaerobic respiration [52]. It is speculated that the methanogenesis pathway shifts from hydrogenotrophic to acetoclastic in the presence of sulfate-reducing bacteria, because the hydrogen-scavenging behavior of these organisms can outcompete hydrogenotrophic methanogens such as Methanoculleus [41]. However, this syntrophic relationship might be restricted to degradation of relatively low molecular weight hydrocarbons, such as benzene [36], decane and toluene [186] because, to the best of our knowledge, no evidence of syntropy exists in the degradation of higher molecular weight hydrocarbons such as hexadecane and naphthalene [52]. Radioactive carbon isotope analysis suggested that hexadecane could only be removed in aerobic environments, without any anaerobic degradation potential even when nitrate and sulfate were added [187].
Methane oxidation is widely known as an aerobic process. Thus, the presence of oxygen is supposed to be crucial for methanotrophic metabolism. However, methanotrophs are seen to thrive in micro-aerobic environments (0.5–2% O2) rather than highly oxygenated environments. It is suspected that oxygen imposes inhibition at higher O2 concentration and is recommended to be quantified [152]. In addition, anaerobic methanotrophy occurs at considerable rates in anoxic coastal and wetland sediments, presumably via syntrophic relationship between methanotrophic archaea and sulfate-reducing bacteria with elemental sulfur transfer. Methanotrophic archaea is thought to oxidizes CH4 through a “reverse methanogenesis” [153,154,155]. However, Segarra et al. [155] suggested that anaerobic methane oxidation (AOM) might be sulfate independent and might rather link to nitrate, iron or manganese reduction [155]. Although AOM has not been considered in NSZD concept, it can be responsible for methane oxidation in LNAPL depletion in a contaminated subsurface given that the bottom layers of the unsaturated zone, confined between the aerobic vadose zone and the water table, may constantly experience anaerobic conditions. The outstanding question is “what the contribution of AOM to overall methane oxidation is at NSZD sites?”

Appendix A.1.8. pH and Alkalinity

Since NSZD mainly proceed through biological processes, the associated rate is expected to be altered by pH changes. Anaerobic processes operate in a narrow pH range (6.8–7.8). A pH out of this range can be detrimental, especially to methanogenesis which is particularly susceptible to low pH values [188,189]. Discussing substrate availability and inhibition (see above), it has been elucidated how a pH imbalance (pH < 6.0) can disrupt syntrophic relationships between hydrogen and formate-utilizing species and fermenting bacteria, causing system failure. Modelling anaerobic digestion performed by Oh and Martin [190] suggests that high hydrogen ion concentration (i.e., low pH) decreases acetic acid (HAc) decomposition (mol of decomposed HAc per mol of initial HAc), albeit not significantly. Without influencing methane yield (mol of produced CH4 per mol of HAc decomposed), it increases CO2 solubility. Since CO2 vaporization requires energy, it imposes such a significant effect on the overall enthalpy of the process that it can shift the exothermic reaction to an endothermic one [190]. This interaction between temperature and pH can result in an underestimation of NSZD rate quantified by thermal monitoring method at sites with high CO2 partial pressures.
The challenge is to maintain the pH above 6.5–6.6. Anaerobic digestion can produce low pH environments due to CO2 generation as well as VFA production (i.e., fermentation by-products). Accumulation of VFAs such as acetic, propionic, butyric and isobutyric acids is seen during startup or organic overload of anaerobic digesters used for wastewater management [188]. In anaerobic processes, chemical species which primarily regulate pH are those from carbonic acid systems (i.e., carbonate, bicarbonate, hydroxide). VFA production can diminish bicarbonate alkalinity, as these organic acids neutralize the bases in the bicarbonate system. If the VFA concentration is known, bicarbonate requirement can be determined following the stoichiometry provided in Rittmann and McCarty [188]. The VFAs to alkalinity ratio is used as an indication of the health of anaerobic processes.
To maintain the pH above 6.5, the alkalinity requirement of an anaerobic digester with a typical CO2 concentration in biogas (i.e., 25–45%) is 500–900 mg/L as CaCO3 under 35 °C and 1 atm. As CO2 pressure increases, the alkalinity requirement increases proportionately. However, increasing alkalinity beyond 5000 mg/L as CaCO3 does not benefit the system significantly [188].

Appendix A.2. Factors Regulating Apparent NSZD Rate

Appendix A.2.1. Gas and Heat Transport Mechanisms

Certain parameters have been used as surrogates for the measurement of apparent NSZD rate, such as subsurface gas (O2, CO2 and CH4), fluxes (in concentration gradient (CG), CO2 trap and dynamic closed chamber (DCC) techniques) and biogenic heat (in thermal monitoring method). The readers are referred to Section 3, Section 4 and Section 5 for further information. Any factor influencing the quantification of these parameters can affect the NSZD rate derived from the associated field measurements.
Gas diffusion outward, inward and within the subsurface depends on concentration gradients and effective diffusion coefficient (Dveff). As per recommendations of ITRC [55], Dveff is either measured using the methods proposed by Kreamer et al. [191] or Johnson et al. [192], or estimated using simulation approaches developed by Millington [193] and Millington and Quirk [194]. Estimating Dveff using the transient point concentration measurement-based method of Kreamer et al. [191] or model approach of Millington and Quirk [194] requires independent measurements of soil porosity and water content, because Dveff is greatly influenced by soil moisture. The in situ measurement protocol developed by Johnson et al. [192], which is referred to as the “transient volume-averaged concentration measurement-based method”, reduces the functional dependence on air-filled porosity (θv), removing the necessity of independent soil porosity measurements. In addition, injection and extraction volumes can be adjusted for different scales, making it a versatile method for any length requirement. However, it is not a suitable technique for soils with low permeability and high moisture content as these characteristics will prevent reliable injection and extraction of the tracer gases. Further, it cannot be used for highly heterogenous soils that show significant changes over small distances, as this characteristic contradicts fundamental assumption of this method, i.e., radial symmetry [192].
In thermal monitoring technique, it is assumed that subsurface heat is transferred to the ground surface and vice versa through conduction [12,46,81]. There are many sources/sinks of heat in the subsurface: (1) Cyclic surface heating/cooling, caused by solar radiation, black body radiation, precipitation and evaporative cooling of soil water. Surface cooling/heating either withdraws from or adds to the subsurface heat sink. If net surficial flow of energy (i.e., energy received–energy lost) is more than zero, there will be an inward heat conduction and vice versa. (2) Geothermal heating from below, which results from radioactive decay, magmatic intrusions and tectonic activity. This heat sink is nearly constant and causes a characteristic geothermal gradient resulting in outward heat propagation. Compared to sensible heat exchanges of soil with air and diurnal fluctuations in radiation, the effect of deep geothermal heating is negligible at land surface. (3) Microbial metabolism due to natural processes. (4) Anthropogenic infrastructure, such as nearby pipeline. (5) Heat associated with subsurface NSZD processes [12,81,195]. Spatial flow of heat depends on geographical features (latitude, altitude, topography), climate and meteorological parameters (e.g., precipitation, sunlight and wind), geology (soil and sediment composition, structure, layering and water content) and surface features (shading and vegetation) [81,195]. Geologic characteristics in different directions resulted from soil and sediment properties (thermal conductivity, specific heat capacity, sediment density) are an integral part of the subsurface conductive heat transfer equation defined by Karimi Askarani and Sale [81] which is used to convert subsurface thermal profiles to NSZD rate.
The heat associated with subsurface NSZD processes only exists in zones affected by LNAPL release and is hypothetically the contrasting feature of LNAPL impacted zones and background locations. However, under certain circumstances such as after precipitation events, natural conditions in background locations and NSZD zones can diverge, resulting in non-representative background-corrected measurements. Under extreme circumstances, loss of NSZD-associated heat may make the impression that LNAPL are being produced rather than being depleted. Negative background corrected temperatures are mostly seen at 15–30 cm bgs and should be removed from the database [46]. To prevent this issue, Karimi Askarani and Sale [81] have proposed a modified version of thermal monitoring technique called the “single stick” method which removes the need of background correction.

Appendix A.2.2. Signal Shredding

Drawing from the information about a mechanism observed in peatlands and known as “signal shredding” [196,197,198,199], Garg et al. [25] reasoned that a similar phenomenon may happen in the subsurface of NSZD sites and can be one of the many factors responsible for high temporospatial variability of NSZD rates exhibited by CO2 efflux measurements [25]. In peatlands, the intermittent release of high CH4 concentrations resulted from episodic ebullition of gas pockets has been observed [196]. Ebullition of CH4 from contaminated groundwater has been documented by Barber et al. [200]. A study on a pilot-scale aquifer with an ethanol plume has shown that substantial gas accumulation occurs in soil pore spaces, which does not exceed 27% of the pore volume despite an ongoing gas generation. This observation has been taken as an indication of gas ebullition in a contaminated subsurface which is anticipated to be induced by reaching gas phase mobilization (i.e., buoyancy–capillarity) thresholds [61,201]. Gas phase dynamics in contaminant plumes are highly complex [61], strengthening the argument of Garg et al. [25] about the occurrence and importance of signal shredding at NSZD sites. This implication, however, merits further research given no NSZD study has been dedicated to this phenomenon to date.

Appendix A.2.3. Meteorological Conditions

Meteorological conditions such as atmospheric pressure, wind, precipitation, ambient temperature, solar radiation and evaporation can control apparent NSZD rates. During field measurements, these factors influence on the manifestation of actual NSZD rates and can cause divergence of these two parameters.
Changes in atmospheric pressure leads to pressure gradients between the atmosphere and the subsurface and within the subsurface. Pressure fluctuations can penetrate up to 50 cm into the soil, with little or no depreciation, inducing bulk transport of trace gases throughout soil porous media, a phenomenon known as “barometric pumping”. Barometric pumping can either stimulate or hinder advective soil gas migration upward toward the ground surface. Barometric pumping can drive the atmospheric gases into soil when a sudden increase in atmospheric pressure occurs [108,202,203,204]. Barometric pumping is caused by diurnal pressure and temperature fluctuations [37]. Studying fugitive gas at oil and gas well pads under controlled conditions, Forde et al. [202] demonstrated that gas emission from the vadose zone was directly influenced by barometric pressure changes. CH4 efflux increased 20 times in less than 24 h in response to a decrease in atmospheric pressure. The effect of barometric pumping is most relevant at sites with thick vadose zones (i.e., sites with deep water tables) [202]. In Takle et al. [203], similar results were achieved with respect to CO2 effluxes in agricultural dry soil and no vegetation. Under conditions conducive to barometric pumping (i.e., greater pressure, pumping rate and wind speed), the effect of advection on soil CO2 fluxes compared to the effect of diffusion increased by a factor 5–10 [203]. Stochastic modelling combined with field data of soil property and soil gases proposed that short-term, wind turbulence-induced pressure fluctuations could become the most significant factor for landfill gas transport and emissions at sites with relatively low soil air contents, compared to the effects of diffusion and long-term pressure changes (e.g., due to passing weather systems) [205].
Precipitation (and the subsequent water table fluctuations) can result in controversial consequences. It may impede gas transport mechanisms or alter the subsurface thermal profile in ways that biases are introduced into NSZD rate measurements using any technique introduced in this paper (see Section 3, Section 4 and Section 5), most likely resulting in temporal underestimation of NSZD rate (apparent NSZD rate << actual NSZD rate). From one perspective, precipitation temporarily decreases soil porosity due to an increase in soil moisture content, which can prevent O2 influx and/or CH4 upward flux and thus diminishes or temporarily ceases methane oxidation in the vadose zone of NSZD sites [46,81]. A large flow of energy (i.e., heat generation) occurs only when methane reaches the methane–oxygen front and methane oxidation happens, which is thereafter captured by thermocouple sticks of thermal monitoring method [78]. Precipitation and higher moisture conditions have shown to directly relate to greater temperature differentials alongside the depth in landfills [206]. Moreover, gas transport mechanisms and subsurface temperature are affected by surface heating and cooling caused by incoming and outgoing solar radiations, warmer/colder meteoric water infiltration, evaporative cooling due to high latent heat of water, etc. [81]. For example, it is anticipated that thermal expansion of soil air due to either soil heating or evaporation of deep water content can contribute up to 60% to soil gas fluxes [203].
From a different perspective, precipitation can have a positive effect on anaerobic processes. Rainfall events have been correlated with a surcharge of nutrients into the source zone which seem to be the cause for an occasional increase in methanogenic rate [9,25,28,60] (also see discussions related to nutrients and water table fluctuations). Similarly, heat gain episodes in landfills have been attributed to high precipitation and wet wastes, which could be attributed to enhanced anaerobic decomposition of waste [206,207,208]. The nature of landfill and NSZD sites is different as the former is an engineered soil-based ecosystem and the latter is a natural setting contaminated due to LNAPL release, making extrapolating the results from one to the other challenging. However, these observations on landfills (e.g., [206,207,208]) can support the relation of increased methanogenesis rate at NSZD sites after precipitation events with nutrient transfer into the contamination source. Nonetheless, Yeşiller et al. [207] ascertained that precipitation did not result in further heat generation after a certain point (i.e., 2.3 mm precipitation per day). This implicitly suggests the contradictory effect of precipitation on different biogeochemical processes acting on the contamination source zone (i.e., adverse effect on methane oxidation and positive impact on methanogenesis).
Meteorological conditions interact with surface properties, imposing additional effects on gas transport mechanisms. Wind interactions with terrain and vegetation cause fluctuations in static field pressure and may lead to additional pressure pumping at the surface [203].
The above discussion underscores the importance of meteorological conditions in determining apparent NSZD rates. Therefore, monitoring meteorological conditions including wind, temperature, pressure, relative humidity and precipitation is critical and must be included in field data collection campaigns for NSZD rate quantification. Continuous monitoring is necessary to capture annual surficial gas emissions in not only engineered ecosystems (e.g., landfills) and anthropogenic impacted areas (i.e., NSZD sites) but also natural environments (e.g., peatlands, wetlands, lakes) [46,81,144,204]. Point-in-time measurements which are repeated every 30 days or more provide a low-resolution temporospatial map of the NSZD rate signatures (i.e., gas effluxes and heat generation) which do not reflect the impact of changes in climatic conditions occurring at higher resolutions. It was observed that point-in-time measurements with long time intervals introduced significant uncertainties (i.e., 28.8% underestimation to 32.3% overestimation) into long-term, integrated methane emissions from landfills. CH4 emission in landfill has shown 35-fold variations due to barometric pumping. At least 10 days of continuous measurement is proposed to capture 90% of the total variance in CH4 emission in landfills [204].

Appendix A.3. Factors Regulating Actual and Apparent NSZD Rates Simultaneously

Appendix A.3.1. Soil Properties

Soil physical properties, including soil type and soil moisture, affect not only LNAPL biodegradation rate (i.e., actual NSZD rate) but also the perceived rate of NSZD (i.e., apparent NSZD rate). Soil type reflects the combined effects of soil texture (i.e., percentages of soil separates, such as sand, silt, clay) and soil structure (fluffy vs. clustered soil) and soil water content greatly depends on it [25,152]. Two soil samples collected a few kilometers apart which were subject to similar climatic conditions but had different organic matter contents (4.7 vs. 10.9 wt%) showed different moisture content (10.0 vs. 10.2 d.w.%, respectively) [152]. Although this difference looks marginal, it can indicate the possibility of a relation between soil organic matter content and soil moisture.
Moisture content is a critical factor for methane oxidation in any soil type [25,152]. Soil physical properties, especially soil moisture, regulates soil’s capacity for allowing transfer of oxygen (O2 influx) which is introduced into the subsurface either directly from the atmosphere in gaseous form [41] or by meteoric waters in dissolved form [48] and is a requirement for the metabolism of aerobic methanotrophs. High water content can cause a physical limitation for gas diffusivity in soil, preventing oxygen influx [209]. It similarly affects diffusion of other soil gases such as CH4. Methane diffusion in water is four orders of magnitude less than that in air [152]. On the other hand, low water content acts as a biological barrier, as it can disrupt metabolic activities of methanotrophic bacteria due to water stress [209].
Optimum soil moisture for methanotrophy increases with the increase in field capacity (FC), a parameter which indicates the water holding capacity of soil. Based on field observations at native and cropped grasslands, del Grosso et al. [209] developed a model that could predict CH4 oxidation rates in a wide range of soil types (i.e., grasslands, cropped land and coniferous, tropical and deciduous forests), using water content as an input parameter, among many other parameters (e.g., temperature, porosity and FC). According to this model, the primary factors controlling CH4 uptake by methanotrophs were soil moisture and the associated soil physical properties (i.e., soil gas diffusivity, soil bulk density and the FC) [209]. Optimal moisture for methanotrophy is close to soil’s FC [209,210] and is reported 8–10 v/v% in coarse-grained soil and 10–15 v/v% in fine-grained soil [209]. It is reported 10–20 wt% in sandy-loam soil [211] and 11 wt% in sandy-clay-loam soil [212]. Laboratory experiments of Stein [152] suggested an optimum of 15 d.w.%. Coarse-grained soils with less water holding capacity reduce the possibility of flooding and soil oversaturation. Therefore, greater methane oxidation is reported for coarse-grained soils with relatively low FC, compared to fine-grained counterparts [213].
As the water holding capacity of soil reduces, such as that in coarse-grained soil, the methane uptake rate can be less limited by soil gas diffusion. This effect causes the effect of temperature to be intensified. del Grosso et al. [209] observed that as dependence of CH4 oxidation rate on gas diffusivity decreased (potentially due to changes in soil texture and structure), temperature could become a controlling factor [209], suggesting an interaction between soil properties and temperature. In a microcosm study performed on tropical paddy soils, Das and Adhya [214] observed interactions between the effects of soil water content, ambient temperature and atmospheric CO2 concentration on not only methanotrophy but also methanogenesis and realized that the effect of temperature (and also CO2 concentration) was intensified under non-flooded conditions. CH4 oxidation decreased significantly with a rise in temperature [214]. Stein [152] argues that soil moisture content is a site-specific variable and depends on climatic factors such as temperature, solar flux, average wind speed and vegetative cover.
Soil type can affect the composition of LNAPL residues, which in turn controls the effective endpoint of biodegradation [157]. This can be translated to the influence of soil type on LNAPL longevity. As biodegradation of total petroleum hydrocarbon (TPH) progressed, Chang [157] monitored changes in the ratios of residual concentrations of different alkanes (C14, C16 and C18) and found that soil aggregates at a range of 0.6–2 mm tended to retain non-bioavailable TPH residuals.

Appendix A.3.2. Seasonality (Seasonal and Diurnal Changes)

Seasonality alters the transport mechanisms of gas and heat in soil. Seasonal and diurnal climatic conditions impact air temperature, surface properties (such as soil frost and ice/snow cover during long winters of Canada) and soil moisture. Soil moisture is impacted due to periodic precipitation and changes in soil temperature, which indirectly regulates physical and biological processes occurring in the subsurface, including gas (e.g., CH4) exchange with the atmosphere and the rate of microbial processes (e.g., heterotrophic respiration) and enzymatic reactions [26,28,215,216,217,218,219,220]. In a comprehensive study, Sihota et al. [26] researched the effect of seasonality on NSZD rate and realized that many parameters were altered by season: (1) surficial CO2 efflux, which corresponded to total soil respiration (TSR); (2) fractional contributions of natural and contaminated-driven soil respiration (NSR and CSR, respectively) to the TSR—the NSR dominated in spring and summer and the CSR was the major contributor in fall and winter; (3) subsurface gas concentrations—there was a lag phase of 5 to 7 months between the peak surficial and peak subsurface CO2 concentrations due to gas migration; (4) surface properties (i.e., periods of frozen soil) which could entirely hinder CO2 efflux and result in CO2 accumulation in the subsurface [26]. The findings of Sihota et al. [26] demonstrated how seasonal variations affect not only apparent NSZD rates due to their effects on gas transport mechanisms but also the microbial NSZD degradation rate. It was observed that average annual NSZD rate was 60% less than that during summer [26].

Appendix A.3.3. Surface Properties and Anthropogenic Infrastructure

Surface properties can alter gas and heat exchange between the subsurface and atmosphere, influencing apparent NSZD rate quantified with any of the current techniques. Artificial surfaces (e.g., impervious pavements), low permeability soil (i.e., clay and silt lenses) and compact soil due to use of heavy equipment can provide a conducive environment for horizontal gas migration, through preventing vertical gas transport [47]. It was seen that soil gases did not establish significant vertical concentration gradients at shallow and deep depths under an asphalt surface, indicating soil gas buildup under artificial caps [134]. Similar phenomenon was observed in Sihota et al. [26], where a natural condition (i.e., soil frost during winter) resulted in CO2 accumulation in the subsurface. A parametric study performed by Hanson et al. [206] indicated a similar effect on subsurface thermal profiles. Use of insulating materials in landfill covers decreased temperature variations compared to uninsulated conditions [206], suggesting that surface capping (either anthropogenic or natural) may interfere with subsurface temperature gradients caused by NSZD.
Vegetation, shading and artificial surfaces with different light reflection properties change surface albedo and the energy received at grade, resulting in fluctuations in diurnal and seasonal net surficial energy (see the definition provided in discussion related to the factor “Gas and heat transport mechanisms”) which in turn controls heat exchange between the subsurface, ground surface and atmosphere. Spatial flow of heat in the subsurface, especially in shallow depths, depends on vegetation and shading, among many other geographical and geological features of the measurement location [195]. Contrasting surface features between background location and LNAPL impacted areas, such as dissimilar surface covers, surface temperatures, vegetation and low permeability which can also cause distinct infiltration rates and moisture contents, is one of the major limitations of the biogenic heat method. The associated differences can sometimes cause greater background temperatures than those observed in the contaminated zone [22]. As an example, such a condition will occur when a background location is chosen at a zone with direct sunlight and an asphalt surface, while the impacted zone is located at an unshaded area with vegetative cover. This introduces negative background-corrected data points in the data set [81].
Subsurface infrastructure, such as pipelines, can add thermal energy to the subsurface, resulting in overestimation of the NSZD rate (i.e., apparent NSZD rate > actual NSZD rate). As such, Warren and Bekins [12] considered two background locations, one out of the contamination zone for resolving the heat associated with natural biogeochemical processes and the other one 5 m downgradient of the nearby pipelines to account for the heat originating from this anthropogenic source. The contamination source of many NSZD sites is a pipeline rupture (e.g., in 1979 at Bemidji Site in Minnesota [9,12,25,26,32,33,87,176,221]; a Husky Energy pipeline break in 2016 [7]). Given the stability of LNAPL body extent, contaminated sites are typically located at the vicinity of the source pipelines. Typically, LNAPL mobility is the highest during the release time. When the release stops, pressure gradients and the driving head decrease, resulting in gradual decline in the source zone mobility [17,222]. As such, this consideration is necessary given that pipelines transport oil at a temperature generally higher than ambient temperature range.
It is hypothesized that surface properties can influence on actual NSZD rate as well. Tracy [47] argues that based on Le Chatelier’s principle, accumulation of reaction by-products (i.e., gas vapors) can establish an equilibrium at lower rates due to surface capping, resulting in decreased rates of all forward reactions including biodegradation, dissolution and volatilization [47]. Although this hypothesis is theoretically valid, it requires further investigation to determine whether and how subsurface heterogeneity and complexity can influence on the importance of this factor in regulating actual NSZD rate.

Appendix B. Advantages and Limitations of NSZD Rate Quantification Techniques: Literature Summary

Appendix B.1. Concentration Gradient (CG)

The GC method can instantaneously measure subsurface gas concentrations. If the measurements can be limited to below the depth of background O2 consumption and CH4 production, the need for background correction can be removed depending on the selected depth of samplers/sensors [29]. The use of naturally occurring and non-reactive (or relatively inert) argon (Ar) and nitrogen (N2) gases can identify the principal LNAPL removal mechanism, namely the physical and chemical processes related to methanogenic activity in the subsurface [27]. Thus, the GC techniques can quantify the NSZD rate associated with both LNAPL volatilization and biodegradation [29]. This method can give a clear understanding of subsurface conditions at the NSZD sites. It has shown that O2 consumption and CH4 oxidation happens in a relatively thin layer above LNAPL body [11]. As a side benefit, the soil texture and properties (e.g., soil moisture) in a soil column can be determined during a GC test, because soil core sampling should be done when installing the equipment. This can resolve vertical soil heterogeneity. Understanding soil properties is of paramount importance when mathematical models such as the Millington Quirk equation or one-dimensional uniform media diffusion model are used [11]. Soil homogeneity is a fundamental assumption of these models, which should be verified at each individual site through sampling. This method can be used for capped sites, such as covered landfills [47].
Contrary to these advantages, the GC method has some limitations. It is intrusive as it requires subsurface sampling. The method is time-consuming and labor-intensive for equipment installation, sample collection, collection of in situ reading and data reduction and analysis [29]. Diffusion coefficient is a critical parameter in this method. As discussed below, this coefficient can vary spatially and temporally by several orders of magnitude at heterogeneous sites [11,22]. Thus, extrapolation of this coefficient from site to site must be avoided. The value of this coefficient should be validated at the time of soil vapor data collection at the measurement spot to improve method accuracy [22]. Since it is a short-term measurement, it can only provide a snapshot of subsurface gas profiles. The GC method can only account for diffusive gas transport [29]. Gas transport in soil is affected by two phenomena: (1) diffusion (regulated by concentration gradients); (2) advection (dictated by pressure gradients) [55,223,224]. Thus, the obtained results are not representative of site conditions where advection is the dominant gas transport mechanism. Recently, it has come to light that in theory, advection can contribute more to biogenic gas transport at sites with relatively high NSZD rates [22]. Wind-induced gas transport caused by pressure fluctuations and reaction-induced advection were found to be the most important gas transport mechanisms in Poulsen and Møldrup [205] and Amos et al. [27], respectively.
The results of the GC technique are subject to many environmental conditions, such as barometric pressure [225], surface wind [205,225], precipitation [47] and water table fluctuations [11,29,225]. Gas distribution within the subsurface and gas exchange between soil and the atmosphere strongly depend on the effective diffusion coefficient. The diffusion coefficient is highly sensitive to soil texture and soil moisture which are individually affected by the above-mentioned factors (read more in Section 2.3). For example, with coarse soil texture and high moisture content, the effect of wind can be pronounced [47]. The GC method is not applicable to cases with a shallow aquifer, due to the interference of the water table and the capillary fringe with gas transport mechanisms [29,225]. Even with a water depth of 3–6 m below ground surface (bgs) which characterizes the aquifer as relatively deep, soil moisture varied by up to a factor of 400 within the same location [11], compounding the subsurface heterogeneity. Diffusion varies spatially (both laterally and vertically) and temporally. Variation in diffusion is proportionate with soil moisture content, making it a relatively less reliable method for highly heterogeneous sites [11,22]. In addition, the results obtained by the GC method are subject to anthropogenic interferences, such as impervious surfaces (e.g., concrete and asphalt pavements and compact soil at grade due to heavy equipment usage). Impervious and compact surfaces can prevent the escape of subsurface gases to the atmosphere, resulting in small apparent concentration gradients [134].

Appendix B.2. Dynamic Closed Chamber (DCC)

Dynamic closed chamber (DCC) technique gives instantaneous measurement of surficial CO2 effluxes; it can perform in situ CO2 efflux analysis within 90–120 s [47,111]. Short-term and long-term measurements are possible, depending on the equipment that is used. The method was traditionally used for short-term measurements. For long-term measurement, repeated measurements over an extended period at a subset of locations are needed, to capture temporal variation on different timescales (diurnal and seasonal) [22,23]. The DCC chamber typically sits on the ground surface for a short period of time (90–120 s) [47,111], providing snapshots of emission concentrations [22,23]. The device can give multiple measurements in a short period of time, making long-term measurements feasible with this method. The method can theoretically provide an infinite number of readings per day or hour, which can resolve hourly/daily fluctuations [11]. With recent advances in the device automation by LI-COR Biosciences [226] and Worley UK (personal communication), long-term measurement using DCC method is more convenient and readily feasible. LI-COR device (e.g., model LI-8100-104) automatically raises and lowers the chamber at defined time intervals [226].
The method provides real-time field values. The device is easy to transport. The method is minimally intrusive because the device is placed at ground surface and the collar penetrates the soil only a few centimeters to provide a seal. The method accounts for both diffusive and advective gas transport mechanisms.
New device designs provide some advantages to minimize chamber interference with natural conditions of the measurement spot. Worley’s design intermittently purges the flux chamber with atmospheric air. LI-COR chamber seals over a soil collar with a thin gasket to minimize leaks and wind effects [226]. LI-COR design can provide more accurate measurements, as pushing in or pulling out the air (such as that in Worley’s design) can influence concentration gradients at the soil–atmosphere interface, introducing bias into soil gas emission measurements. The most recent LI-COR device has a pressure vent which is developed based on a special design proposed by Xu et al. [227]. This pressure vent tends to maintain an ambient pressure inside the chamber under windy conditions. Xu et al. [227] argue that using just a simple tube as a vent can cause negative pressure excursions inside the chamber due to the venturi effect, which can ultimately result in a significant overestimation of CO2 efflux. The DCC method is suitable for site-wide surveys [47], for example, for screening the LNAPL impacted areas.
The use of this method, however, is constrained due to a few limitations. It is a labor-intensive and time-consuming method (although much less than the CG). It requires trained personnel to properly use the device and collect reliable data. If the traditional DCC devices are used, enough measurements should be manually repeated over an extended period to resolve long-term CO2 efflux patterns [23].
The method requires correction for natural soil respiration (NSR). This correction can be performed using:
(i)
Stable carbon and radiocarbon isotope analysis. This approach needs sample collection, expensive analytical procedure and trained personnel for the analysis [35,56,134];
(ii)
Background correction method [34,35]. Finding a background location which can be representative of the NSR of NSZD spot poses a great challenge. The background location should be far enough from the LNAPL impacted zone. Yet, it should have the same surface and subsurface characteristics to reflect soil heterogeneity at the impacted zone (read more in Section 4.4).
The method can estimate NSZD rate via biodegradation only, assuming that LNAPL mass loss is entirely through microbial activity and that all the methane produced through methanogenesis is ultimately oxidized to CO2 by methanotrophs [32]. It might be a safe assumption in aged LNAPL release sites where methanogenesis and sulfate reduction has become the primary LNAPL removal pathway [46,228]. Under select conditions, NSZD can be driven through other processes though [39]. For example, in recently contaminated sites, LNAPL volatilization and other natural attenuation processes may play key roles in LNAPL mass loss [229].
Accuracy of this method can be adversely affected by environmental conditions, such as barometric pumping [202,230], wind [231,232], precipitation and soil moisture [232]. Decrease in barometric pressure causes gas breakthroughs with over 20-fold increase in a short period (<24 h), even at low-permeability surfaces [202]. Surface wind can cause pressure differentials between the surrounding atmosphere, the soil underneath and inside the chamber, introducing biases into measurements depending on wind velocity [22,232]. After rainfalls, soil supersaturation can block soil gas emissions [47] although NSZD can be still ongoing and thus gas (CO2 and/or CH4) can accumulate in the subsurface. This phenomenon may result in underestimation of NSZD rate (if the measurement is performed right away after precipitation, when the soil is still soaked) and overestimation (if the measurements performed when the soil is drying and a “puff” of underground gas is vented). Thus, it is recommended to avoid field measurements during and shortly after rainfall events [22]. With the recent effort in upgrading the chamber design as discussed above, some of these effects can be alleviated. Although, due to the nature of the problem, the issue may not be completely resolved by chamber modification. For instance, irregularities caused by atmospheric pressure changes can be averaged out by frequent or continuous monitoring [47,202].
This method cannot be used throughout the entire year in cold regions, like Canada, where frozen soil and ice covers are expected during winters which can inhibit gas emission. Sihota et al. [26] observed episodes of depressed surficial CO2 efflux and elevated CO2 concentration in the subsurface, which coincided with periods of frozen soils. It is highly likely that the DCC (similar to any other CO2 efflux measurement technique) captures NSZD rates with a few months’ delay. A difference of 5 to 7 months was seen between peak subsurface CO2 concentrations and peak surface efflux, which was consistent with the estimated travel time for subsurface gas migration [26].
Results are subject to anthropogenic interferences. For example, the method cannot be applied to impervious surfaces such as paved (concrete and asphalt) and compacted surfaces (e.g., compact surface due to heavy equipment usage) [47]. No or little gas emissions from these surfaces can incorrectly conclude that no NSZD is occurring at LNAPL impacted sites. In addition, at sites with high soil heterogeneity, if the chamber collar is placed in a relatively low permeability zone, preferential flow pathways form, such as the chimney effect [22,47]. At compact soil surfaces, this may affect the seal between chamber and ground surface negatively, resulting in underestimation of NSZD rate due to leakage and loss of CO2 efflux [11].

Appendix B.3. CO2 Trap

Passive CO2 trap method or in short CO2 trap can provide time-integrated, long-term measurement of surficial CO2 effluxes; it is because the deployment time of the device at grade ranges from 10 days to a month, typically 2 weeks [11,22,30,37,46,47,56,108]. It is simple and cost-effective. It can give long-term efflux measurements with less difficulty and cost (compared to DCC). The device is simpler and less expensive as it does not require automation. It is a passive method, as it requires minimal effort for field deployment of the device (the samples can be analyzed in an independent lab which can, however, increase the cost). It can alleviate the adverse effect of barometric pumping as it provides continuous measurement over an extended period. Thus, the data collected through this method are less sensitive (than DCC) to atmospheric pressure changes [37,56]. The method is minimally intrusive; the device is placed on the ground surface and the collar penetrates the soil only a few centimeters (1–18 cm [30,47,56]) to provide a seal. It is recommended to install trap’s receiver a few days or weeks before deployment, to offset the adverse effects of mechanical disruptions caused by device installation [30,56]. Traps have the potential to account for both diffusive and advective gas transport mechanisms. The method is suitable to use for long-term monitoring of NSZD sites.
On the other hand, the method is time-consuming, as the device should remain at field for typically 2 weeks [11,30,37,46,47,56,108]) and requires further downstream laboratory analysis and data reduction. The detection limit of this method depends on the device’s opening and the field deployment time. With a 10 cm (4”) opening diameter and 4-day deployment period, the detection limit is 0.5 μmol CO2/m2/s, which can reduce four times increasing the diameter to 20 cm (8”) [22].
Similar to DCC, accuracy of this method can be adversely affected by environmental conditions, such as barometric pumping [202,230], wind (Gillis and Miller, 2000; Lundegard et al., 200, precipitation [22] and soil moisture [232]. However, the variations due to barometric pumping are most likely captured by this method as discussed above. Surface winds can cause pressure differentials between the surrounding atmosphere, the soil underneath, inside the trap and the trap’s rain cover, due to a venturi-like effect [47]. Under strong (4.5–5.4 m/s) and relatively weak (2.2–3.6 m/s) wind, lab experiments suggested that the DCC could underestimate given flux by 46% and 78%, while CO2 trap overestimated it by 60% and 122%, respectively [47], indicating the stronger effect of wind on trap and also the proportional relation of the wind velocity and the bias introduced into the measurements. Precipitation can have the same effects on CO2 trap as those described for DCC [22]. During precipitation events coinciding with field deployment of trap, a rain cover can be used to prevent the wetting of the soil underneath. The formed rain shadow can develop a preferential flow pathway towards the trap [47], causing CO2 efflux overestimation. One the other side of the spectrum, soil saturation can happen as well, which prevents gas emission at grade although the subsurface remains active in terms of contamination degradation. The magnitude of the precipitation effect has not been quantified thus far [22], which warrants further research.
The same disadvantages as those applied to the DCC are applicable to CO2 trap as well, including that it can estimate NSZD rate via biodegradation only, the results are subject to anthropogenic interferences, it cannot be used throughout the entire year in cold regions like Canada, and it is highly likely that it captures NSZD rates with a few months’ delay.

Appendix B.4. Thermal Monitoring

Thermal monitoring technique gives a long-term measurement of biogenic heat, which can translate to long-term NSZD rate resolution. The method is characterized with flexible measurement duration. Short-term NSZD rate estimation can be conducted using thermistors for having snapshots of site conditions and yearlong measurement can be performed using thermocouples. Yearlong data collection is critical when NSZD serves as the sole and long-term remedial technique. In this case, analyzing longevity and composition of LNAPL is an integral part of the remediation strategy [22].
The method is cost-effective, depending on the procurement cost of the data acquisition equipment [233] and also if the existing borehole is used for inserting the thermal sticks [22,145,146]. Due to these economic advantages, continuous monitoring and high-density data collection over a year or longer is readily feasible. This approach helps to remove the uncertainty rising from temporal variability. Continuous measurement allows averaging out positive and negative biases of apparent NSZD rate measurements which can eventually converge to actual NSZD rate [46]. The method has fewer biases due to climatic factors (e.g., barometric pumping) compared to other techniques. The technique has an improved accuracy compared to other methods. It is because thermal properties of subsurface media can be more uniform than gas diffusion coefficients and soil properties such as permeability [81]. Thermal monitoring technique is suitable for long-term monitoring of NSZD sites, especially at regions with natural (e.g., ice cover) and artificial (e.g., urban developments with pavements) impervious surfaces.
However, the method is intrusive, as the thermal sticks should be inserted in the subsurface through deep drilling systems (e.g., boreholes up to 12 m deep) [46]. It is labor-intensive for field installations and the subsequent desktop analysis (data analysis and reduction). If remote sensing is adopted, the devices (stick, thermocouples, electrical circuits, data acquisition device, weather box, etc.) should be installed at field. Use of analog thermistors, on the contrary, require a few field days of data collection (in situ readings). Soil core sampling for determining thermal conductivities and heat capacity of soil is required. These are two important parameters of the energy balance used for data analysis. However, if remote sensing and data acquisition is adopted, field works can be restricted to just a few days per year for system setup and maintenance. Moreover, it requires intensive data reduction and mathematical and programming skills for data analysis.
The method requires background correction. Locating the most appropriate background poses a great challenge in this technique [22,46,81], similar to DCC and CO2 trap methods (see above). Background location should have the same surface and subsurface properties (i.e., surface cover, soil stratigraphy and depth (of vadose zone) to groundwater) as those of measurement spots, to accurately determine non-NSZD-related heat generation [22]. These similarities should persist throughout the entire monitoring time with respect to all factors that control surface heating and cooling (e.g., albedo, infiltration, evaporation, precipitation and incident radiation) [81]. Selecting the background location becomes even more challenging knowing that anthropogenic equipment and infrastructure (e.g., active pipelines) can also be additional sources of subsurface heat [22]. In case of precipitation, infiltrating runoff can disrupt oxygen influx and methane oxidation; the latter is the primary source of biogenic heat at NSZD sites [22,46,78,81,145] (also see Section 5). Under this circumstance, the heat profile of NSZD areas and the background location can converge, leading to marginal apparent NSZD-related heat or sometimes negative background-corrected data which make the impression that LNAPL are being produced. This problem leads to failure of one of the key assumptions of this technique; that is, background location is constantly representative of non-NSZD sources of heat in the impacted areas [46]. Negative background-corrected data mainly occur at shallow depths (15 to 30 cm bgs). These values should be excluded from the database. Increasing the number of probes at shallow depth will help reduce the frequency of excluding erroneous data [46]. There has been a recent advancement and newly published research that can allow the removal of the background correction requirement for this method, titled the “single-stick computational approach” [81].
The accuracy of this method is highly sensitive to environmental factors that can either suppress or cease methanotrophic activity (i.e., the primary source of NSZD heat in LNAPL impacted spots). These environmental factors include soil moisture, atmospheric exchange of oxygen and precipitation [22,46].
Similar to DCC and CO2 trap, thermal monitoring can estimate NSZD rate via biodegradation only, assuming that LNAPL mass loss is entirely through microbial activity and that all the methane produced as a methanogenesis by-product is ultimately oxidized to CO2 by methanotrophs.

References

  1. Government of Canada. Crude Oil Facts [WWW Document]. URL. 2020. Available online: https://www.nrcan.gc.ca/science-data/data-analysis/energy-data-analysis/energy-facts/crude-oil-facts/20064 (accessed on 7 January 2021).
  2. Cakir, E.; Sevgili, C.; Fiskin, R. An analysis of severity of oil spill caused by vessel accidents. Transp. Res. Part D 2021, 90, 102662. [Google Scholar] [CrossRef]
  3. Yang, Z.; Shah, K.; Laforest, S.; Hollebone, B.P.; Lambert, P.; Brown, C.E.; Yang, C.; Goldthorp, M. A study of the 46-year-old Arrow oil spill: Persistence of oil residues and variability in oil contamination along Chedabucto Bay, Nova Scotia, Canada. J. Clean. Prod. 2018, 198, 1459–1473. [Google Scholar] [CrossRef]
  4. Lee, K.; Wells, P.G.; Gordon, D.C. Reflecting on an anniversary. The 1970 SS arrow oil spill in Chedabucto Bay, Nova Scotia, Canada. Mar. Pollut. Bull. 2020, 157, 111332. [Google Scholar] [CrossRef]
  5. Our World in Data. Fossil Fuels. Available online: https://ourworldindata.org/fossil-fuels (accessed on 5 October 2020).
  6. Naz, S.; Iqbal, M.F.; Mahmood, I.; Allam, M. Marine oil spill detection using synthetic aperture radar over indian ocean. Mar. Pollut. Bull. 2020, 162, 111921. [Google Scholar] [CrossRef] [PubMed]
  7. DeBofsky, A.; Xie, Y.; Jardine, T.D.; Hill, J.E.; Jones, P.D.; Giesy, J.P. Effects of the husky oil spill on gut microbiota of native fishes in the North Saskatchewan River, Canada. Aquat. Toxicol. 2020, 229, 105658. [Google Scholar] [CrossRef]
  8. Hong, S.; Yoon, S.J.; Kim, T.; Ryu, J.; Kang, S.G.; Khim, J.S. Response to oiled wildlife in the management and evaluation of marine oil spills in South Korea: A review. Reg. Stud. Mar. Sci. 2020, 40, 101542. [Google Scholar] [CrossRef]
  9. Baedecker, M.J.; Eganhouse, R.P.; Bekins, B.A.; Delin, G.N. Loss of volatile hydrocarbons from an LNAPL oil source. J. Contam. Hydrol. 2011, 126, 140–152. [Google Scholar] [CrossRef]
  10. Atekwana, E.A.; Atekwana, E.A. Geophysical signatures of microbial activity at hydrocarbon contaminated sites: A review. Surv. Geophys. 2010, 31, 247–283. [Google Scholar] [CrossRef]
  11. Kulkarni, P.R.; Newell, C.J.; King, D.C.; Molofsky, L.J.; Garg, S. Application of Four Measurement Techniques to Understand Natural Source Zone Depletion Processes at an LNAPL Site. Ground Water Monit. Remediat. 2020, 40, 75–88. [Google Scholar] [CrossRef]
  12. Warren, E.; Bekins, B.A. Relating subsurface temperature changes to microbial activity at a crude oil-contaminated site. J. Contam. Hydrol. 2015, 182, 183–193. [Google Scholar] [CrossRef]
  13. Emerson, E.D. Biotic Control of LNAPL Longevity—Laboratory and Field-Scale Studies. Master’s Thesis, Colorado State University, Fort Collins, CO, USA, 2017. [Google Scholar]
  14. Revesz, K.; Coplen, T.B.; Baedecker, M.J.; Glynn, P.D.; Hult, M. Methane production and consumption monitored by stable H and C isotope ratios at a crude oil spill site, Bemidji, Minnesota. Appl. Geochem. 1995, 10, 505–516. [Google Scholar] [CrossRef]
  15. Interstate Technology & Regulatory Council (ITRC). Chapter 6: LNAPL Remedial Technology Selection. In Light Non-Aqueous Phase Liquid (LNAPL) Site Management: LCSM Evolution, Decision Process, and Remiedial Technologies. LNAPL-3; Interstate Technology & Regulatory Council (ITRC): Washington, DC, USA, 2018; p. 14. [Google Scholar]
  16. United States Environmental Protection Agency (USPEA). Superfund Remedy Report, 16th Edition—EPA-542-R-20-001; United States Environmental Protection Agency (USPEA): Washington, DC, USA, 2020. [Google Scholar]
  17. Interstate Technology & Regulatory Council (ITRC). Light Non-Aqueous Phase Liquids (LNAPL) Site Management: LCSM Evolution, Decision Process, and Remedial Technologies (LNAPL-3) [WWW Document]. URL. 2018. Available online: https://lnapl-3.itrcweb.org/ (accessed on 7 January 2021).
  18. Sale, T. Answers to frequently asked questions about managing risk at LNAPL sites. API Soil Groundw. Res. Bull. 2003, 18, 1–20. [Google Scholar]
  19. Hou, D.; Al-Tabbaa, A. Sustainability: A new imperative in contaminated land remediation. Environ. Sci. Policy 2014, 39, 25–34. [Google Scholar] [CrossRef]
  20. United States Environmental Protection Agency (USEPA). Introduction to the 2019 TRI National Analysis. Toxics Release Inventory National Analysis Overview. 2019. Available online: https://www.epa.gov/newsreleases/epa-publishes-2019-annual-toxics-release-inventory (accessed on 5 October 2020).
  21. United Nations. Department of Economics and Social Affairs: Sustainabile Development Goal (SDG) #13 - Climate Change. Available online: https://sdgs.un.org/topics/climate-change (accessed on 3 May 2022).
  22. Interstate Technology & Regulatory Council (ITRC). Appendix B—Natural Source Zone Depletion (NSZD) Appendix, In Light Non-Aqueous Phase Liquid (LNAPL) Site Management: LCSM Evolution, Decision Process, and Remiedial Technologies. LNAPL-3; Interstate Technology & Regulatory Council (ITRC): Washington, DC, USA, 2018; pp. 1–35. [Google Scholar]
  23. DiMarzio, J.; Zimbron, J. Natural source zone depletion (NSZD)—A key part of the LNAPL conceptual site model. LUSTLine Bull. 2019, 85, 18–21. [Google Scholar]
  24. Reyenga, L. Monitored natural source zone depletion measurement frequency. Appl. NAPL Sci. Rev. 2020, 8, 1. [Google Scholar]
  25. Garg, S.; Newell, C.J.; Kulkarni, P.R.; King, D.C.; Adamson, D.T.; Renno, M.I.; Sale, T. Overview of natural source zone depletion: Processes, controlling factors, and composition change. Ground Water Monit. Remediat. 2017, 37, 62–81. [Google Scholar] [CrossRef] [Green Version]
  26. Sihota, N.; Trost, J.; Bekins, B.; Berg, A.; Delin, G.; Mason, B.; Warren, E.; Mayer, K.U. Seasonal Variability in Vadose Zone Biodegradation at a Crude Oil Pipeline Rupture Site. Vadose Zone J. 2016, 1–14. [Google Scholar] [CrossRef]
  27. Amos, R.T.; Mayer, K.U.; Bekins, B.A.; Delin, G.N.; Williams, R.L. Use of dissolved and vapor-phase gases to investigate methanogenic degradation of petroleum hydrocarbon contamination in the subsurface. Water Resour. Res. 2005, 41, 1–15. [Google Scholar] [CrossRef]
  28. Bekins, B.A.; Hostettler, F.D.; Herkelrath, W.N.; Delin, G.N.; Warren, E.; Essaid, H.I. Progression of methanogenic degradation of crude oil in the subsurface. Environ. Geosci. 2005, 12, 139–152. [Google Scholar] [CrossRef]
  29. Johnson, P.; Lundegard, P.; Liu, Z. Source zone natural attenuation at petroleum hydrocarbon spill sites—I: Site-specific assessment approach. Ground Water Monit. Remediat. 2006, 26, 82–92. [Google Scholar] [CrossRef]
  30. Keith, H.; Wong, S. Measurement of soil CO2 efflux using soda lime absorption: Both quantitative and reliable. Soil Biol. Biochem. 2006, 38, 1121–1131. [Google Scholar] [CrossRef]
  31. Lundegard, P.; Johnson, P. Source Zone Natural Attenuation at Petroleum Hydrocarbon Spill Sites-II: Application to a former oil field. Ground Water Monit. Remediat. 2006, 26, 93–106. [Google Scholar] [CrossRef]
  32. Molins, S.; Mayer, K.U.; Amos, R.; Bekins, B. Vadose zone attenuation of organic compounds at a crude oil spill site—Interactions between biogeochemical reactions and multicomponent gas transport. J. Contam. Hydrol. 2010, 112, 15–29. [Google Scholar] [CrossRef]
  33. Amos, R.T.; Bekins, B.A.; Delin, G.N.; Cozzarelli, I.M.; Blowes, D.W.; Kirshtein, J.D. Methane oxidation in a crude oil contaminated aquifer: Delineation of aerobic reactions at the plume fringes. J. Contam. Hydrol. 2011, 125, 13–25. [Google Scholar] [CrossRef]
  34. Sihota, N.J.; Singurindy, O.; Mayer, K.U. CO2-Efflux Measurements for Evaluating Source Zone Natural Attenuation Rates in a Petroleum Hydrocarbon Contaminated Aquifer. Environ. Sci. Technol. 2010, 45, 482–488. [Google Scholar] [CrossRef] [PubMed]
  35. Sihota, N.J.; Mayer, K.U. Characterizing Vadose Zone Hydrocarbon Biodegradation Using Carbon Dioxide Effluxes, Isotopes, and Reactive Transport Modeling. Vadose Zone J. 2012, 1–14. [Google Scholar] [CrossRef]
  36. Gieg, L.M.; Fowler, S.J.; Berdugo-Clavijo, C. Syntrophic biodegradation of hydrocarbon contaminants. Curr. Opin. Biotechnol. 2014, 27, 21–29. [Google Scholar] [CrossRef]
  37. McCoy, K.; Zimbron, J.; Sale, T.; Lyverse, M. Measurement of Natural Losses of LNAPL Using CO2 Traps. Groundwater 2014, 53, 658–667. [Google Scholar] [CrossRef]
  38. Sihota, N.J.J. Novel Approaches for Quantifying Source Zone Natural Attenuation of Fossil and Alternatuve Fuels. Ph.D. Thesis, University of British Columbia, Vancouver, BC, Canada, 2014. [Google Scholar]
  39. Lari, K.S.; Davis, G.B.; Rayner, J.L.; Bastow, T.P.; Puzon, G.J. Natural source zone depletion of LNAPL: A critical review supporting modelling approaches. Water Res. 2019, 157, 630–646. [Google Scholar] [CrossRef]
  40. Hua, F.; Wang, H.Q. Uptake and trans-membrane transport of petroleum hydrocarbons by microorganisms. Biotechnol. Biotechnol. Equip. 2014, 28, 165–175. [Google Scholar] [CrossRef] [Green Version]
  41. Irianni-Renno, M.; Akhbari, D.; Olson, M.R.; Byrne, A.P.; Lefèvre, E.; Zimbron, J.; Lyverse, M.; Sale, T.C.; De Long, S.K. Comparison of bacterial and archaeal communities in depth-resolved zones in an LNAPL body. Appl. Microbiol. Biotechnol. 2015, 100, 3347–3360. [Google Scholar] [CrossRef] [PubMed]
  42. Amos, R.T.; Mayer, K.U. Investigating ebullition in a sand column using dissolved gas analysis and reactive transport modeling. Environ. Sci. Technol. 2006, 40, 5361–5367. [Google Scholar] [CrossRef]
  43. Meckenstock, R.U.; von Netzer, F.; Stumpp, C.; Lueders, T.; Himmelberg, A.M.; Hertkorn, N.; Schmitt-Kopplin, P.; Harir, M.; Hosein, R.; Haque, S.; et al. Water droplets in oil are microhabitats for microbial life. Science 2014, 345, 673–676. [Google Scholar] [CrossRef]
  44. Ng, G.-H.C.; Bekins, B.A.; Cozzarelli, I.M.; Baedecker, M.J.; Bennett, P.C.; Amos, R.T. A mass balance approach to investigating geochemical controls on secondary water quality impacts at a crude oil spill site near Bemidji, MN. J. Contam. Hydrol. 2014, 164, 1–15. [Google Scholar] [CrossRef] [PubMed] [Green Version]
  45. Ng, G.-H.C.; Bekins, B.A.; Cozzarelli, I.M.; Baedecker, M.J.; Bennett, P.C.; Amos, R.T.; Herkelrath, W.N. Reactive transport modeling of geochemical controls on secondary water quality impacts at a crude oil spill site near Bemidji, MN. Water Resour. Res. 2015, 51, 4156–4183. [Google Scholar] [CrossRef]
  46. Askarani, K.K.; Stockwell, E.B.; Piontek, K.R.; Sale, T.C. Thermal monitoring of natural source zone depletion. Ground Water Monit. Remediat. 2018, 38, 43–52. [Google Scholar] [CrossRef]
  47. Tracy, M.K. Method Comparison for Analysis of LNAPL Natural Sourse Zone Depletion Using CO2 Fluxes. Master’s Thesis, Colorado State University, Fort Collins, CO, USA, 2015. [Google Scholar]
  48. Jones, D.M.; Head, I.M.; Gray, N.D.; Adams, J.J.; Rowan, A.K.; Aitken, C.M.; Bennett, B.; Huang, H.; Brown, A.; Bowler, B.F.J.; et al. Crude-oil biodegradation via methanogenesis in subsurface petroleum reservoirs. Nature 2008, 451, 176–180. [Google Scholar] [CrossRef]
  49. Suarez, M.P.; Rifai, H.S. Biodegradation rates for fuel hydrocarbons and chlorinated solvents in groundwater. Bioremediation J. 1999, 3, 337–362. [Google Scholar] [CrossRef]
  50. Wiedemeier, T.H.; Rifai, H.S.; Newell, C.J.; Wilson, J.T. Natural Attenuation of Fuels and Chlorinated Solvents in the Subsurface; Wiley: Hoboken, NJ, USA, 1999. [Google Scholar]
  51. Salminen, J.M.; Tuomi, P.M.; Suortti, A.-M.; Jørgensen, K.S. Potential for aerobic and anaerobic biodegradation of petroleum hydrocarbons in boreal subsurface. Biogeochemistry 2004, 15, 29–39. [Google Scholar] [CrossRef]
  52. Atlas, R.M. Microbial degradation of petroleum hydrocarbons: An environmental perspective. Microbiol. Rev. 1981, 45, 180–209. [Google Scholar] [CrossRef]
  53. Marchal, R.; Penet, S.; Solano-Serena, F.; Vandecasteele, J.P. Gasoline and Diesel Oil Biodegradation. Oil Gas Sci. Technol.—Rev. d’IFP Energies Nouv. 2003, 58, 441–448. [Google Scholar] [CrossRef] [Green Version]
  54. Interstate Technology & Regulatory Council (ITRC). Evaluating LNAPL Remedial Technologies for Achieving Project Goals. ITRC.; Interstate Technology & Regulatory Council (ITRC): Washington, DC, USA, 2009. [Google Scholar]
  55. Interstate Technology & Regulatory Council (ITRC). Evaluating Natural Source Zone Depletion at Sites with LNAPL; Interstate Technology & Regulatory Council (ITRC): Washington, DC, USA, 2009. [Google Scholar]
  56. McCoy, K.M. Resolving Natural Losses of Lnapl Using CO2 Traps. Master’s Thesis, Colorado State University, Fort Collins, CO, USA, 2012. [Google Scholar]
  57. Schink, B. Energetics of syntrophic cooperation in methanogenic degradation. Microbiol. Mol. Biol. Rev. 1997, 61. [Google Scholar] [CrossRef]
  58. Hirakata, Y.; Hatamoto, M.; Oshiki, M.; Watari, T.; Araki, N.; Yamaguchi, T. Food selectivity of anaerobic protists and direct evidence for methane production using carbon from prey bacteria by endosymbiotic methanogen. ISME J. 2020, 14, 1873–1885. [Google Scholar] [CrossRef]
  59. Rogers, J.R.; Bennett, P.C.; Choi, W.J. Feldspars as a source of nutrients for microorganisms. Am. Miner. 1998, 83, 1532–1540. [Google Scholar] [CrossRef]
  60. McAlexander, B.; Sihota, N. Influence of Ambient Temperature, Precipitation, and Groundwater Level on Natural Source Zone Depletion Rates at a Large Semiarid LNAPL Site. Ground Water Monit. Remediat. 2018, 39, 54–65. [Google Scholar] [CrossRef] [Green Version]
  61. Mcleod, H.C. Investigating Gas Phase Processes in Natural and Hydrocarbon-Contaminated. Ph.D. Thesis, McMaster University, Hamilton, ON, Canada, 2015. [Google Scholar]
  62. Alexander, M. Biodegradation and Bioremediation; Academic Press: San Diego, CA, USA, 1999. [Google Scholar]
  63. Zysset, A.; Stauffer, F.; Dracos, T. Modeling of reactive groundwater transport governed by biodegradation. Water Resour. Res. 1994, 30, 2423–2434. [Google Scholar] [CrossRef]
  64. Zeman, N.R.; Renno, M.I.; Olson, M.R.; Wilson, L.P.; Sale, T.C.; De Long, S.K. Temperature impacts on anaerobic biotransformation of LNAPL and concurrent shifts in microbial community structure. Biogeochemistry 2014, 25, 569–585. [Google Scholar] [CrossRef]
  65. Davis, C.A.; Atekwana, E.A.; Atekwana, E.A.; Slater, L.D.; Rossbach, S.; Mormile, M.R. Microbial growth and biofilm formation in geologic media is detected with complex conductivity measurements. Geophys. Res. Lett. 2006, 33, 1–5. [Google Scholar] [CrossRef]
  66. LaRue, A.; Swider, P.; Duru, P.; Daviaud, D.; Quintard, M.; Davit, Y. Quantitative 3D comparison of biofilm imaged by X-ray micro-tomography and two-photon laser scanning microscopy. J. Microsc. 2018, 271, 302–314. [Google Scholar] [CrossRef]
  67. Ostvar, S.; Iltis, G.; Davit, Y.; Schlüter, S.; Andersson, L.; Wood, B.D.; Wildenschild, D. Investigating the influence of flow rate on biofilm growth in three dimensions using microimaging. Adv. Water Resour. 2018, 117, 1–13. [Google Scholar] [CrossRef] [Green Version]
  68. Davit, Y.; Iltis, G.; Debenest, G.; Veran-Tissoires, S.; Wildenschild, D.; Gerino, M.; Quintard, M. Imaging biofilm in porous media using X-ray computed microtomography. J. Microsc. 2011, 242, 15–25. [Google Scholar] [CrossRef]
  69. Bekins, B.A.; Godsy, E.M.; Warren, E. Distribution of microbial physiologic types in an aquifer contaminated by crude oil. Microb. Ecol. 1999, 37, 263–275. [Google Scholar] [CrossRef] [PubMed]
  70. Duris, J.W. Microbial Community Structure in Hydrocarbon Impacted Sediment Associated with Anomalous Geophysical Signatures. Master’s Thesis, Western Michigan University, Kalamazoo, MI, USA, 2002. [Google Scholar]
  71. Abdel Aal, G.Z.A.; Slater, L.D.; Atekwana, E.A. Induced-polarization measurements on unconsolidated sediments from a site of active hydrocarbon biodegradation. Geophysics 2006, 71, 13–24. [Google Scholar] [CrossRef]
  72. Abdel Aal, G.Z.; Atekwana, E.A.; Slater, L.D.; Atekwana, E.A. Effects of microbial processes on electrolytic and interfacial electrical properties of unconsolidated sediments. Geophys. Res. Lett. 2004, 31, 2–5. [Google Scholar] [CrossRef]
  73. Rittmann, B.E. The significance of biofilms in porous media. Water Resour. Res. 1993, 29, 2195–2202. [Google Scholar] [CrossRef]
  74. Vieira, M.J.; Melo, L.F.; Pinheiro, M.M. Biofilm formation: Hydrodynamic effects on internal diffusion and structure. Biofouling 1993, 7, 67–80. [Google Scholar] [CrossRef]
  75. Telgmann, U.; Horn, H.; Morgenroth, E. Influence of growth history on sloughing and erosion from biofilms. Water Res. 2004, 38, 3671–3684. [Google Scholar] [CrossRef]
  76. Adamberg, S.; Tomson, K.; Vija, H.; Puurand, M.; Kabanova, N.; Visnapuu, T.; Jõgi, E.; Alamäe, T.; Adamberg, K. Degradation of fructans and production of propionic acid by bacteroides thetaiotaomicron are enhanced by the shortage of amino acids. Front. Nutr. 2014, 1, 1–10. [Google Scholar] [CrossRef] [Green Version]
  77. Christensen, T.H.; Bjerg, P.L.; Banwart, S.A.; Jakobsen, R.; Heron, G.; Albrechtsen, H.J. Characterization of redox conditions in groundwater contaminant plumes. J. Contam. Hydrol. 2000, 45, 165–241. [Google Scholar] [CrossRef]
  78. Stockwell, E.B. Continuous NAPL Loss Rates Using Subsurface Temperatures. Master’s Thesis, Colorado State University, Fort Collins, CO, USA, 2015. [Google Scholar]
  79. Wiedemeier, T.H.; Swanson, M.A.; Moutoux, D.E.; Wilson, J.T.; Kampbell, D.H.; Hansen, J.E.; Haas, P. Technical Protocol for Natural Attenuation of Chlorinated Aliphatic Hydrocarbons in Ground Water under Development; The US Air Force Center for Environmental Excellence, Technology Transfer Division, Brooks Air Force Base: San Antonio, TX, USA, 1996. [Google Scholar]
  80. Newell, C.J.; Gonzales, J.R. BIOSCREEN: Groundwater Contamination Natural Attenuation Model (Verion 1.3) Natural Attentuation Decision Support System User’s Manual; Air Force Center for Environmental Excellence Technology Transfer Division: Brooks City-Base, TX, USA, 1996; EPA/600/R-96/087 (NTIS 97-190631). [Google Scholar]
  81. Askarani, K.K.; Sale, T.C. Thermal estimation of natural source zone depletion rates without background correction. Water Res. 2020, 169, 115245. [Google Scholar] [CrossRef]
  82. Mbadinga, S.M.; Wang, L.-Y.; Zhou, L.; Liu, J.-F.; Gu, J.-D.; Mu, B.-Z. Microbial communities involved in anaerobic degradation of alkanes. Int. Biodeterior. Biodegradation 2011, 65, 1–13. [Google Scholar] [CrossRef]
  83. Callaghan, A.V. Metabolomic investigations of anaerobic hydrocarbon-impacted environments. Curr. Opin. Biotechnol. 2013, 24, 506–515. [Google Scholar] [CrossRef] [PubMed]
  84. Foght, J. Anaerobic biodegradation of aromatic hydrocarbons: Pathways and prospects. J. Mol. Microbiol. Biotechnol. 2008, 15, 93–120. [Google Scholar] [CrossRef] [PubMed]
  85. Cozzarelli, I.M.; Bekins, B.A.; Baedecker, M.J.; Aiken, G.R.; Eganhouse, R.P.; Tuccillo, M.E. Progression of natural attenuation processes at a crude-oil spill site. J. Contam. Hydrol. 2001, 53, 369–385. [Google Scholar] [CrossRef]
  86. Kunapuli, U.; Lueders, T.; Meckenstock, R.U. The use of stable isotope probing to identify key iron-reducing microorganisms involved in anaerobic benzene degradation. ISME J. 2007, 1, 643–653. [Google Scholar] [CrossRef] [PubMed] [Green Version]
  87. Bekins, B.A.; Cozzarelli, I.M.; Godsy, E.M.; Warren, E.; Essaid, H.I.; Tuccillo, M.E. Progression of natural attenuation processes at a crude oil spill site: II. Controls on spatial distribution of microbial populations. J. Contam. Hydrol. 2001, 53, 387–406. [Google Scholar] [CrossRef]
  88. Lykidis, A.; Chen, C.-L.; Tringe, S.; McHardy, A.C.; Copeland, A.; Kyrpides, N.; Hugenholtz, P.; Macarie, H.; Olmos, A.; Monroy, O.; et al. Multiple syntrophic interactions in a terephthalate-degrading methanogenic consortium. ISME J. 2010, 5, 122–130. [Google Scholar] [CrossRef] [Green Version]
  89. Wu, J.-H.; Wu, F.-Y.; Chuang, H.-P.; Chen, W.-Y.; Huang, H.-J.; Chen, S.-H.; Liu, W.-T. Community and Proteomic Analysis of Methanogenic Consortia Degrading Terephthalate. Appl. Environ. Microbiol. 2013, 79, 105–112. [Google Scholar] [CrossRef] [PubMed] [Green Version]
  90. Abu Laban, N.; Selesi, D.; Rattei, T.; Tischler, P.; Meckenstock, R.U. Identification of enzymes involved in anaerobic benzene degradation by a strictly anaerobic iron-reducing enrichment culture. Environ. Microbiol. 2010, 12, 2783–2796. [Google Scholar] [CrossRef] [PubMed]
  91. Herrmann, S.; Kleinsteuber, S.; Chatzinotas, A.; Kuppardt, S.; Lueders, T.; Richnow, H.H.; Vogt, C. Functional characterization of an anaerobic benzene-degrading enrichment culture by DNA stable isotope probing. Environ. Microbiol. 2010, 12, 401–411. [Google Scholar] [CrossRef] [Green Version]
  92. van der Zaan, B.M.; Saia, F.T.; Stams, A.J.M.; Plugge, C.M.; de Vos, W.M.; Smidt, H.; Langenhoff, A.A.M.; Gerritse, J. Anaerobic benzene degradation under denitrifying conditions: Peptococcaceae as dominant benzene degraders and evidence for a syntrophic process. Environ. Microbiol. 2012, 14, 1171–1181. [Google Scholar] [CrossRef]
  93. Gray, N.D.; Sherry, A.; Grant, R.J.; Rowan, A.K.; Hubert, C.R.J.; Callbeck, C.M.; Aitken, C.M.; Jones, D.M.; Adams, J.J.; Larter, S.R.; et al. The quantitative significance of syntrophaceae and syntrophic partnerships in methanogenic degradation of crude oil alkanes. Environ. Microbiol. 2011, 13, 2957–2975. [Google Scholar] [CrossRef] [Green Version]
  94. Gray, N.D.; Sherry, A.; Hubert, C.; Dolfing, J.; Head, I.M. Methanogenic degradation of petroleum hydrocarbons in subsurface environments: Remediation, heavy oil formation, and energy recovery, 1st ed. Adv. Appl. Microbiol. 2010, 72, 137–161. [Google Scholar] [CrossRef]
  95. Allen, J.P.; Atekwana, E.A.; Atekwana, E.A.; Duris, J.W.; Werkema, D.D.; Rossbach, S. The microbial community structure in petroleum-contaminated sediments corresponds to geophysical signatures. Appl. Environ. Microbiol. 2007, 73, 2860–2870. [Google Scholar] [CrossRef] [Green Version]
  96. Callaghan, A.V.; Morris, B.E.L.; Pereira, I.A.C.; McInerney, M.J.; Austin, R.N.; Groves, J.T.; Kukor, J.J.; Suflita, J.M.; Young, L.Y.; Zylstra, G.J.; et al. The genome sequence of desulfatibacillum alkenivorans AK-01: A blueprint for anaerobic alkane oxidation. Environ. Microbiol. 2012, 14, 101–113. [Google Scholar] [CrossRef] [PubMed]
  97. Mayumi, D.; Mochimaru, H.; Yoshioka, H.; Sakata, S.; Maeda, H.; Miyagawa, Y.; Ikarashi, M.; Takeuchi, M.; Kamagata, Y. Evidence for syntrophic acetate oxidation coupled to hydrogenotrophic methanogenesis in the high-temperature petroleum reservoir of Yabase oil field (Japan). Environ. Microbiol. 2010, 13, 1995–2006. [Google Scholar] [CrossRef]
  98. Morris, B.E.L.; Herbst, F.-A.; Bastida, F.; Seifert, J.; Von Bergen, M.; Richnow, H.; Suflita, J.M. Microbial interactions during residual oil and n-fatty acid metabolism by a methanogenic consortium. Environ. Microbiol. Rep. 2012, 4, 297–306. [Google Scholar] [CrossRef]
  99. Mayumi, D.; Dolfing, J.; Sakata, S.; Maeda, H.; Miyagawa, Y.; Ikarashi, M.; Tamaki, H.; Takeuchi, M.; Nakatsu, C.H.; Kamagata, Y. Carbon dioxide concentration dictates alternative methanogenic pathways in oil reservoirs. Nat. Commun. 2013, 4, 1998. [Google Scholar] [CrossRef] [PubMed]
  100. Hegarty, R.S.; Gerdes, R. Hydrogen production and transfer in the rumen. Recent Adv. Anim. Nutr. Aust. 1999, 12, 37–44. [Google Scholar]
  101. Galagan, J.E.; Nusbaum, C.; Roy, A.; Endrizzi, M.G.; Macdonald, P.; Fitzhugh, W.; Calvo, S.; Engels, R.; Smirnov, S.; Atnoor, D.; et al. The genome of M. acetivorans reveals extensive metabolic and physiological diversity. Genome Res. 2002, 12, 532–542. [Google Scholar] [CrossRef] [PubMed] [Green Version]
  102. Thomas, S.; Haider, N.S. A Study on Basics of a Gas Analyzer. Int. J. Adv. Res. Electr. Electron. Instrum. Eng. 2013, 2, 6016–6025. [Google Scholar]
  103. Freijer, J.I.; Bouten, W. A comparison of field methods for measuring soil carbon dioxide evolution: Experiments and simulation. Plant Soil 1991, 135, 133–142. [Google Scholar] [CrossRef]
  104. Grogan, P. CO2 flux measurement using soda lime: Correction for water formed during CO2 adsorption. Ecology 1998, 79, 1467–1468. [Google Scholar] [CrossRef]
  105. Edwards, N.T. The use of soda-lime for measuring respiration rates in terrestrial systems. Pedobiologia 1982, 23, 321–330. [Google Scholar]
  106. Monteith, J.L.; Szeicz, G.; Yabuki, K. Crop Photosynthesis and the Flux of Carbon Dioxide below the Canopy. J. Appl. Ecol. 1964, 1, 321. [Google Scholar] [CrossRef]
  107. Pongracic, S.; Kirschbaum, M.; Raison, R.J. Comparison of soda lime and infrared gas analysis techniques for in situ measurement of forest soil respiration. Can. J. For. Res. 1997, 27, 1890–1895. [Google Scholar] [CrossRef]
  108. Zimbron, J.; Sales, T.C.; Lyverse, M. Gas Flux Measurement Using Traps. U.S. Patent 8,714,034 B2, 6 May 2014. [Google Scholar]
  109. E-Flux, nd. Cutting-Edge Monitoring Products for NSZD Assessment and Rate Quantification [WWW Document]. URL. Available online: https://www.soilgasflux.com/ (accessed on 7 January 2021).
  110. Rochette, P.; Gregorich, E.G.; Desjardins, R.L. Comparison of static and dynamic closed chambers for measurement of soil respiration under field conditions. Can. J. Soil Sci. 1992, 72, 605–609. [Google Scholar] [CrossRef]
  111. Rochette, P.; Ellert, B.; Gregorich, E.G.; Desjardins, R.L.; Pattey, E.; Lessard, R.; Johnson, B.G. Description of a dynamic closed chamber for measuring soil respiration and its comparison with other techniques. Can. J. Soil Sci. 1997, 77, 195–203. [Google Scholar] [CrossRef]
  112. Haney, R.L.; Brinton, W.F.; Evans, E. Soil CO2 respiration: Comparison of chemical titration, CO2 IRGA analysis and the Solvita gel system. Renew. Agric. food Syst. 2008, 32, 171–176. [Google Scholar] [CrossRef] [Green Version]
  113. McHugh, T.; Newell, C.; Strasert, B.; Stanley, C.; Johnson, J.; Henderson, T.; Roff, D.; Narusawa, J. Direct aerobic NSZD of a basalt vadose zone LNAPL source in Hawaii. J. Contam. Hydrol. 2020, 235, 103729. [Google Scholar] [CrossRef]
  114. Eichert, J.; McAlexander, B.; Lyverse, M.; Michalski, P.; Sihota, N. Spatial and Temporal Variation in Natural Source Zone Depletion Rates at a Former Oil Refinery. Vadose Zone J. 2017, 16, 1–16. [Google Scholar] [CrossRef]
  115. Mines, R.O.; Lackey, L.W. Introduction to Environmental Engineering Calculations: Dimensions, Units, and Conversions, in: Introduction to Environmental Engineering; Pearson Education Inc.: Upper Saddle River, NJ, USA, 2009; pp. 15–31. [Google Scholar]
  116. Dietrich, P.; Leven, C. Direct Push-Technologies; Kirsch, R., Ed.; Groundwater Geophysics; Springer: Berlin, Germany, 2006. [Google Scholar]
  117. Teramoto, E.H.; Isler, E.; Polese, L.; Baessa, M.P.M.; Chang, H.K. LNAPL saturation derived from laser induced fluorescence method. Sci. Total Environ. 2019, 683, 762–772. [Google Scholar] [CrossRef]
  118. García-Rincón, J.; Gatsios, E.; Rayner, J.L.; McLaughlan, R.G.; Davis, G.B. Laser-induced fluorescence logging as a high-resolution characterisation tool to assess LNAPL mobility. Sci. Total Environ. 2020, 725, 138480. [Google Scholar] [CrossRef] [PubMed]
  119. Kram, M.; Keller, A.A.; Everett, L. Comments in response to “DyeLIF™: A new direct-push laser-induced fluorescence sensor system for chlorinated solvent DNAPL and other non-naturally fluorescing NAPLs”. Ground Water Monit. Remediat. 2019, 39, 73–74. [Google Scholar] [CrossRef] [Green Version]
  120. Horst, J.; Welty, N.; Stuetzle, R.; Wenzel, R.; St Germain, R. Fluorescent dyes: A new weapon for conquering DNAPL characterization. Ground Water Monit. Remediat. 2018, 38, 19–25. [Google Scholar] [CrossRef]
  121. Bujewski, G.; Rutherford, B. The Rapid Optical Screening Tool (ROST TM) Laser-Induced Fluorecence (LIF) System for Screeing of Petroleum Hydrocarbons in Subsurface Soils—Innovative Technology Verification Report—EPA/600/R-97/020; United States Environmental Protection Agency: Washington, DC, USA, 1997. [Google Scholar]
  122. Kram, M.L.; Lieberman, S.H.; Fee, J.; Keller, A.A. Use of LIF for real-time in-situ mixed NAPL source zone detection. Ground Water Monit. Remediat. 2001, 21, 67–76. [Google Scholar] [CrossRef]
  123. Halihan, T.; Paxton, S.; Graham, I.; Fenstemaker, T.; Riley, M. Post-remediation evaluation of a LNAPL site using electrical resistivity imaging. J. Environ. Monit. 2005, 7, 283–287. [Google Scholar] [CrossRef] [PubMed]
  124. Nielsen, D.M. (Ed.) Practical Handbook of Environmental Site Characterization and Ground—Water Monitoring, 2nd ed.; CRC Press: Boca Raton, FL, USA, 2005. [Google Scholar]
  125. Bockelmann, A.; Zamfirescu, D.; Ptak, T.; Grathwohl, P.; Teutsch, G. Quantification of mass fluxes and natural attenuation rates at an industrial site with a limited monitoring network: A case study. J. Contam. Hydrol. 2003, 60, 97–121. [Google Scholar] [CrossRef]
  126. Kram, M.L.; Keller, A.A.; Rossabi, J.; Everett, L.G. DNAPL Characterization methods and approaches, part 2: Cost comparisons. Ground Water Monit. Remediat. 2002, 22, 46–61. [Google Scholar] [CrossRef] [Green Version]
  127. Einarson, M.; Fure, A.; St Germain, R.; Chapman, S.; Parker, B. DyeLIFTM: A new direct-push laser-induced fluorescence sensor system for chlorinated solvent DNAPL and other non-naturally fluorescing NAPLs. Ground Water Monit. Remediat. 2018, 38, 28–42. [Google Scholar] [CrossRef]
  128. Bauer, H.P.; Beckett, P.H.T.; Bie, S.W. A rapid gravimetric method for estimating calcium carbonate in soils. Plant Soil 1972, 37, 689–690. [Google Scholar] [CrossRef]
  129. Bouten, W.; de Vre, F.M.; Verstraten, J.M.; Duysings, J.J.H.M. Carbon dioxide in the soil atmosphere: Simulation model parameter estimation from field measurements. In Hydrochemical Balances of Freshwater Systems; E. Eriksson, P.P., Ed.; IAHS Press: Wallingford, Oxfordshire, UK, 1984; pp. 23–30. [Google Scholar]
  130. Witkamp, M.; van der Drift, J. Breakdown of forest litter in relation to environmental factors. Plant Soil 1961, 15, 295–311. [Google Scholar] [CrossRef] [Green Version]
  131. Witkamp, M. Rates of Carbon Dioxide Evolution from the Forest Floor. Ecology 1966, 47, 492–494. [Google Scholar] [CrossRef]
  132. Edwards, N.T.; Ross-Todd, B.M. Soil carbon dynamics in a mixed deciduous forest following clear-cutting with and without residue removal. Soil Sci. Soc. Am. J. 1983, 47, 1014–1021. [Google Scholar] [CrossRef]
  133. Suchomel, K.H.; Kreamer, D.K.; Long, A. Production and transport of carbon dioxide in a contaminated vadose zone: A stable and radioactive carbon isotope study. Environ. Sci. Technol. 1990, 24, 1824–1831. [Google Scholar] [CrossRef]
  134. Coffin, R.B.; Pohlman, J.W.; Grabowski, K.S.; Knies, D.L.; Plummer, R.E.; Magee, R.W.; Boyd, T.J. Radiocarbon and stable carbon isotope analysis to confirm petroleum natural attenuation in the vadose zone. Environ. Forensics 2008, 9, 75–84. [Google Scholar] [CrossRef]
  135. Conrad, M.E.; Daley, P.F.; Fischer, M.L.; Buchanan, B.B.; Leighton, T.; Kashgarian, M. Combined 14C and δ13C monitoring of in situ biodegradation of petroleum hydrocarbons. Environ. Sci. Technol. 1997, 31, 1463–1469. [Google Scholar] [CrossRef]
  136. Stahl, W. Compositional changes and fractionations during the degradation of hydrocarbons by bacteria. Geochim. Cosmochim. Acta 1980, 44, 1903–1907. [Google Scholar] [CrossRef]
  137. Levin, I.; Graul, R.; Trivett, N.B.A. Long-term observations of atmospheric CO2 and carbon isotopes at continental sites in Germany. Tellus B: Chem. Phys. Meteorol. 1995, 47, 23–34. [Google Scholar] [CrossRef] [Green Version]
  138. Klouda, G.A.; Connolly, M.V. Radiocarbon (14C) measurements to quantify sources of atmospheric carbon monoxide in urban air. Atmospheric Environ. 1995, 29, 3309–3318. [Google Scholar] [CrossRef]
  139. Avery, G.B.; Willey, J.D.; Kieber, R.J. Carbon isotopic characterization of dissolved organic carbon in rainwater: Terrestrial and marine influences. Atmos. Environ. 2006, 40, 7539–7545. [Google Scholar] [CrossRef]
  140. Conrad, M.E.; Templeton, A.S.; Daley, P.F.; Alvarez-Cohen, L. Isotopic evidence for biological controls on migration of petroleum hydrocarbons. Org. Geochem. 1999, 30, 843–859. [Google Scholar] [CrossRef]
  141. Conrad, R. Quantification of methanogenic pathways using stable carbon isotopic signatures: A review and a proposal. Org. Geochem. 2005, 36, 739–752. [Google Scholar] [CrossRef]
  142. Gelwicks, J.T.; Risatti, J.B.; Hayes, J.M. Carbon isotope effects associated with autotrophic acetogenesis. Org. Geochem. 1989, 14, 441–446. [Google Scholar] [CrossRef]
  143. Reynolds, L. Soil 14CO2 Source Apportionment for Biodegradation in Contaminated Soils in Permafrost Climates: A Novel Technique for Rapid Sample Collection by Barium Carbonate Precipitation. Master’s Thesis, University of Ottawa, Ottawa, ON, Canada, 2019. [Google Scholar]
  144. Piontek, K.; Sale, T.; Askarani, K.K.; Emerson, E.D. Insights from continuous monitoring of LNAPL natural source zone depletion rates. In Proceedings of the Bioremediation and Sustainable Environmental Technologies—The Fourth International Symposium on Bioremediation and Sustainable Environmental Technologies, Miami, FL, USA, 22–25 May 2017. [Google Scholar]
  145. Sale, T.C.; Stockwell, E.B.; Newell, C.J.; Kulkarni, P.R. Device and Methods for Measuring Thermal Flux and Estimated Rate of Change of Reactive Material within a Subsurface Formation. U.S. Patent No. 2015/0233773A1, 20 August 2015. [Google Scholar]
  146. Sweeney, R.E.; Ririe, G.T. Temperature as a Tool to Evaluate Aerobic Biodegradation in Hydrocarbon Contaminated Soil. Ground Water Monit. Remediat. 2014, 34, 41–50. [Google Scholar] [CrossRef]
  147. Atekwana, E.A.; Atekwana, E.; Legall, F.D.; Krishnamurthy, R.V. Biodegradation and mineral weathering controls on bulk electrical conductivity in a shallow hydrocarbon contaminated aquifer. J. Contam. Hydrol. 2005, 80, 149–167. [Google Scholar] [CrossRef] [PubMed]
  148. Che-Alota, V.; Atekwana, E.A.; Atekwana, E.A.; Sauck, W.A.; Werkema, D.D. Temporal geophysical signatures from contaminant-mass remediation. Geophysics 2009, 74, B113–B123. [Google Scholar] [CrossRef]
  149. Mokhatab, S.; Poe, W.A.; Mak, J.Y. Chapter 20—Gas processing plant automation. In Handbook of Natural Gas Transmission and Processing: Principles and Practices; Elsevier Science: Amsterdam, The Netherlands, 2018; pp. 615–642. [Google Scholar]
  150. Hendee, M.K. Comparison of Thermistor Sensors to Bandgap-Based Digital Sensors for Ground Temperature Measurements. 1996. Available online: https://www.bing.com/ck/a?!&&p=a517bdd259eef0fa5ce1f3011abb3b3818d863f2e8a6127230929720e69f94acJmltdHM9MTY1Mzg3NDM2MCZpZ3VpZD0wZDVhYTI5Zi1jN2I0LTQ3ODYtOTY2OC1kZjY1YmRkOGMzZDEmaW5zaWQ9NTE1Nw&ptn=3&fclid=6518c691-dfb8-11ec-8c7f-b99f26bee8af&u=a1aHR0cHM6Ly93d3cubXlnZW93b3JsZC5jb20vZmlsZS8xMDc0OTkvbXVsdGktcG9pbnQtdGhlcm1pc3Rvci10by1iYW5kLWdhcC1kaWdpdGFsLXNlbnNvci1jb21wYXJpc29uLWluLWFyY3RpYy1nZW90ZWNoLWFwcGxpY2F0aW9uL2Rvd25sb2Fk&ntb=1 (accessed on 7 January 2021).
  151. Zumbahlen, H. Chapter 3: Sensors. In Linear Circuits Design Handbook; Elsevier: Amsterdam, The Netherlands, 2018; pp. 193–243. [Google Scholar] [CrossRef]
  152. Stein, V.B. Methane Oxidation in Soils as a Tool for Reducing Greenhouse Gas Emissions. Master’s Thesis, University of Calgary, Calgary, AB, Canada, 2000. [Google Scholar] [CrossRef]
  153. Hoehler, T.M.; Alperin, M.J.; Albert, D.B.; Martens, C.S. Field and laboratory studies of methane oxidation in an anoxic marine sediment: Evidence for a methanogen-sulfate reducer consortium. Global Biogeochem. Cycles 1994, 8, 451–463. [Google Scholar] [CrossRef]
  154. Milucka, J.; Ferdelman, T.; Polerecky, L.; Franzke, D.; Wegener, G.; Schmid, M.; Lieberwirth, I.; Wagner, M.; Widdel, F.; Kuypers, M.M.M. Zero-valent sulphur is a key intermediate in marine methane oxidation. Nature 2012, 491, 541–546. [Google Scholar] [CrossRef]
  155. Segarra, K.E.; Comerford, C.; Slaughter, J.; Joye, S.B. Impact of electron acceptor availability on the anaerobic oxidation of methane in coastal freshwater and brackish wetland sediments. Geochim. Cosmochim. Acta 2013, 115, 15–30. [Google Scholar] [CrossRef]
  156. Kulkarni, P.R.; King, D.C.; McHugh, T.E.; Adamson, D.T.; Newell, C.J. Impact of Temperature on Groundwater Source Attenuation Rates at Hydrocarbon Sites. Ground Water Monit. Remediat. 2017, 37, 82–93. [Google Scholar] [CrossRef]
  157. Chang, W. The Influence of Cold Climate Seasonal Temperature Regimes on Bioremediation of Petroleum Hydrocarbon-Contaminated Soils. Ph.D. Thesis, McGill University, Montréal, QC, Canada, 2010. [Google Scholar] [CrossRef] [Green Version]
  158. Sinclair, J.L.; Kampbell, D.H.; Cook, M.L.; Wilson, J.T. Protozoa in Subsurface Sediments from Sites Contaminated with Aviation Gasoline or Jet Fuel. Appl. Environ. Microbiol. 1993, 59, 467–472. [Google Scholar] [CrossRef] [Green Version]
  159. Zarda, B.; Mattison, G.; Hess, A.; Hahn, D.; Höhener, P.; Zeyer, J. Analysis of bacterial and protozoan communities in an aquifer contaminated with monoaromatic hydrocarbons. FEMS Microbiol. Ecol. 1998, 27, 141–152. [Google Scholar] [CrossRef]
  160. Deleo, P.C.; Baveye, P. Factors affecting protozoan predation of bacteria clogging laboratory aquifer microcosms. Geomicrobiol. J. 1997, 14, 127–149. [Google Scholar] [CrossRef]
  161. Darsa, K.V.; Thatheyus, A.J.; Ramya, D. Biodegradation of petroleum compound using the bacterium bacillus subtilis. Sci. Int. 2014, 2, 20–25. [Google Scholar] [CrossRef] [Green Version]
  162. van Bruggen, J.; Stumm, C.; Zwart, K.; Vogels, G. Endosymbiotic methanogenic bacteria of the sapropelic amoeba Mastigella. FEMS Microbiol. Lett. 1985, 31, 187–192. [Google Scholar] [CrossRef]
  163. van Bruggen, J.J.A.; Stumm, C.K.; Vogels, G.D. Symbiosis of methanogenic bacteria and sapropelic protozoa. Arch. Microbiol. 1983, 136, 89–95. [Google Scholar] [CrossRef]
  164. Cross, K.M.; Biggar, K.W.; Semple, K.; Foght, J.; Guigard, S.E.; Armstrong, J.E. Intrinsic bioremediation of diesel-contaminated cold groundwater in bedrock. J. Environ. Eng. Sci. 2006, 5, 13–27. [Google Scholar] [CrossRef]
  165. Swindoll, C.M.; Aelion, C.M.; Pfaender, F.K. Influence of inorganic and organic nutrients on aerobic biodegradation and on the adaptation response of subsurface microbial communities. Appl. Environ. Microbiol. 1988, 54, 212–217. [Google Scholar] [CrossRef] [Green Version]
  166. Ward, D.M.; Brock, T.D. Environmental factors influencing the rate of hydrocarbon oxidation in temperate lakes. Appl. Environ. Microbiol. 1976, 31, 764–772. [Google Scholar] [CrossRef] [Green Version]
  167. Juang, R.-S.; Tsai, S.-Y. Growth kinetics of Pseudomonas putida in the biodegradation of single and mixed phenol and sodium salicylate. Biochem. Eng. J. 2006, 31, 133–140. [Google Scholar] [CrossRef]
  168. Pishgar, R.; Najafpour, G.D.; Mousavi, N.; Bakhshi, Z.; Khorrami, M. Phenol biodegradation kinetics in the presence of supplementary substrate. Int. J. Eng.—Trans. B Appl. 2012, 25, 181–191. [Google Scholar] [CrossRef]
  169. Yoon, H.; Klinzing, G.; Blanch, H.W. Competition for mixed substrates by microbial populations. Biotechnol. Bioeng. 1977, 19, 1193–1210. [Google Scholar] [CrossRef] [PubMed]
  170. Yemendzhiev, H.; Gerginova, M. Phenol and cresol mixture degradation by Aspergillus awamori strain: Biochemical and kinetic substrate interactions. Proceeding ECOpole 2008, 2, 154–159. [Google Scholar]
  171. Saravanan, P.; Pakshirajan, K.; Saha, P. Biodegradation of phenol and m-cresol in a batch and fed batch operated internal loop airlift bioreactor by indigenous mixed microbial culture predominantly Pseudomonas sp. Bioresour. Technol. 2008, 99, 8553–8558. [Google Scholar] [CrossRef] [PubMed]
  172. Siddique, T.; Penner, T.; Klassen, J.; Nesbø, C.; Foght, J.M. Microbial Communities Involved in Methane Production from Hydrocarbons in Oil Sands Tailings. Environ. Sci. Technol. 2012, 46, 9802–9810. [Google Scholar] [CrossRef]
  173. Ma, J.; Rixey, W.G.; Alvarez, P.J. Increased fermentation activity and persistent methanogenesis in a model aquifer system following source removal of an ethanol blend release. Water Res. 2015, 68, 479–486. [Google Scholar] [CrossRef] [PubMed]
  174. Stasik, S.; Wick, L.Y.; Wendt-Potthoff, K. Anaerobic BTEX degradation in oil sands tailings ponds: Impact of labile organic carbon and sulfate-reducing bacteria. Chemosphere 2015, 138, 133–139. [Google Scholar] [CrossRef]
  175. Sherry, A.; Grant, R.J.; Aitken, C.M.; Jones, D.M.; Head, I.M.; Gray, N.D. Volatile hydrocarbons inhibit methanogenic crude oil degradation. Front. Microbiol. 2014, 5, 131. [Google Scholar] [CrossRef] [Green Version]
  176. Bekins, B.A.; Cozzarelli, I.M.; Erickson, M.L.; Steenson, R.A.; Thorn, K.A. Crude oil metabolites in groundwater at two spill sites. Groundwater 2016, 54, 681–691. [Google Scholar] [CrossRef]
  177. Warren, E.; Bekins, B.A.; Godsy, E.M. Inhibition of acetoclastic methanogenesis by crude oil from Bemidji, Minnesota. Bioremediat. J. 2004, 8, 1–11. [Google Scholar] [CrossRef]
  178. Atlas, R.M.; Bartha, R. Inhibition by fatty acids of the biodegradation of petroleum. Antonie Leeuwenhoek 1973, 39, 257–271. [Google Scholar] [CrossRef]
  179. Wilson, J.T.; Adair, C.; White, H.; Howard, R.L. Effect of biofuels on biodegradation of benzene and toluene at gasoline spill sites. Ground Water Monit. Remediat. 2016, 36, 50–61. [Google Scholar] [CrossRef]
  180. Suthersan, S.; Koons, B.; Schnobrich, M. Contemporary Management of Sites with Petroleum LNAPL Presence. Ground Water Monit. Remediat. 2015, 35, 23–29. [Google Scholar] [CrossRef]
  181. DeLaune, R.D.; Hambrick, G.A.I.; Patrick, W.H. Degradation of hydrocarbons in oxidized and reduced sediments. Mar. Pollut. Bull. 1980, 11, 103–106. [Google Scholar] [CrossRef]
  182. Hambrick, G.A.I.; Delaune, R.D.; Patrick, W.H.J. Effect of sediment pH and oxidation-reduction potential on PCB mineralization. Water Air Soil Pollut. 1988, 40, 365–369. [Google Scholar] [CrossRef]
  183. Zobell, C.E.; Prokop, J.F. Microbial oxidation of mineral oils in Barataria Bay bottom deposits. Z. Allg. Mikrobiol. 1966, 6, 143–162. [Google Scholar] [CrossRef]
  184. Pierce, R.H.; Cundell, A.M.; Traxler, R.W. Persistence and Biodegradation of Spilled Residual Fuel on an Estuarine Beach. Appl. Microbiol. 1975, 29, 646–652. [Google Scholar] [CrossRef]
  185. Bailey, N.J.L.; Jobson, A.M.; Rogers, M.A. Bacterial degradation of crude oil: Comparison of field and experimental data. Chem. Geol. 1973, 11, 203–221. [Google Scholar] [CrossRef]
  186. Ward, D.M.; Atlas, R.M.; Boehm, P.D.; Calder, J.A. Microbial biodegradation and chemical evolution of oil from the Amoco Spill. Ambio 1980, 9, 277–283. [Google Scholar]
  187. Ward, D.M.; Brock, T.D. Anaerobic metabolism of hexadecane in sediments. Geomicrobiol. J. 1978, 1, 1–9. [Google Scholar] [CrossRef]
  188. Rittmann, B.E.; McCarty, P.L. Environmental Biotechnology: Principles and Applications; McGraw-Hill Higher Education: New York, NY, USA, 2001. [Google Scholar]
  189. Metcalf & Eddy. Wastewater Engineering: Treatment and Recourse Recovery; Metcalf & Eddy, Inc.: New York, NY, USA, 2014. [Google Scholar]
  190. Oh, S.T.; Martin, A.D. Thermodynamic equilibrium model in anaerobic digestion process. Biochem. Eng. J. 2007, 34, 256–266. [Google Scholar] [CrossRef]
  191. Kreamer, D.K.; Weeks, E.P.; Thompson, G.M. A field technique to measure the tortuosity and sorption-affected porosity for gaseous diffusion of materials in the unsaturated zone with experimental results from near Barnwell, South Carolina. Water Resour. Res. 1988, 24, 331–341. [Google Scholar] [CrossRef]
  192. Johnson, P.C.; Bruce, C.; Johnson, R.L.; Kemblowski, M.W. In situ measurement of effective vapor-phase porous media diffusion coefficients. Environ. Sci. Technol. 1998, 32, 3405–3409. [Google Scholar] [CrossRef]
  193. Millington, R.J. Gas diffusion in porous media. Science 1959, 130, 100–102. [Google Scholar] [CrossRef] [PubMed]
  194. Millington, R.J.; Quirk, J.P. Permeability of porous solids. Trans. Faraday Soc. 1961, 57, 1200–1207. [Google Scholar] [CrossRef]
  195. Blasch, B.K.W.; Constantz, J.; Stonestrom, D.A. Thermal Methods for Investigating Ground-water Recharge. USGS Prof. Pap. 2007, 1703, 353–375. [Google Scholar]
  196. Rosenberry, D.O.H.; Glaser, P.; Siegel, D.I. Advanced Bash-Scripting Guide An in-depth exploration of the art of shell scripting Table of Contents. Hydrol. Process. 2006, 20, 3601–3610. [Google Scholar] [CrossRef]
  197. Ramirez, J.A.; Baird, A.J.; Coulthard, T.J.; Waddington, J.M. Ebullition of methane from peatlands: Does peat act as a signal shredder? Geophys. Res. Lett. 2015, 42, 3371–3379. [Google Scholar] [CrossRef] [Green Version]
  198. Ramirez, J.A.; Baird, A.J.; Coulthard, T.J.; Waddington, J.M. Testing a simple model of gas bubble dynamics in porous media. Water Resour. Res. 2015, 5, 1036–1049. [Google Scholar] [CrossRef]
  199. Ramirez, J.A. A Novel Reduced-Complexity Approach for Modelling Ebullition in Peatlands. Ph.D. Thesis, University of Leeds, Leeds, UK, 2013. [Google Scholar]
  200. Barber, C.; Davis, G.B.; Briegel, D.; Ward, J.K. Factors controlling the concentration of methane and other volatiles in groundwater and soil-gas around a waste site. J. Contam. Hydrol. 1990, 5, 155–169. [Google Scholar] [CrossRef]
  201. McLeod, H.C.; Roy, J.W.; Smith, J.E. Anaerobic biodegradation of dissolved ethanol in a pilot-scale sand aquifer: Gas phase dynamics. J. Contam. Hydrol. 2018, 215, 62–72. [Google Scholar] [CrossRef] [PubMed]
  202. Forde, O.N.; Cahill, A.G.; Beckie, R.D.; Mayer, K.U. Barometric-pumping controls fugitive gas emissions from a vadose zone natural gas release. Sci. Rep. 2019, 9, 1–9. [Google Scholar] [CrossRef]
  203. Takle, E.S.; Massman, W.J.; Brandle, J.R.; Schmidt, R.; Zhou, X.; Litvina, I.V.; Garcia, R.; Doyle, G.; Rice, C.W. Influence of high-frequency ambient pressure pumping on carbon dioxide efflux from soil. Agric. For. Meteorol. 2004, 124, 193–206. [Google Scholar] [CrossRef]
  204. Xu, L.; Lin, X.; Amen, J.; Welding, K.; McDermitt, D. Impact of changes in barometric pressure on landfill methane emission. Glob. Biogeochem. Cycles 2014, 28, 679–695. [Google Scholar] [CrossRef] [Green Version]
  205. Poulsen, T.G.; Møldrup, P. Evaluating effects of wind-induced pressure fluctuations on soil-atmosphere gas exchange at a landfill using stochastic modelling. Waste Manag. Res. J. A Sustain. Circ. Econ. 2006, 24, 473–481. [Google Scholar] [CrossRef]
  206. Hanson, J.L.; Yeşiller, N.; Oettle, N.K. Spatial and temporal temperature distributions in municipal solid waste landfills. J. Environ. Eng. 2010, 136, 804–814. [Google Scholar] [CrossRef] [Green Version]
  207. Yeşiller, N.; Hanson, J.L.; Liu, W.-L. Heat Generation in Municipal Solid Waste Landfills. J. Geotech. Geoenvironmental Eng. 2005, 131, 1330–1344. [Google Scholar] [CrossRef] [Green Version]
  208. Hanson, J.L.; Liu, W.-L.; Yesiller, N. Analytical and Numerical Methodology for Modeling Temperatures in Landfills; American Society of Civil Engineers: Reston, VA, USA, 2008; pp. 24–31. [Google Scholar] [CrossRef] [Green Version]
  209. del Grosso, S.J.; Parton, W.J.; Mosier, A.R.; Ojima, D.S.; Potter, C.S.; Brumme, R.; Dobbie, P.M.C.K.; Smith, K.A. General CH4 oxidation model and comparisons of CH4 oxidation in natural and managed systems. Global Biogeochem. Cycles 2000, 14, 999–1019. [Google Scholar] [CrossRef]
  210. Le Mer, J.; Roger, P. Production, oxidation, emission and consumption of methane by soils: A review. Eur. J. Soil Biol. 2001, 37, 25–50. [Google Scholar] [CrossRef]
  211. Czepiel, P.M.; Mosher, B.; Crill, P.M.; Harriss, R.C. Quantifying the effect of oxidation on landfill methane emissions. J. Geophys. Res. Atmos. 1996, 101, 16721–16729. [Google Scholar] [CrossRef]
  212. Whalen, S.C.; Reeburgh, W.S. International variations in tundra methane emission: A 4-year time series at fixed sites. Global Biogeochem. Cycles 1992, 6, 139–159. [Google Scholar] [CrossRef] [Green Version]
  213. Spokas, K.; Bogner, J.; Chanton, J.; Morcet, M.; Aran, C.; Graff, C.; Golvan, Y.M.-L.; Hebe, I. Methane mass balance at three landfill sites: What is the efficiency of capture by gas collection systems? Waste Manag. 2006, 26, 516–525. [Google Scholar] [CrossRef]
  214. Das, S.; Adhya, T.K. Dynamics of methanogenesis and methanotrophy in tropical paddy soils as influenced by elevated CO2 and temperature interaction. Soil Biol. Biochem. 2012, 47, 36–45. [Google Scholar] [CrossRef]
  215. Castro, M.S.; Steudler, P.A.; Melillo, J.M.; Aber, J.D.; Bowden, R.D. Factors controlling atmospheric methane consumption by temperate forest soils. Global Biogeochem. Cycles 1995, 9, 1–10. [Google Scholar] [CrossRef]
  216. Conant, R.T.; Ryan, M.G.; Ågren, G.I.; Birge, H.E.; Davidson, E.A.; Eliasson, P.E.; Evans, S.E.; Frey, S.D.; Giardina, C.P.; Hopkins, F.M.; et al. Temperature and soil organic matter decomposition rates-synthesis of current knowledge and a way forward. Glob. Chang. Biol. 2011, 17, 3392–3404. [Google Scholar] [CrossRef]
  217. Hawley, D.M.; Altizer, S.M. Disease ecology meets ecological immunology: Understanding the links between organismal immunity and infection dynamics in natural populations. Funct. Ecol. 2011, 25, 48–60. [Google Scholar] [CrossRef]
  218. Segarra, K.E.A.; Samarkin, V.; King, E.; Meile, C.; Joye, S.B. Seasonal variations of methane fluxes from an unvegetated tidal freshwater mudflat (Hammersmith Creek, GA). Biogeochemistry 2013, 115, 349–361. [Google Scholar] [CrossRef]
  219. Suseela, V.; Conant, R.T.; Wallenstein, M.D.; Dukes, J.S. Effects of soil moisture on the temperature sensitivity of heterotrophic respiration vary seasonally in an old-field climate change experiment. Glob. Chang. Biol. 2011, 18, 336–348. [Google Scholar] [CrossRef]
  220. Baldrian, P.; Šnajdr, J.; Merhautová, V.; Dobiášová, P.; Cajthaml, T.; Valášková, V. Responses of the extracellular enzyme activities in hardwood forest to soil temperature and seasonality and the potential effects of climate change. Soil Biol. Biochem. 2013, 56, 60–68. [Google Scholar] [CrossRef]
  221. Baedecker, M.J.; Eganhouse, R.P.; Qi, H.; Cozzarelli, I.M.; Trost, J.J.; Bekins, B.A. Weathering of Oil in a Surficial Aquifer. Groundwater 2017, 56, 797–809. [Google Scholar] [CrossRef]
  222. Mahler, N.; Sale, T.; Lyverse, M. A Mass Balance Approach to Resolving LNAPL Stability. Ground Water 2012, 50, 861–871. [Google Scholar] [CrossRef] [PubMed]
  223. Fetter, C.W. Chapter 2: Mass Transport in Saturated Media; McConnin, R.A., Ed.; Contaminant Hydrology; Macmillan Inc.: New York, NY, USA; Toronto, ON, Canada; Oxford, UK; Singapore; Sydney, Australia, 1993; pp. 43–115. [Google Scholar]
  224. Gunasekera, S. A Temperature-Based Methane Oxidation Performance Model for Field High-Rate Methane Biofilters. Ph.D. Thesis, University of Calgary, Calgary, AB, Canada, 2019. [Google Scholar] [CrossRef]
  225. Maier, M.; Schack-Kirchner, H. Using the gradient method to determine soil gas flux: A review. Agric. For. Meteorol. 2014, 192-193, 78–95. [Google Scholar] [CrossRef]
  226. LI-COR, n.d. Soil Gas Flux Solutions [WWW Document]. URL. Available online: https://www.licor.com/env/products/soil_flux/?gclid=EAIaIQobChMIvITAwae86wIVk6yWCh3NgQW5EAAYASAAEgK4G_D_BwE (accessed on 16 September 2020).
  227. Xu, L.; Furtaw, M.D.; Madsen, R.A.; Garcia, R.L.; Anderson, D.J.; McDermitt, D.K. On maintaining pressure equilibrium between a soil CO2flux chamber and the ambient air. J. Geophys. Res. Earth Surf. 2006, 111. [Google Scholar] [CrossRef] [Green Version]
  228. Penner, T.J.; Foght, J.M. Mature fine tailings from oil sands processing harbour diverse methanogenic communities. Can. J. Microbiol. 2010, 56, 459–470. [Google Scholar] [CrossRef]
  229. Chaplin, B.P.; Delin, G.N.; Baker, R.J.; Lahvis, M.A. Long-term evolution of biodegradation and volatilization rates in a crude oil-contaminated aquifer. Bioremediat. J. 2002, 6, 237–255. [Google Scholar] [CrossRef]
  230. Wyatt, D.E.; Richers, D.M.; Pirkle, R.J. Barometric pumping effects on soil gas studies for geological and environmental characterization. Environ. Earth Sci. 1995, 25, 243–250. [Google Scholar] [CrossRef]
  231. Gillis, A.; Miller, D.R. Some potential errors in the measurement of mercury gas exchange at the soil surface using a dynamic flux chamber. Sci. Total Environ. 2000, 260, 181–189. [Google Scholar] [CrossRef]
  232. Lundegard, P.D.; Johnson, P.C.; Dahlen, P. Oxygen Transport from the Atmosphere to Soil Gas Beneath a Slab-on-Grade Foundation Overlying Petroleum-Impacted Soil. Environ. Sci. Technol. 2008, 42, 5534–5540. [Google Scholar] [CrossRef]
  233. Johnson, A.N.; Boer, B.R.; Woessner, W.W.; Stanford, J.A.; Poole, G.; Thomas, S.A.; O’Daniel, S.J. Evaluation of an inexpensive small-diameter temperature logger for documenting ground water-river interactions. Ground Water Monit. Remediat. 2005, 25, 68–74. [Google Scholar] [CrossRef]
Figure 1. Natural source zone depletion (NSZD) conceptual model, showing all the possible microbial processes at light non-aqueous phase liquid (LNAPL) contaminated sites. This image is recreated based on DiMarzio and Zimbron [23]; Gieg et al. [36]; Irianni-Renno et al. [41]; Karimi Askarani et al. [46].
Sustainability 14 07027 g001
Figure 2. A summary of factors regulating NSZD rates. Appendix A provides a thorough literature summary and discusses each factor individually (see refs [13,25,57,58,59,60,61]).
Sustainability 14 07027 g002aSustainability 14 07027 g002b
Figure 3. Factors affecting (a) actual and (b) apparent NSZD rate.
Sustainability 14 07027 g003
Figure 4. Different alkali CO2 trap configurations used for NSZD rate resolution: (a) McCoy model developed in 2012 [56]; (b) Keith and Wong model developed in 2006 [30]. The images are recreated. For additional details about each model, refer to [37,56,108] and [30], respectively.
Sustainability 14 07027 g004
Figure 5. Precision of NSZD quantification techniques: (a) trap vs. dynamic closed chamber (DCC); (b) trap vs. concentration gradient (CG); (c) trap vs. thermal monitoring. Data were collected from Tracy [47], Keith and Wong [30], Rochette et al. [111], Kulkarni et al. [11] and Karimi Askarani et al. [46].
Sustainability 14 07027 g005aSustainability 14 07027 g005b
Figure 6. Bias introduced into CO2 efflux measurements by different quantification techniques (CO2 trap; dynamic closed chamber, DCC; and gradient concentration, CG). The graph is recreated based on lab-scale study of Tracy [47].
Sustainability 14 07027 g006
Table 1. Thermodynamics of LNAPL biodegradation at NSZD sites through different possible pathways. Decane (C10H22) is chosen as model hydrocarbon (compiled based on Interstate Technology and Regulatory Council (ITRC) [22]; Karimi Askarani and Sale [81]; Stockwell [78]).
Rank aRedox ReactionsEquation #Free Energy b
ΔGro
(kJ/mol-C10H22) c
Heat Exchange b ΔHro
(kJ/mol-C10H22) c
1Aerobic methane oxidation:
7.75   CH 4 + 15.6   O 2   7.75   CO 2 + 15.5   H 2 O
Equation (1)−6696 d−7444 d
2Aerobic respiration:
C 10 H 22 + 15.5   O 2   10   CO 2 + 11   H 2 O
Equation (2)−6505−6978
3Denitrification:
C 10 H 22 + 12.4   NO 3 + 12.4 H +   10   CO 2 + 17.2   H 2 O + 12.4   N 2
Equation (3)−6369−6314
4Manganese reduction:
C 10 H 22 + 31   MnO 2 + 62 H +   10   CO 2 + 42   H 2 O + 31   Mn 2 +
Equation (4)−6556−6559
5Iron reduction:
C 10 H 22 + 62   Fe ( OH ) 3 + 124 H +   10   CO 2 + 166   H 2 O + 62   Fe 2 +
Equation (5)−4441−5160
6Sulfate reduction:
C 10 H 22 + 7.75   SO 4 2 + 15.5 H +   10   CO 2 + 11   H 2 O + 7.75   H 2 S
Equation (6)−951−230
7Methanogenesis:
C 10 H 22 + 4.5   H 2 O   2.25   CO 2 + 7.75   CH 4
Equation (7)−203−23
a The ranking is determined by thermodynamic principles and tends to show the sequence of these reactions. The reaction which yields the highest energy occurs first, followed by the less yielding energy reactions [77]. Based on this concept, methane oxidation is the most thermodynamically favorable chemical reaction and is the primary source of biogenic heat at NSZD sites (see Section 4.4). b Changes in free energy in fact show change in entropy and heat exchange is resulted from changes in enthalpy. The values are calculated by the half-reaction bioenergetic values assembled by Stockwell [78] (refer to Table 1 in that reference). Note that changes in input parameters (i.e., enthalpies of products and reactants) can alter the overall enthalpy of the reaction. c Convert kJ/mole to kJ/g using decane molar weight of 142.29 g/mole. d For methane oxidation, the free energy and heat exchange are expressed in decane equivalent, to provide unit consistency, comparability of the values and convenience in comparison. In calculations, the denominator was on decane basis (i.e., kJ/mole decane), instead of methane.
Table 2. Summary of advantages and limitations of NSZD rate quantification techniques.. Appendix B discusses each technique individually and provides a thorough literature summary of each technique’s advantages and limitations.
TechniqueAdvantagesLimitationsNiche Applications
Concentration gradient (CG)
  • Gives instantaneous measurement.
  • No need for background correction (depending on the installation depth of the sampler).
  • Can resolve NSZD rate via different physicochemical pathways.
  • Can determine soil properties and texture in a soil column.
  • Intrusive.
  • Time consuming and labor intensive.
  • Only provides a snapshot of subsurface gas profiles.
  • Quantifies diffusive gas transport only, overlooking the effect of advection.
  • Accuracy can be affected by many environmental conditions.
  • Accuracy can be affected by anthropogenic interferences.
  • Capped sites (e.g., covered landfills).
Dynamic closed chamber (DCC)
  • Gives instantaneous measurement.
  • Short runtime (i.e., surficial CO2 efflux measurement within 90–120 s).
  • Can take multiple measurements in a short period of time, so can also be used for long-term measurements.
  • Minimally intrusive.
  • Provides real-time field values.
  • Easy to transport device.
  • Accounts for both diffusive and advective gas transport mechanisms.
  • Time consuming and labor intensive (less than the CG though).
  • Correction for natural soil respiration (NSR) is required, using either stable carbon and radiocarbon isotope analysis or background correction.
  • Stable carbon and radiocarbon isotope analyses require sample collection, expensive analytical procedure and trained personnel for the analysis.
  • Finding a background location which can be representative of the NSR of NSZD spot is a challenge.
  • Accounts for NSZD rate via biodegradation only.
  • Accuracy can be affected by many environmental conditions.
  • Accuracy can be affected by anthropogenic interferences.
  • Estimate NSZD rate via biodegradation only.
  • Cannot be used throughout the entire year in cold regions like Canada.
  • It is highly likely that it captures NSZD rates with a few months’ delay.
  • Site-wide surveys (e.g., screening LNAPL impacted areas).
CO2 trap
  • Provides time-integrated, long-term measurement of surficial CO2 effluxes.
  • Simple.
  • Cost-effective.
  • Passive (minimal labor requirement).
  • Long-term measurement can offset the adverse effect of barometric pumping.
  • Minimally intrusive.
  • Accounts for both diffusive and advective gas transport mechanisms.
  • Time consuming.
  • Detection limit depends on the device’s opening.
  • Accuracy can be affected by many environmental conditions.
  • Accuracy can be affected by anthropogenic interferences.
  • Estimate NSZD rate via biodegradation only.
  • Cannot be used throughout the entire year in cold regions like Canada.
  • It is highly likely that it captures NSZD rates with a few months’ delay.
  • Long-term monitoring of NSZD sites.
Thermal monitoring
  • Short-term and long-term measurements, depending on the type of biogenic heat sampler utilized.
  • Cost-effective.
  • Yearlong measurement.
  • High-resolution data collection.
  • Averaging out negative and positive biases.
  • Converging apparent and actual NSZD rates.
  • Higher accuracy (compared to other methods).
  • Intrusive.
  • Labor intensive for field installations and desktop analysis (data reduction, programming, mathematical skills).
  • Requires background correction, which is a challenge to spot the correct location.
  • Accuracy of this method is highly sensitive to environmental factors that can either suppress or cease methanotrophic activity.
  • Estimate NSZD rate via biodegradation only.
  • Long-term monitoring of NSZD sites, especially at regions with natural (e.g., ice cover) and artificial (e.g., urban developments with pavements) impervious surfaces.
Publisher’s Note: MDPI stays neutral with regard to jurisdictional claims in published maps and institutional affiliations.

