
Effect of Teflon-Coated PVDF Membrane on the Performance of a Solar-Powered Direct Contact Membrane Distillation System

 , and
, and 
Abstract
:1. Introduction
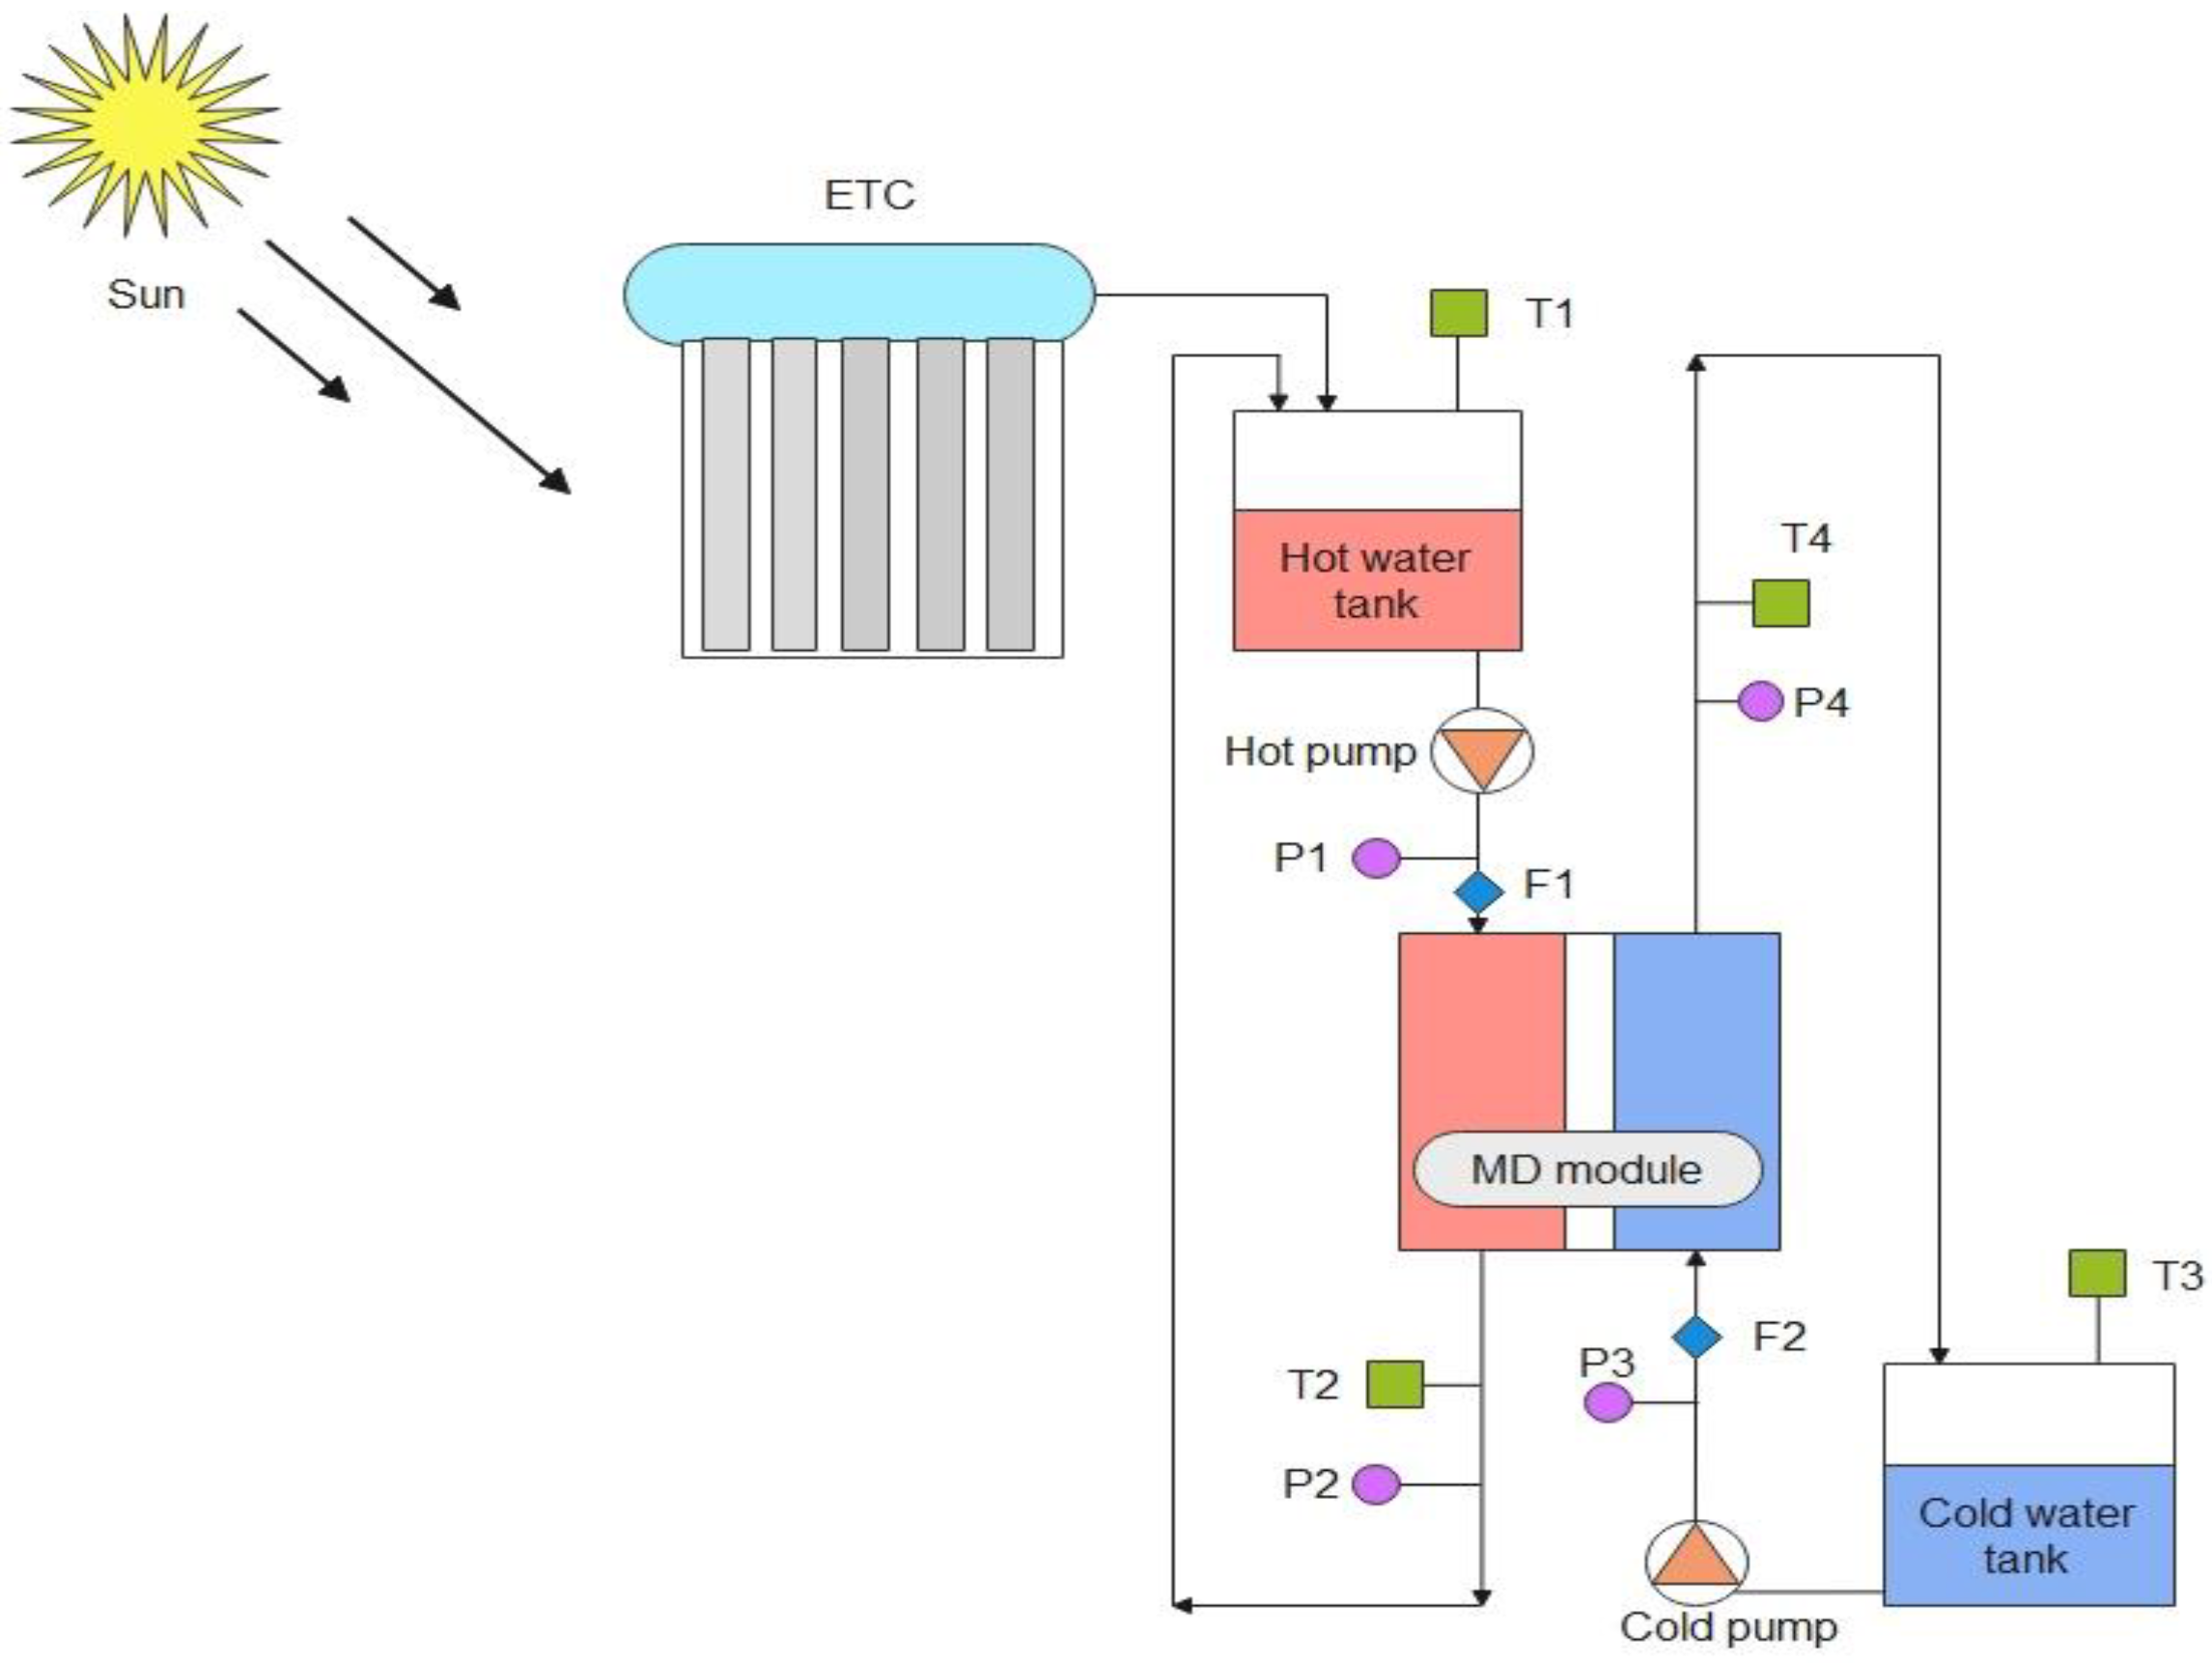
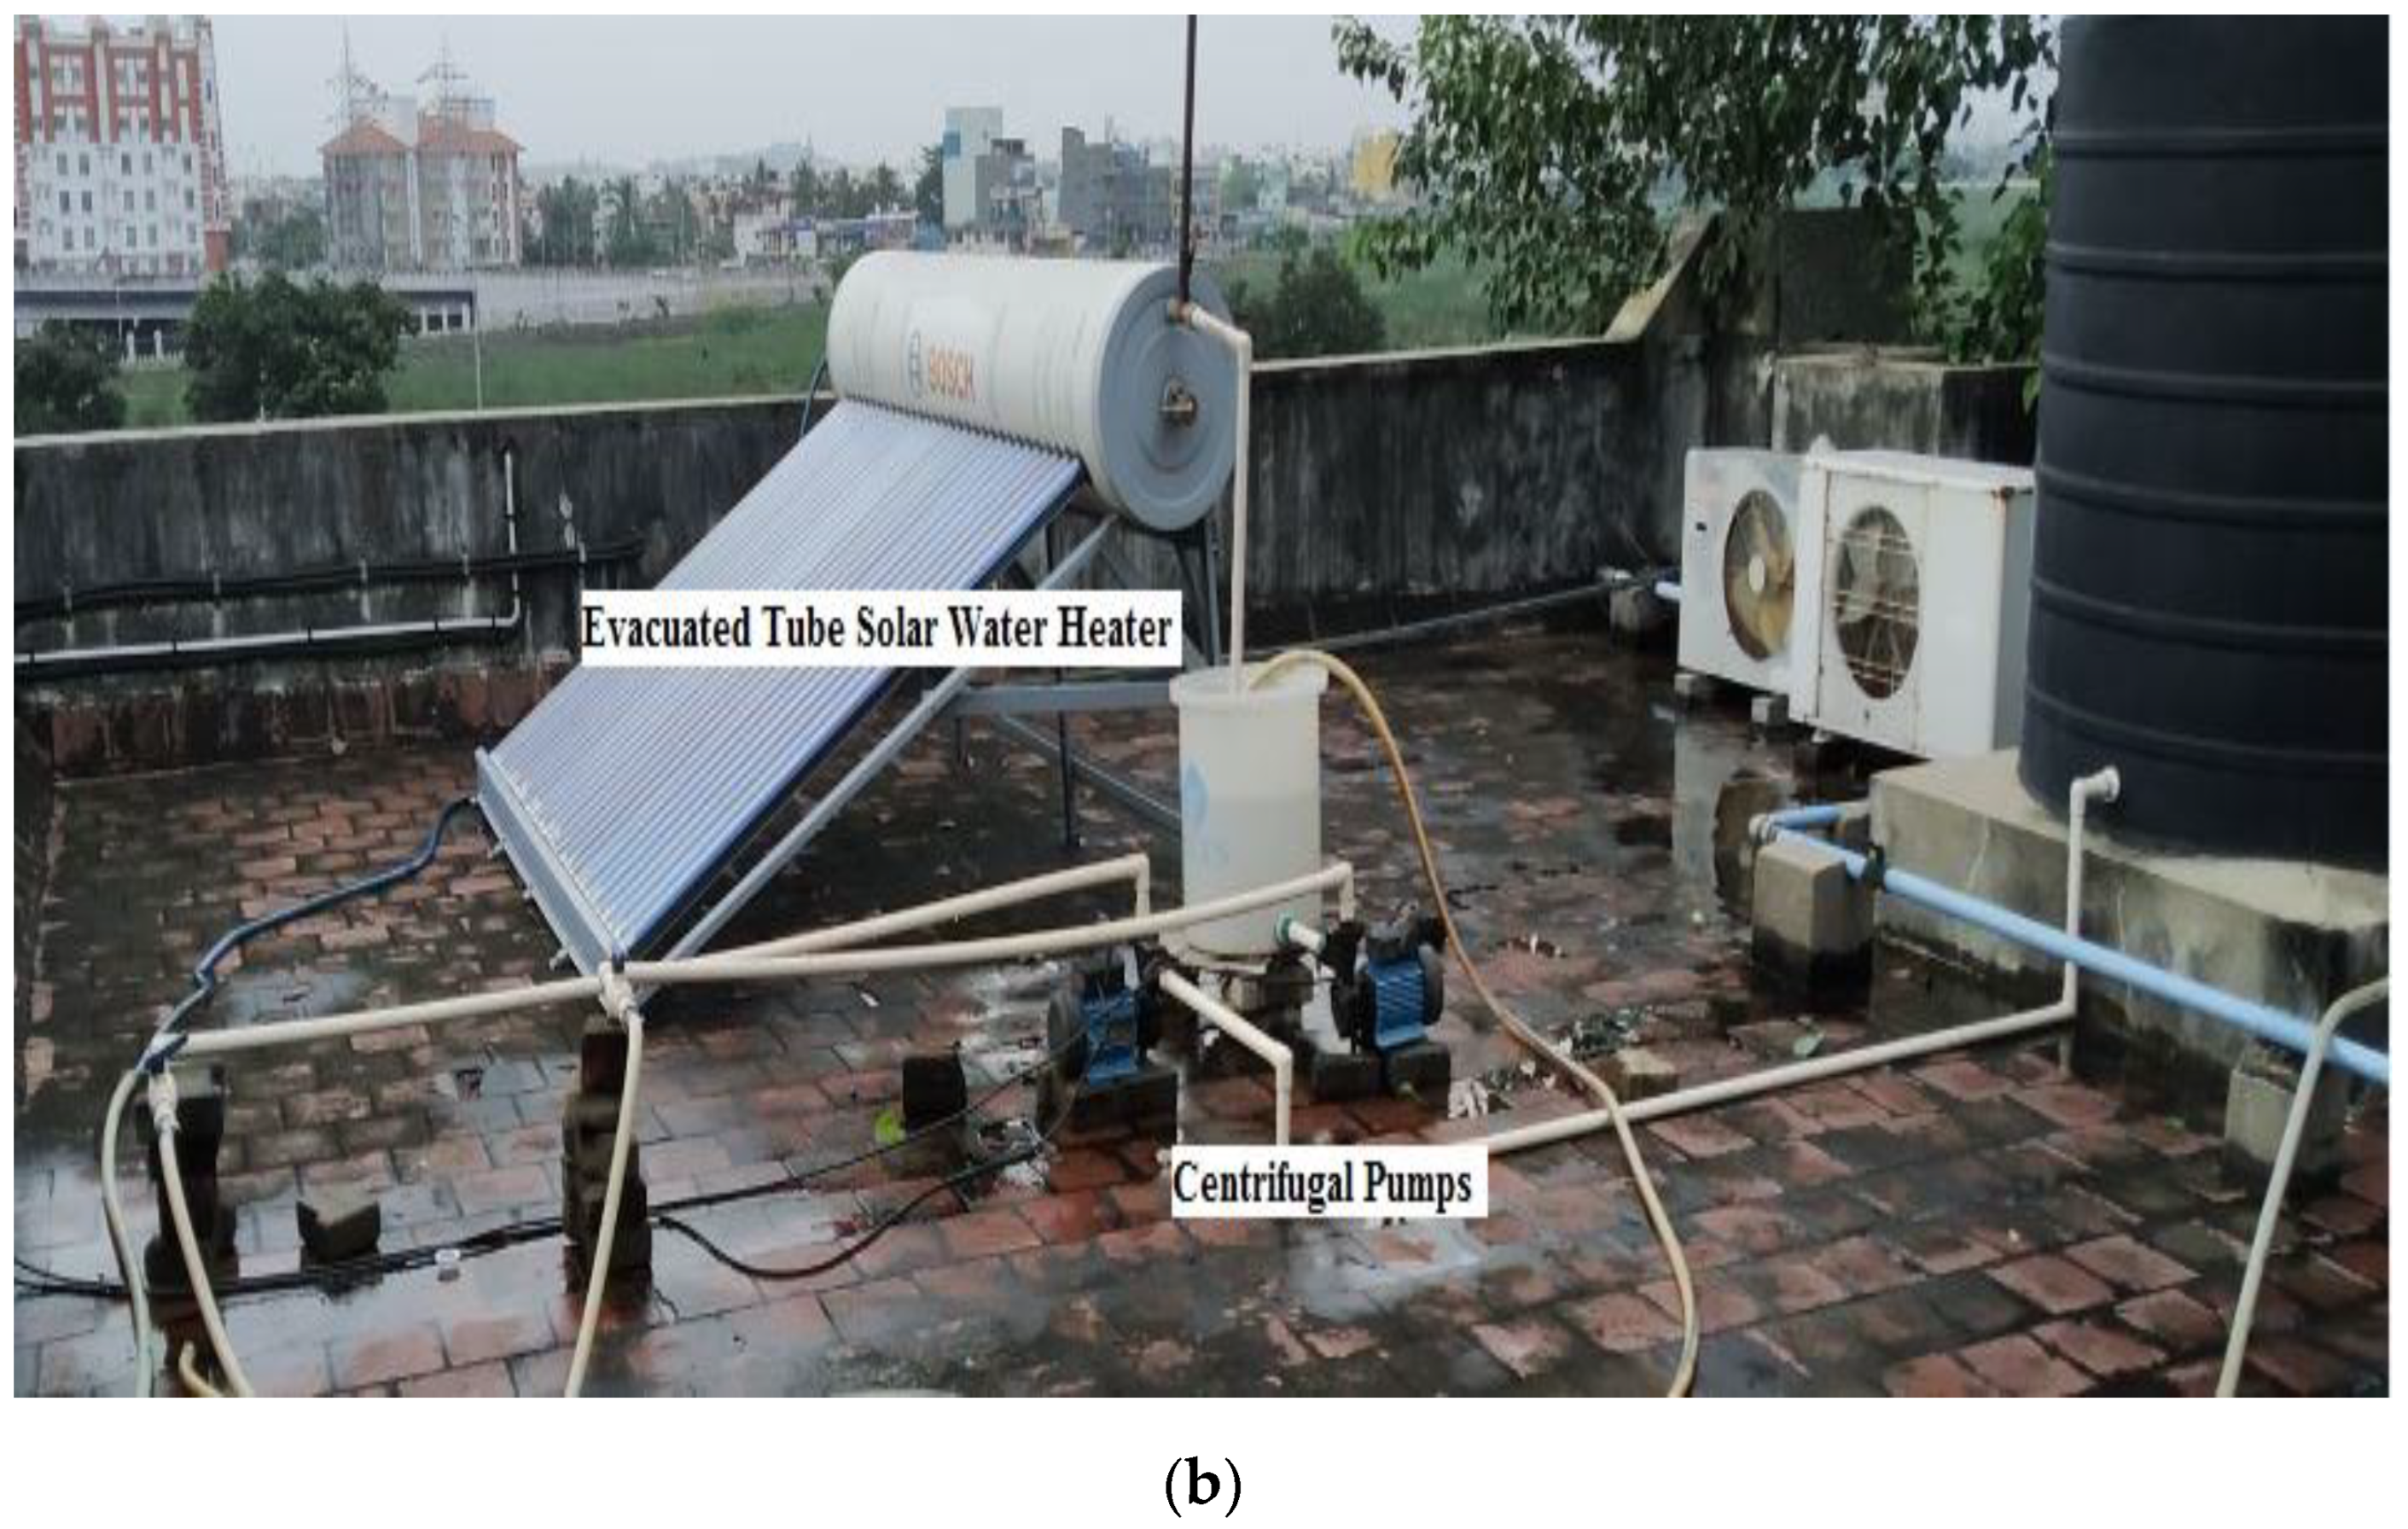
2. Experimentation
2.1. Experimental Methodology
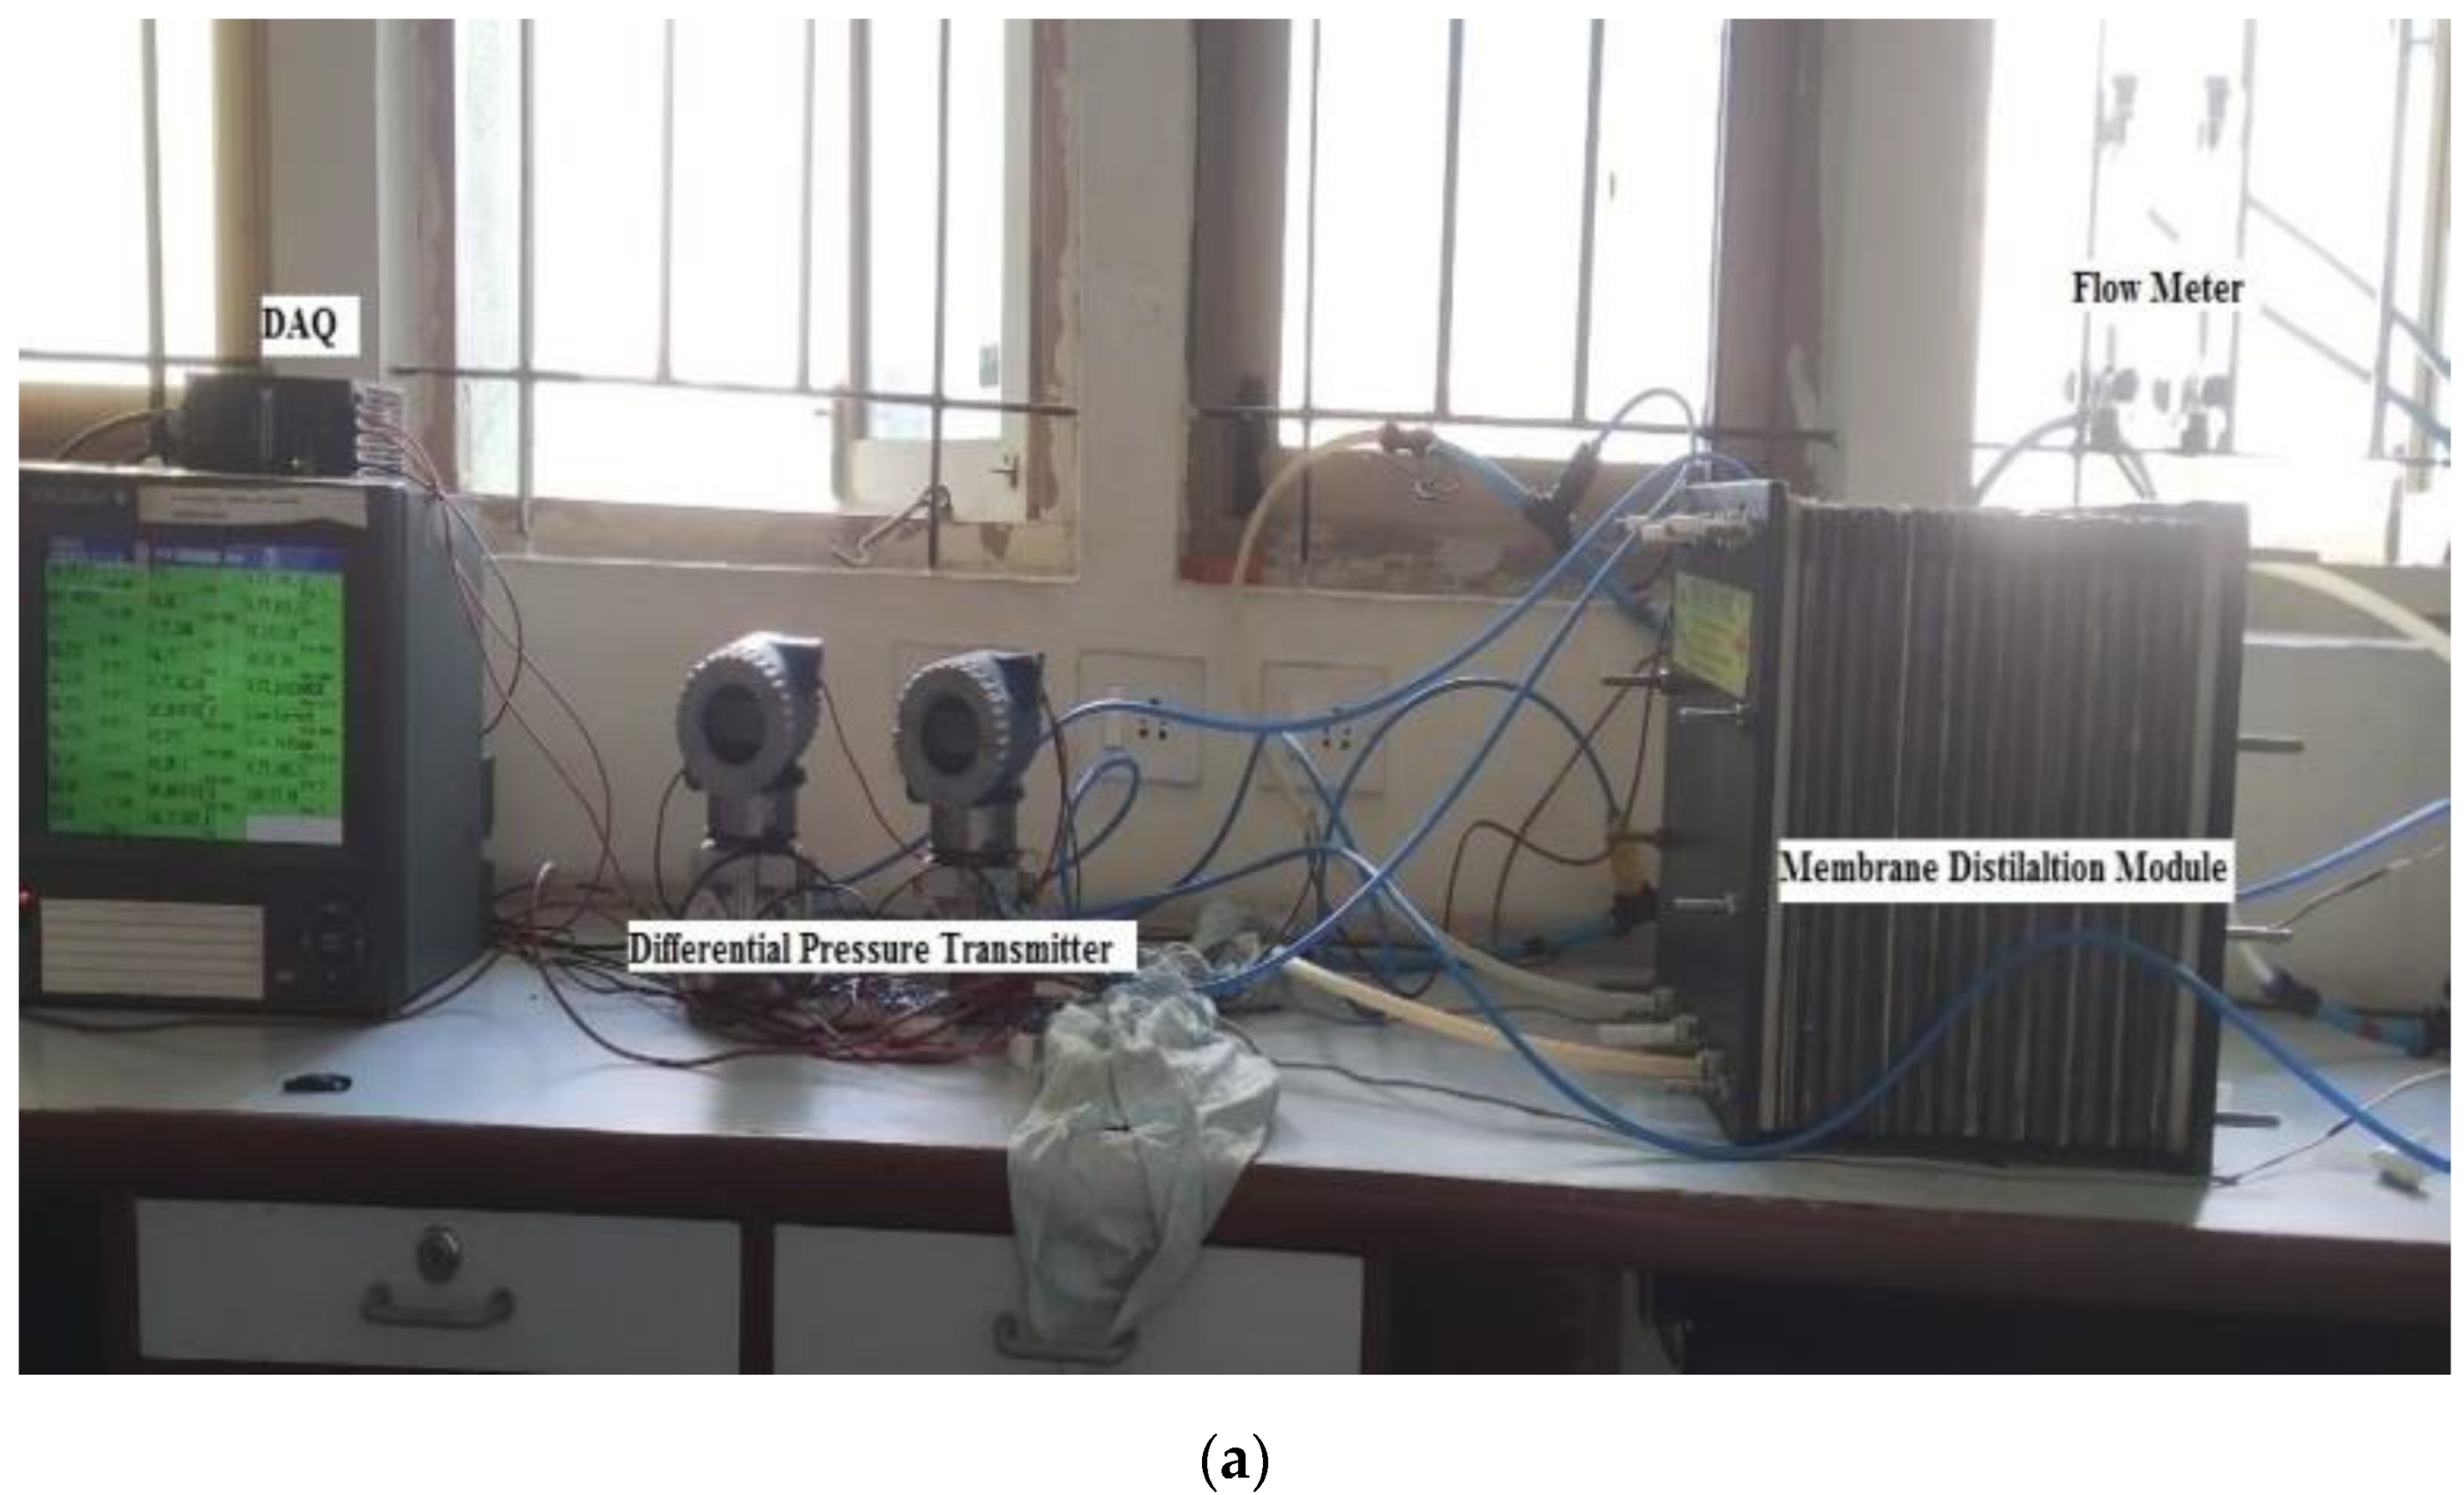
2.2. Measurement and Instrumentation
2.3. Performance Assessment
2.3.1. Permeate Mass Flux
2.3.2. Vapor Pressure of Feed and Permeate
2.3.3. Temperature Polarization Coefficient (TPC)
2.3.4. Evaporative Efficiency of the System (EE)
3. Results and Discussion
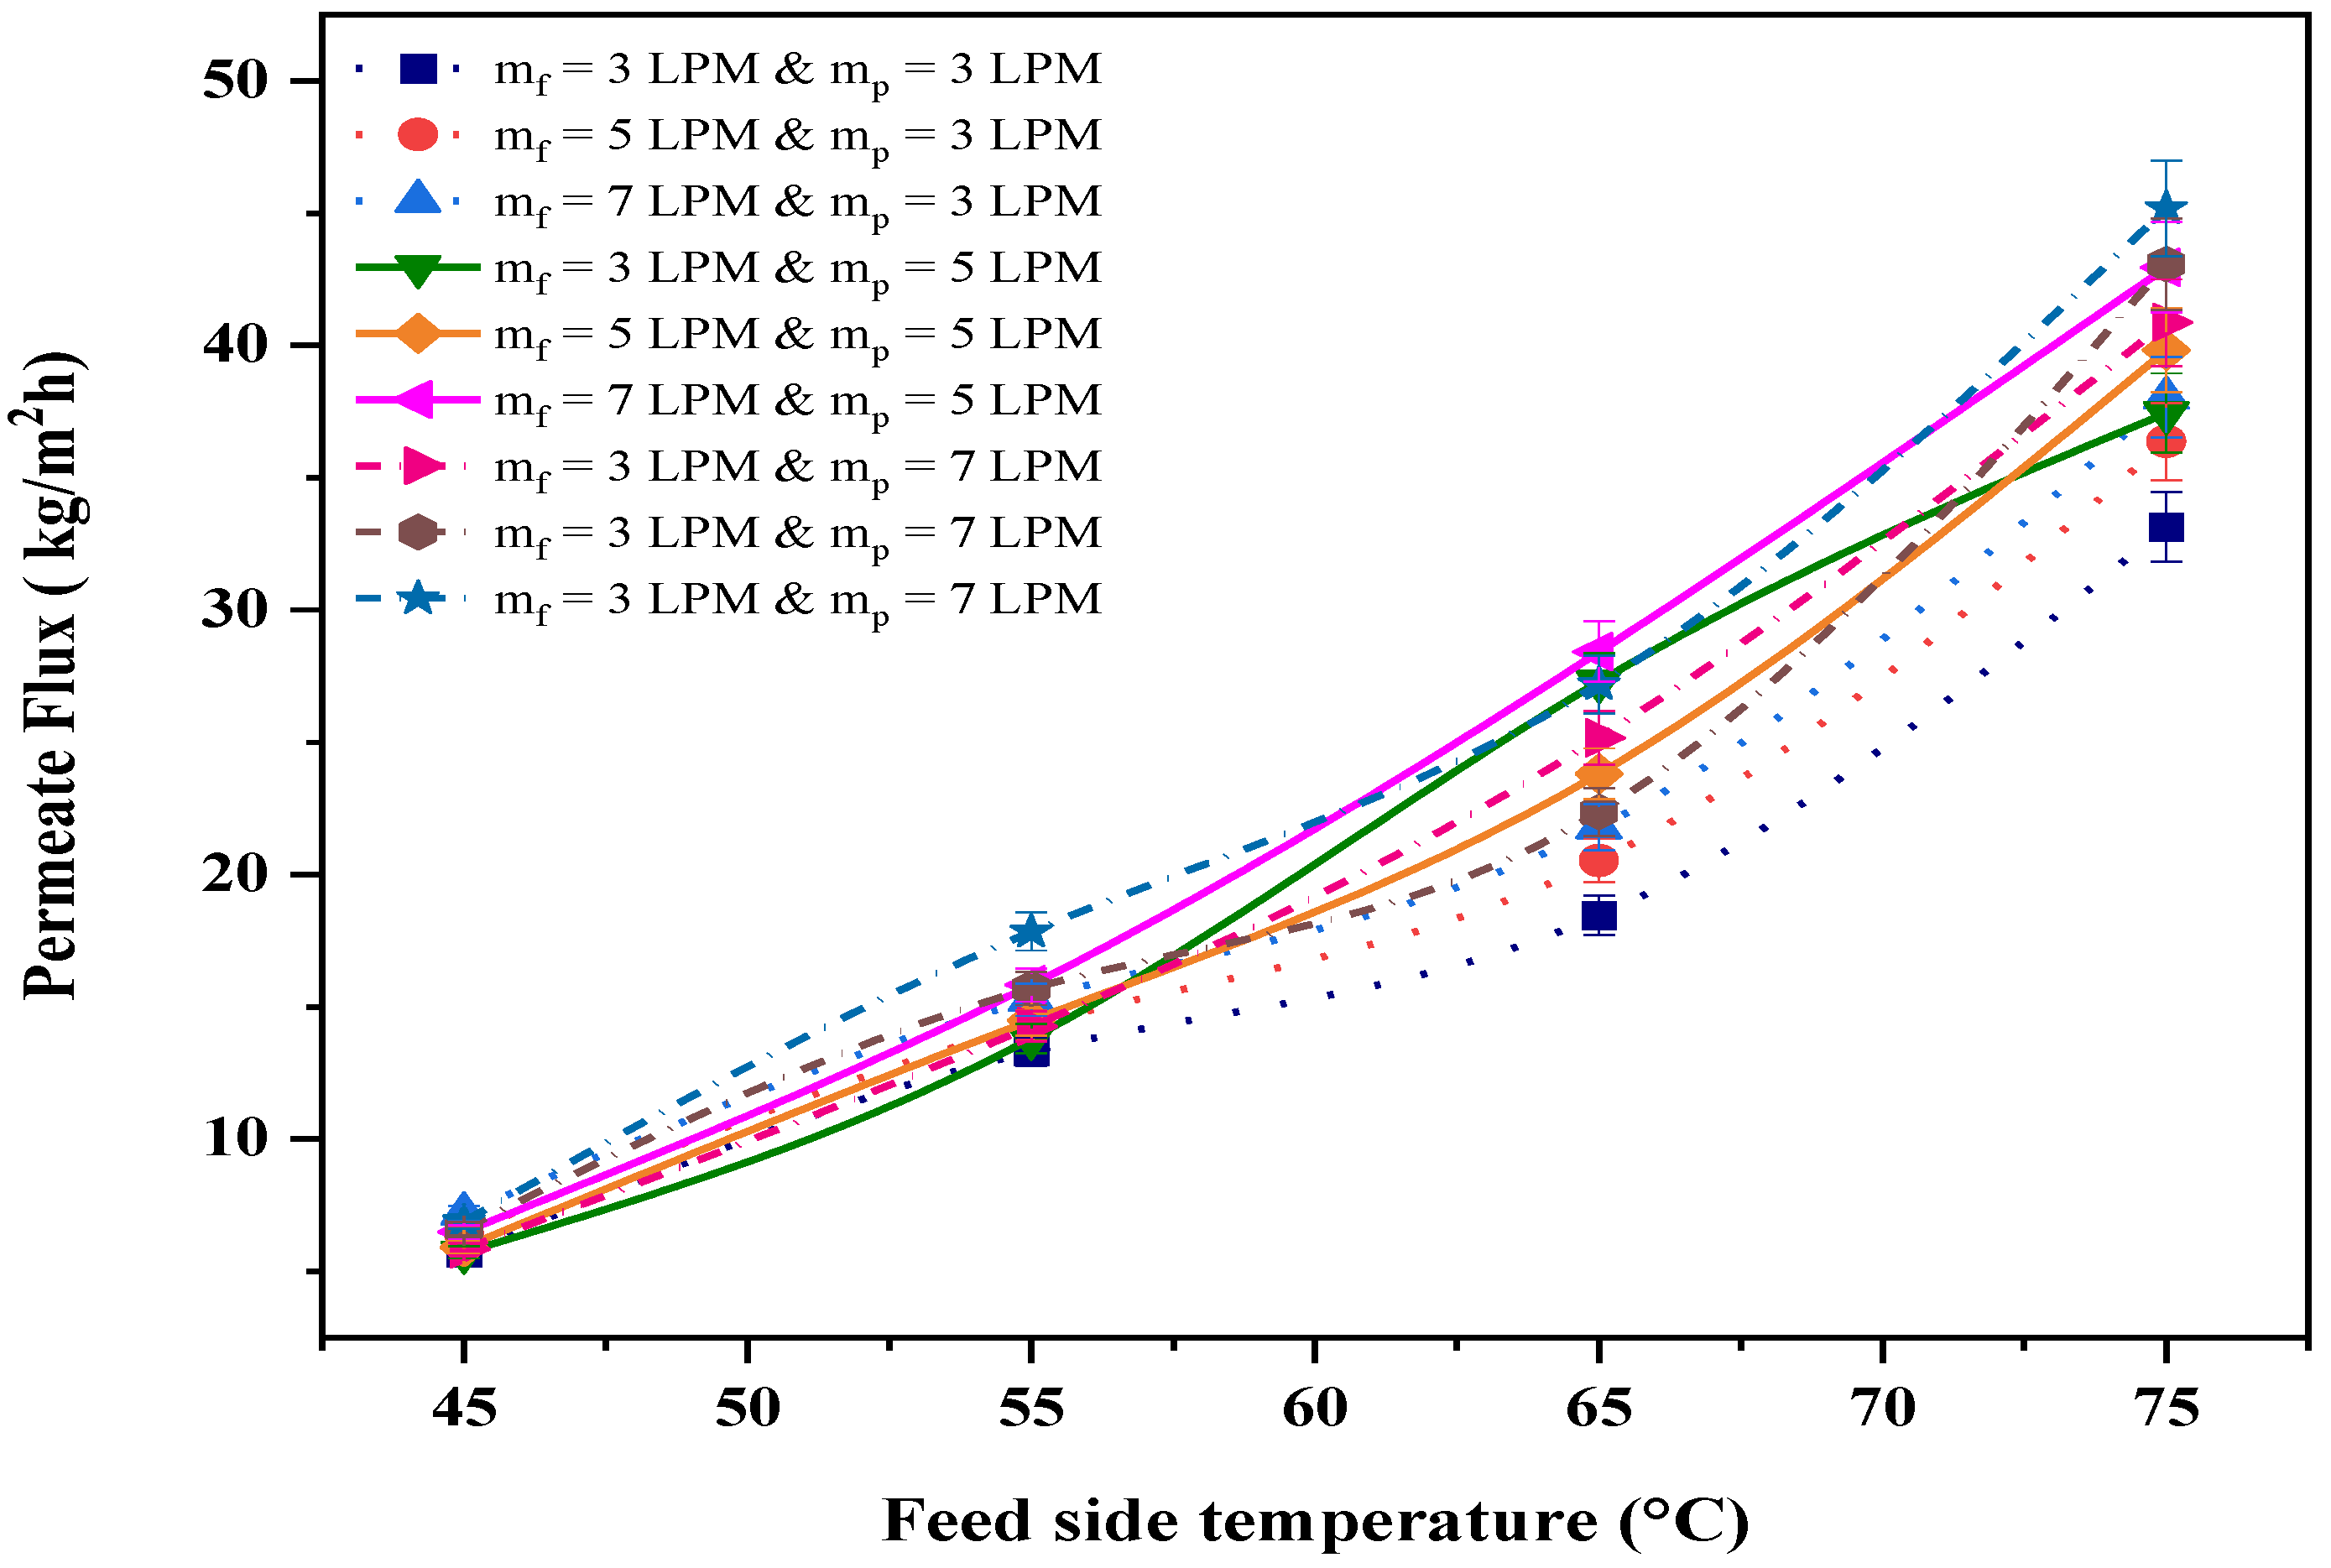
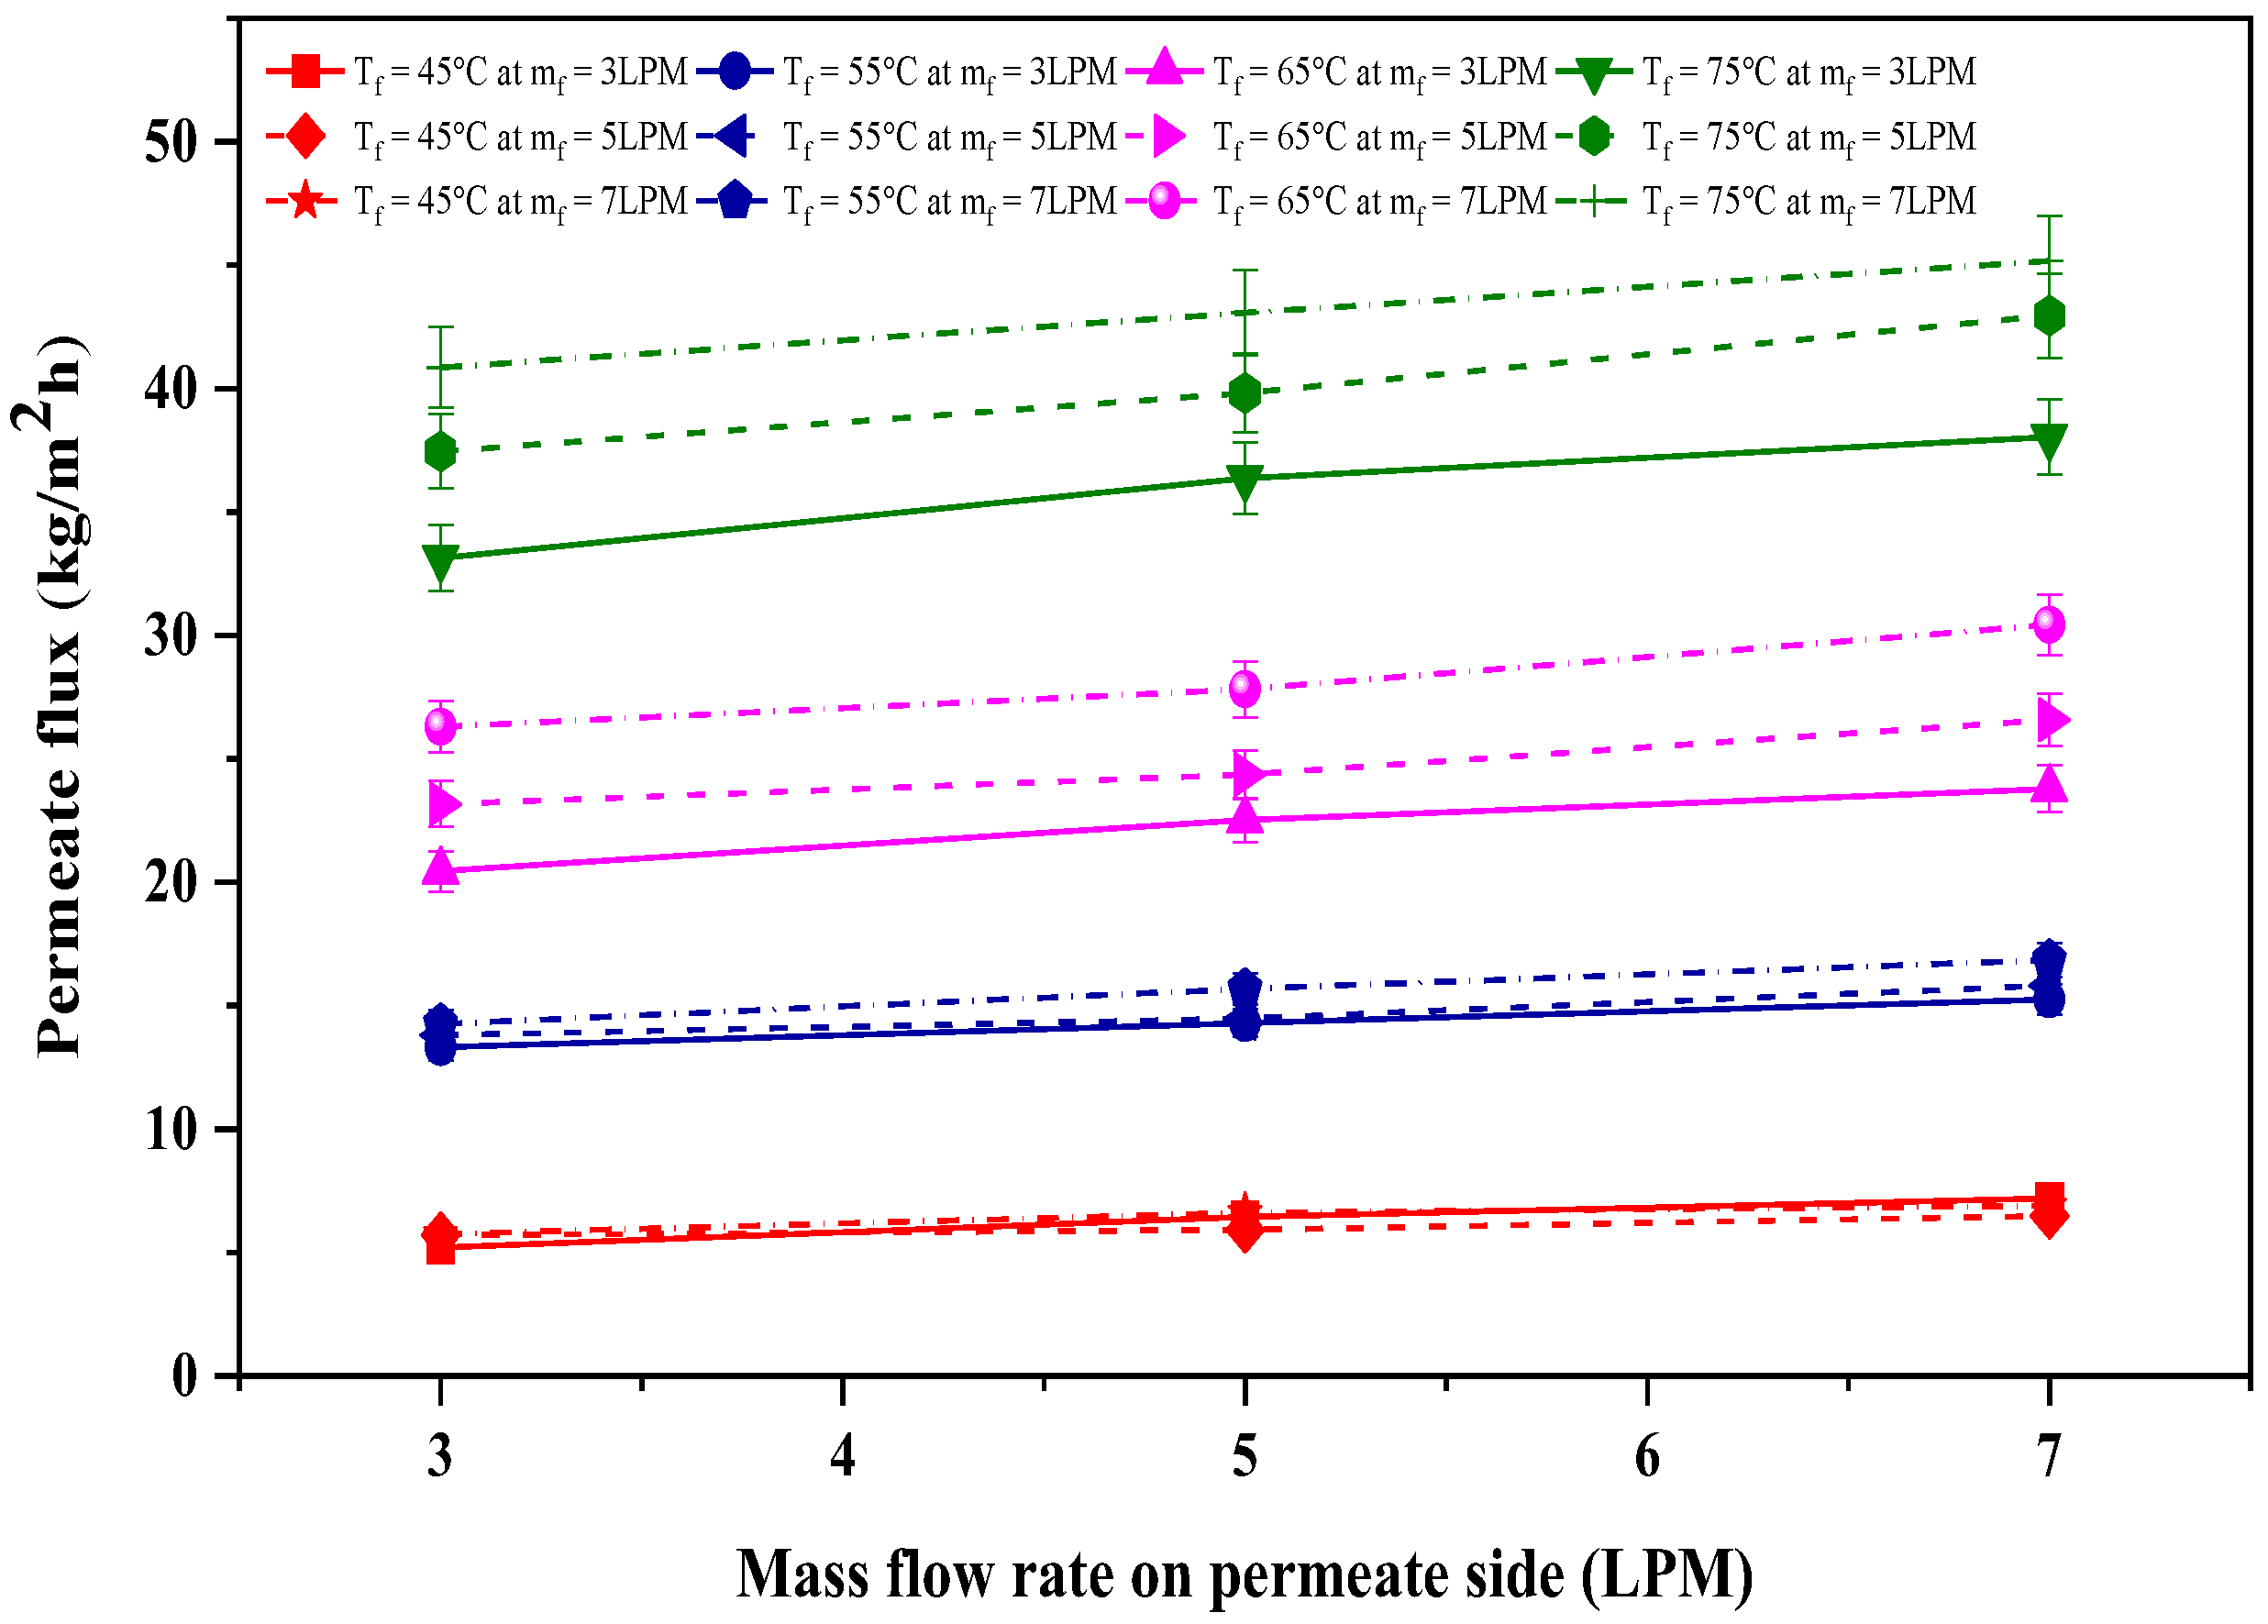
3.1. Effect of Feed Temperature on Permeate Flux for Varying Feed/Permeate Flow Rate
3.2. Effect of Permeate Flow Rate on Permeate Flux for Varying Feed Flow Rate/Temperature
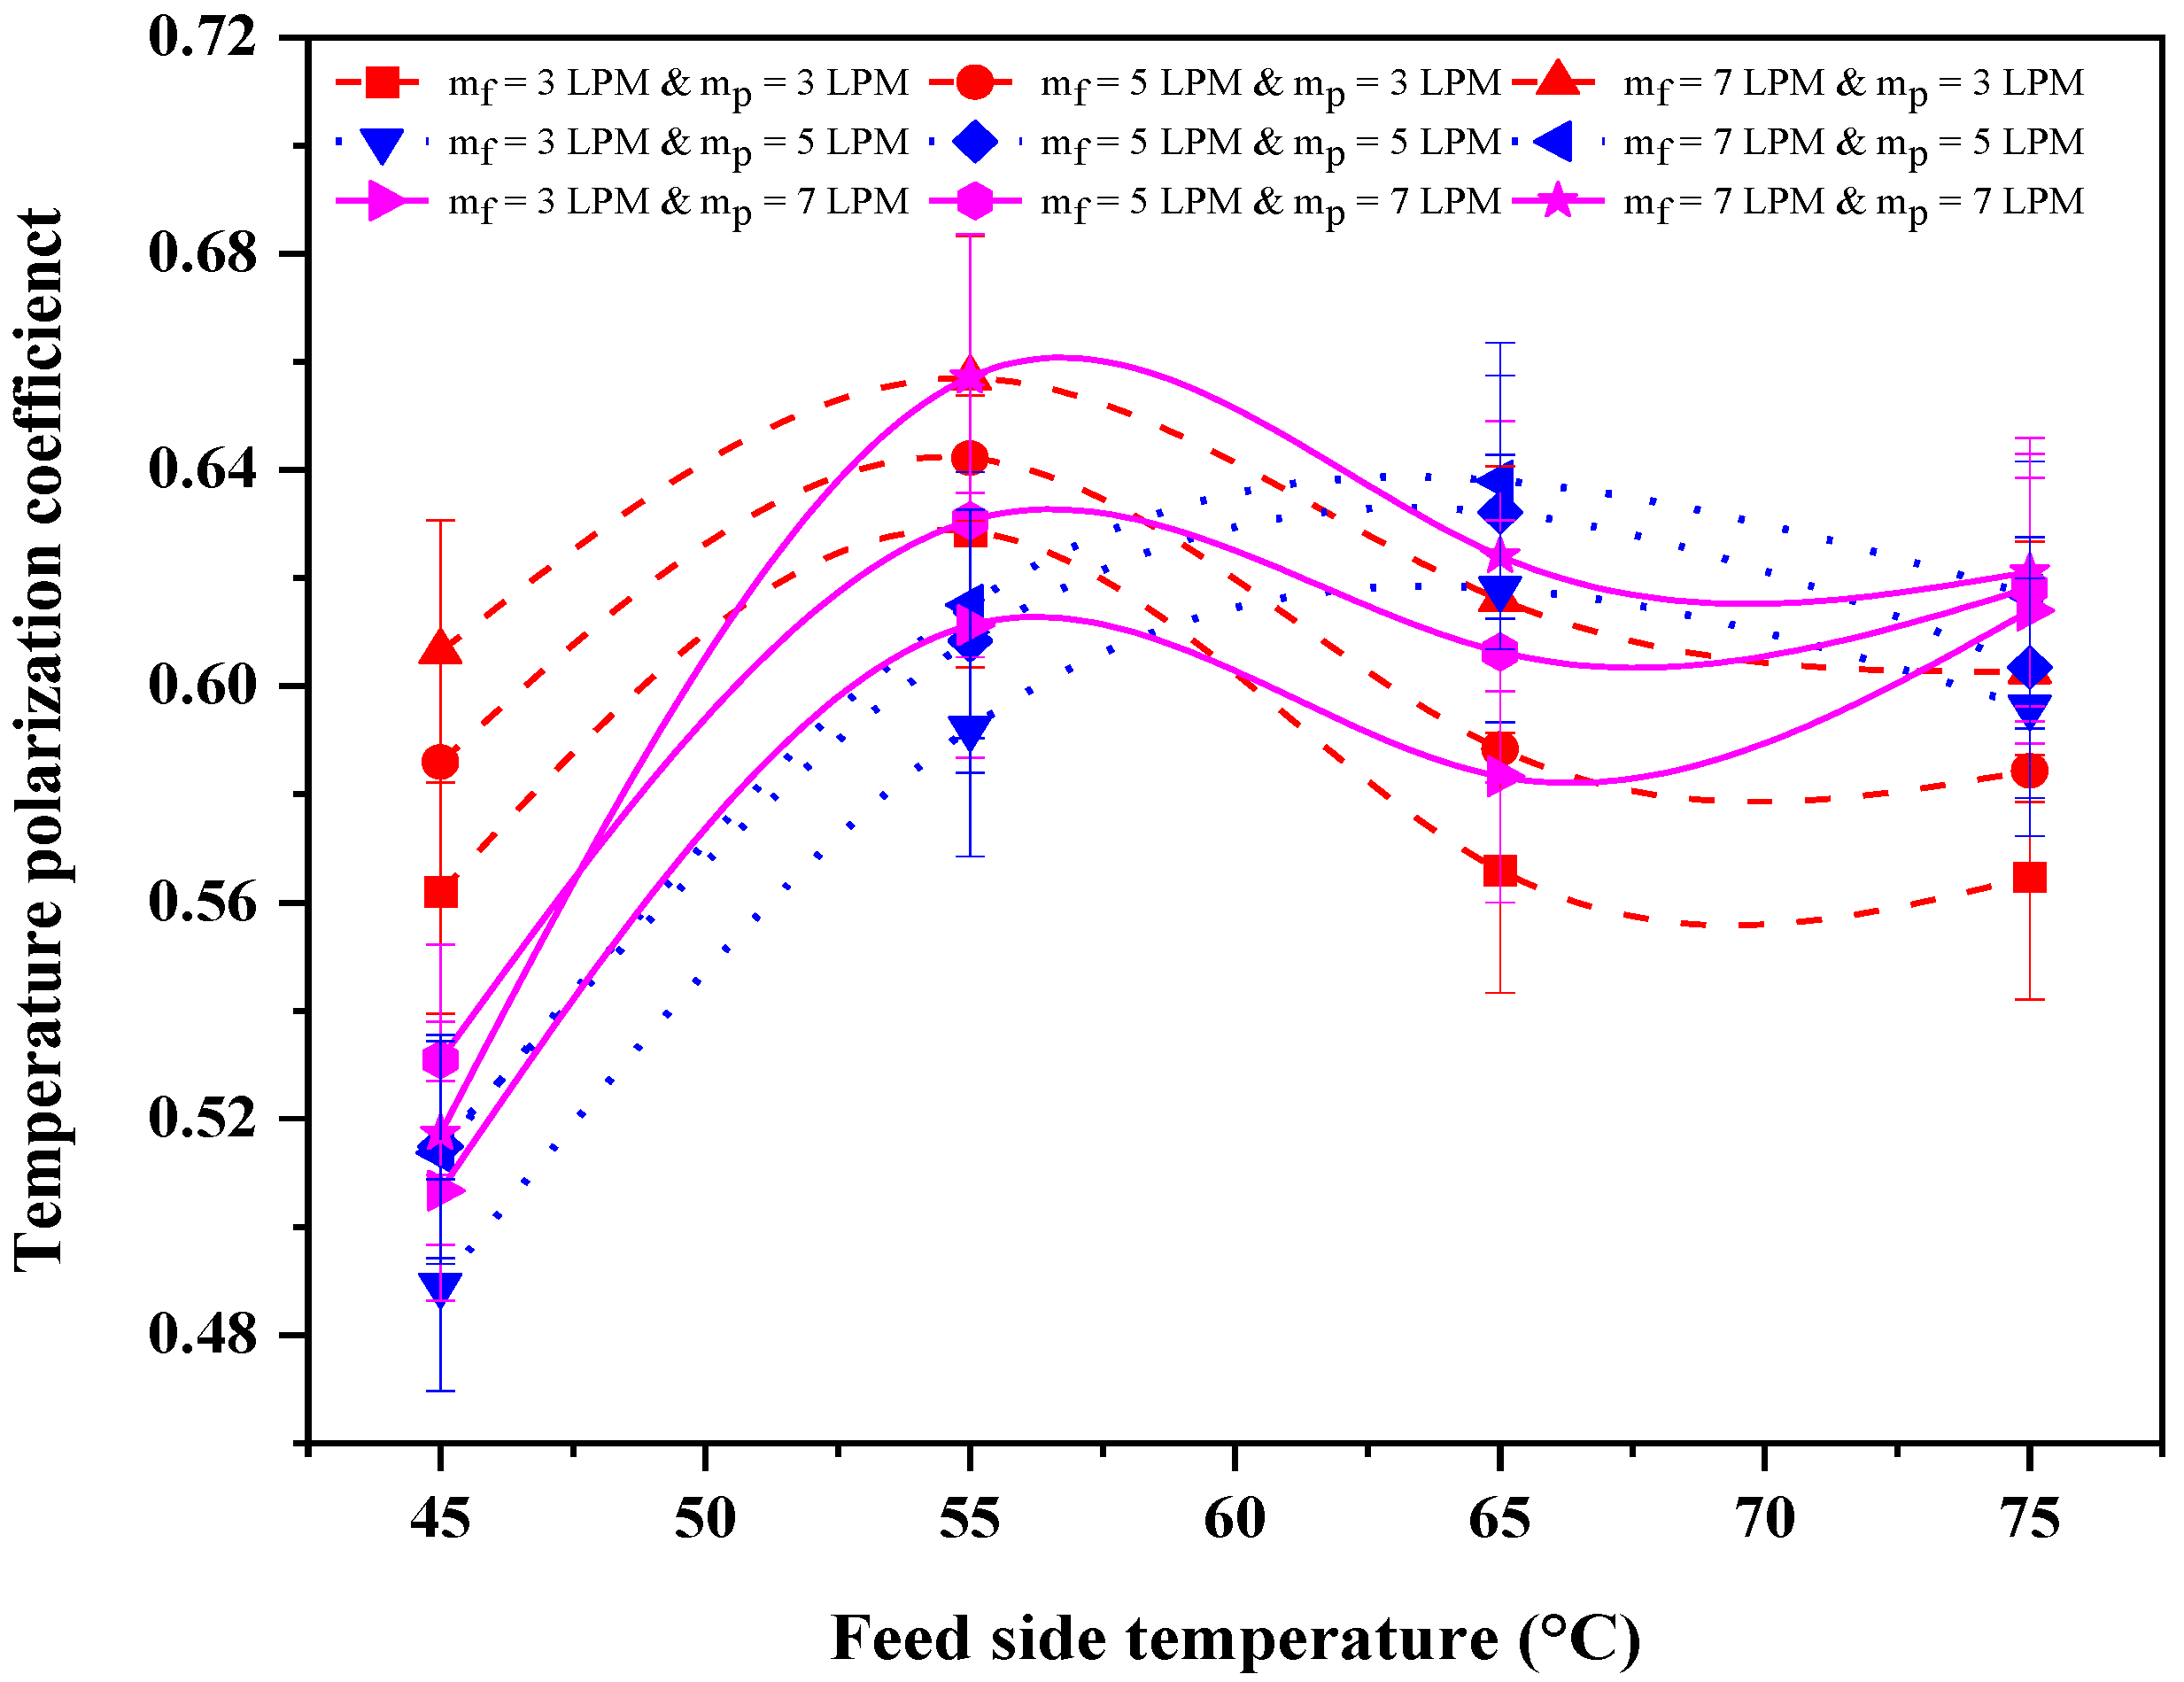
3.3. Effect of mp, mf, and Feed Temperature on Temperature Polarization Coefficient (TPC)
3.4. Effect of mp, mf, and Feed Temperature on Evaporative Efficiency (EE)
3.5. Comparison with Previous Literature
3.6. Uncertainty Analysis
4. Cost Analysis
5. Conclusions
- (i)
- A maximum permeate flux of 45.18 kg/m2h was achieved for optimum feed and permeate fluid temperatures of 75 °C and 30 °C, respectively, along with optimum flow rates of 7 LPM across both sides of the hydrophobic membrane.
- (ii)
- A higher permeate flux was found to exist for a maximum feed flow rate of 7 LPM irrespective of the feed temperature (45–75 °C), indicating the predominant influence of the former parameter.
- (iii)
- The difference in the TPC value for a given feed solution temperature was identified to be significant for different feed flow rates. A high TPC value of 0.62 was achieved when the feed flow rate was a maximum of 7 LPM, irrespective of the feed temperatures.
- (iv)
- A higher evaporative efficiency of 78.22% was achieved from the present solar ETC-powered DCMD system for maximum feed/permeate flow rates of 7 LPM and a maximum feed temperature of 75 °C. Further, the system experienced a lower evaporative efficiency of 62.06% with a decrement in the fluid flow rates to 3 LPM.
Author Contributions
Funding
Institutional Review Board Statement
Informed Consent Statement
Data Availability Statement
Acknowledgments
Conflicts of Interest
Nomenclature
| Acronyms | |
| ACBD | Annual brine disposal cost |
| ACelectricity | Annual electric cost |
| ACLabour | Annual Labor cost |
| ACMR | Membrane replacement cost |
| ACMT | Annual maintenance cost |
| ACO&M | Annual operation and maintenance cost |
| CPC | Compound parabolic collector |
| DAQ | Data acquisition system |
| DCC | Direct Capital Cost |
| DCMD | Direct Contact Membrane Distillation |
| EE | Evaporative efficiency |
| ETSC | Evacuated Tube Solar Collector |
| HFP | Hexafluoropropylene |
| HNT | Halloysite |
| kW | Kilowatt |
| LEP | Liquid entry pressure |
| LPM | Liter per Minute |
| MD | Membrane distillation |
| PE | Polyethylene |
| PTFE | Polyfluoroethylene |
| PVDF | Polyvinylidene fluoride |
| TPC | Temperature Polarization coefficient |
| WPC | Water production cost |
| Symbols | |
| a | amortization factor |
| ACtotal | total annual cost |
| Bm | mass transfer coefficient |
| dp | membrane pore of size |
| dPc | pressure difference on cold side |
| dPh | pressure difference on hot side |
| f | plant availability |
| IR | Interest rate (%) |
| Jw | permeate flux (kg/m2s) |
| Kn | Knudsen number |
| p | plant life (years) |
| Pwf | vapor pressure (Pa) across the feed side |
| Pwp | vapor pressure (Pa) across the permeate sides |
| QC | conductive heat flux (W/m2) |
| QV | evaporative mass flux (W/m2) |
| Qw | fresh water production in m3/day |
| Tci | Cold-side inlet Temperature |
| Tco | cold side outlet Temperature |
| Tf, | bulk feed temperature |
| Thi | hot-side Inlet temperature |
| Tho | hot-side Outlet Temperature |
| Tmf | temperature across the feed sides |
| Tmp | temperature across the permeate sides |
| Tp | bulk permeate temperature |
| WT | total uncertainty |
| ΔH | enthalpy of evaporation (kJ/kg) |
| Λ | mean free path |
References
- Luo, T.; Young, R.; Reig, P. Aqueduct Projected Water Stress Country Rankings; Technical Note; World Resources Institute: Washington, DC, USA, 2015; pp. 1–16. [Google Scholar]
- UN World Water Development Report 2021. 2021. Available online: https://www.unwater.org/publications/un-world-water-development-report-2021/ (accessed on 21 March 2021).
- Tiwari, A.; Rathod, M.K.; Kumar, A. A comprehensive review of solar-driven desalination systems and its advancements. Environ. Dev. Sustain. 2022, 1–32. [Google Scholar] [CrossRef]
- Mezher, T.; Fath, H.; Abbas, Z.; Khalid, A. Techno-economic assessment and environmental impacts of desalination technologies. Desalination 2011, 266, 263–273. [Google Scholar] [CrossRef]
- Horseman, T.; Yin, Y.; Christie, K.S.; Wang, Z.; Tong, T.; Lin, S. Wetting, Scaling, and Fouling in Membrane Distillation: State-of-the-Art Insights on Fundamental Mechanisms and Mitigation Strategies. ACS ES T Eng. 2021, 1, 117–140. [Google Scholar] [CrossRef]
- Belessiotis, V.; Kalogirou, S.; Delyannis, E. Membrane Distillation; Academic Press: Cambridge, MA, USA, 2016; pp. 191–251. [Google Scholar] [CrossRef]
- Wang, P.; Chung, T.S. Recent advances in membrane distillation processes: Membrane development, configuration design and application exploring. J. Membr. Sci. 2015, 474, 39–56. [Google Scholar] [CrossRef]
- Yan, Z.; Yang, H.; Qu, F.; Yu, H.; Liang, H.; Li, G.; Ma, J. Reverse osmosis brine treatment using direct contact membrane distillation: Effects of feed temperature and velocity. Desalination 2017, 423, 149–156. [Google Scholar] [CrossRef]
- Khayet, M. Membranes and theoretical modeling of membrane distillation: A review. Adv. Colloid Interface Sci. 2011, 164, 56–88. [Google Scholar] [CrossRef]
- Bodel, B.R. Distillation of Saline Water Using Silicone Rubber Membrane. U.S. Patent 3361645A, 9 August 1968. [Google Scholar]
- Wu, Y.; Kong, Y.; Lin, X.; Liu, W.; Xu, J. Surface-modified hydrophilic membranes in membrane distillation. J. Membr. Sci. 1992, 72, 189–196. [Google Scholar] [CrossRef]
- Kong, Y.; Lin, X.; Wu, Y.; Chen, J.; Xu, J. Plasma polymerization of octafluorocyclobutane and hydrophobic microporous composite membranes for membrane distillation. J. Appl. Polym. Sci. 1992, 46, 191–199. [Google Scholar] [CrossRef]
- Hubadillah, S.K.; Tai, Z.S.; Othman, M.H.D.; Harun, Z.; Jamalludin, M.R.; Rahman, M.A.; Jaafar, J.; Ismail, A.F. Hydrophobic ceramic membrane for membrane distillation: A mini review on preparation, characterization, and applications. Sep. Purif. Technol. 2019, 217, 71–84. [Google Scholar] [CrossRef]
- Lawson, K.W.; Lloyd, D.R. Membrane distillation. II. Direct contact MD. J. Membr. Sci. 1996, 120, 123–133. [Google Scholar] [CrossRef]
- Curcio, E.; Drioli, E. Membrane Distillation and Related Operations—A Review. Sep. Purif. Rev. 2005, 34, 35–86. [Google Scholar] [CrossRef]
- Rácz, G.; Kerker, S.; Kovács, Z.; Vatai, G.; Ebrahimi, M.; Czermak, P. Theoretical and Experimental Approaches of Liquid Entry Pressure Determination in Membrane Distillation Processes. Period. Polytech. Chem. Eng. 2014, 58, 81–91. [Google Scholar] [CrossRef] [Green Version]
- Li, J.-M.; Xu, Z.-K.; Liu, Z.-M.; Yuan, W.-F.; Xiang, H.; Wang, S.-Y.; Xu, Y.-Y. Microporous polypropylene and polyethylene hollow fiber membranes. Part 3. Experimental studies on membrane distillation for desalination. Desalination 2003, 155, 153–156. [Google Scholar] [CrossRef]
- Liu, F.; Hashim, N.A.; Liu, Y.; Abed, M.M.; Li, K. Progress in the production and modification of PVDF membranes. J. Membr. Sci. 2011, 375, 1–27. [Google Scholar] [CrossRef]
- Ravi, J.; Othman, M.H.D.; Tai, Z.S.; El-Badawy, T.; Matsuura, T.; Kurniawan, T.A. Comparative DCMD performance of hydrophobic-hydrophilic dual-layer hollow fibre PVDF membranes incorporated with different concentrations of carbon-based nanoparticles. Sep. Purif. Technol. 2021, 274, 118948. [Google Scholar] [CrossRef]
- AbdulKadir, W.A.F.W.; Ahmad, A.L.; Ooi, B.S. A water-repellent PVDF-HNT membrane for high and low concentrations of oxytetracycline treatment via DCMD: An experimental investigation. Chem. Eng. J. 2021, 422, 129644. [Google Scholar] [CrossRef]
- Makanjuola, O.; Anis, S.F.; Hashaikeh, R. Enhancing DCMD vapor flux of PVDF-HFP membrane with hydrophilic silica fibers. Sep. Purif. Technol. 2021, 263, 118361. [Google Scholar] [CrossRef]
- Twibi, M.F.; Othman, M.H.D.; Hubadillah, S.K.; Alftessi, S.A.; Adam, M.R.B.; Ismail, A.F.; Rahman, M.A.; Jaafar, J.; Raji, Y.O.; Aziz, M.H.A.; et al. Hydrophobic mullite ceramic hollow fibre membrane (Hy-MHFM) for seawater desalination via direct contact membrane distillation (DCMD). J. Eur. Ceram. Soc. 2021, 41, 6578–6585. [Google Scholar] [CrossRef]
- Saffarini, R.B.; Summers, E.K.; Arafat, H.A.; Lienhard, J.H. Technical evaluation of stand-alone solar powered membrane distillation systems. Desalination 2012, 286, 332–341. [Google Scholar] [CrossRef]
- El Amali, A.; Bouguecha, S.; Maalej, M. Experimental study of air gap and direct contact membrane distillation configurations: Application to geothermal and seawater desalination. Desalination 2004, 168, 357. [Google Scholar] [CrossRef]
- Lokare, O.; Tavakkoli, S.; Wadekar, S.; Khanna, V.; Vidic, R.D. Fouling in direct contact membrane distillation of produced water from unconventional gas extraction. J. Membr. Sci. 2017, 524, 493–501. [Google Scholar] [CrossRef] [Green Version]
- Pounraj, P.; Winston, D.P.; Kabeel, A.; Kumar, B.P.; Manokar, A.M.; Sathyamurthy, R.; Christabel, S.C. Experimental investigation on Peltier based hybrid PV/T active solar still for enhancing the overall performance. Energy Convers. Manag. 2018, 168, 371–381. [Google Scholar] [CrossRef]
- Kumar, B.P.; Winston, D.P.; Pounraj, P.; Manokar, A.M.; Sathyamurthy, R.; Kabeel, A. Experimental investigation on hybrid PV/T active solar still with effective heating and cover cooling method. Desalination 2018, 435, 140–151. [Google Scholar] [CrossRef]
- Chandrashekara, M.; Yadav, A. Water desalination system using solar heat: A review. Renew. Sustain. Energy Rev. 2017, 67, 1308–1330. [Google Scholar] [CrossRef]
- Walton, J.; Lu, H.; Turner, C.; Solis, S.; Hein, H. Solar and Waste Heat Desalination by Membrane Distillation, Desalination and Water Purification Research and Development Program Report. Available online: https://www.usbr.gov/research/dwpr/reportpdfs/report081.pdf (accessed on 28 April 2022).
- Hogan, P.A.; Sudjito; Fane, A.G.; Morrison, G.L. Desalination by solar heated membrane distillation. Desalination 1991, 81, 81–90. [Google Scholar] [CrossRef]
- Yang, X.; Wang, R.; Shi, L.; Fane, A.G.; Debowski, M. Performance improvement of PVDF hollow fiber-based membrane distillation process. J. Membr. Sci. 2011, 369, 437–447. [Google Scholar] [CrossRef] [Green Version]
- Gao, L.; Zhang, J.; Gray, S.; Li, J.-D. Experimental study of hollow fiber permeate gap membrane distillation and its performance comparison with DCMD and SGMD. Sep. Purif. Technol. 2017, 188, 11–23. [Google Scholar] [CrossRef]
- Srisurichan, S.; Jiraratananon, R.; Fane, A. Mass transfer mechanisms and transport resistances in direct contact membrane distillation process. J. Membr. Sci. 2006, 277, 186–194. [Google Scholar] [CrossRef]
- Fan, H.; Peng, Y. Application of PVDF membranes in desalination and comparison of the VMD and DCMD processes. Chem. Eng. Sci. 2012, 79, 94–102. [Google Scholar] [CrossRef]
- Phattaranawik, J.; Jiraratananon, R.; Fane, A.G. Heat transport and membrane distillation coefficients in direct contact membrane distillation. J. Membr. Sci. 2003, 212, 177–193. [Google Scholar] [CrossRef]
- Hou, D.; Wang, J.; Zhao, C.; Wang, B.; Luan, Z.; Sun, X. Fluoride removal from brackish groundwater by direct contact membrane distillation. J. Environ. Sci. 2010, 22, 1860–1867. [Google Scholar] [CrossRef]
- Mengual, J.; Khayet, M.; Godino, M. Heat and mass transfer in vacuum membrane distillation. Int. J. Heat Mass Transf. 2004, 47, 865–875. [Google Scholar] [CrossRef]
- Alsaery, S. Development of Highly Porous Flat Sheet Polyvinylidene Fluoride (PVDF) Membranes for Membrane Distillation. Master’s Thesis, King Abdullah University of Sciences and Technology, Thuwal, Saudi Arabia, 2017. [Google Scholar]
- Alkhudhiri, A.; Darwish, N.; Hilal, N. Membrane distillation: A comprehensive review. Desalination 2012, 287, 2–18. [Google Scholar] [CrossRef]
- Shirazi, M.M.A.; Kargari, A.; Tabatabaei, M. Evaluation of commercial PTFE membranes in desalination by direct contact membrane distillation. Chem. Eng. Process. Process Intensif. 2014, 76, 16–25. [Google Scholar] [CrossRef]
- Gryta, M.; Tomaszewska, M. Heat transport in the membrane distillation process. J. Membr. Sci. 1998, 144, 211–222. [Google Scholar] [CrossRef]
- Shafieian, A.; Khiadani, M.; Nosrati, A. Performance analysis of a thermal-driven tubular direct contact membrane distillation system. Appl. Therm. Eng. 2019, 159, 113887. [Google Scholar] [CrossRef]
- Shafieian, A.; Osman, J.J.; Khiadani, M.; Nosrati, A. Enhancing heat pipe solar water heating systems performance using a novel variable mass flow rate technique and different solar working fluids. Sol. Energy 2019, 186, 191–203. [Google Scholar] [CrossRef]
- Soomro, M.I.; Kim, W.-S.; Kim, Y.-D. Performance and cost comparison of different concentrated solar power plants integrated with direct-contact membrane distillation system. Energy Convers. Manag. 2020, 221, 113193. [Google Scholar] [CrossRef]


| Membrane | Porosity (%) | Thickness (µm) | Flux (kg/m2h) | Reference |
|---|---|---|---|---|
| PTFE + PP | 75 | 180 | 28 | [40] |
| PTFE + HDPE | 70 | 175 | 38 | [40] |
| PP | 70 | - | 29.17 | [41] |
| PVDF | 75 | 125 | 36.27 | [33] |
| PVDF + Teflon | 70 | 250 | 45.18 | (Present study) |
| Parameter | Instruments | Range | Accuracy | Total Uncertainty |
|---|---|---|---|---|
| Temperature | RTD | 0–100 °C | ±0.2 °C | ±1.7% |
| Flow rate | Rotometer | 0–10 LPM | ±0.2 LPM | ±2% |
| Particulars | Solar-Powered MD System (Cost in INR, Rupees) |
|---|---|
| Direct Capital Cost (DCC) | |
| Membrane cost | 54,000 |
| MD equipment | 240,000 |
| Total cost of MD Module (Membrane cost + MD equipment) | 294,000 |
| Indirect capital cost (ICC, 10% of DCC) | 29,400 |
| Capital Cost (DCC + ICC) | 323,400 |
| Annual operation and maintenance cost (ACO&M) | |
| Annual maintenance cost (ACMT) (2% of AC fixed) | |
| Membrane replacement cost (ACMR) (20% of total cost of MD module) | 58,800 |
| Annual Labor cost (ACLabour) | 510.84 |
| Annual brine disposal cost (ACBD) | 63.36 |
| Annual electric cost (ACelectricity) | 3000 |
| ACO&M = ACMR + ACLabour + ACBD + ACelectricity | 62,885 |
| ACfixed = a × CC | 25,872 |
| ACtotal = ACfixed + ACO&M | 88,757 |
| Qw (m3/day) | 0.362 |
| Water production cost | 748.49/m3 |
| Distilled water cost | 15/L [26] |
| Payback period | 0.21 years |
Publisher’s Note: MDPI stays neutral with regard to jurisdictional claims in published maps and institutional affiliations. |
© 2022 by the authors. Licensee MDPI, Basel, Switzerland. This article is an open access article distributed under the terms and conditions of the Creative Commons Attribution (CC BY) license (https://creativecommons.org/licenses/by/4.0/).
Share and Cite
C. K., P.P.; Kumaresan, G.; Abraham, R.; Santosh, R.; Velraj, R. Effect of Teflon-Coated PVDF Membrane on the Performance of a Solar-Powered Direct Contact Membrane Distillation System. Sustainability 2022, 14, 6895. https://doi.org/10.3390/su14116895
C. K. PP, Kumaresan G, Abraham R, Santosh R, Velraj R. Effect of Teflon-Coated PVDF Membrane on the Performance of a Solar-Powered Direct Contact Membrane Distillation System. Sustainability. 2022; 14(11):6895. https://doi.org/10.3390/su14116895
Chicago/Turabian StyleC. K., Pon Pavithiran, Govindaraj Kumaresan, Raju Abraham, Ravichandran Santosh, and Ramalingam Velraj. 2022. "Effect of Teflon-Coated PVDF Membrane on the Performance of a Solar-Powered Direct Contact Membrane Distillation System" Sustainability 14, no. 11: 6895. https://doi.org/10.3390/su14116895
APA StyleC. K., P. P., Kumaresan, G., Abraham, R., Santosh, R., & Velraj, R. (2022). Effect of Teflon-Coated PVDF Membrane on the Performance of a Solar-Powered Direct Contact Membrane Distillation System. Sustainability, 14(11), 6895. https://doi.org/10.3390/su14116895