Article

Public Transport Affordability Evaluation for Addis Ababa City

by
Murad Mohammed
1,* and
Sanjaya Senadheera
2
1
Transportation Engineering Stream, School of Civil and Environmental Engineering, Jimma Institute of Technology, Jimma University, Jimma P.O. Box 378, Ethiopia
2
Civil, Environmental & Construction Engineering, Texas Tech University, Lubbock, TX 79409-1023, USA
*
Author to whom correspondence should be addressed.
Sustainability 2022, 14(11), 6883; https://doi.org/10.3390/su14116883
Submission received: 19 July 2021 / Revised: 29 August 2021 / Accepted: 6 September 2021 / Published: 5 June 2022
(This article belongs to the Section Sustainable Transportation)

Abstract

:
The affordability of transportation services refers to the financial burden the travelers bear in purchasing such services. Key factors that affect affordability include travel demand, supply, competitiveness, quality, and cost of transport services. Surveys indicate that transport users consider affordability an important planning objective, but conventional transport planning tends to give little consideration to it. Public transport is one of the key instruments to bring sustainable mobility to cities, and its supply and quality must be maintained at acceptable levels for it to be a desirable mode of transportation. The ever-increasing demand for mass mobility resulting from rapid population growth and extended urbanization in the City of Addis Ababa calls for the provision of good quality, affordable urban public transport services. In this research, the affordability of public transport of Addis Ababa was studied. The majority of data were acquired from the City Transport Bureau. The analysis of data produced a city-wide observed affordability index (Affo) of 14.13% with the highest and lowest values of 32.11 and 3.69% for Q5 and Q1, respectively. The difference between potential and observed affordability is 28.34%. This indicates that, to reach the same motorized trip rates as the third quintile, those households in the lowest quintile need to increase their transport expenditure by 28.34% in Addis Ababa. The results of this study show that the dual affordability metric both in terms observed and potential affordability can provide an effective basis to improve the affordability of public transport in the city by adopting measures that are customized according to regional characteristics at the sub-city level.

1. Introduction

The availability of transportation options and the capacity of residents to travel to their destinations in large metropolitan areas are typically not distributed in an equitable manner among its various social classes and geographical zones. Therefore, such cities require an enhanced transport policy that provides due consideration to equity and affordability. In the city of Addis Ababa, the capital of Ethiopia with a population of close to four million, the non-affordability of public transport is one of the main obstacles to the mobility of its residents. As a result, some citizens have no choice but to avoid public transport and walk long distances to get to their destinations.
In Addis Ababa, the majority of its residents travel by public transit, with the percentage of residents using transit and their number of monthly transit trips varying based on level of income. For the five income quantiles Q1, Q2, Q3, Q4 and Q5 in the order of decreasing income, the percentage of residents using public transit, and the number of monthly public transit trips are 67.84% & 16.98, 76.55% & 20.18, 82.87% & 20.98, 83.59% & 21.18, and 74.87% & 21.30, respectively.
This paper presents an analysis of the relationship between household income and mobility using public transportation by the residents of Addis Ababa. It is achieved by evaluating public transport affordability and its relationships to household income quintiles for the sub-cities of Addis Ababa and the city as a whole. One of the most important metrics to assess transport affordability is the household’s or individual’s actual expenditure for observed trips. However, one could argue that the number of trips that the travelers decided not to take, i.e., sacrificed trips, due to a lack of funds is also a very important parameter to evaluate affordability. This will allow the estimation of observed and potential affordability and use them in a complementary way to better understand the transportation affordability characteristics for any locality. It will also help public policy officials and planners to implement policies to maximize affordability to the traveling public.
This paper is structured in the following manner. Section 2 consists of a comprehensive review of published work related to the affordability of public transportation services and equity considerations. The focus of Section 3 is on research methodology that includes techniques to measure public transport affordability and the data requirements. Section 4 covers the important topics of data collection and analysis plan, the relevant characteristics of the city of Addis Ababa and its transport system. The results from the data analysis, along with a discussion of the findings, are presented in Section 5. Finally, Section 6 presents the conclusions made from this research with regard to the provision of affordable and equitable public transit services to the city residents.

2. Literature Review

In the developing world, the rapid growth in motorization combined with the lack of infrastructure and financial resources cause the supply of public transport to lag behind the demand. This contributes to declining serviceability, thus making it an important issue that needs to be addressed to maintain a sustainable public transport system [1,2].
The mobility of people, goods, and services is one of the basic needs of any society, and it has a strong correlation with the economic vitality of a country. In particular, transportation should be discussed within the broader context of sustainability in its many forms including the environment, society and the economy.
Sustainable mobility is particularly relevant for urban areas where close to 50% of the world’s 6.9 billion people live [3]. Effective urban transportation systems can contribute to poverty reduction directly, through its positive impacts on the daily needs of the urban populace, and indirectly, through improved economic activity [4]. Road-based public transport is one of the nine criterial considered to evaluate sustainable urban mobility in emerging cities [5].
Public transport is one of the most vital elements and policy instruments utilized to promote sustainable mobility in cities. Therefore, it is important to build, maintain and also improve that infrastructure to preserve the trust and maintain loyalty of existing users and to attract new ones. For instance, making public transport affordable, improving its operational efficiency, accessibility, availability, and terminal facilities, and also harmonizing fares and schedules are among the possible ways to increase the attractiveness of public transport to travelers [6]. However, in the developing world facing ever-increasing demand for mobility at times of limited resource availability, this is a daunting challenge. Therefore, it is vital to periodically evaluate existing public transport services to identify deficiencies so that improvements can be made to maintain a satisfactory level of service and to enhance it using innovative approaches. The ever-increasing costs of maintaining, expanding, and extending public transport services makes improvements challenging for developing countries, and therefore, re-evaluating system performance is crucial to make cost-effective decisions [7]. The ever-increasing demand for mass mobility as a result of rapid population growth and increased urbanization in the Addis Ababa metropolitan region calls for the provision of improved urban public transport services [1]. Currently, little is known about the travel demands of urban residents, particularly those at low-income levels, and the impacts of fares and mass transit services on their livelihoods [8].
Many studies related to urban transport in general, and public transport in particular, have been conducted in different regions, either concentrating on the specific attributes and performances of the system, or the general system-level evaluations. For instance, one study that focused on evaluating policy instruments utilized in different regions to achieve sustainable urban transport showed that despite the availability of many policy instruments, it can be difficult to choose tools that can be universally applied to all national and regional conditions. Research has identified that the complexity of urban transport systems call for an integrated comprehensive approach with broader local and regional contexts [3]. A study conducted by the World Bank on the affordability of public transport in developing countries presented an affordability index to help in the evaluation of development alternatives for a system [4]. However, this study included only 27 cities, and there is a need to conduct affordability studies in more cities, including Addis Ababa, to help calibrate the index developed by the World Bank.
A study conducted in Addis Ababa, Ethiopia, used GIS-based techniques combined with statistical analysis to investigate the service efficiency and route network deficiencies of a single public transport mode, i.e., the ordinary bus [7]. Idealized models for public transport systems, developed in another study, were found to be helpful to determine the primary effects of an urban transport system [9]. The Transport Research Laboratory (TRL) researched the implications of liberalizing urban public transport services and concluded that such action should not be seen as the total abolition of all forms of regulation and control. It suggested that continued use of supply-based and quality control measures to ensure vehicle and passenger safety, operator viability, and the avoidance of wasteful service duplication are vital [10].

2.1. Key Features of Public Transport Systems

Public transport services can be enhanced if due consideration is given to four factors; affordability, availability, accessibility, and acceptability [4]. Affordability in this context is the extent to which a person can afford access to public transport whenever it is needed. It can also be described as the extent to which the cost of a transport service does not put a commuter in the position of having to make other sacrifices to be able to travel. Affordability of urban transport is one of the significant issues of concern in developing countries, as the livelihood of the urban populace around the world has been negatively affected by high costs, as indicated by the number of trips that they had to sacrifice due to unaffordability [4]. The affordability index proposed by the World Bank can indicate whether the price structure of public transport could put people in the difficult situation of sacrificing needed trips.

2.2. Affordability as an Indicator of Accessibility

Falavigna and Hernandez [11] defined transport accessibility as the ease with which one can access distant geographical locations. This ease is crucial for people to take advantage of urban resources and opportunities, especially when motorized travel is necessary. According to Litman [12], transport affordability represents the ability of an individual to have access to goods and services when they are needed. In this context, it represents the trade-off between a household’s income and public transport cost. When the household does not have the money to cover the cost of required trips, the household is highly vulnerable with regard to mobility and accessibility [11]. In other words, an individual residing in the vicinity of transit routes who is unable to afford the fare is vulnerable in terms of accessibility.
In the Ethiopian context, where social inequalities are significant, lack of affordability is one of the most important obstacles for the urban poor to have decent levels of accessibility to public transportation. In their study, Falavigna and Hernandez [11] showed that in developing regions, inadequate public transportation could place financial burdens on the urban poor, who often forgo needed travel in order to allocate the limited financial resources on more essential goods and services. In this regard, public transport affordability assessment based on income and equity criteria have been proposed to focus on those individuals who decide not to take (and thus, sacrifice) some trips to make ends meet [12].
Moreover, it should also be considered whether the expenditure of these individuals on public transportation can make necessary trips to access goods and services. Hence, it is required to complement affordability measures compared to actual expenses as well as the requisite amount of money needed to afford all necessary trips to have access to goods and services.

2.3. Measuring Public Transport Affordability

Public transport (PT) affordability measures available in the literature can be generally grouped into two. The first group, known as observed affordability measures, mainly targets the actual behavior of the individuals, whereas the second group of affordability measures considers an estimated number of trips to achieve access to an individual’s basic needs [11].
Observed affordability may consider monthly household income [13] or monthly total individual/household expenditure [14]. This measure has been used in many research efforts. Armstrong et al. proposed affordability to be a function of monthly expenditure on public transport. They used this measure to include affordability of public transportation as a performance indicator and suggested a benchmark index of 10% [15]. On his work on transportation costs and economic opportunities among the poor, Blumenberg used an affordability index that is calculated from monthly expenditures on transport and monthly household expenditure where he tried to understand the impact of transportation expenditure among low-income households and concluded that low and high income households spend 17% and 21% of total spending on transportation respectively [14].
To better reflect the real cost of a household’s location choices for metropolitan areas CNT conducted similar studies on affordability. Monthly housing costs, monthly household income and monthly expenditure on transport were the major parameters considered to calculate overall affordability index. The findings suggest that for the suburban households, the index value is 57.07% of monthly income while for households in central district the index value was 44.7% [16].
To develop a measure of public transport affordability that allows comparison of different cities and countries, Carruthers et al. and Isalou et al. conducted a study based on a measure of public transport fare a monthly fixed basket of 60 trips. They proposed two approaches, one using average income and the other the average income of the bottom quintile. They showed that the affordability index was unsustainable for those individuals in the bottom quintile [4,17].
In their study of transport expenditure to prove that the appropriateness of the 10% policy benchmark, Ventor and Behrens stated that applying a single affordability benchmark across all households could be misleading because poor people become captive walkers or have to forego some trips due to financial constraints [18].
Diaz Olvera et al. conducted a study in sub-Saharan Africa to understand the transport expenditure patterns of households based on monthly expenditure on transportation and household monthly income and found that the cost of public transport was a major item of expenditure in household budget [13].
As stated earlier majority of studies conducted in relation to affordability mainly focused on the observed affordability ignoring the potential trips sacrificed as a result of lack allocation of transport expenditure for the lower income communities. One study conducted by Falavigna et al. tried to address this issue by quantifying the magnitude of suppressed trips due to incapability of covering expenses and suggested that potential affordability measures better reflect the magnitude of suppressed trips over observed affordability index [11].
However, such measures have some drawbacks, since they seek a reference value and fail to consider time-related effects [19]. Instead, they suggest considering time availability as a socio-demographic criterion besides income or expenditure as transport affordability measure. In this approach, different household compositions have various resources. For instance, a family with a dual income has a relatively higher income than other groups, whereas its time availability is lower.
The other way to compute observed affordability is the housing-plus-transportation affordability measures that consider both housing costs and transportation costs as a function of household income [17]. According to this approach, the closeness or remoteness of a residence to essential activities and services, including transport, affects the extent of transport cost. In this context, residences close to activity centers have higher housing costs and lower transport expenses, and a compromise is needed between these two expenses to reach a balance point [17]. However, in the case of developing countries where a housing cost database is not available, this approach is not feasible.
Though observed availability measures get extensive coverage in the literature, their application in developing nations is under question. The reason is that sometimes the lowest income groups are unable to access motorized transport due to monetary constraints [11] or may limit their motorized trips and undertake long-distance walking due to unaffordability of motorized options [13].
To resolve this drawback, fixed-basket trip affordability measures are utilized by some authors. For instance, some consider the required public transport trips to activities as 60 trips a month [4]. In Latin American cities, ECLAC [20] considered 50 trips a month and minimum wage. Moreover, Gomide et al. and Gomez-Lobo A. [21,22] considered 44 trips a month in Brazil.
These fixed-basket trips measures are useful as a reference index to evaluate policy initiatives in before-and-after studies. However, this approach does not capture the effects household characteristics have on trip rates, and trips generated by the unemployed.

3. Research Methodology

This research uses public transport data collected for the City of Addis Ababa and its ten sub-cities. As stated in the literature review, those measures that account for the observed mobility by public transport underestimate travel-related expenses, since they fail to consider non-commuting trips of the poorer households in the bottom income quintile due to unaffordability.
To correct this deficiency, it is essential to re-evaluate income levels that provide a realistic basket of trips. For this approach, the observed affordability index should be revised based on the city’s fare structure and allocation of subsidies (discount benefits) to deserving social groups. This new approach is termed as potential affordability measures.

Observed and Potential Affordability Measures

Armstrong-Wright and Thiriez (1987) defined the observed public transport affordability using Equation (1) below:
A f f O j = w × i N j E P T i y j × 100
where A f f O j is the observed public transport affordability for household j, N j is the number of members in household j, E P T i corresponds to the daily expenditure on public transport trips as obtained from the calculation of the number of daily trips and the fare per trip, by the member i, the number of weekdays (workdays) in a month (w), and the monthly income ( y j ). In their study, Falavigna and Hernandez [11] utilized household travel survey data that reveals the level of mobility on a typical workday and considered twenty-two workdays per month (w = 22). However, in actual observed public transport affordability computation, the calculated number of trip days per month has to be considered rather than using a typical value of 22 workdays for w.
The new affordability measure, i.e., potential affordability, is primarily based on the motorized trip rates of the income group that can afford all its needed trips. The potential affordability is computed using equation (2) based on the motorized trip rate of the middle-income quintile, Q3. The core logic considered here is that the Q3 group is expected to use motorized transport when they need to, without sacrificing or substituting any trips and that Q3 trip rates are closer to a necessary mobility threshold.
This study adopts public transport trip rates since the private car or motorcycle ownership of the middle (Q3)- and lower-income (Q1 and Q2) quintiles are negligible. It is important to note that potential affordability, as defined by Equation (2), assumes that households in the lower-income quintiles will close the mobility consumption gap by using public transport, and not private modes.
The potential affordability of the quintile Qi is equivalent to the observed affordability, and corrected by the ratio between the public transport trip rate of the third quintile (rQ3) and the public transport trip rate of the quintile Qi (rQi) according to Equation (2):
A f f P Q i = A f f O Q i × r Q3 r Qi

4. Data Collection and Analysis Plan

4.1. Data Sources and Collection

The data utilized for this study were retrieved from the database of households (HH) travel survey conducted in May 2014 in the City of Addis Ababa by the Addis Ababa Road and Transport Board (AARTB), in collaboration with the Central Statistical Agency (CSA). It used a baseline household travel survey questionnaire sent to a randomly selected sample of households in the ten sub-cities of Addis Ababa. The classification (coding), database design, data entry, and the quality control of data were conducted at the data processing department of CSA.
The survey included the essential means of transportation and issues related to it encompassing all Woredas/Kebeles criteria, which refer to lower-level subdivisions of a city created for administrative purposes. It was conducted in 787 Enumeration Areas (EAs) by randomly selecting approximately 30 HHs from each EA that came out to be a total of 21,288 HHs. This resulted in a total of 77,990 survey records for all the members in the selected households.
The list containing EAs in all sub-cities and their corresponding households was obtained from CSA, and the 2007 cartographic maps of the Population and Housing Census of Addis Ababa. Sample households were selected within each EA by adopting a stratified two-stage cluster design. The Probability proportional to size (PPS) sampling technique was applied to determine the sample size within each sub-city. Table 1 provides a summary of the number of EAs and households surveyed in each sub-city.
The information collected using the survey is generally categorized as follows:
i.
Demographic- and Socio-Economic-Related:
-
Gender, Age, Occupation, Education, HH Size, and Income.
ii.
Transportation-Related:
-
Public Transport (PT) Services, Access to Activities and Services, Car Ownership and Use, Extent of Travel, and Customer Perception on the Quality of PT.
iii.
Travel and Mode Choice-Related:
-
Travel Means and Purpose and Problems Related to the Anbessa City Bus.

4.2. Description of the Study Area

The data used in this study were for the city of Addis Ababa. It is the capital and the largest city in Ethiopia and the seat of the African Union. According to the 2019 world population review, Addis Ababa has a population of around 3.385 million based on the 2007 census. The city lies at an altitude ranging from 2200 m to 2500 m above sea level. The city covers an area of 527 square kilometers resulting in an estimated population density of 5165 persons per square kilometer. For administrative purposes, the city is divided into ten sub-cities as shown in Figure 1 and Table 2 using map and significant features.

4.2.1. Public Transport System of Addis Ababa

In general, the public road transport of the city is mainly served using the three broad categories of buses, namely, the city bus (Anbessa, Sheger, and Alliance), midi-bus (Higer and Kitkit), and mini-bus (Code-3 and Code-1 Taxies), with seating capacities of 60, 35, and 12, respectively (Figure 2). According to the information obtained from AARTB, in 2018, there were a total of 771 city buses operating on 201 routes (441 Anbessa on 124 routes, 226 Sheger on 49 routes, and 104 Alliance on 28 routes), which transported on average 516,804 passengers daily, resulting in an average value of 670 passengers per bus-day. In the same year, there were 879 midi-buses (450 Higer and 429 Kitkit buses) operating on 50 routes, and 18,681 mini-buses (13,045 Code-3 and 5636 Code-1 Taxi) operating on 302 routes.
The fare structure of public transport is based primarily on trip length and it varies among various bus categories and within one bus category. For instance, previously, the fare ranged from 1.40 ETB (Ethiopian Birr) for the shortest trip up to 2.5 km to 4.9 ETB for the longest trips (12.1–15.0 km) for a code-01 mini-bus taxi. Recently, these have been revised to 1.45 ETB for the shortest and 5.0 ETB for the longest trips. Table 3 shows a summary of fare ranges for the different bus types.
In bus types other than Higer and Kitkit midi-buses, the lowest fare is 1.5 ETB, although the trip length range varies. On the other hand, the longest trip fares vary from 5 ETB to 18 ETB for trip length ranges of 12–15 km and 27–30 km, respectively. When a comparison is made on a per km fare basis, for the shortest trip, the Anbessa city bus has the cheapest fare, with 0.33 ETB per km, while the Code-03 Taxi has the maximum fare, with 1.16 ETB per km. For the longest trip, the Anbessa city bus has the cheapest fare, with 0.23 ETB per km, while the Code-03 Taxi has the maximum fare, with 0.64 ETB per km. When comparing the length of each route, the maximum distance is covered by the Anbessa City Bus, followed by the Code-3 Taxi and Higer Bus.

4.2.2. The Context of Urban Mobility

It is very important to describe some general aspects of urban mobility in the study area to contextualize the research. Table 4 and Table 5 manifest some mobility parameters, particularly monthly trip rates by income quintile and sub-city.
Table 5 clearly shows that monthly trip rates are directly related to income. As the income increases from lower to higher groups, the monthly trip rates also rise. In this case, the lowest income group (Q1) undertake fewer trips than the city’s median monthly trip rates (19.45 trip-days/month). On the other hand, in terms of sub-cities, similarities were observed in most sub-cities, except the Akaki Kality sub-city, in which people commute a relatively far lower number of trips. Here, the Akaki Kaliti, Addis Ketema, and Kolfe sub-cities show lower trip rates than the city’s median trips (20.70 trip days/month).

5. Data Analysis and Discussion

5.1. Preliminary Analysis of Affordability Data

Table 6 shows that the mean value of the city-wide observed affordability index (Affo) is around 14%. However, in terms of the percentage of income spent on public transportation, households in the lowest income quintile (Q1) spend approximately nine times that spent by households in the top quintile (Q5). The boxplot in Figure 3 illustrates the results from Table 6, showing that public transport expenditures among households in the bottom quintile (Q1) rely a lot more on public transportation for their mobility needs compared to households in the higher income quantiles. The lower quantiles also show greater variability within the income quintile.
In Table 6, we can see that the potential affordability index (Affp) values are higher than for observed affordability (Affo). It is noteworthy that in the lower quintile, this difference is 28.34%. The difference between potential and observed affordability indices means that to reach the same motorized trip rates as the third quintile, those households in the lower quintile need to increase their transport expenditure by 28.34%. It is assumed that low-income households will reach those trip rates using exclusively public transport.
These results indicate that the financial burden to get transport access is unequally distributed with pressing magnitude for lower quintiles. Assuming that motorized trip rates of the middle-income group are a reasonable benchmark, low-income households should raise transport expenditure in a significant manner, even when additional trips are made by public transport. Indeed, empirical evidence is indicative of travel demand suppression for financial reasons between low-income individuals especially for the lowest two quintiles (Q1 and Q2) in the city.
To some extent, one could argue that this index sheds light on accessibility and pricing problems in the current pricing structures for public transport. Meanwhile, 40% of the poorest individuals experience this problem.
As shown in the above successive figures (through Figure 3, Figure 4, Figure 5, Figure 6, Figure 7 and Figure 8), the affordability index varies within each income quintile group differently. As the income quintile group shifts from Q1 to Q5, the extent of affordability index variation decreases, which is because the distribution of trip and income in the lower quintiles (Q1 and Q2) is wide, while it is narrow for the upper quintiles (Q3, Q4 and Q5).
The potential affordability can also be evaluated considering the weighted average monthly income of the city. Figure 9 below shows the distribution of households according to their monthly income. This favorably skewed distribution dictates that the majority (67%) of the city’s residents earn a monthly income less than the median value. In other words, the majority of households are categorized as low-income groups. The weighted average income can be computed using Equation (3) below:
I w a v g = I 1 × f 1 + I 2 × f 2 + I 3 × f 3 + + I n × f n f 1 + f 2 + f 3 + + f n
where I w a v g is the weighted average income; I 1 , I 2 , I 3 , , I n are the income values of different income groups; and f 1 , f 2 , f 3 , , f n are the frequencies of households corresponding to each income range.
Utilizing Equation (3), and the values from Table 7, the weighted average income for the city becomes 2270 ETB. Furthermore, from the analysis of the observed affordability, the corresponding value for the weighted average income for the city is 12.33. Considering that the public transport trip rate of the weighted average income is a reasonable benchmark, another metric for potential affordability can be determined as shown in Table 7 below.
Comparing the results from Table 7 and Table 8 we can observe a reduction in the potential affordability by 1.31% and 1.07% for Q1 and Q2, respectively. This reduction is because the weighted average income is less than the median income.
Figure 9 dictates that income distribution among the city’s residents is positively skewed, which means that the majority of its residents belong to the lower income group, implying that public transport affordability is expected to be a big concern in this city.

5.2. Integrated Analysis

5.2.1. Mode Choice versus Trip Distance

This section focuses on the distribution of HHs in Addis Ababa City. When we take a closer look at Figure 10 and Figure 11, the walking and short-distance traveling (0–5 km) are the predominant trip attributes. This implies that in the city of Addis Ababa, most people make short-distance trips on foot. Surprisingly, it seems that there is a strong relationship between the number of travelers, trip distance, and mode preference. As the trip distance increases, the mode preference shifts from walking to taking a taxi to taking the bus and then to using their private car, while simultaneously, the number of commuters by PT decreases.

5.2.2. Income versus Trip Distance

When a comparison is made for Figure 11 and Figure 12, some interesting trends can be observed. There appear to be direct relationships between the number of travelers, level of income, and trip distance. The majority of individuals in the bottom two income quintiles (Q1 and Q2) mainly commute short trips. As the trip distance increases, the number of travelers decreases and becomes only potentially affordable for higher-income groups, probably due to the high transport expenditure for long-distance trips, which could only be afforded by those in higher-income quintiles.

5.2.3. Trip Purpose vs. Transport Expense

A comparison of Figure 13 and Figure 14 shows that in most cases, a taxi is the preferred mode, irrespective of the trip purpose and the daily transport expenses. Moreover, most people make a work trip with daily transport expenses of 4–6 ETB. The lowest number of people prefers to travel for entertainment as well as for long-distance trip greater than 20 km.
On the other hand, except for the lowest PT expense range, the number of travelers decrease as the daily cost of PT increases. Similarly, the number of travelers decreases as the purpose of the trip shifts from work to social to market to school and entertainment. Thus, it can be generalized that in most cases, as the daily PT expense increases, the number of travelers reduces, and their trip purpose shifts from work to entertainment accordingly.

6. Conclusions

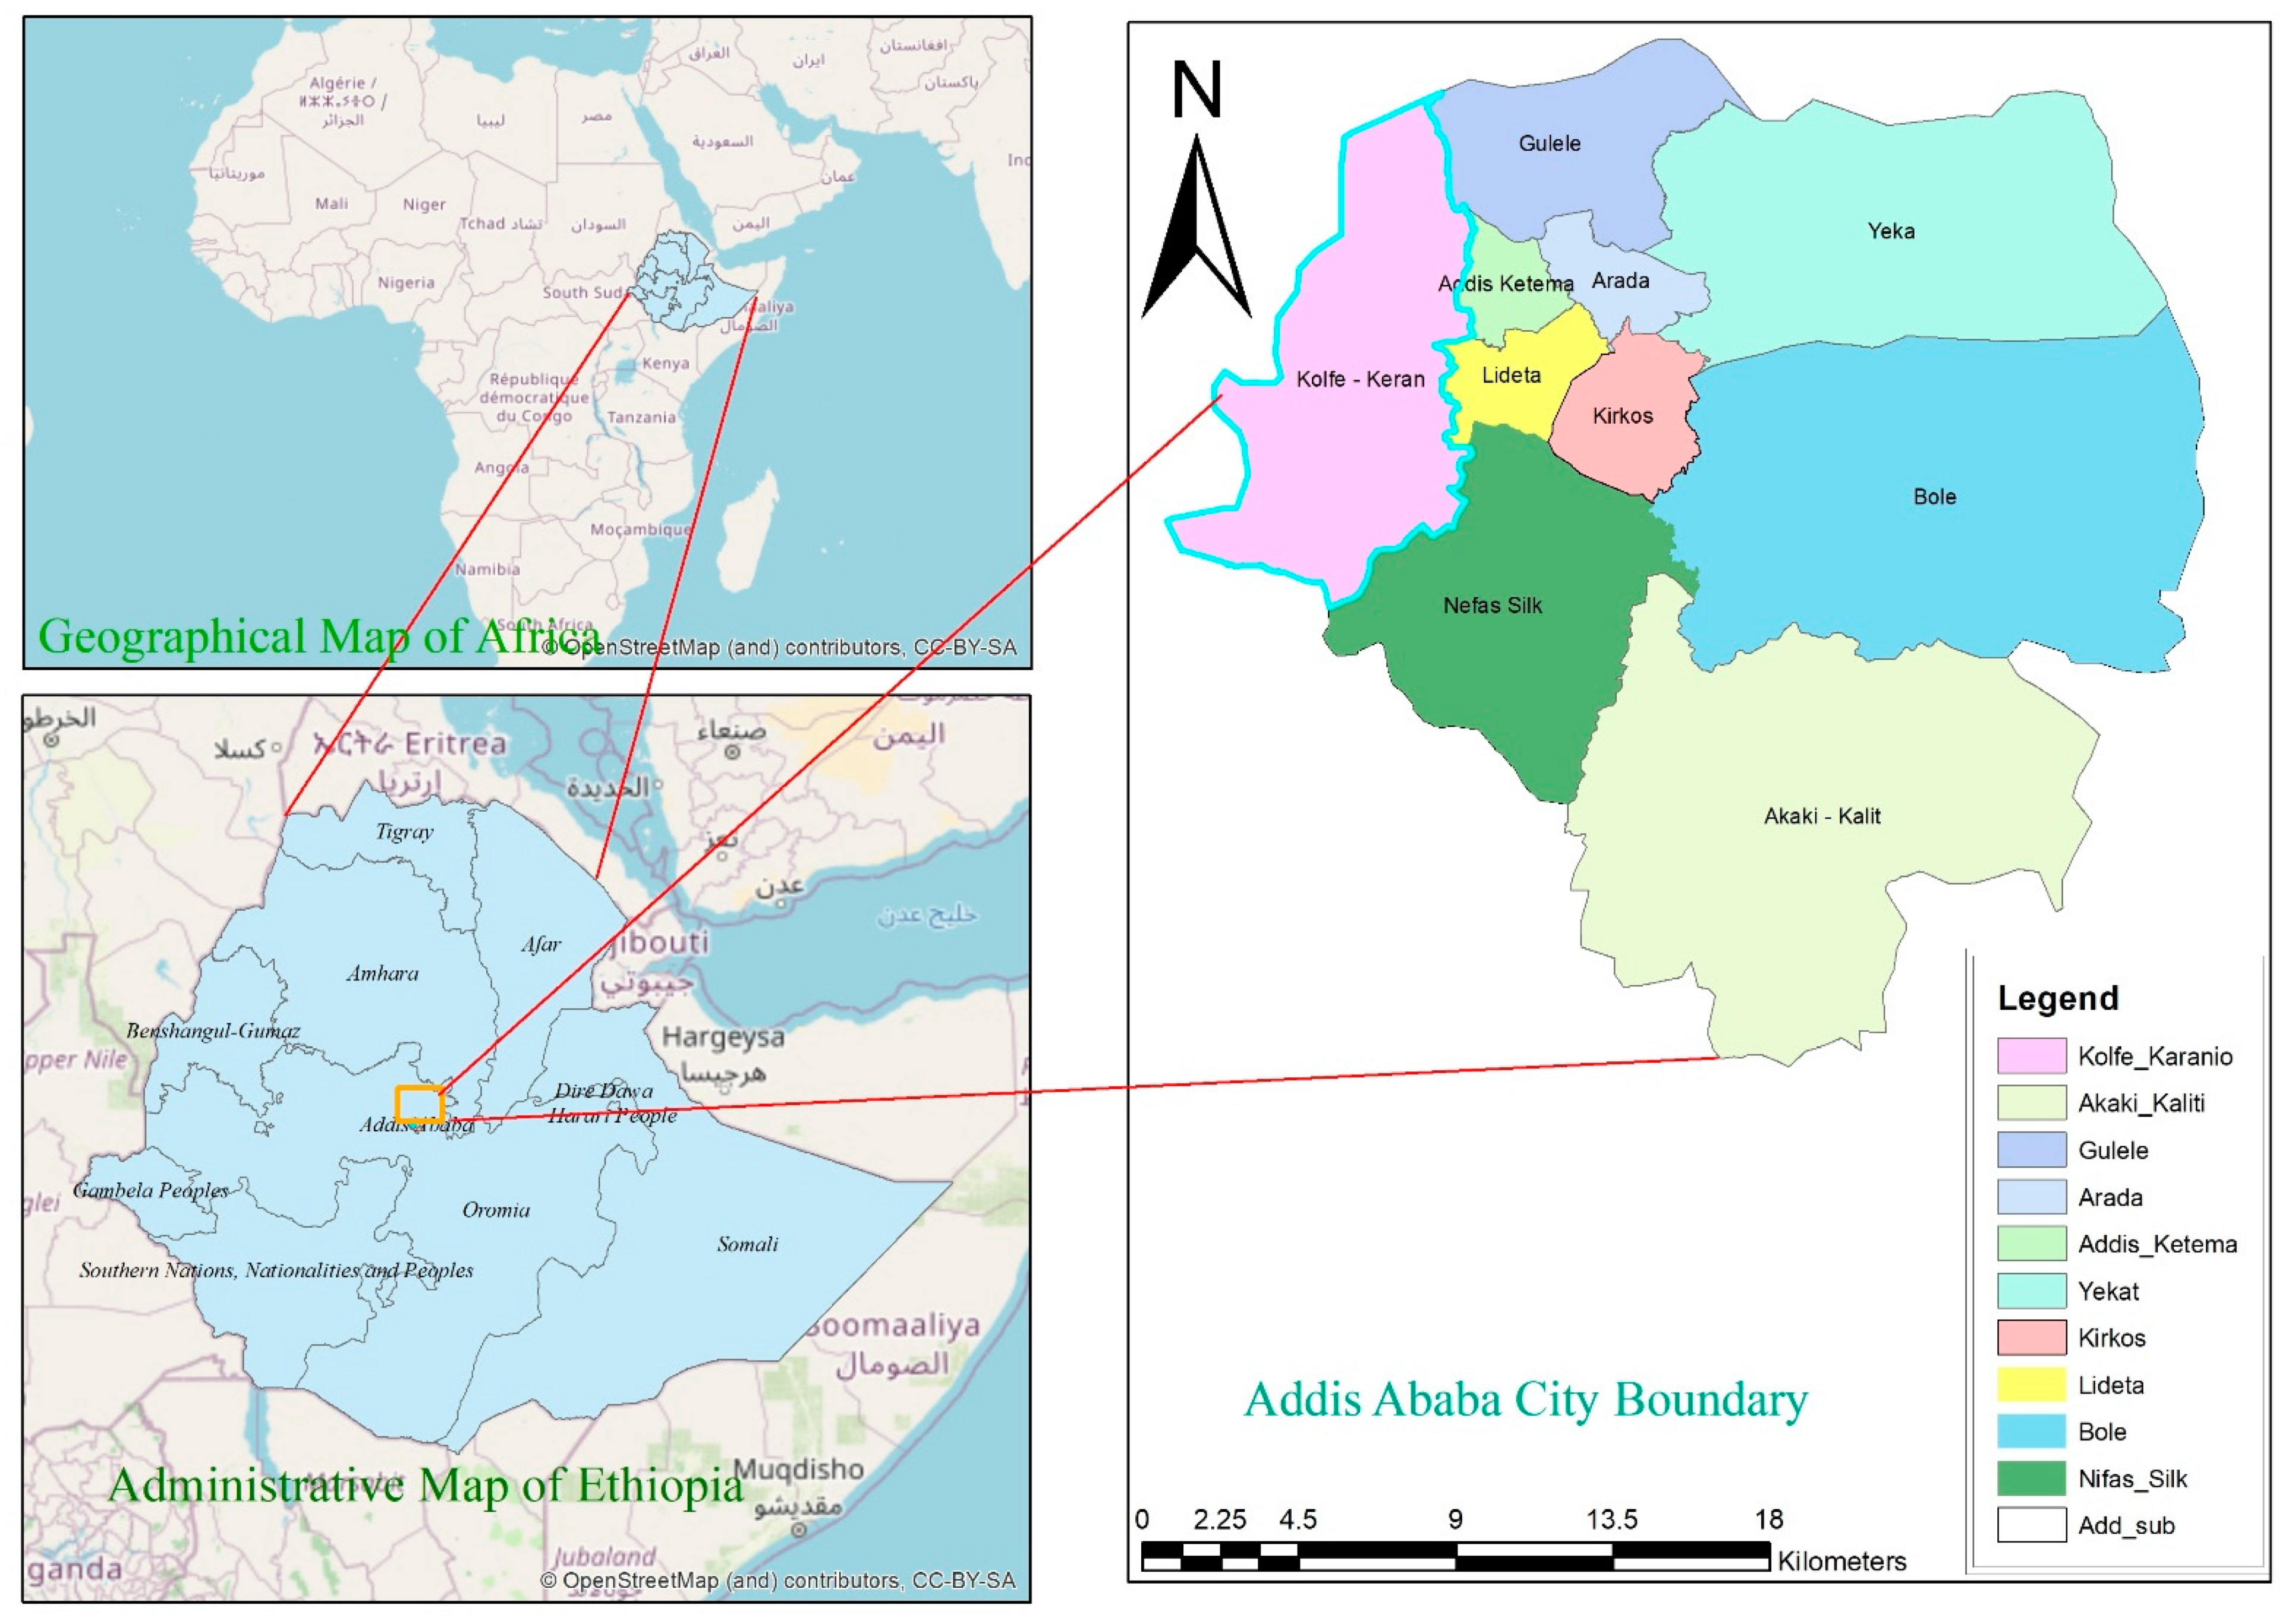
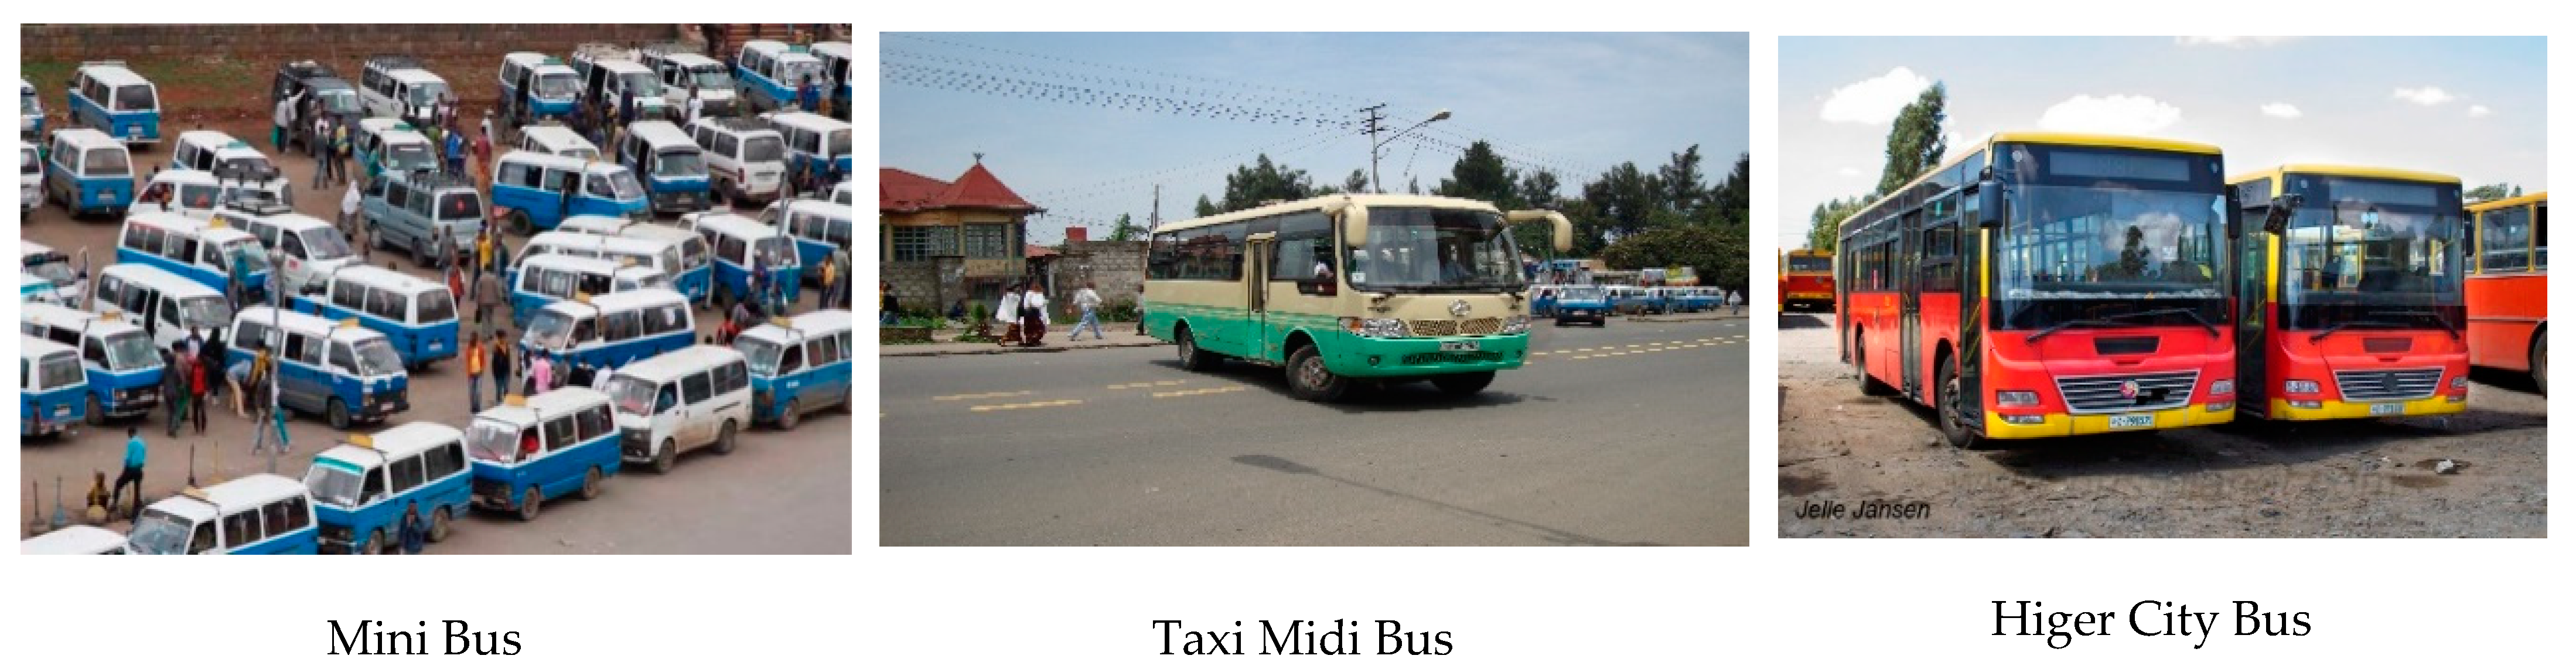
This paper addresses public transport affordability in Addis Ababa on city-wide and sub-city levels. The sub-cities are very similar in terms of overall modal share and socio-demographic and spatial characteristics; furthermore, their mobility patterns are similar to cities in other developing countries. Public transport is the most important motorized transport mode for the urban poor.
As a result, if they cannot access public transport, they must walk or be immobile. Middle-income and affluent groups, however, could complement their trips by using their car or taking a taxi. The implication is quite straightforward: in developing countries, public transport affordability is a crucial component to achieve equity.

6.1. Main Findings

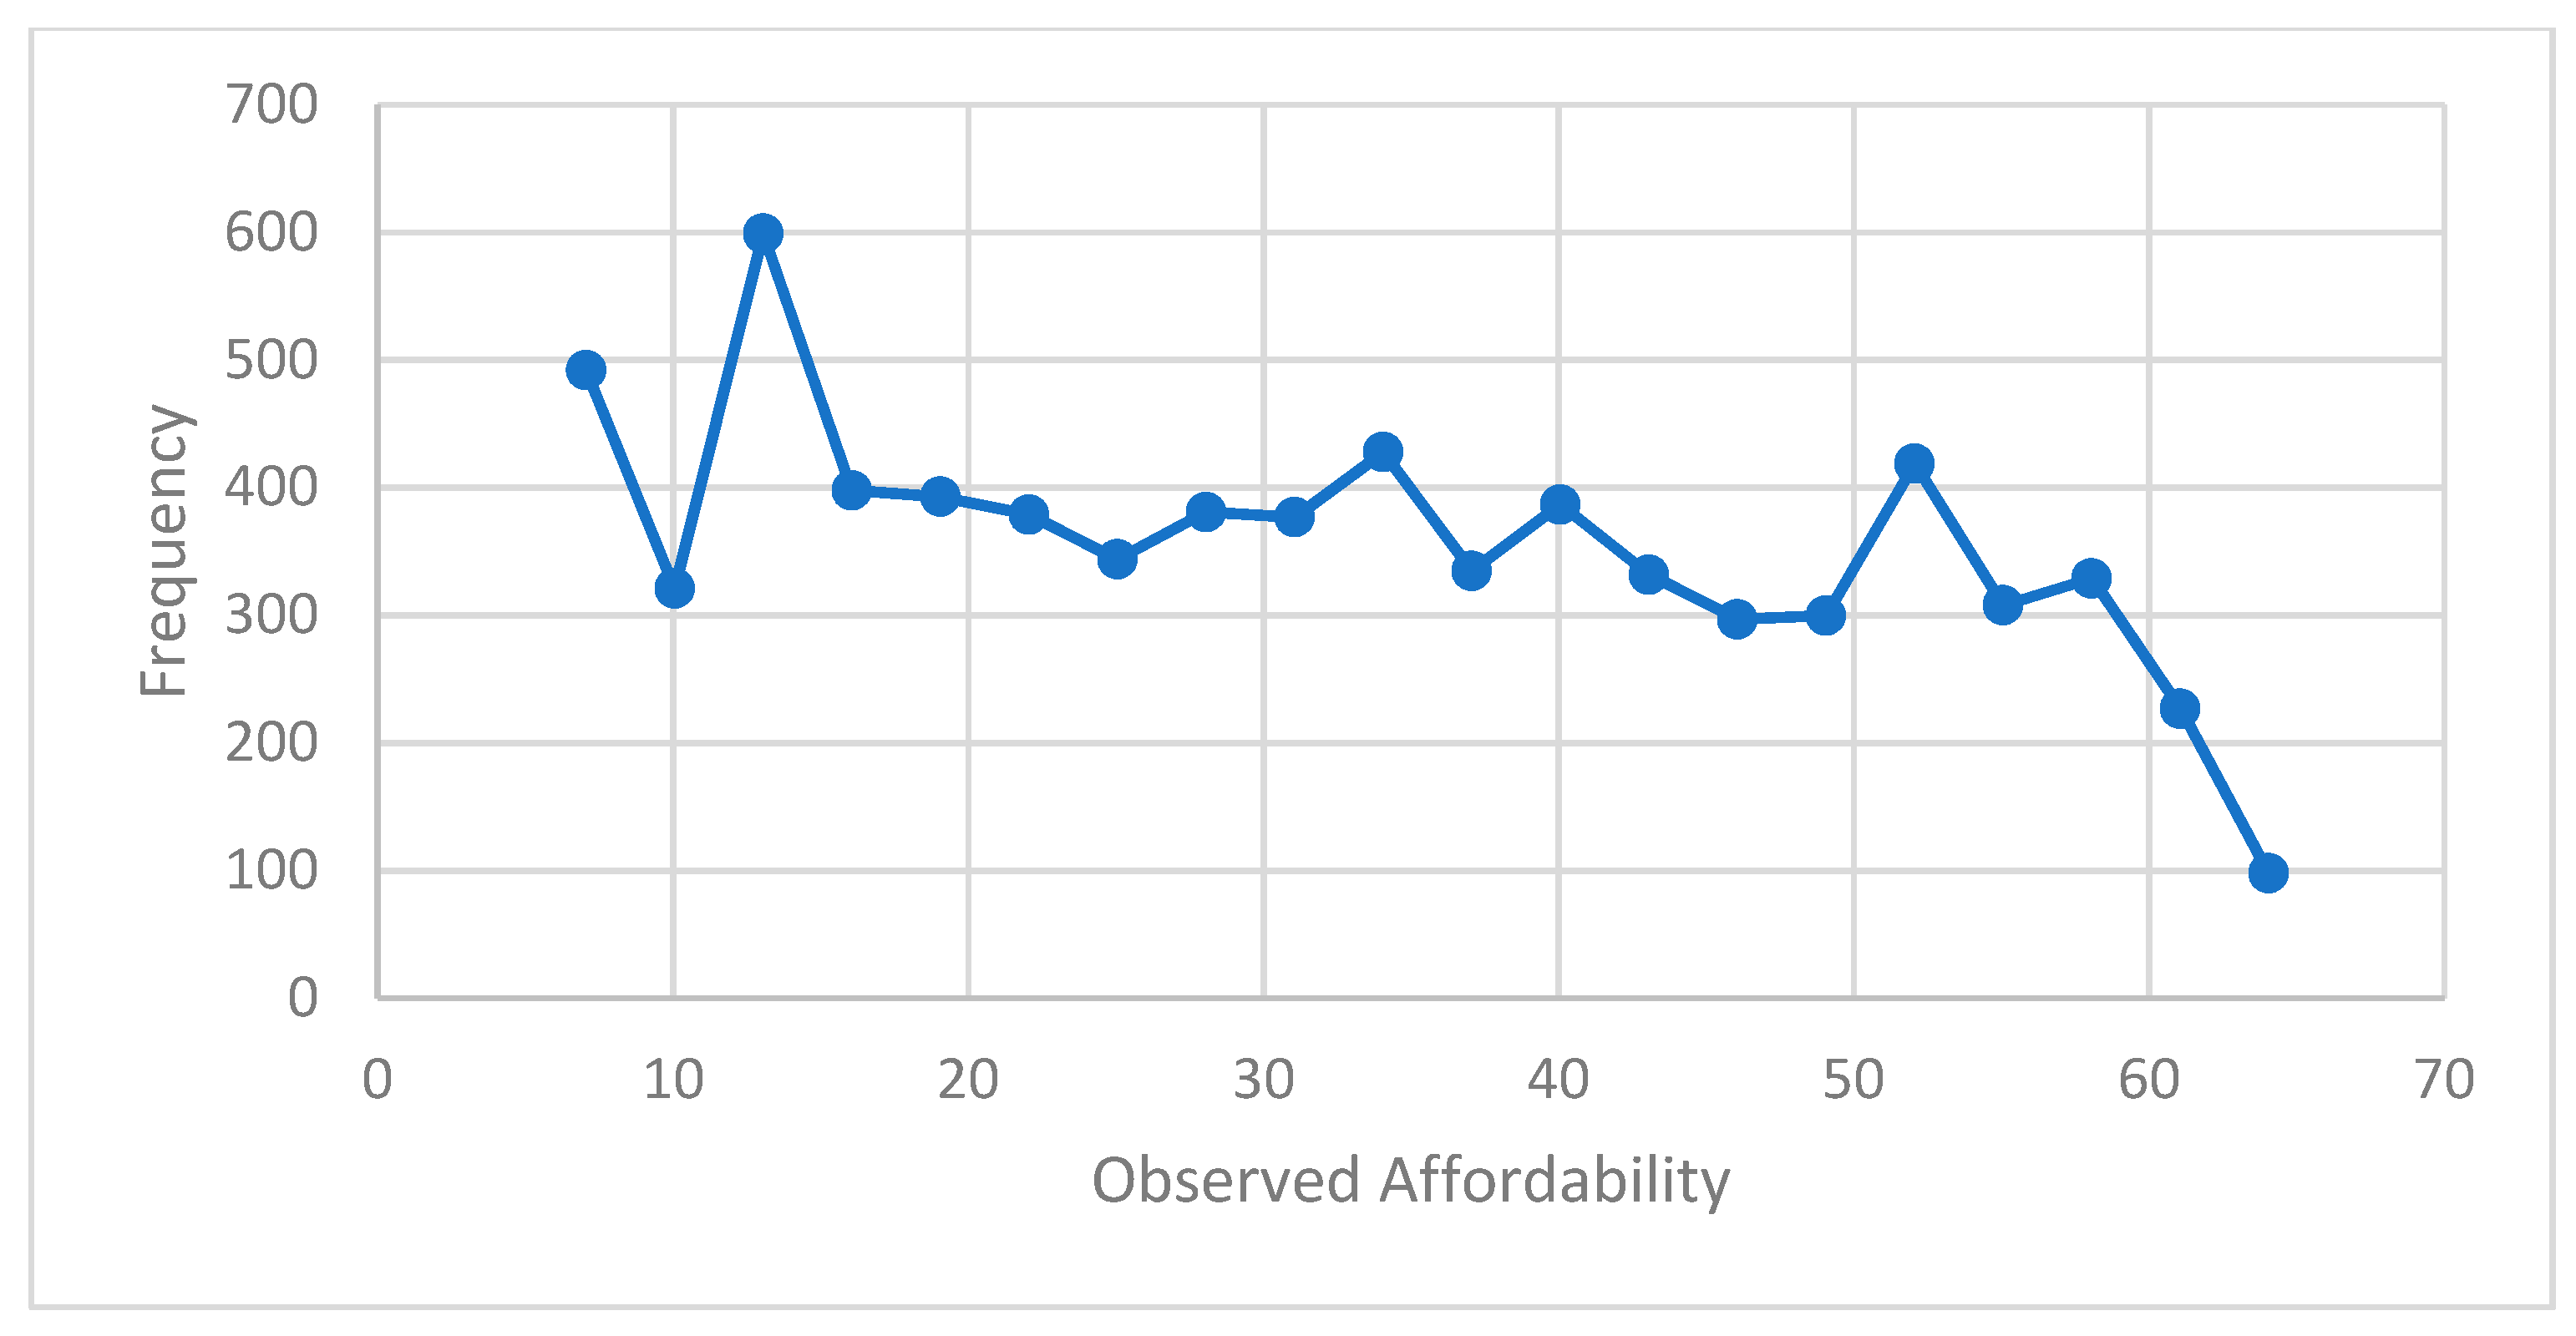
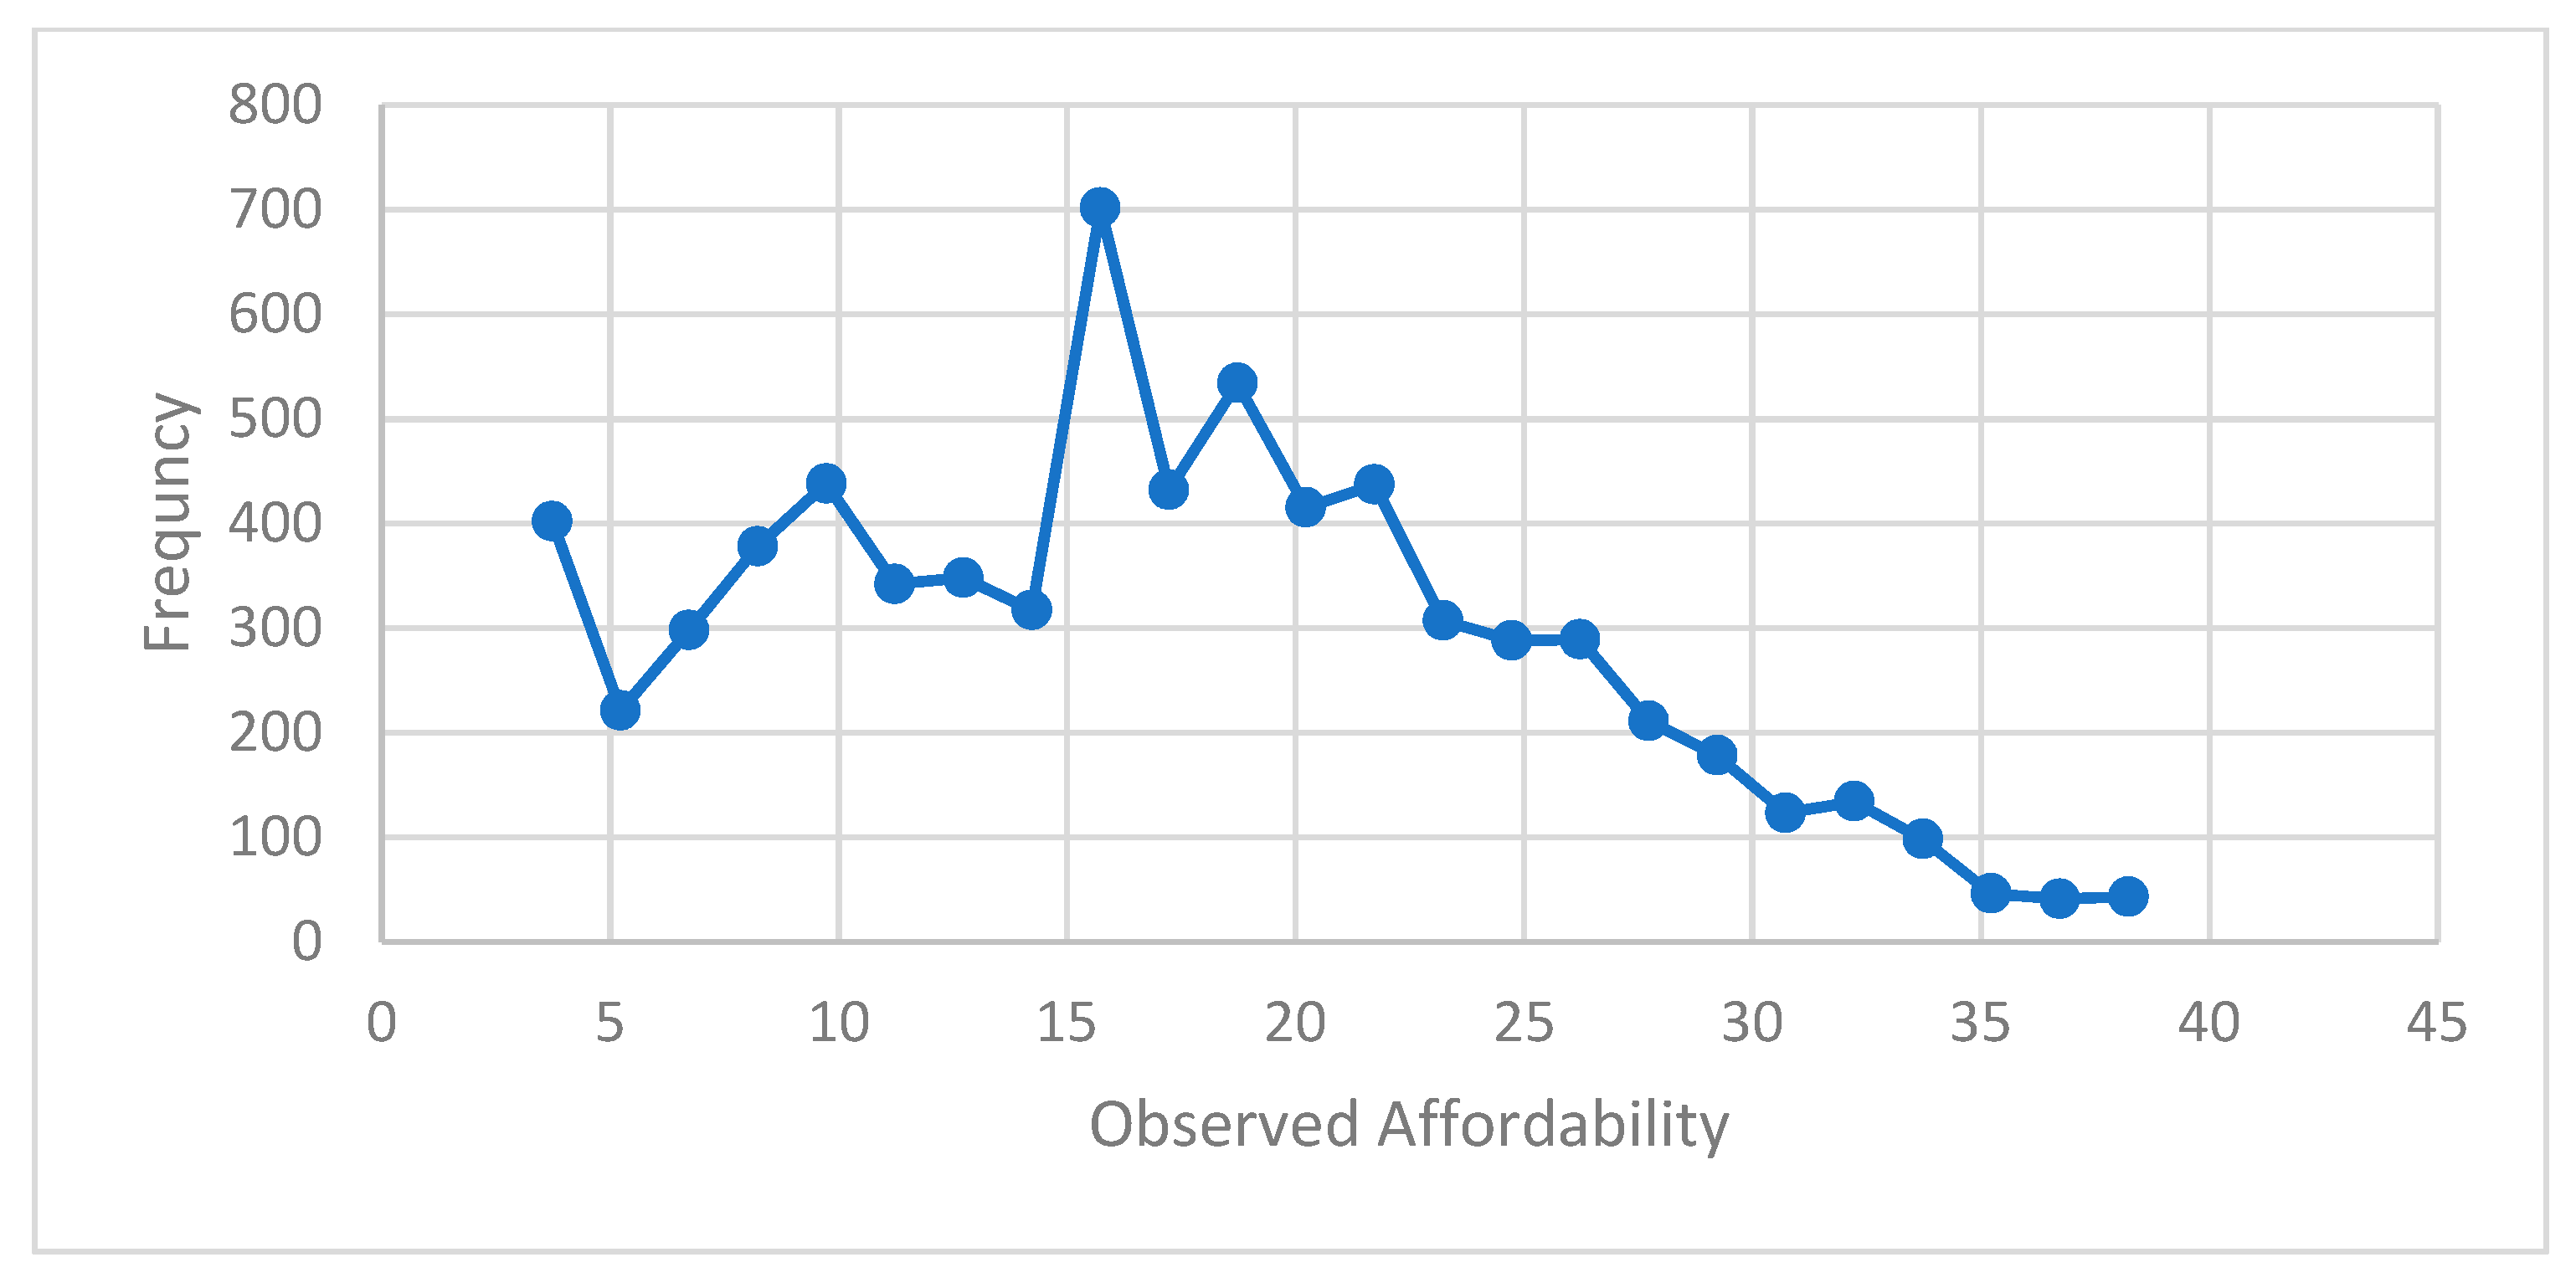
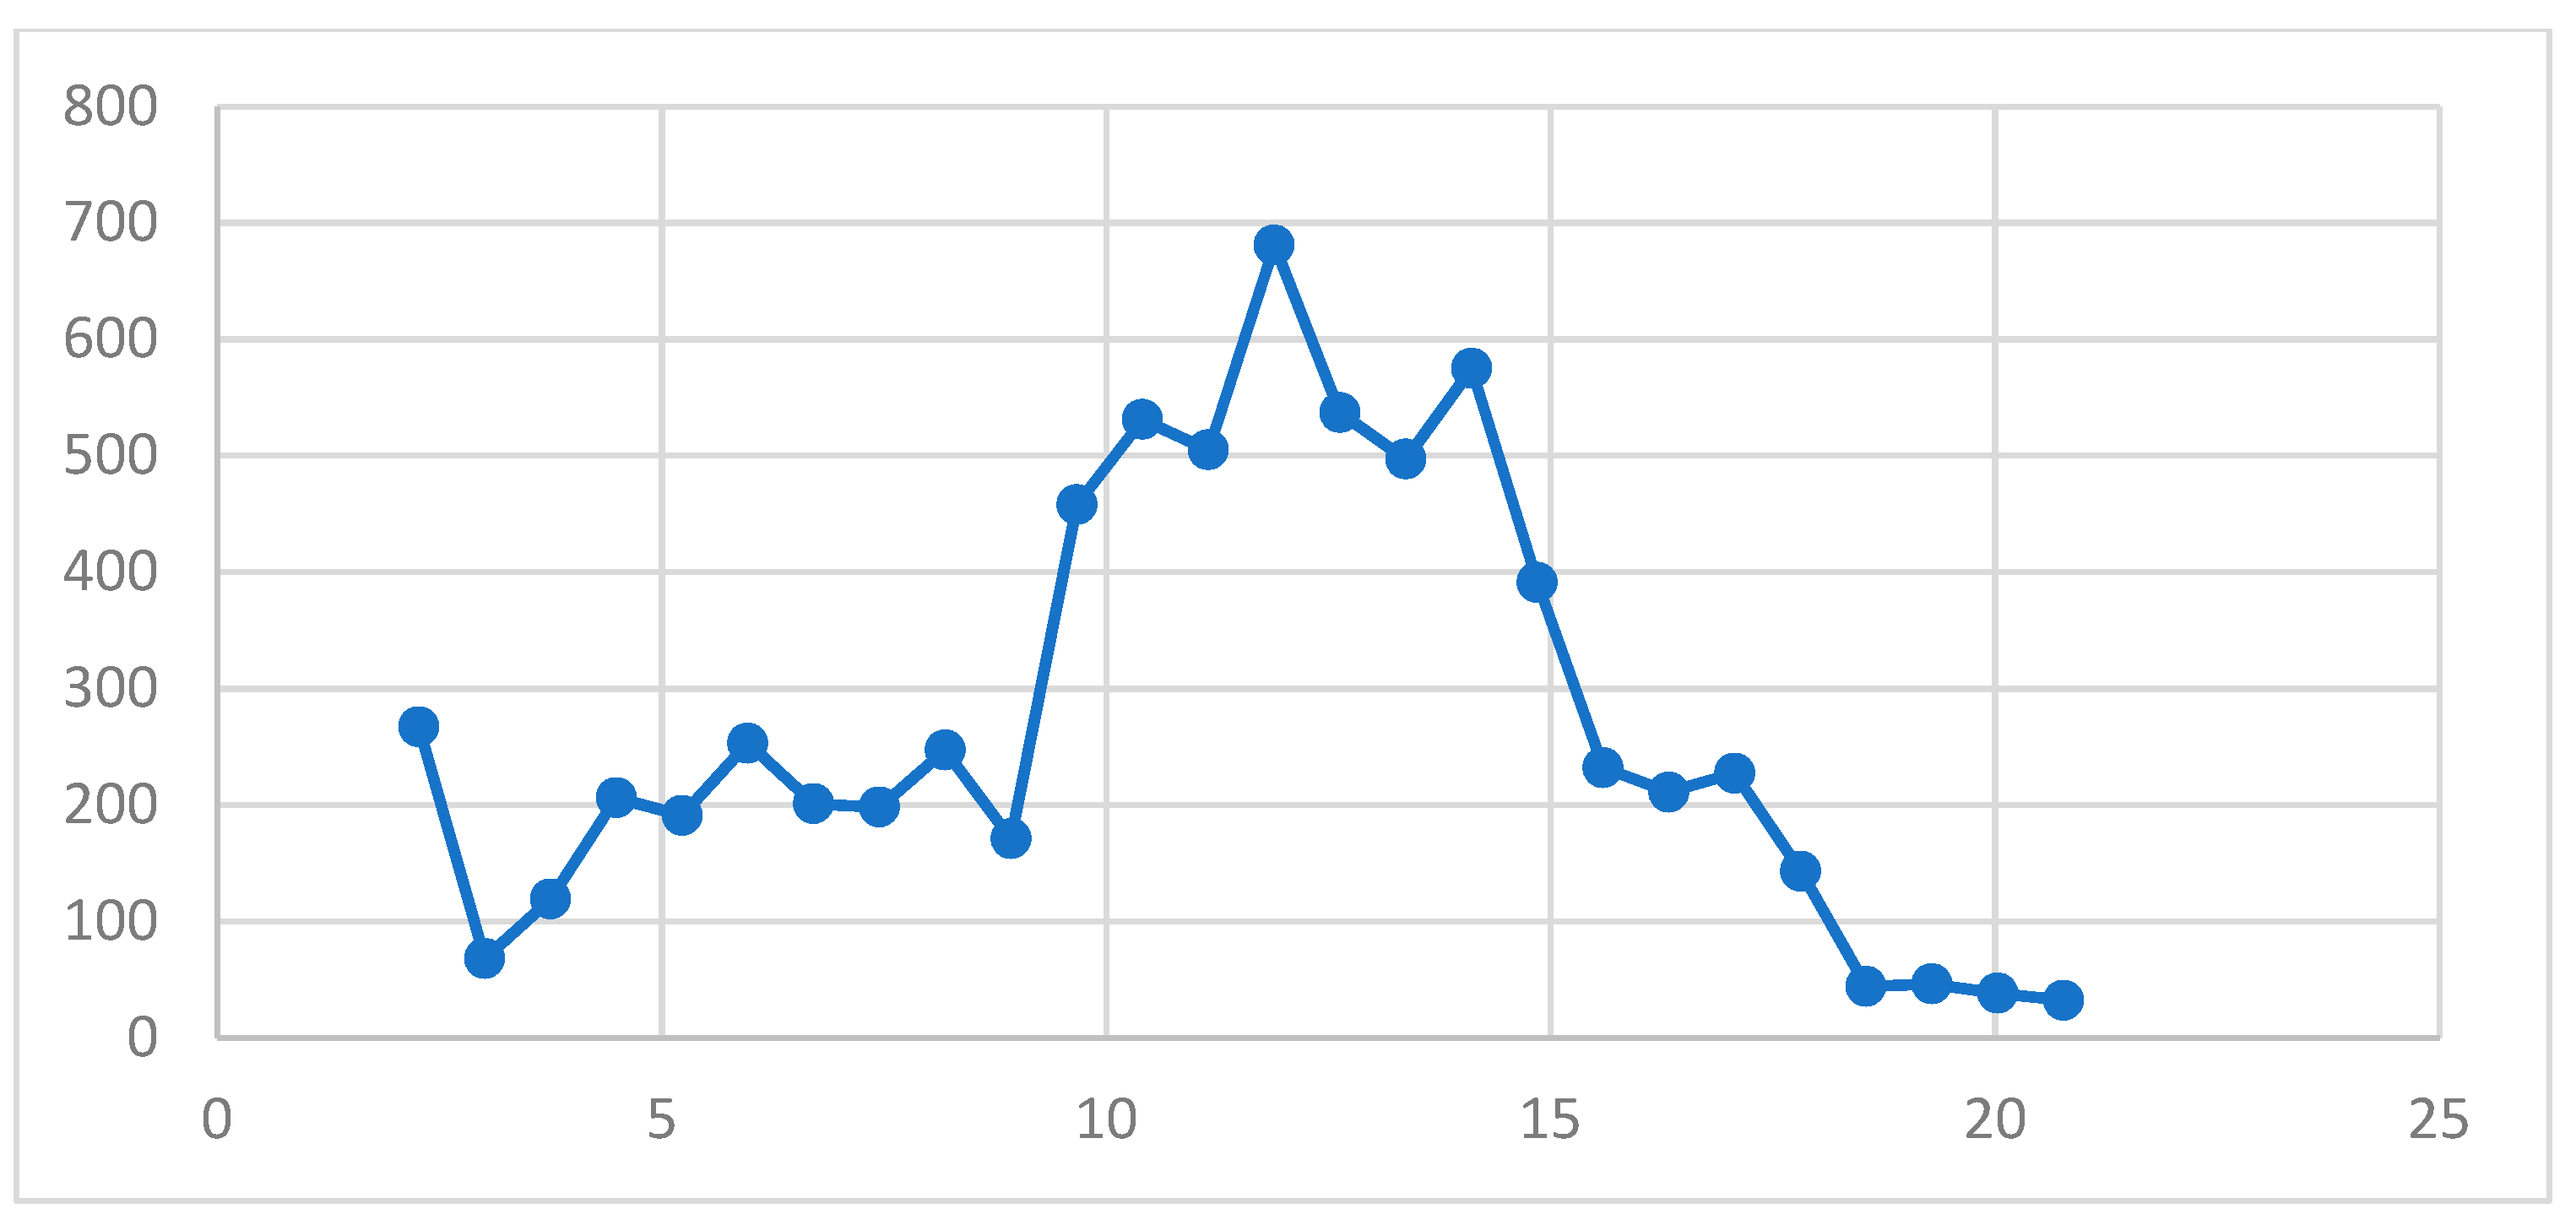
In the case of observed affordability of public transport (Affo), the actual trips of urban low-income families are not considered holistically; instead, the metric fails to consider those reduced trips. In filling this gap, the public transport potential affordability approach is an improvement to over the observed affordability approach. The potential affordability (Affp) metric assumes the middle-income class (Q3) is capable of undertaking all desired trips without compromising any of them. That means that potential affordability values are higher than the observed affordability values for lower-income classes.
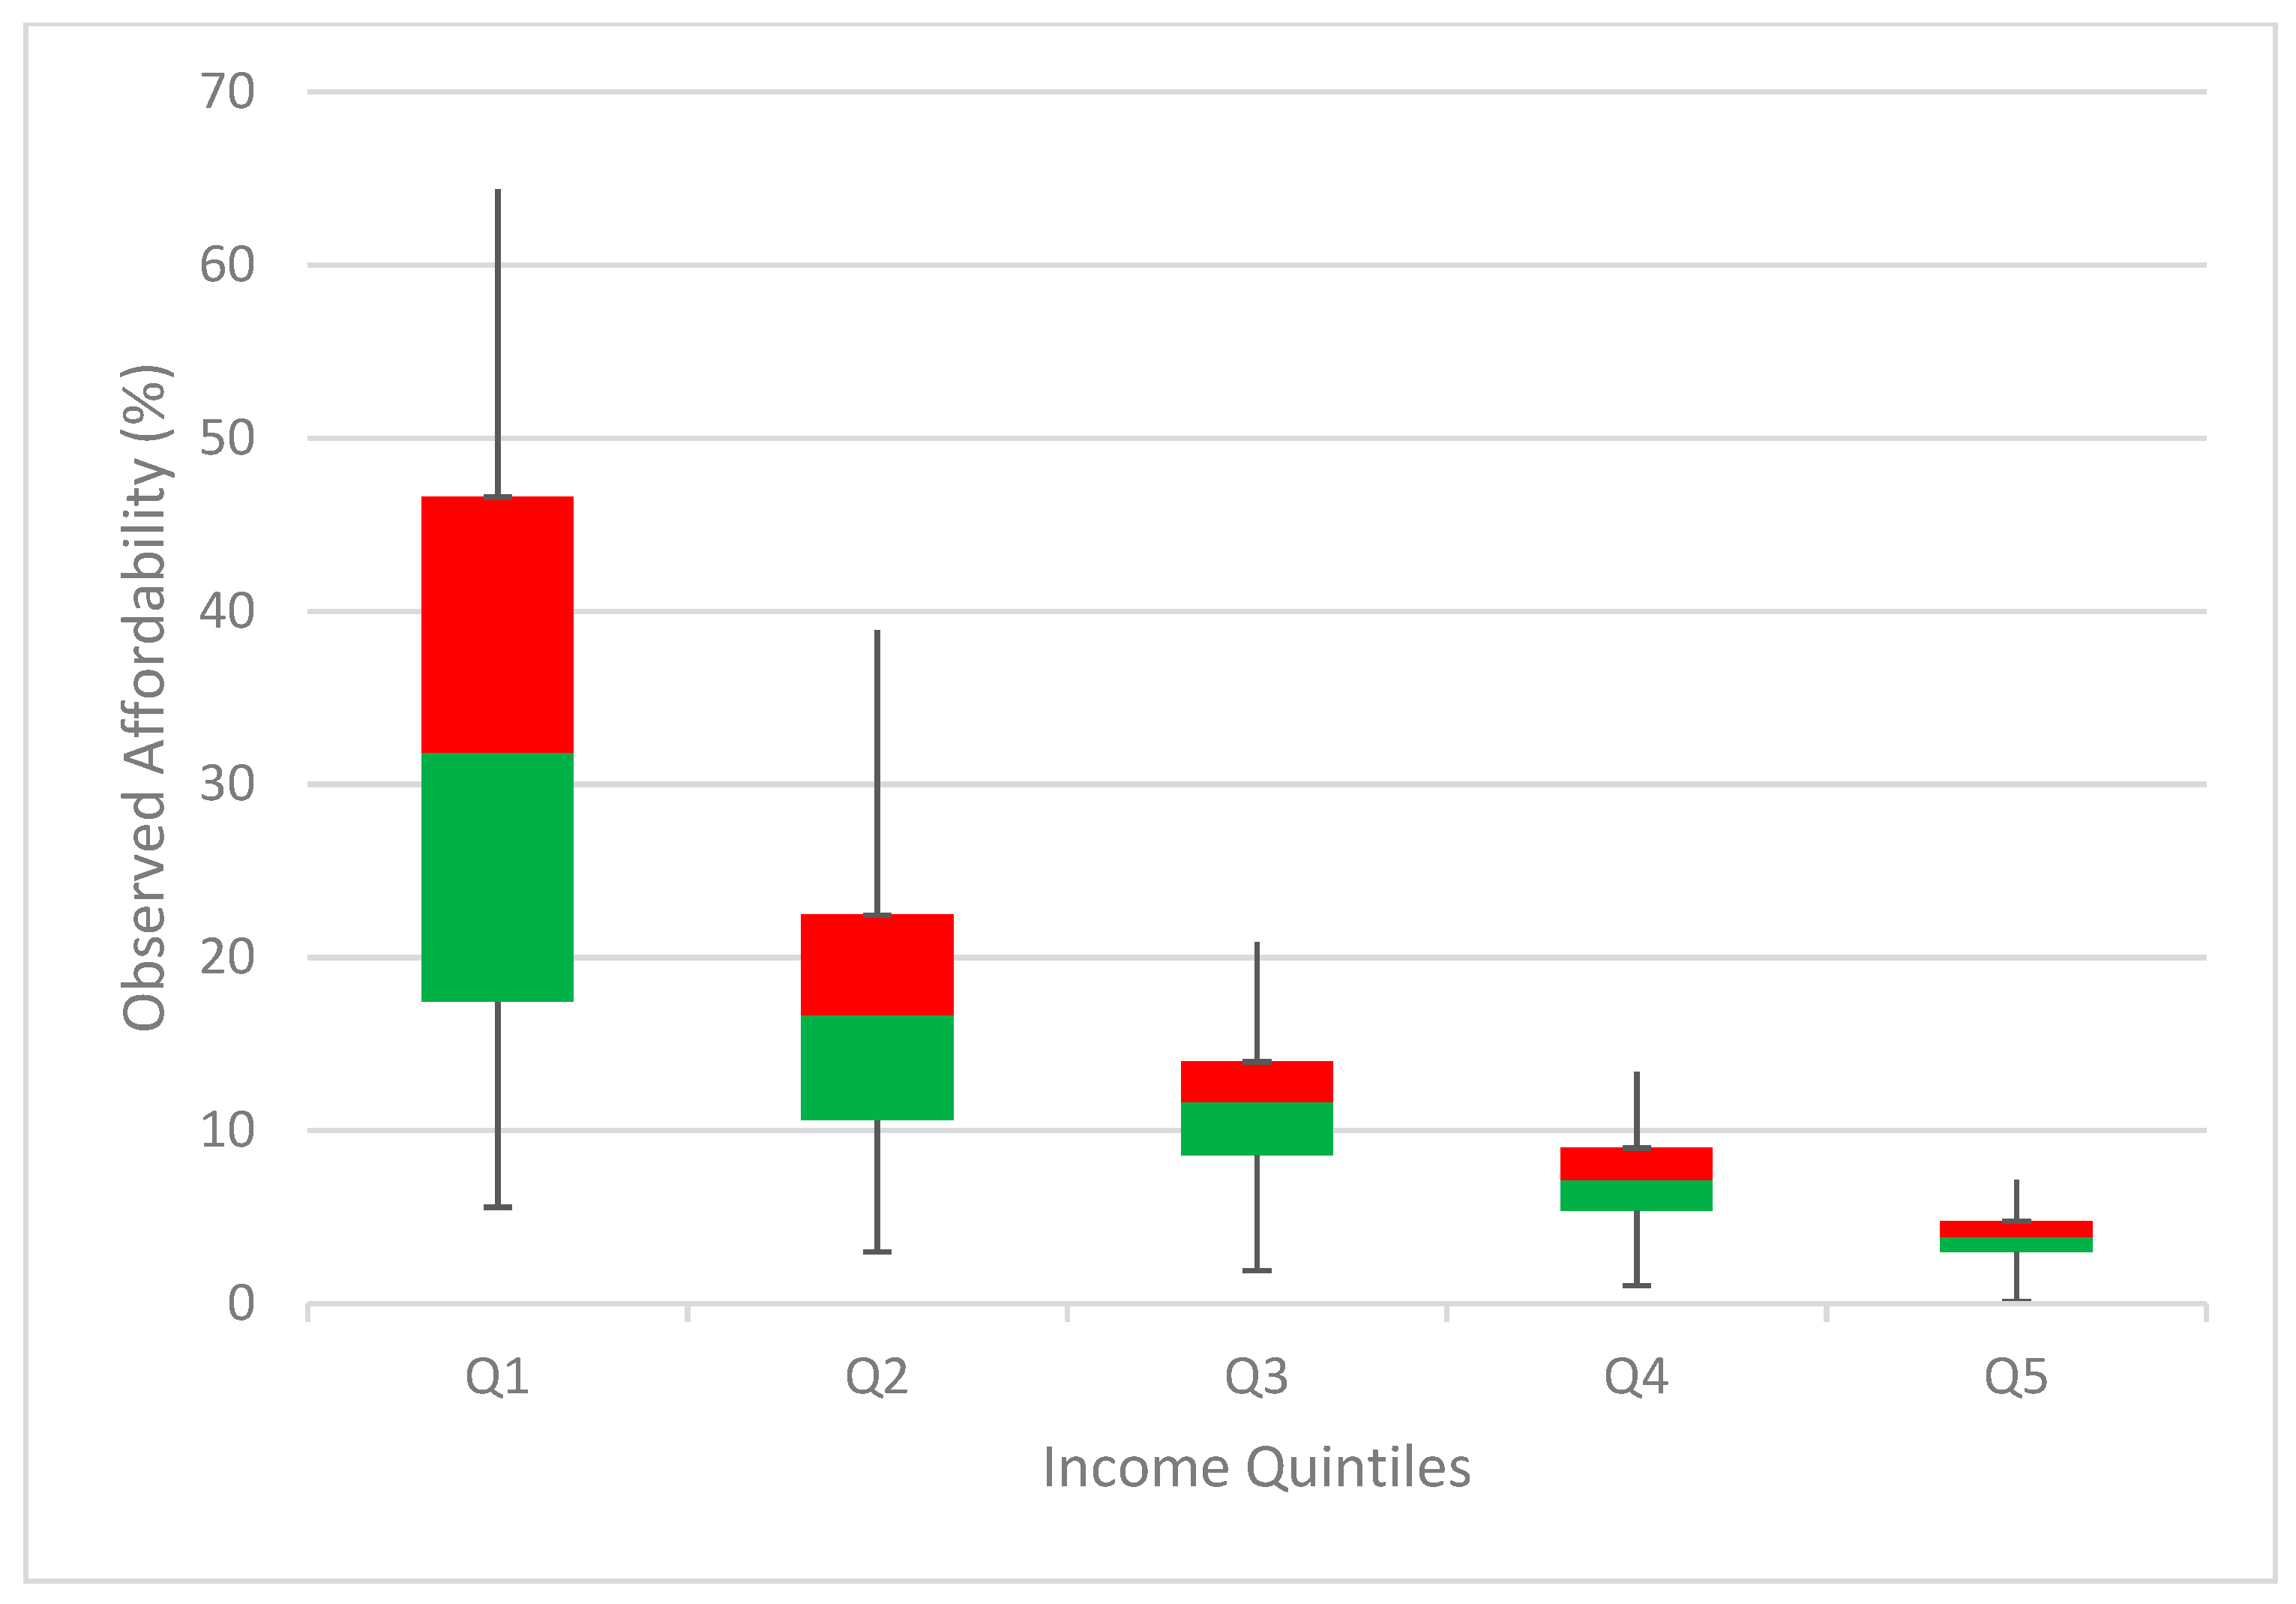
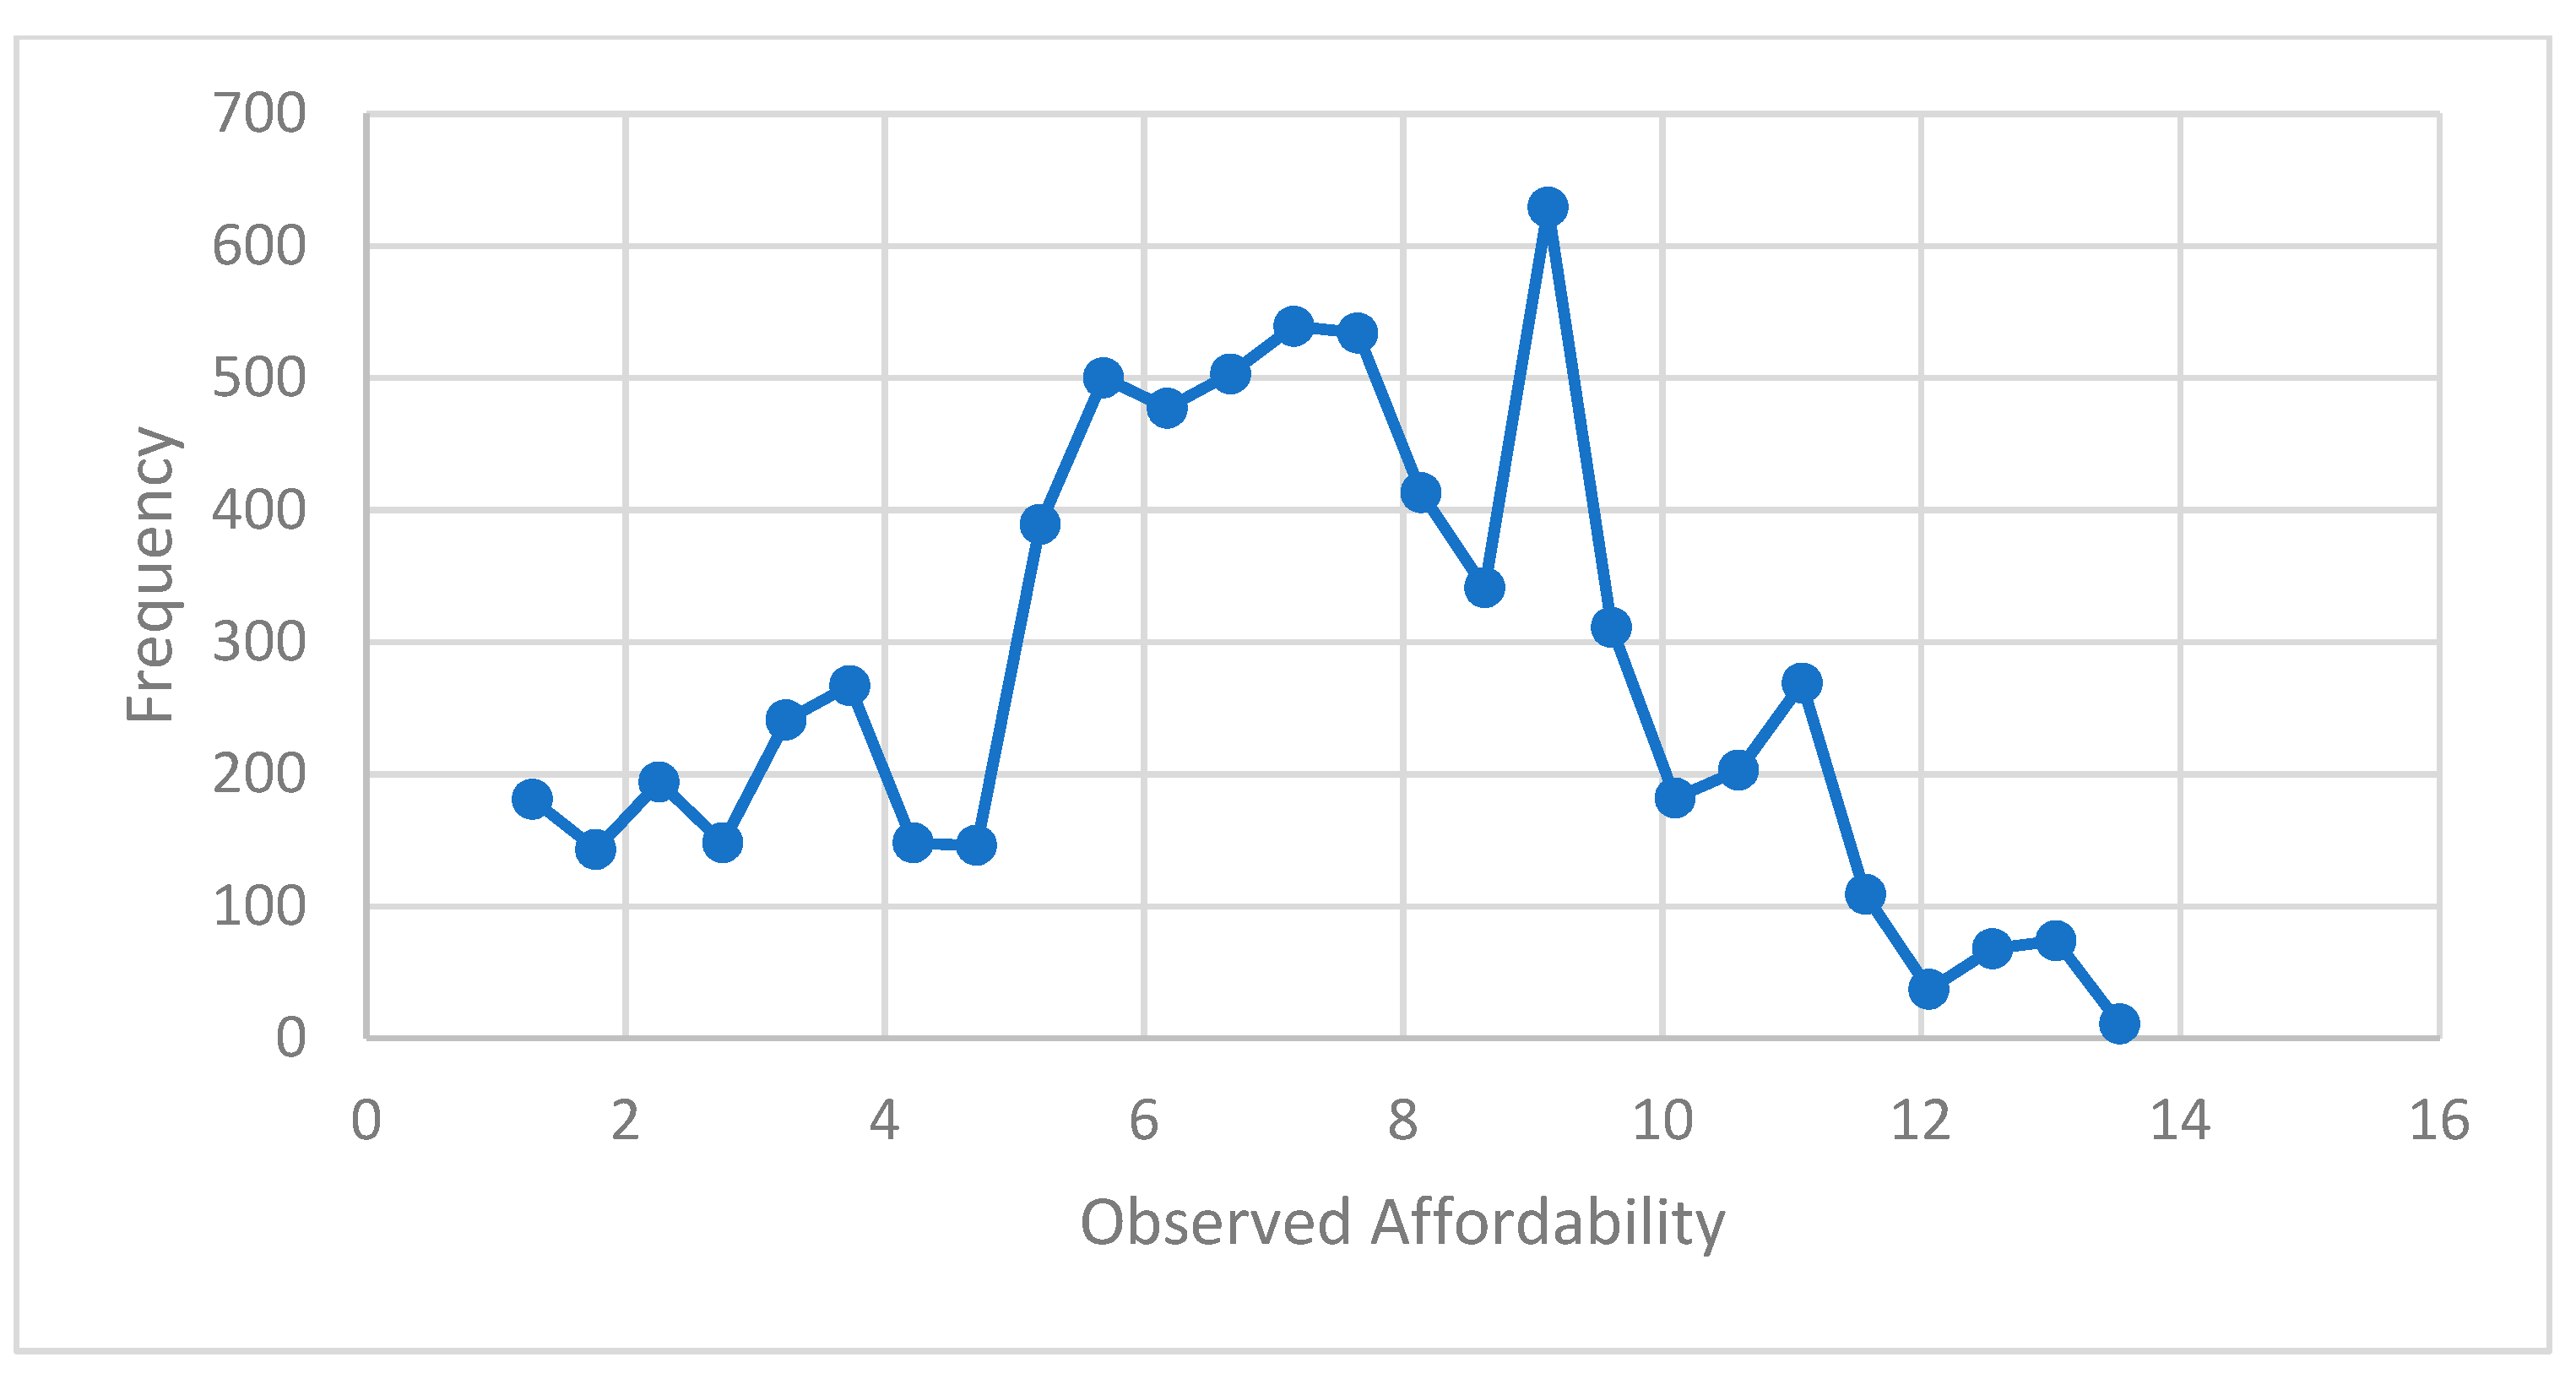
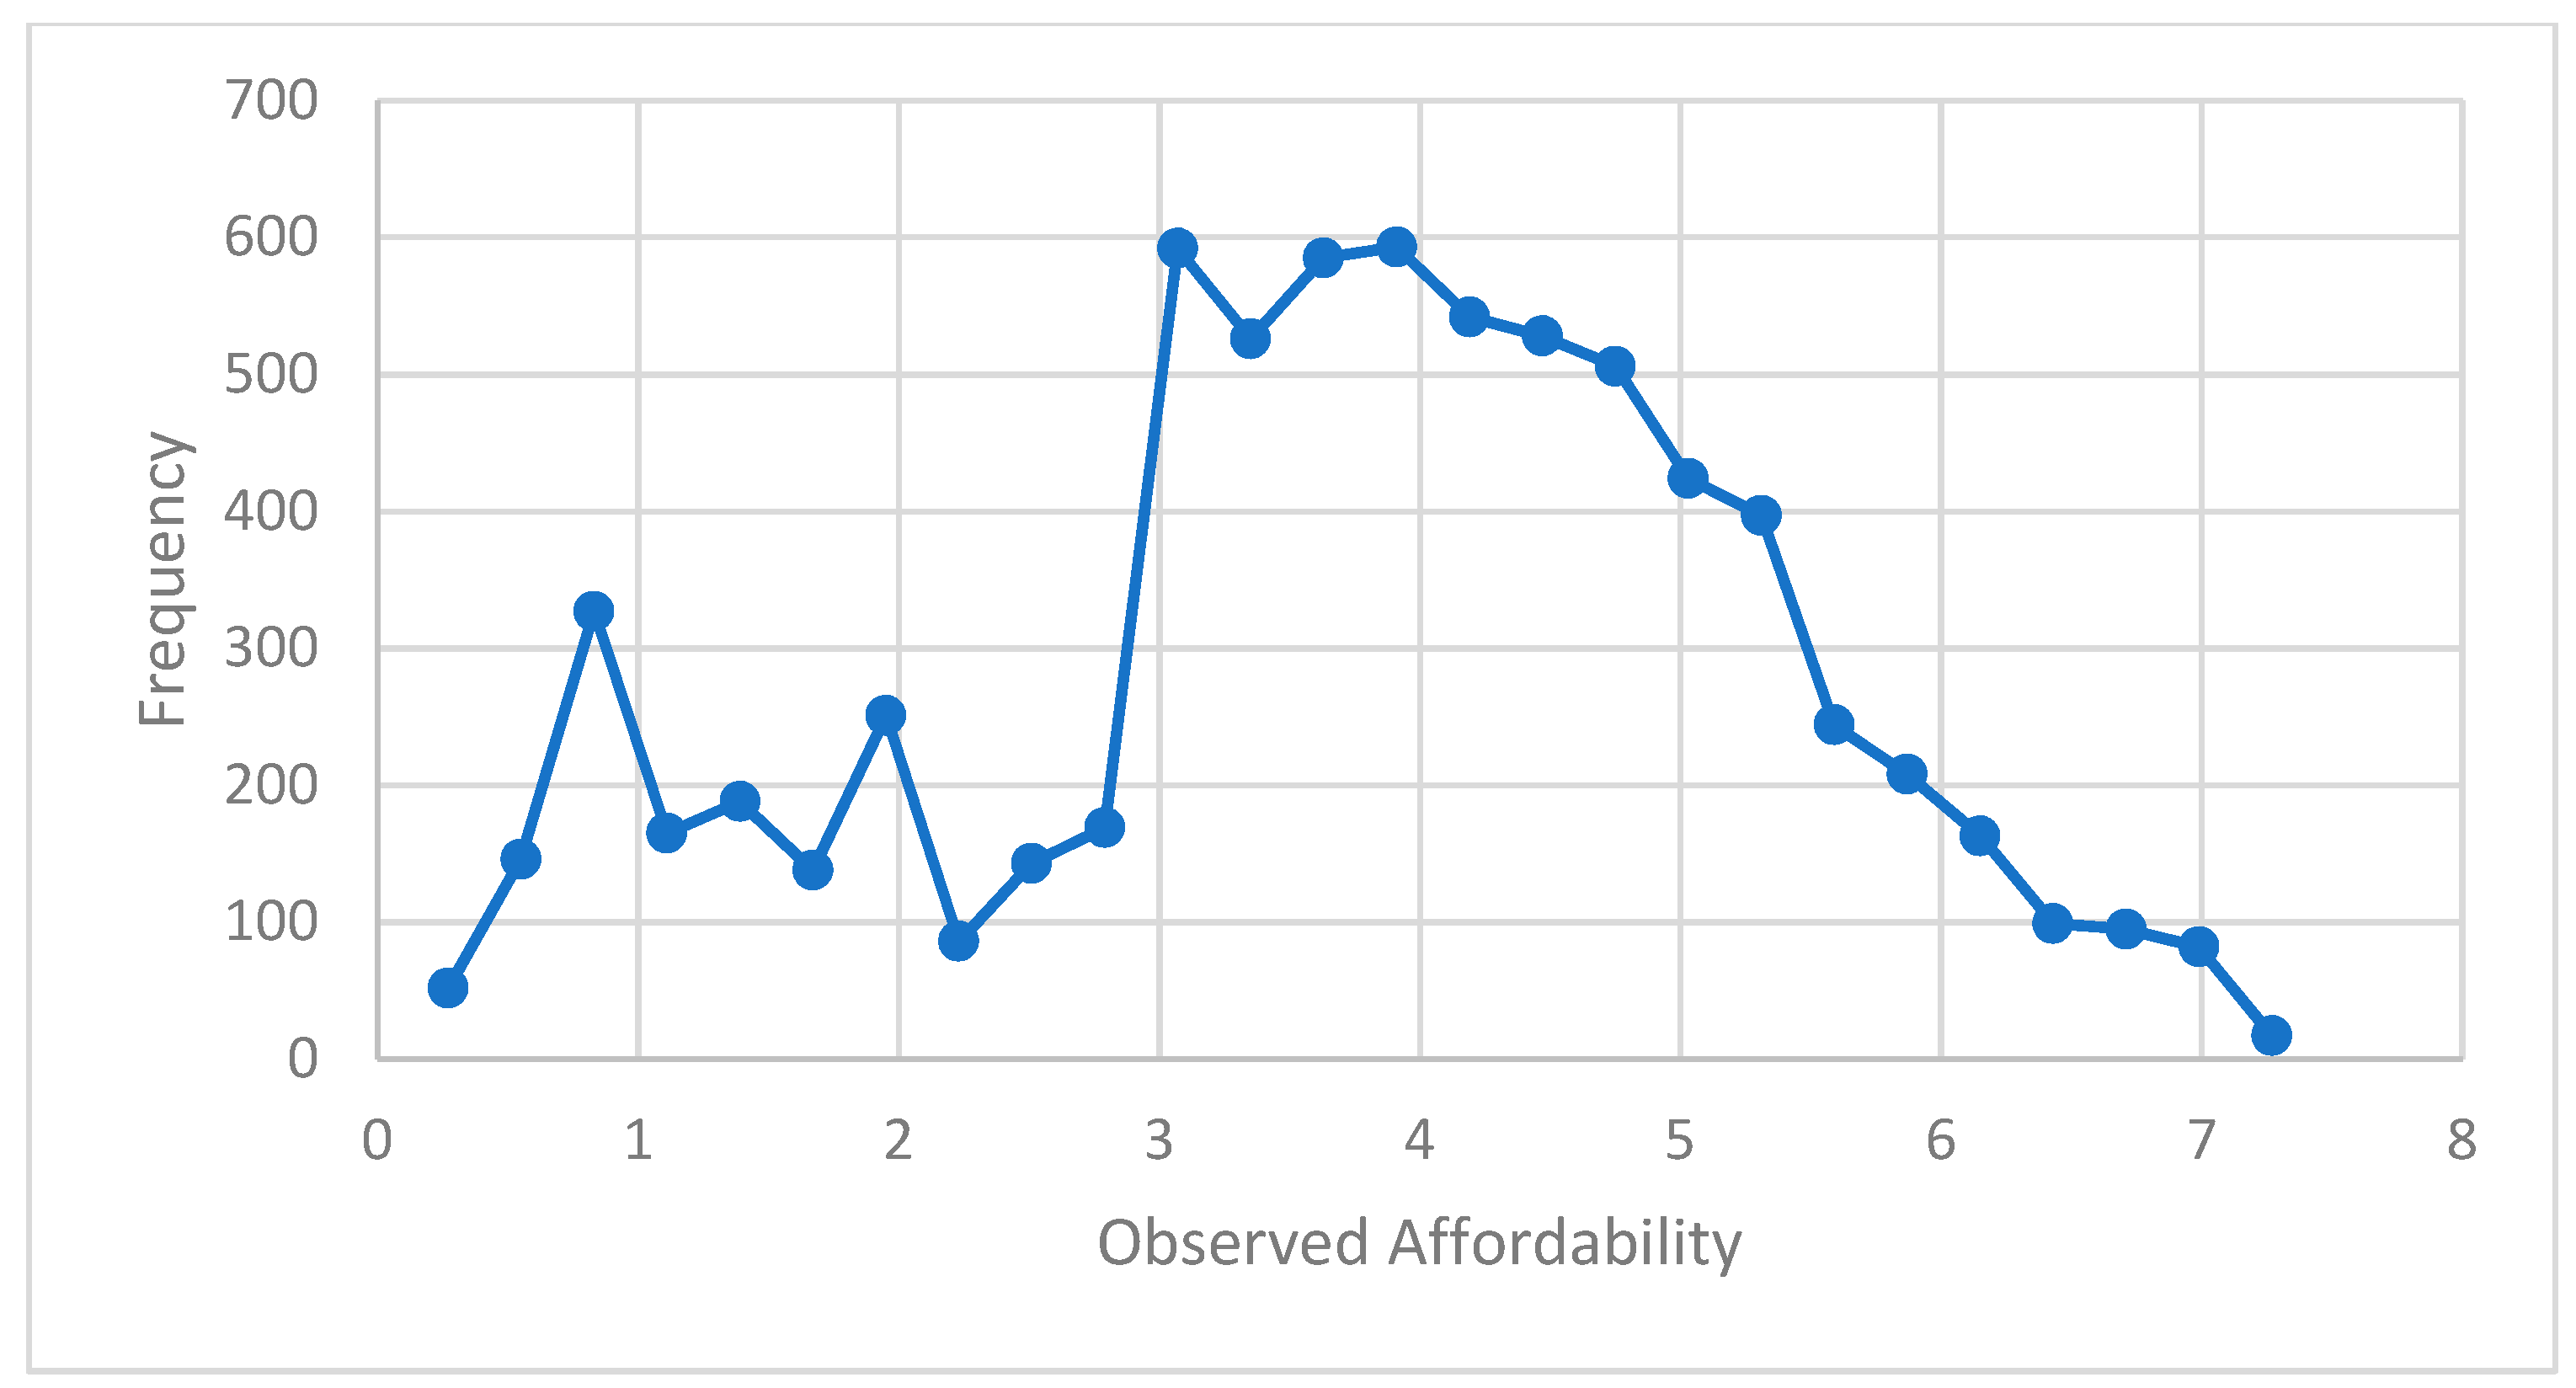
On average, the observed public transport affordability index is about 14.13% citywide (with the smallest value of 3.69 for the highest income group (Q5) and the highest value of 32.11 for the lowest income group (Q1)). On the other hand, the public transport potential affordability index is about 14.83% citywide (with 11.04 for the middle-income group (Q3) and 41.21 for the lowest income group (Q1)).
The difference between the potential and observed affordability indicates that to reach the same motorized trip rates as the third quintile, households in the lowest quintile need to increase their transport expenditure by 28.34% in Addis Ababa. This means that, if the poorest households could spend 28.34% more than they currently spend, they should not need to forego any trips.

6.2. Policy Implications

This study offers a viable approach that assists policymakers to shed light on public transit strategies. In this sense, a more realistic affordability measure provides a better policy alternative to the strategies aiming at minimizing financial burdens for mobility of the urban poor.
The variation of the two affordability indices, i.e., potential and observed, gives the insight to recognize financial equity in transport expenses that impacts mobility rates of various income classes differently. In this context, urban transport officials should target residents of the lower economic class to be able to commute a public transit trip amount equivalent to middle-income residents to combat trips sacrificed due to unaffordability.
When a particular household composition is considered in the city, the poorest 20% (Q1) should spend 28% more than the actual expenditure to equalize those public transport trip rates of the third quintile, showing that the mobility problem of the poorest is very significant.
In short, Addis Ababa’s city administrators should be attentive to their low-income residents’ lack of mobility options due to unaffordability. The results of this study clearly show that Addis Ababa is encountering dual challenges from the transport affordability perspective. On the one hand, the high degree of observed affordability index actually forces residents to allocate a significant portion of their earnings towards transport. Thus, any strategies targeting minimizing public transport flat fare through subsidies the median income may not reduce observed affordability because it does not particularly address the targeted lowest income groups. On the other hand, mobility challenges mainly affect the two lowest income classes, and thus, it might be useful to apply strategies, through targeted discounts and subsidies that reduce transit fares relative to wages to minimize avoided trips, among the bottom quintile groups.
In general, the findings of this study can be generalized in a broader context towards public transportation improvement in Africa in general and those cities with similar land use policies, mobility characteristics, population sizes, and income distributions in particular. This can help urban transport policy makers in this region to give due attention in dealing with transport equity based on income rather than simply employing subsidies based on median income. The following are lists of available strategies to enhance transportation affordability: address security concerns, bike-transit integration, commuter financial incentives, commute trip reduction (CTR) programs, land use accessibility improvements, location-efficient development, mobility management marketing, improvements in non-motorized transport (NMT), ride sharing, school trip management, smart growth, telework, taxi service improvements, transit improvements, etc.
However, this study can be made more comprehensive in similar future studies if the following major limitations are addressed. First, the study is focused on affordability of bus-based public transport users only, but it can be extended to other transport modes, including private cars and rail-based transit. Second, this study is limited to public transport affordability from a transport perspective only due to data availability, whereas recent studies consider transport affordability evaluation from both a transport and housing perspective by conducting a comprehensive transport and housing survey.

Author Contributions

Conceptualization, M.M. and S.S.; Data curation, M.M.; Formal analysis, M.M.; Investigation, M.M.; Methodology, M.M.; Supervision, S.S.; Validation, M.M.; Visualization, M.M.; Writing—original draft, M.M.; Writing—review & editing, M.M. and S.S. All authors have read and agreed to the published version of the manuscript.

Funding

This research was funded by the Ethiopian Ministry of science and higher education (MOSHE) Education under Grant No. 23A742 and the APC was funded by Murad Mohammed.

Institutional Review Board Statement

Not applicable.

Informed Consent Statement

Not applicable.

Data Availability Statement

Restrictions apply to the availability of these data. Data was obtained from Addis Ababa City Transport Bureau and Ethiopian Central Statistical Agenct and are available from the authors with the permission of AACTB and CSA.

Acknowledgments

I am grateful to Jimma University, Jimma Institute of Technology, for providing funding to conduct this study. I also forward my appreciation and thanks to the Addis Ababa City Transport Bureau and Central Statistical Agency for their data provision.

Conflicts of Interest

The authors declare no conflict of interest.

References

  1. Berhan, E.; Beshah, B.; Kitaw, D. Performance Analysis on Public Bus Transport of the City of Addis Ababa. Int. J. Comput. Inf. Syst. Ind. Manag. Appl. 2013, 5, 722–728. [Google Scholar]
  2. Gebeyehu, M.; Takano, S. Diagnostic Evaluation of Public Transportation Mode Choice in Addis Ababa. J. Public Transp. 2007, 10, 27–50. [Google Scholar] [CrossRef]
  3. Bräuninger, M.; Schulze, S.; Leschus, L.; Perschon, J.; Hertel, C.; Field, S.; Foletta, N. Achieving Sustainability in Urban Transport in Developing and Transition Countries; Federal Environmental Agency (Umweltbundesamt): Dessau-Roblau, Germany, 2012. [Google Scholar]
  4. Carruthers, R.; Dick, M.; Saurkar, A. Affordability of Public Transport in Developing Countries. Transp. Pap. 2005, TP-3, 1–27. [Google Scholar]
  5. Pojani, D.; Stead, D. Sustainable Urban Transport in the Developing World: Beyond Megacities. Sustainability 2015, 7, 7784–7805. [Google Scholar] [CrossRef] [Green Version]
  6. Boschetti, F.; Maurizi, I.; Cre, I. Innovative Urban Transport Solutions; ICLEI-Local Government for Sustainability, European Secretariat: Freiburg, Germany, 2014. [Google Scholar]
  7. Abraha, D.A. Analysing Public Transport Performance Using Efficiency Measures and Spatial Analysis: The Case of Addis Ababa, Ethiopia; International Institute for Geo-information Science and Earth Observation: Enschede, The Netherlands, 2007. [Google Scholar]
  8. Kranton, E.R. Transport and the Mobility Needs of the Urban Poor: An Exploratory Study; The World Bank: Washing, DC, USA, 1991. [Google Scholar]
  9. Lowson, M. Idealised Models for Public Transport Systems. Int. J. Transp. Manag. 2005, 2, 135–147. [Google Scholar] [CrossRef]
  10. Maunder, D.A.C.; Mbara, T.C. TITLE Liberalisation of Urban Public Transport Services: What Are the Implications? Indian J. Transp. Manag. 1996, 20, 16–23. [Google Scholar]
  11. Falavigna, C.; Hernandez, D. Assessing Inequalities on Public Transport Affordability in Two Latin American Cities: Montevideo (Uruguay) and Córdoba (Argentina). Transp. Policy 2016, 45, 145–155. [Google Scholar] [CrossRef]
  12. Litman, T. Transportation Affordability. Victoria Transp. 2016, 250, 360–1560. [Google Scholar]
  13. Diaz Olvera, L.; Plat, D.; Pochet, P. The Puzzle of Mobility and Access to the City in Sub-Saharan Africa. J. Transp. Geogr. 2013, 32, 56–64. [Google Scholar] [CrossRef] [Green Version]
  14. Blumenberg, E. Transportation Costs and Economic Opportunity Among the Poor. Access Mag. 2003, 1, 40–41. [Google Scholar]
  15. Armstrong, A.; Thiriez, S. Bus Services Reducing CostsRaising Standards; The World Bank: Washington, DC, USA, 1987. [Google Scholar]
  16. Center for Neighborhood Technology—CNT. Housing & Transportation Affordability Index. Available online: http://htaindex.cnt.org (accessed on 6 December 2019).
  17. Isalou, A.A.; Litman, T.; Shahmoradi, B. Testing the Housing and Transportation Affordability Index in a Developing World Context: A Sustainability Comparison of Central and Suburban Districts in Qom, Iran. Transp. Policy 2014, 33, 33–39. [Google Scholar] [CrossRef]
  18. Behrens, R.; Venter, C.J. Transport Expenditures: Is the 10% Policy Benchmark Appropriate? SATC 2005, 24, 668–679. [Google Scholar]
  19. Fan, Y. How Affordable Is Transportation? A Context-Sensitive Framework; Center for Transportation Studies: Minneapolis, MN, USA, 2012. [Google Scholar]
  20. ECLAC. The Impacts of Subsidies, Regulation, and Different Forms of Own-Ership on the Service Quality and Operational Efficiency of Urban Bus Systems in Latin America. J. Adv. Transp. 1991, 25, 117–133. [Google Scholar] [CrossRef]
  21. Gomide, A.; Leite, S.; Rebelo, J. Public Transport and Urban Poverty: A Syn-thetic Index of Adequate Service. Working Paper for the World Bank Urban Transport Program in Brasil, Belo Horizonte. Doc. Trab. 2005, 33901, 923–964. [Google Scholar]
  22. Gomez-Lobo, A. Affordability of Public Transport: A Methodological Clarification. J. Transp. Econ. Policy 2011, 45, 437–456. [Google Scholar]
Figure 1. Map of the sub-city boundaries of Addis Ababa, and its location in Ethiopia, Africa.
Sustainability 14 06883 g001
Figure 2. Bus types used in the Addis Ababa public transportation system.
Sustainability 14 06883 g002
Figure 3. Observed public transport affordability (Affo) of Addis Ababa City.
Sustainability 14 06883 g003
Figure 4. Frequency distribution of HHs in the first income quintile Q1.
Sustainability 14 06883 g004
Figure 5. Frequency distribution of HHs for income quintile Q2.
Sustainability 14 06883 g005
Figure 6. Frequency distribution of HHs for income quintile Q3.
Sustainability 14 06883 g006
Figure 7. Frequency distribution of HHs for income quintile Q4.
Sustainability 14 06883 g007
Figure 8. Frequency distribution of HHs for income quintile Q5.
Sustainability 14 06883 g008
Figure 9. Income distribution of HHs in Addis Ababa City.
Sustainability 14 06883 g009
Figure 10. Mode choice classified by sub-city.
Sustainability 14 06883 g010
Figure 11. Trip distance classified by sub-cities.
Sustainability 14 06883 g011
Figure 12. Income quintiles classified by sub-cities.
Sustainability 14 06883 g012
Figure 13. Mode choice classified by trip purpose.
Sustainability 14 06883 g013
Figure 14. Mode choice classified by daily public transportation expense.
Sustainability 14 06883 g014
Table 1. Number of EAs and HHs by sub-city, May 2014.
Sub-CityNumber of EAsNo. of Kebeles CoveredNo. of HHsAverage No of HHs
Covered per EA
Addis Ketema7292069 28.7
Akaki Kality5981795 30.4
Arada8091978 24.7
Bole88112219 25.2
Gulele8092160 27.0
Kirkos88112640 30.0
Kolfe Keranyo80102010 25.1
Lideta7291980 27.5
Nifas Silk Lafto80102158 27.0
Yeka88102279 25.9
Total7879621,288 27.1
Table 2. Sub-cities by major features.
S.No.Sub-CitiesArea (Sq.Km)PopulationDensity per Sq.KmWerdasSpecial Features
1Arada9.9225,99922,805.110Mayor HQ and National Museum
2Akaki Kaliti118.08195,2731653.711Factories and Industries
3Addis Ketema7.41271,64436,659.110CBD (Merkato)
4Bole122.08328,9002694.114Int. Air Port
5Gullele30.18284,8659438.910Parks
6Kirkos14.62235,44116,10411UN and ECA main offices
7Kolfe Keranio61.25546,2197448.515Military Camp
8Lideta9.18214,76923,395.310AU. HQ
9Nefas Silk68.3335,7424915.712Coffe and Tea QC Center
10Yeka85.98368,4184284.913AARTB
Total/Average526.983,007,2705706.61116
Table 3. Summary of fare ranges for bus types used in Addis Ababa.
Bus TypeShortest TripLongest Trip
PreviousRevisedPreviousRevised
Length (Km)Fare (ETB) Length (Km)Fare (ETB) Length (Km)Fare (ETB) Length (Km)Fare (ETB)
Mini—Bus TaxiCode-10–2.51.40–2.51.4512.1–154.912.1–155
Code-30–2.51.450–2.51.524.1–301227.6–3018
Midi—BusHiger and Kitkit0–8.020–8.02.518.1–214.8524.1–288.25
City—BusAnbessa0–9.01.50–9.01.530–47930–479
Sheger and Alliance0–4.01.50–4.01.513.1–15513.1–155.05
One US Dollar is equivalent to 32.09 ETB according to the exchange rate on 16 February 2020.
Table 4. Monthly trip rates (round trips) by income quintile.
Income Quintiles (Q)≤1000 (Q1)1001–2000 (Q2)2001–3000 (Q3)3001–4000 (Q4)>4000 (Q5)All Income
Monthly Trip Days16.9820.1820.9821.1821.3019.45
Table 5. Monthly trip rates (round trips) by sub-city.
Sub-CityAddis KetemaAkaki KalitiAradaBoleGulleleKirkosKolfe KeraniyoLidetaNifas SilkYekaCity Wide
Monthly Trip Days20.3018.6121.0120.9920.9221.3420.6620.7621.0620.7320.70
Table 6. Public transport affordability indices categorized by per capita income quintile.
Public Transport Affordability IndicesQ1Q2Q3Q4Q5Total
Observed Affordability (Affo)32.1116.9311.046.913.6914.13
Potential Affordability (Affp)39.6717.6011.04--15.24
Difference (%)23.543.960 7.86
Table 7. Observed and potential affordability indices using the weighted average income as a benchmark.
Public Transport Affordability IndicesQ1Q2 I w a v g Q3Q4Q5
Observed Affordability (Affo)32.1116.9312.3311.046.913.69
Potential Affordability (Affp)39.2517.4212.33---
Difference (%)22.232.89000
Table 8. Mode choice classified by income quintile.
Travel ModeIncome Quintiles (%)
Q1Q2Q3Q4Q5
Public Transport67.8476.5582.8783.5974.87
Car1.031.802.846.4017.25
NMT29.6920.3613.279.026.97
Bajaj1.100.930.690.630.58
Others0.340.360.320.350.33
Total100100100100100
Notes: Public transport mode includes Minibus Taxi, Higer Bus, City Bus, and Service Bus. NMT mode includes walking and biking.
Publisher’s Note: MDPI stays neutral with regard to jurisdictional claims in published maps and institutional affiliations.

