
Climate Impact and Model Approaches of Blue-Green Infrastructure Measures for Neighborhood Planning

 , ,
, ,
Abstract
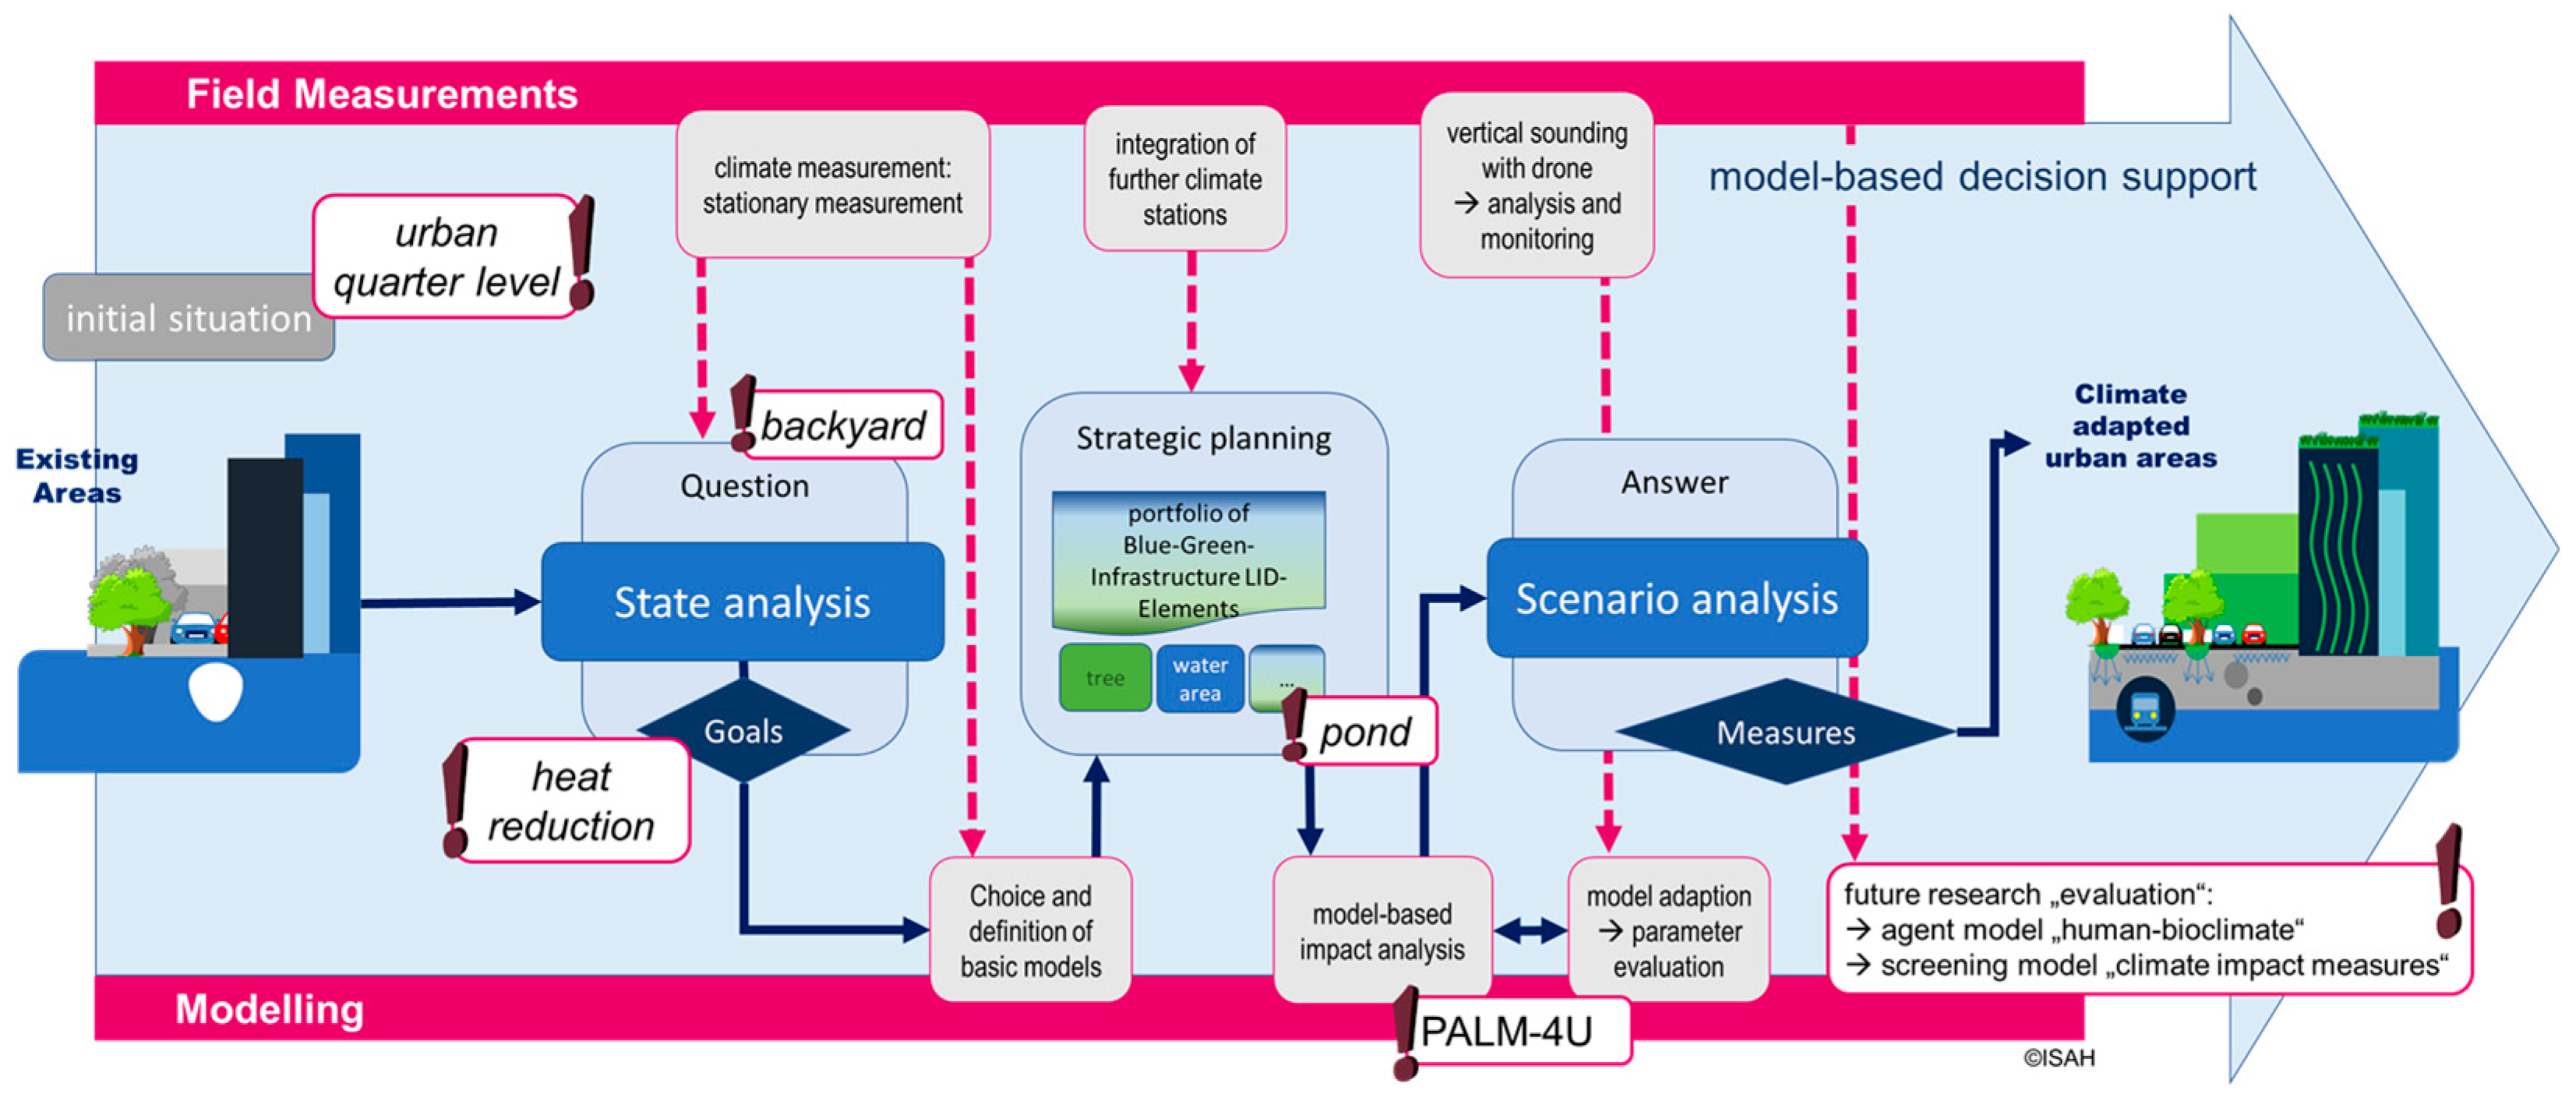
:1. Introduction
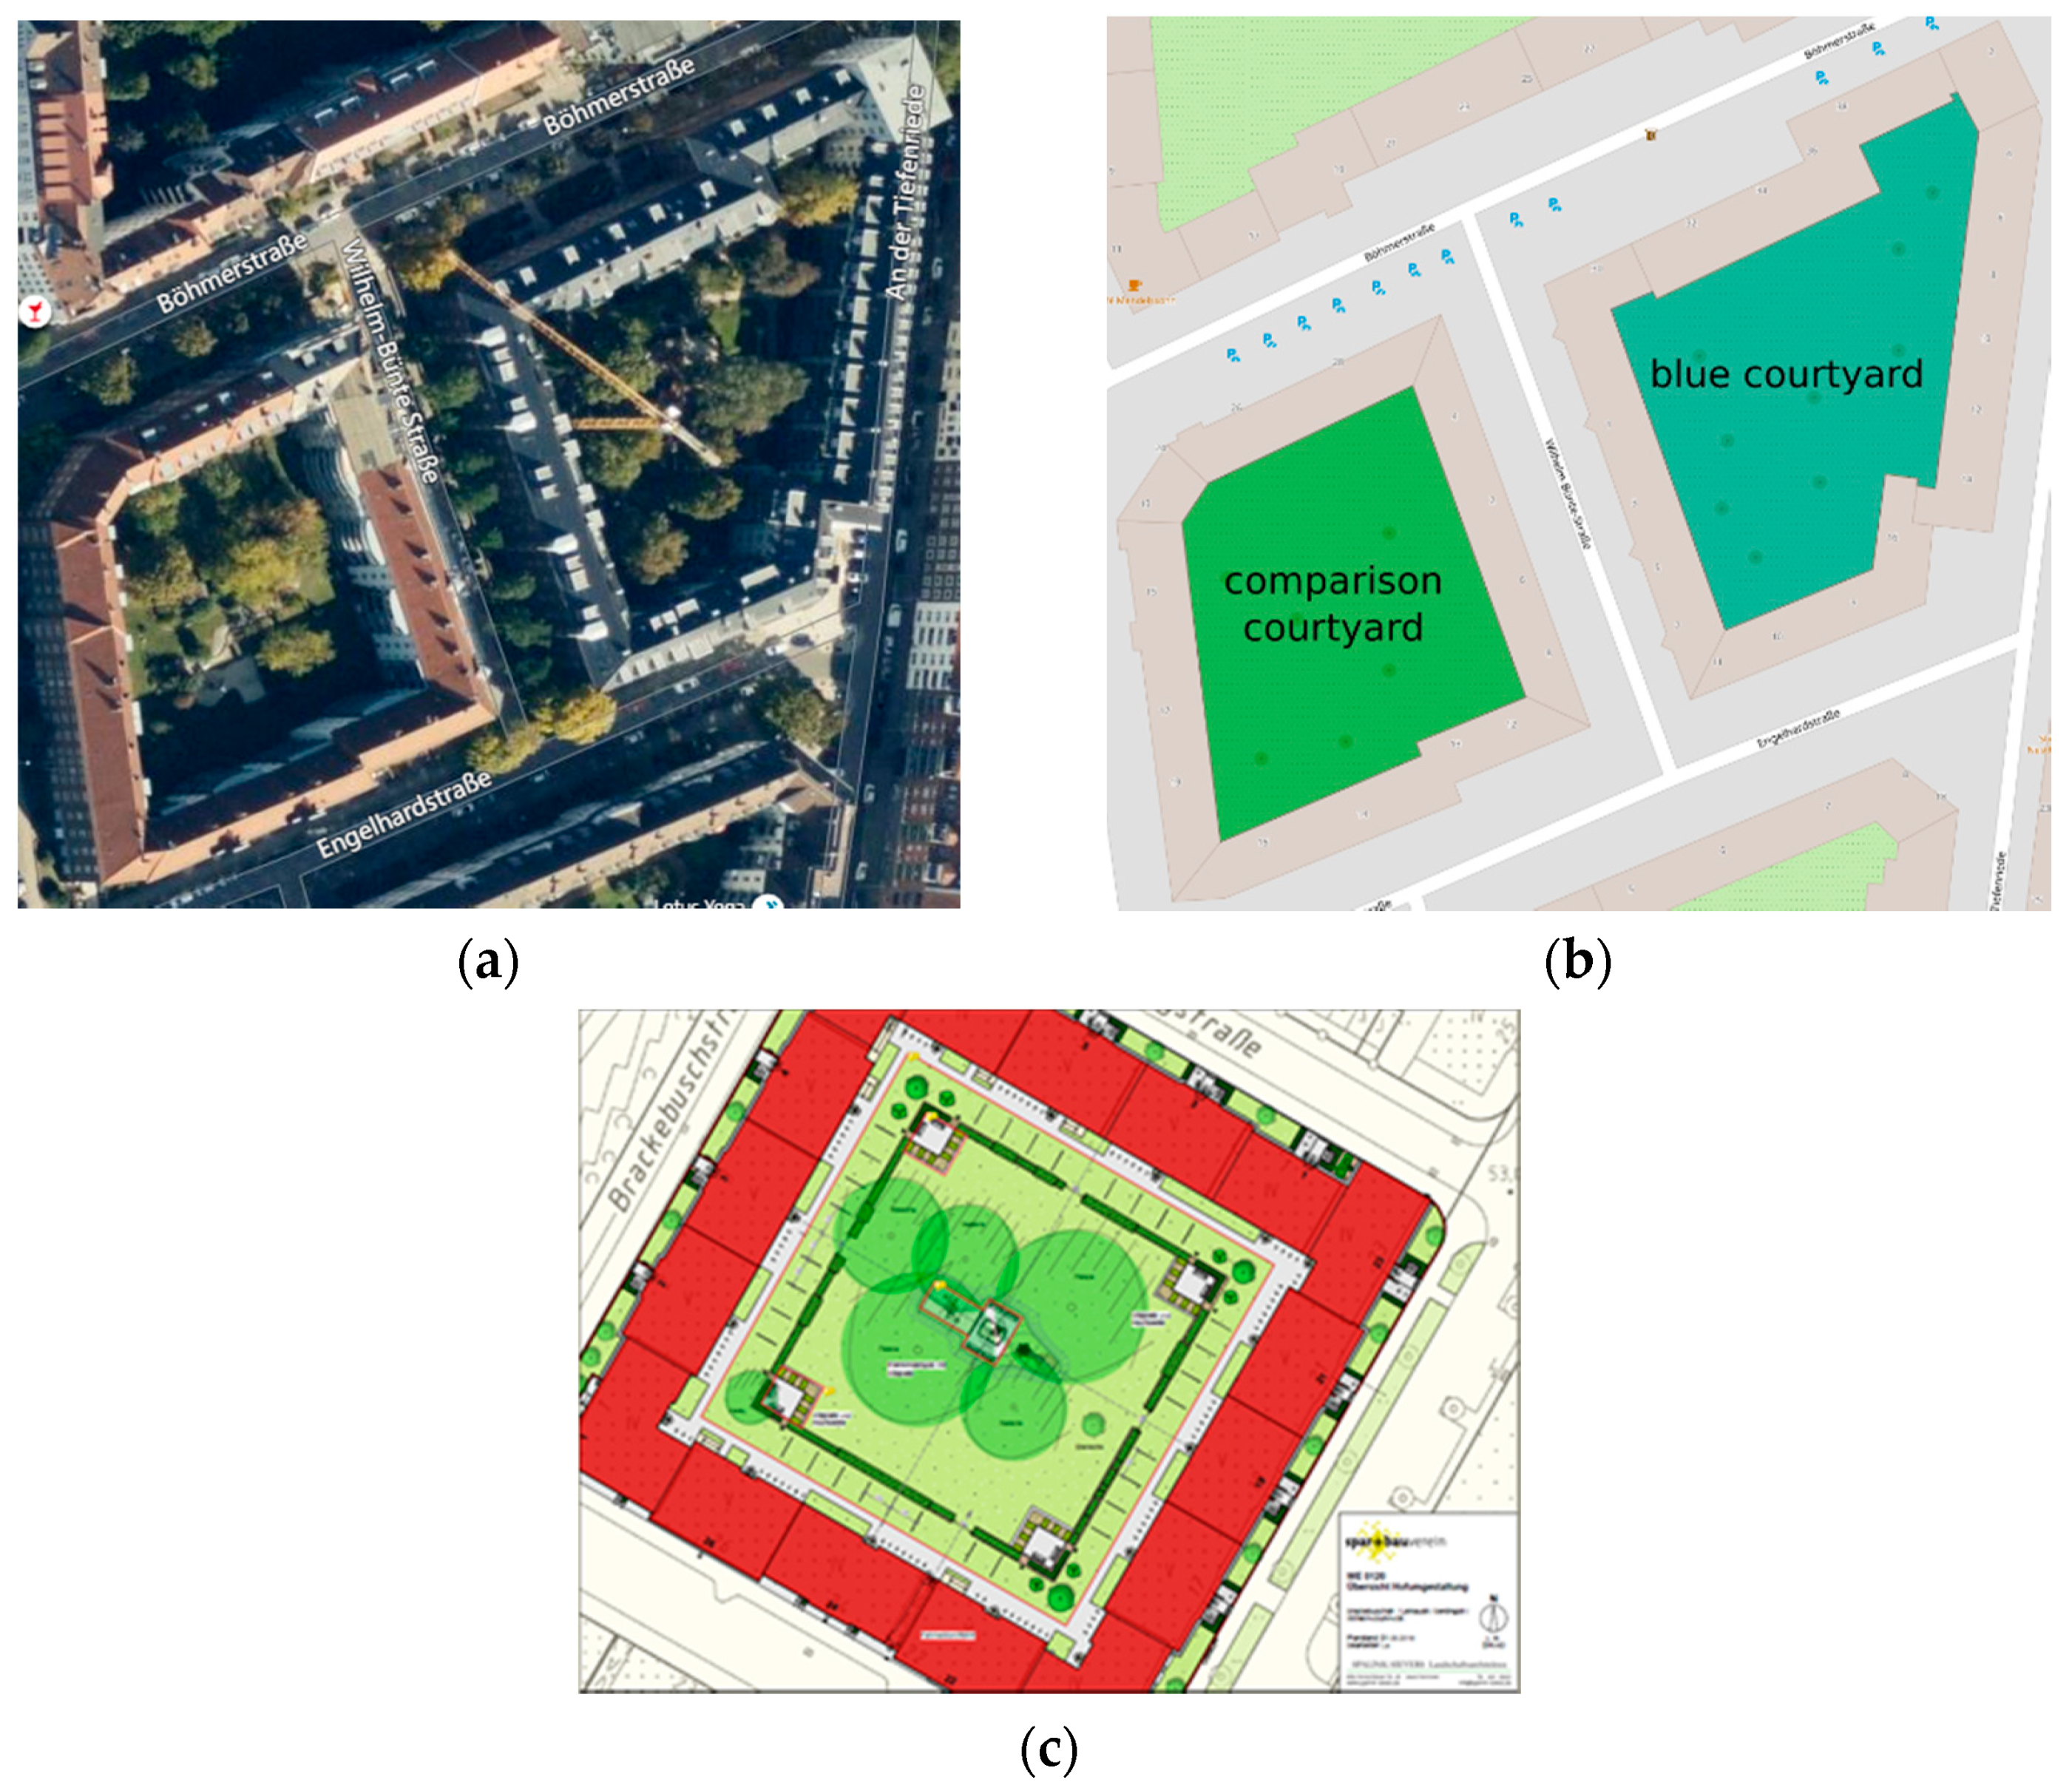
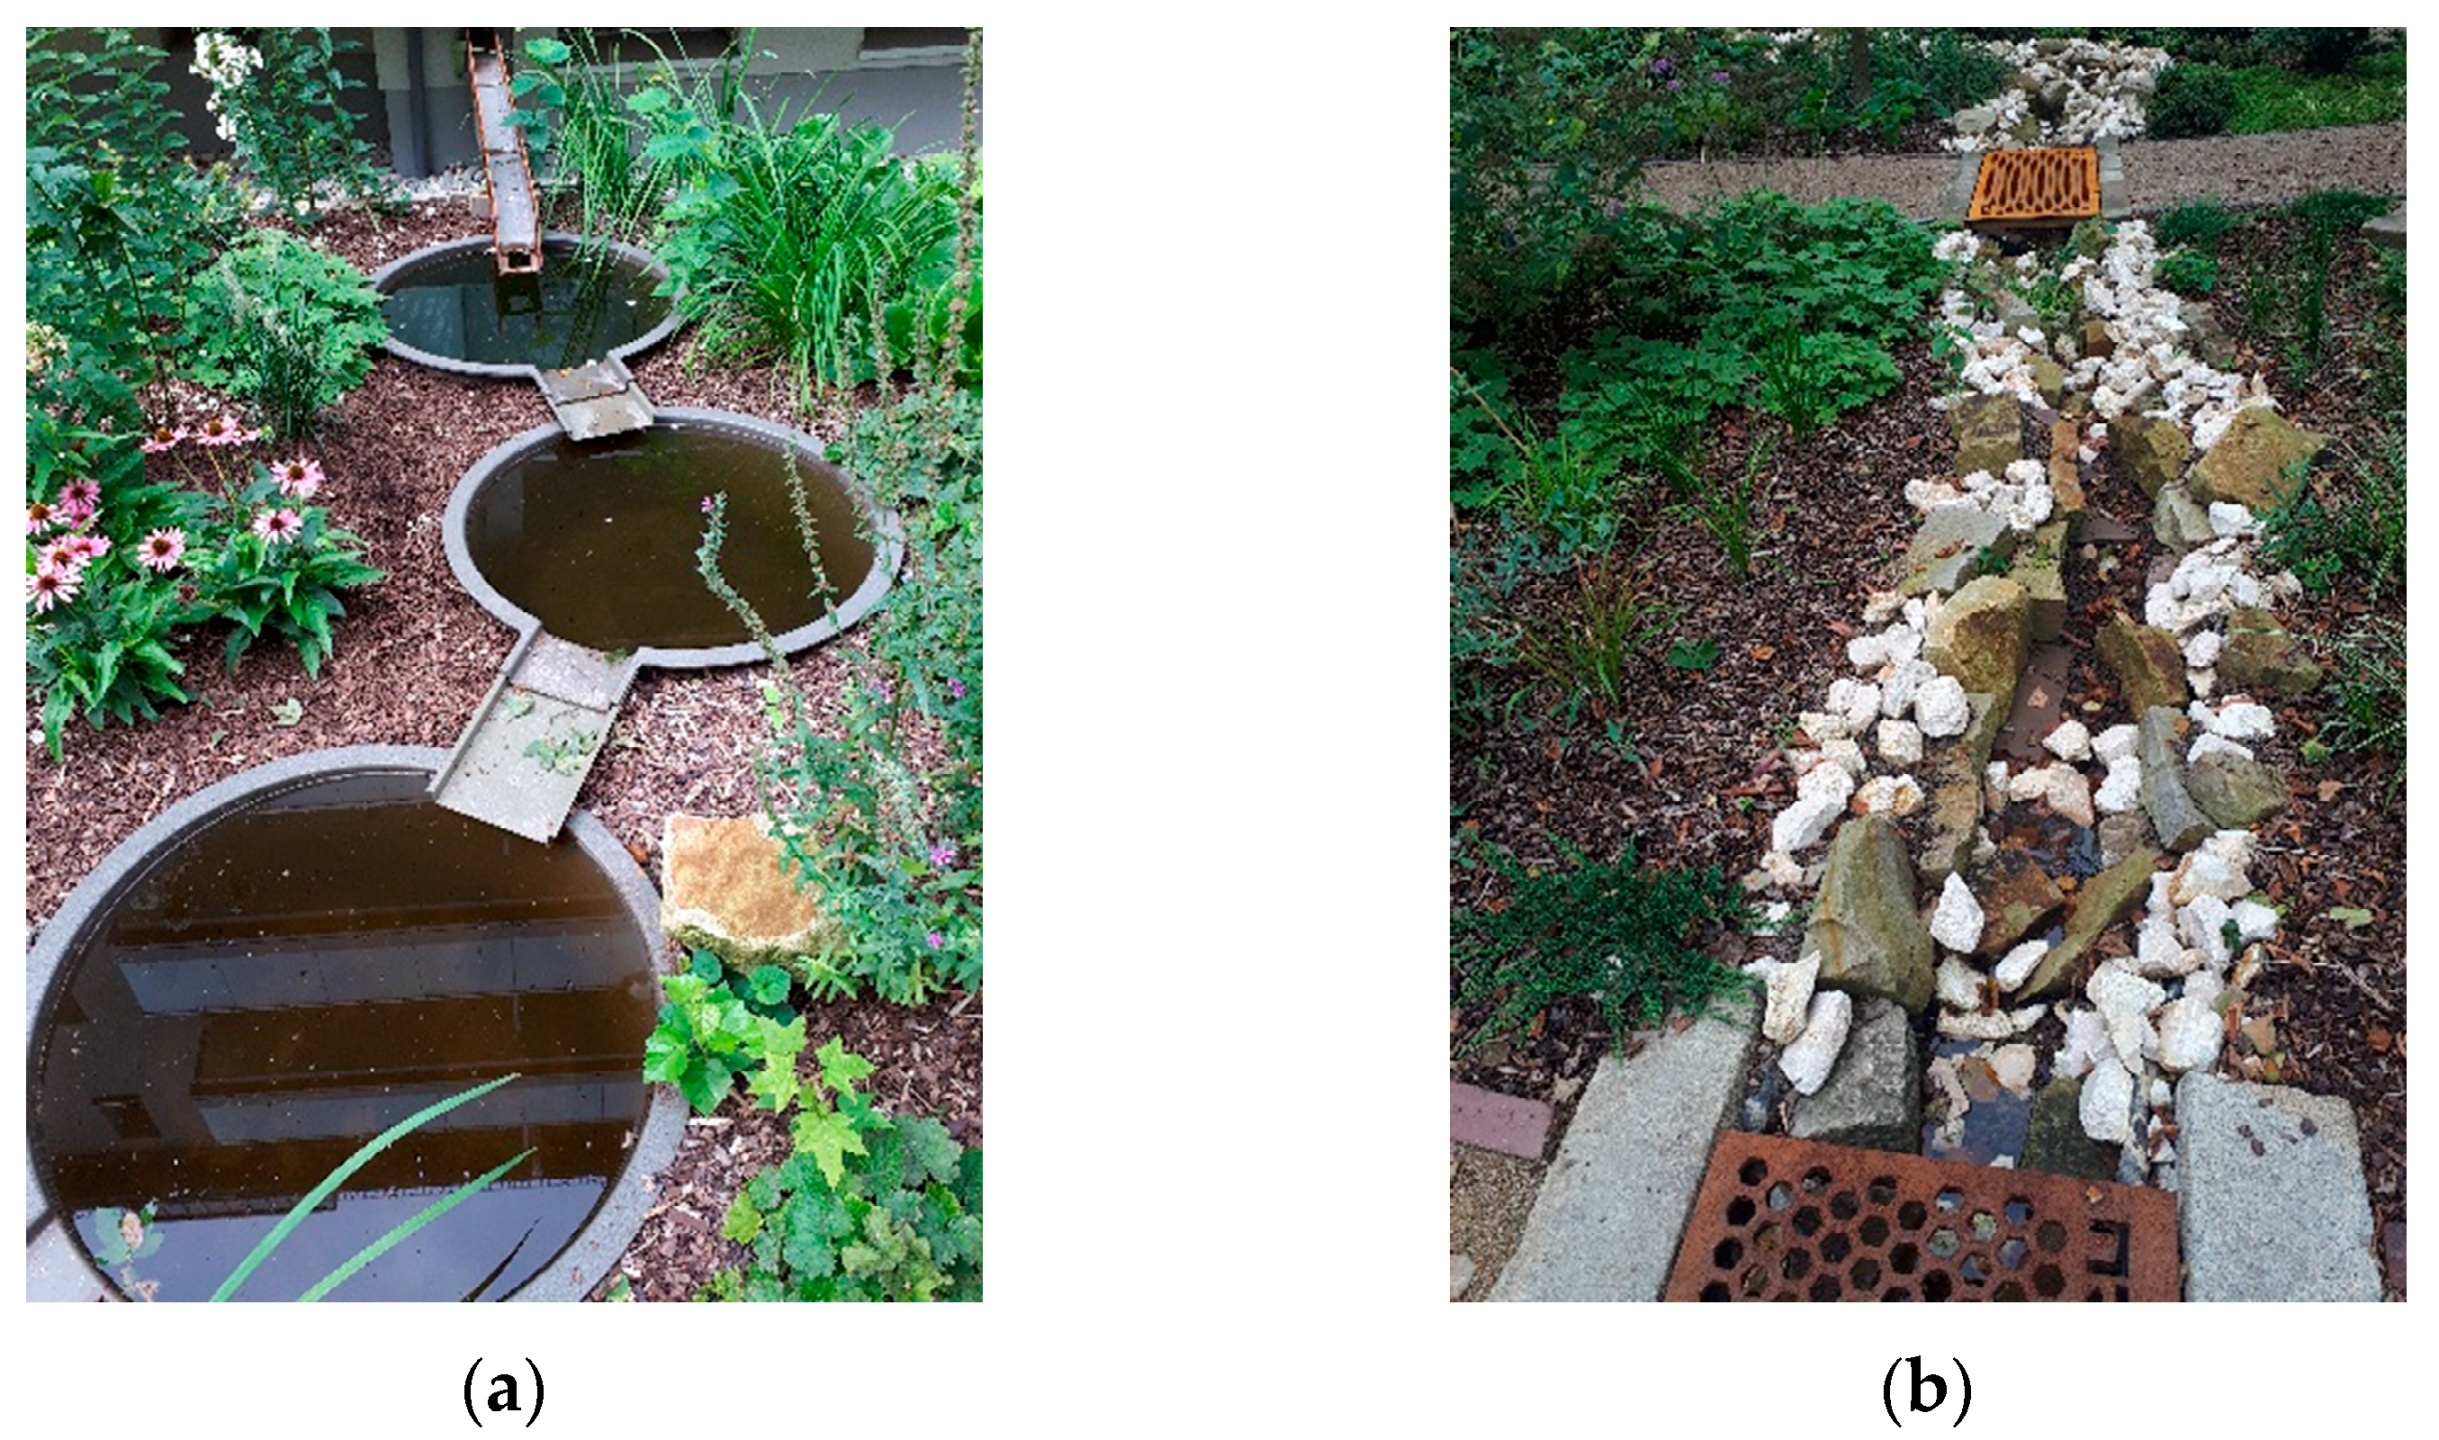
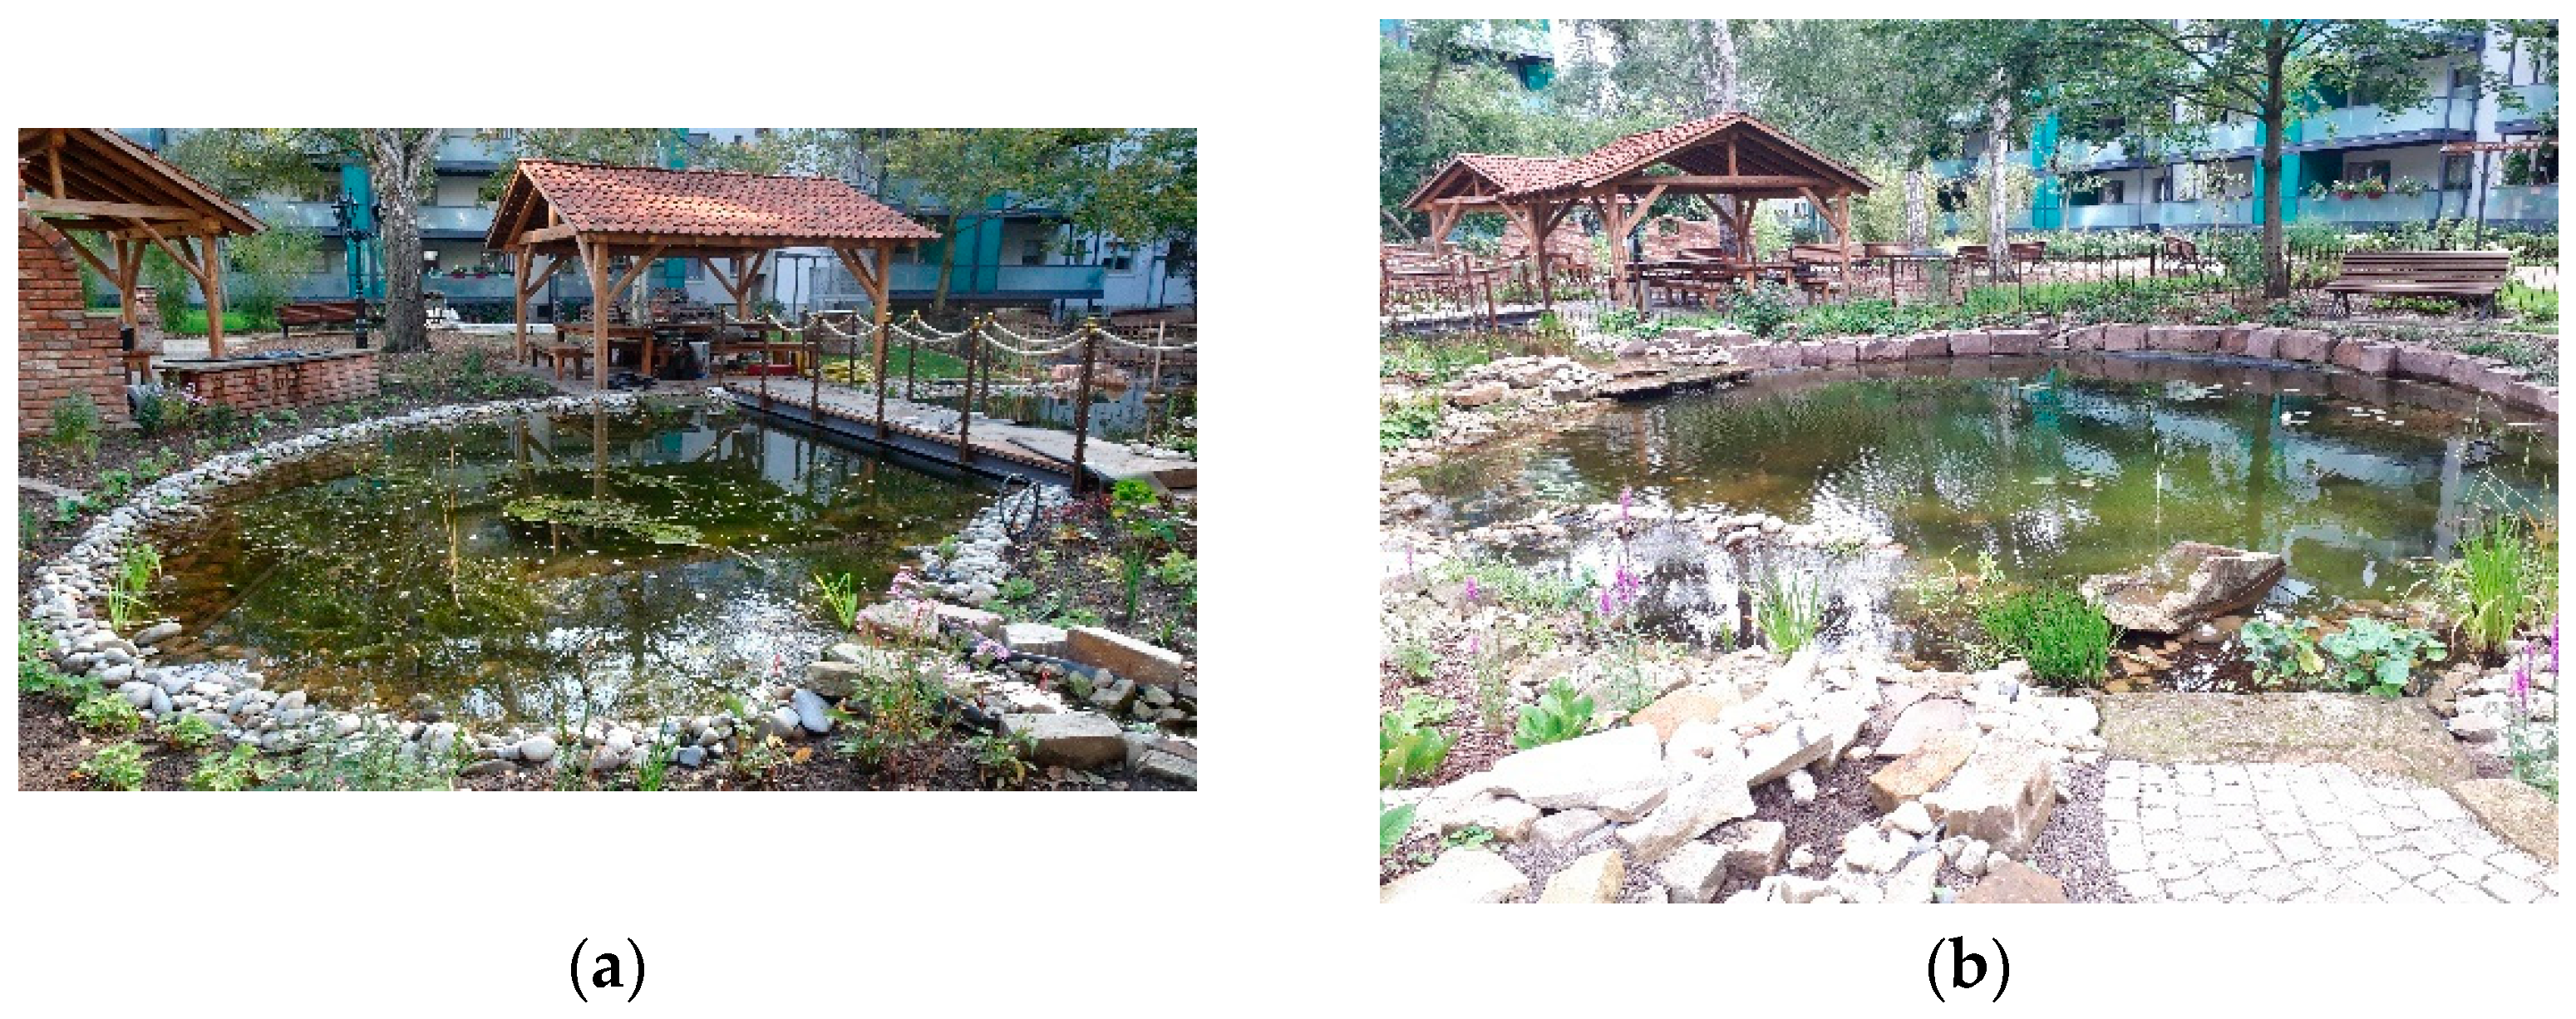
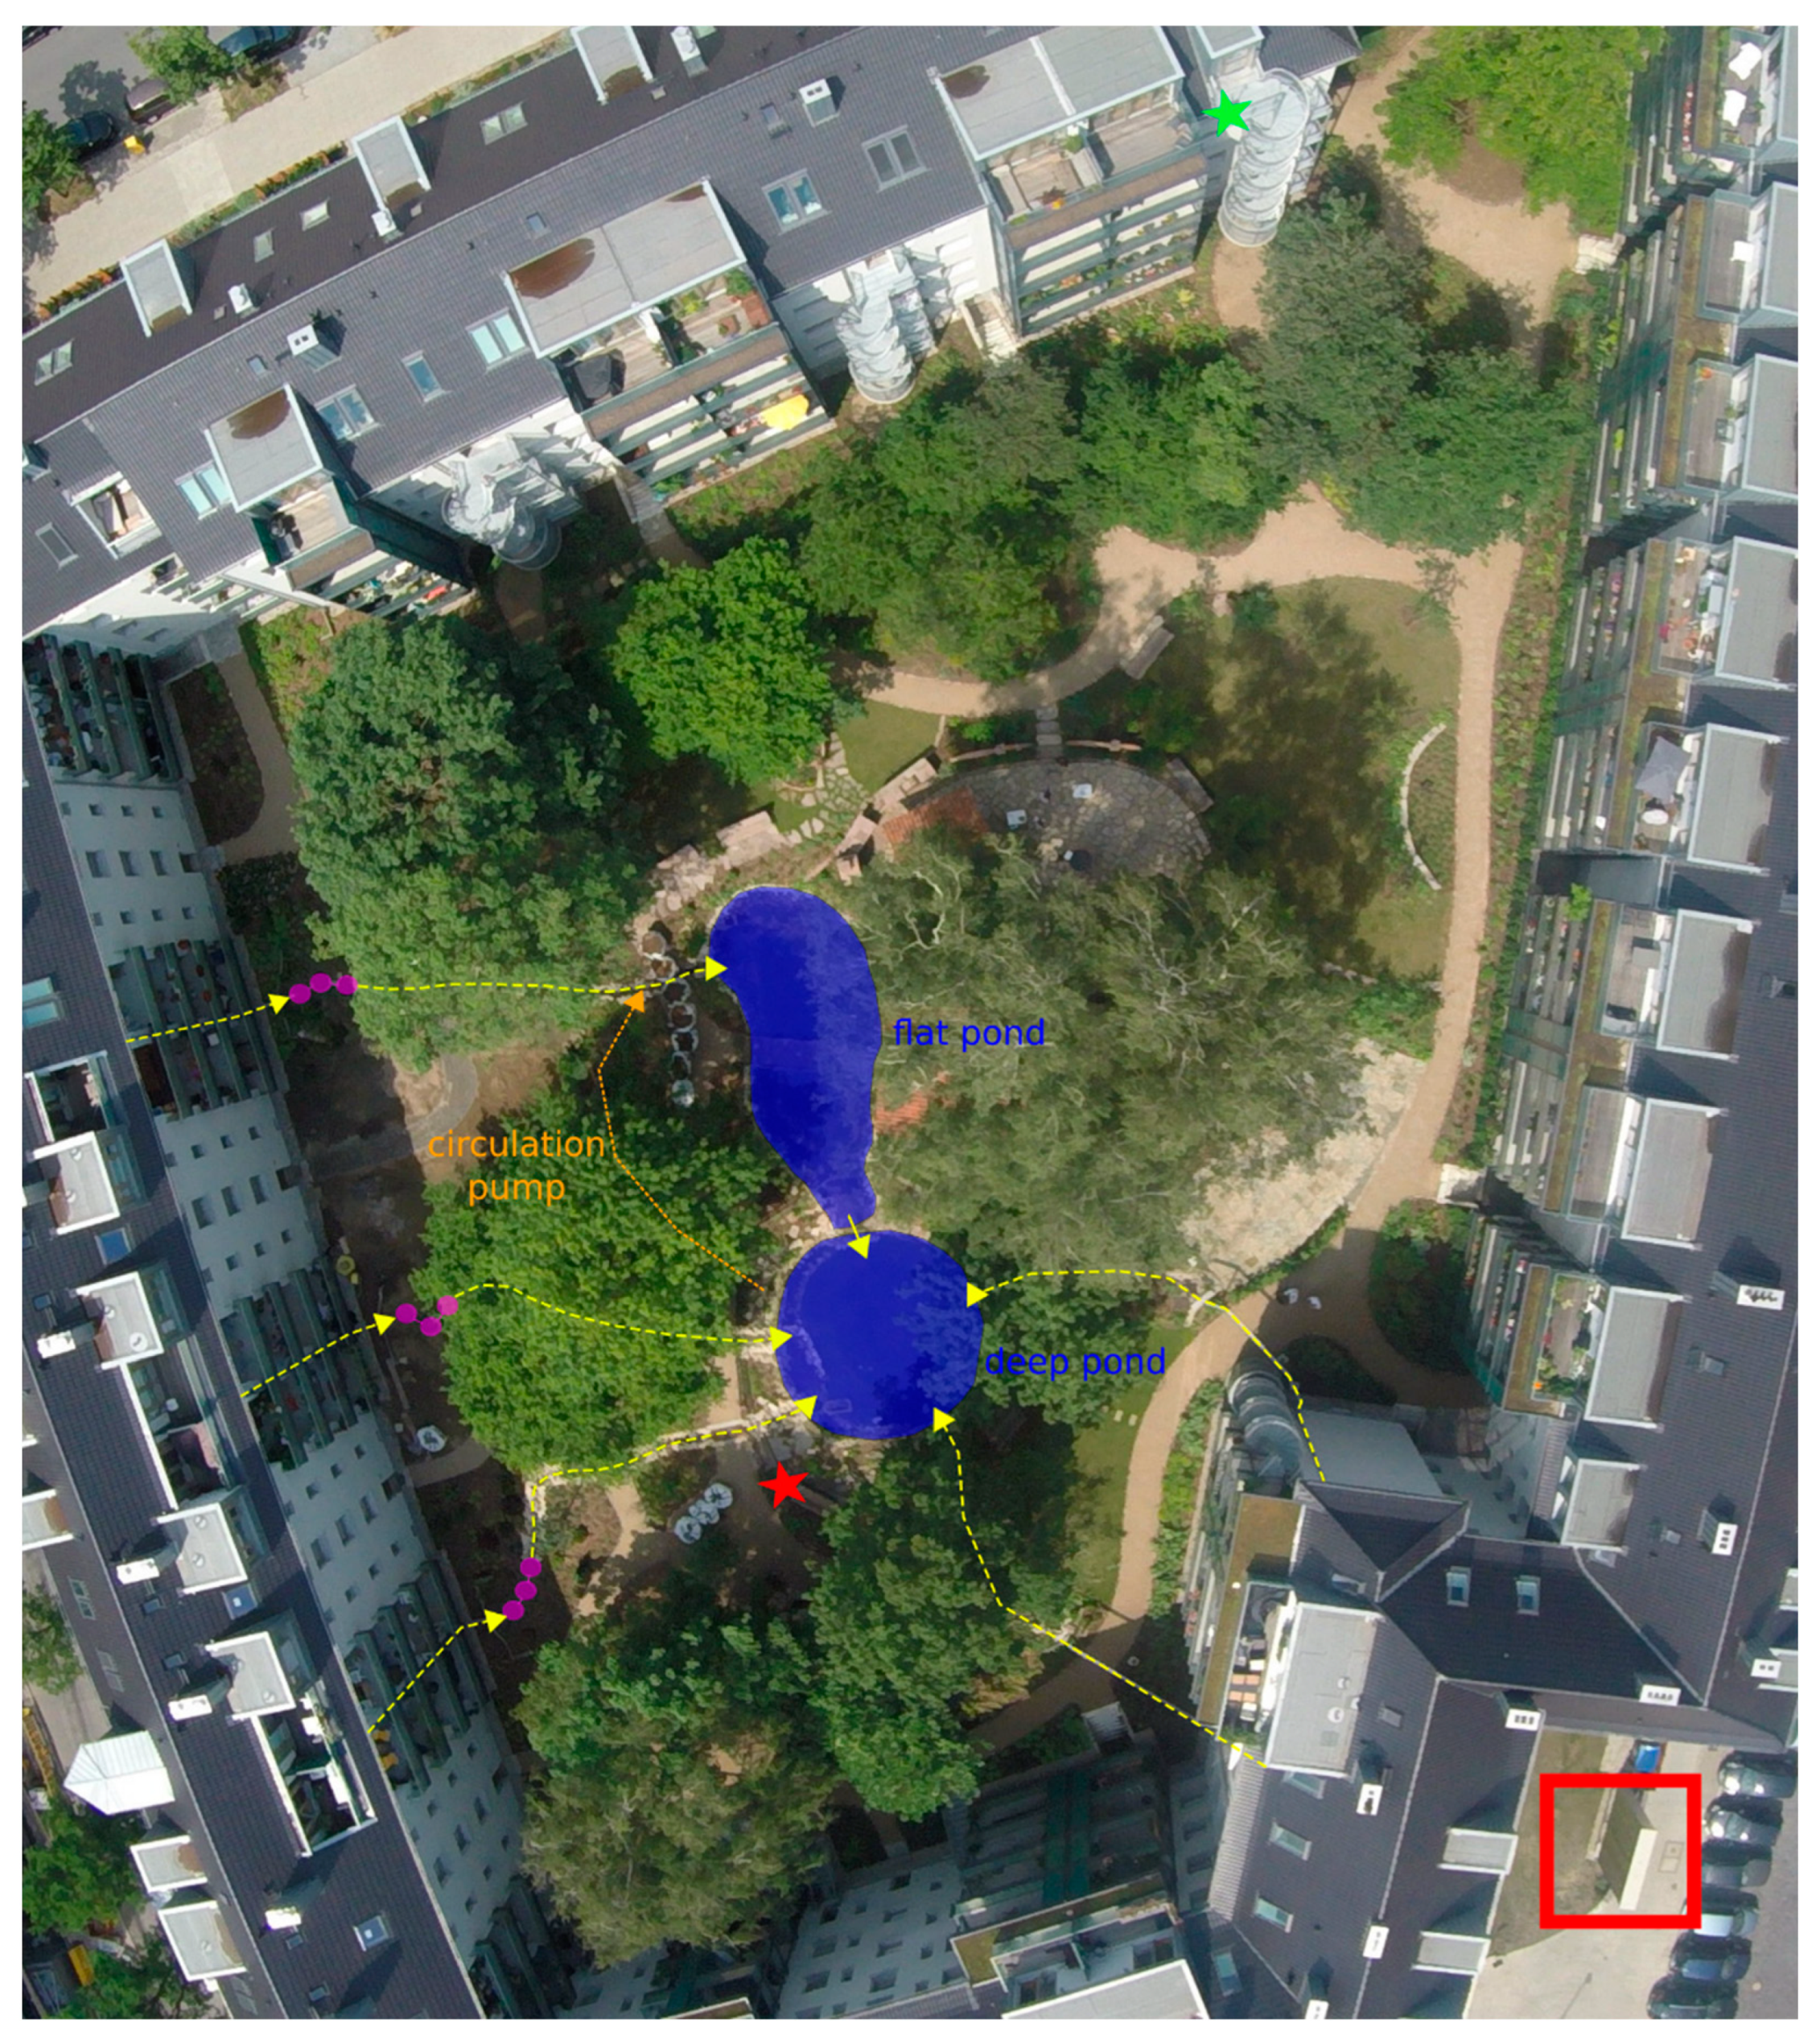
- an inner courtyard in the Südstadt district of Hannover, where blue elements (ponds and cisterns) and various greening measures were implemented in 2019 (so-called “Blue Courtyard”).
- In comparison, measurements were conducted at a courtyard in Hannover Linden, which was only equipped with green elements (referred to as the “green courtyard”).
2. Materials and Methods
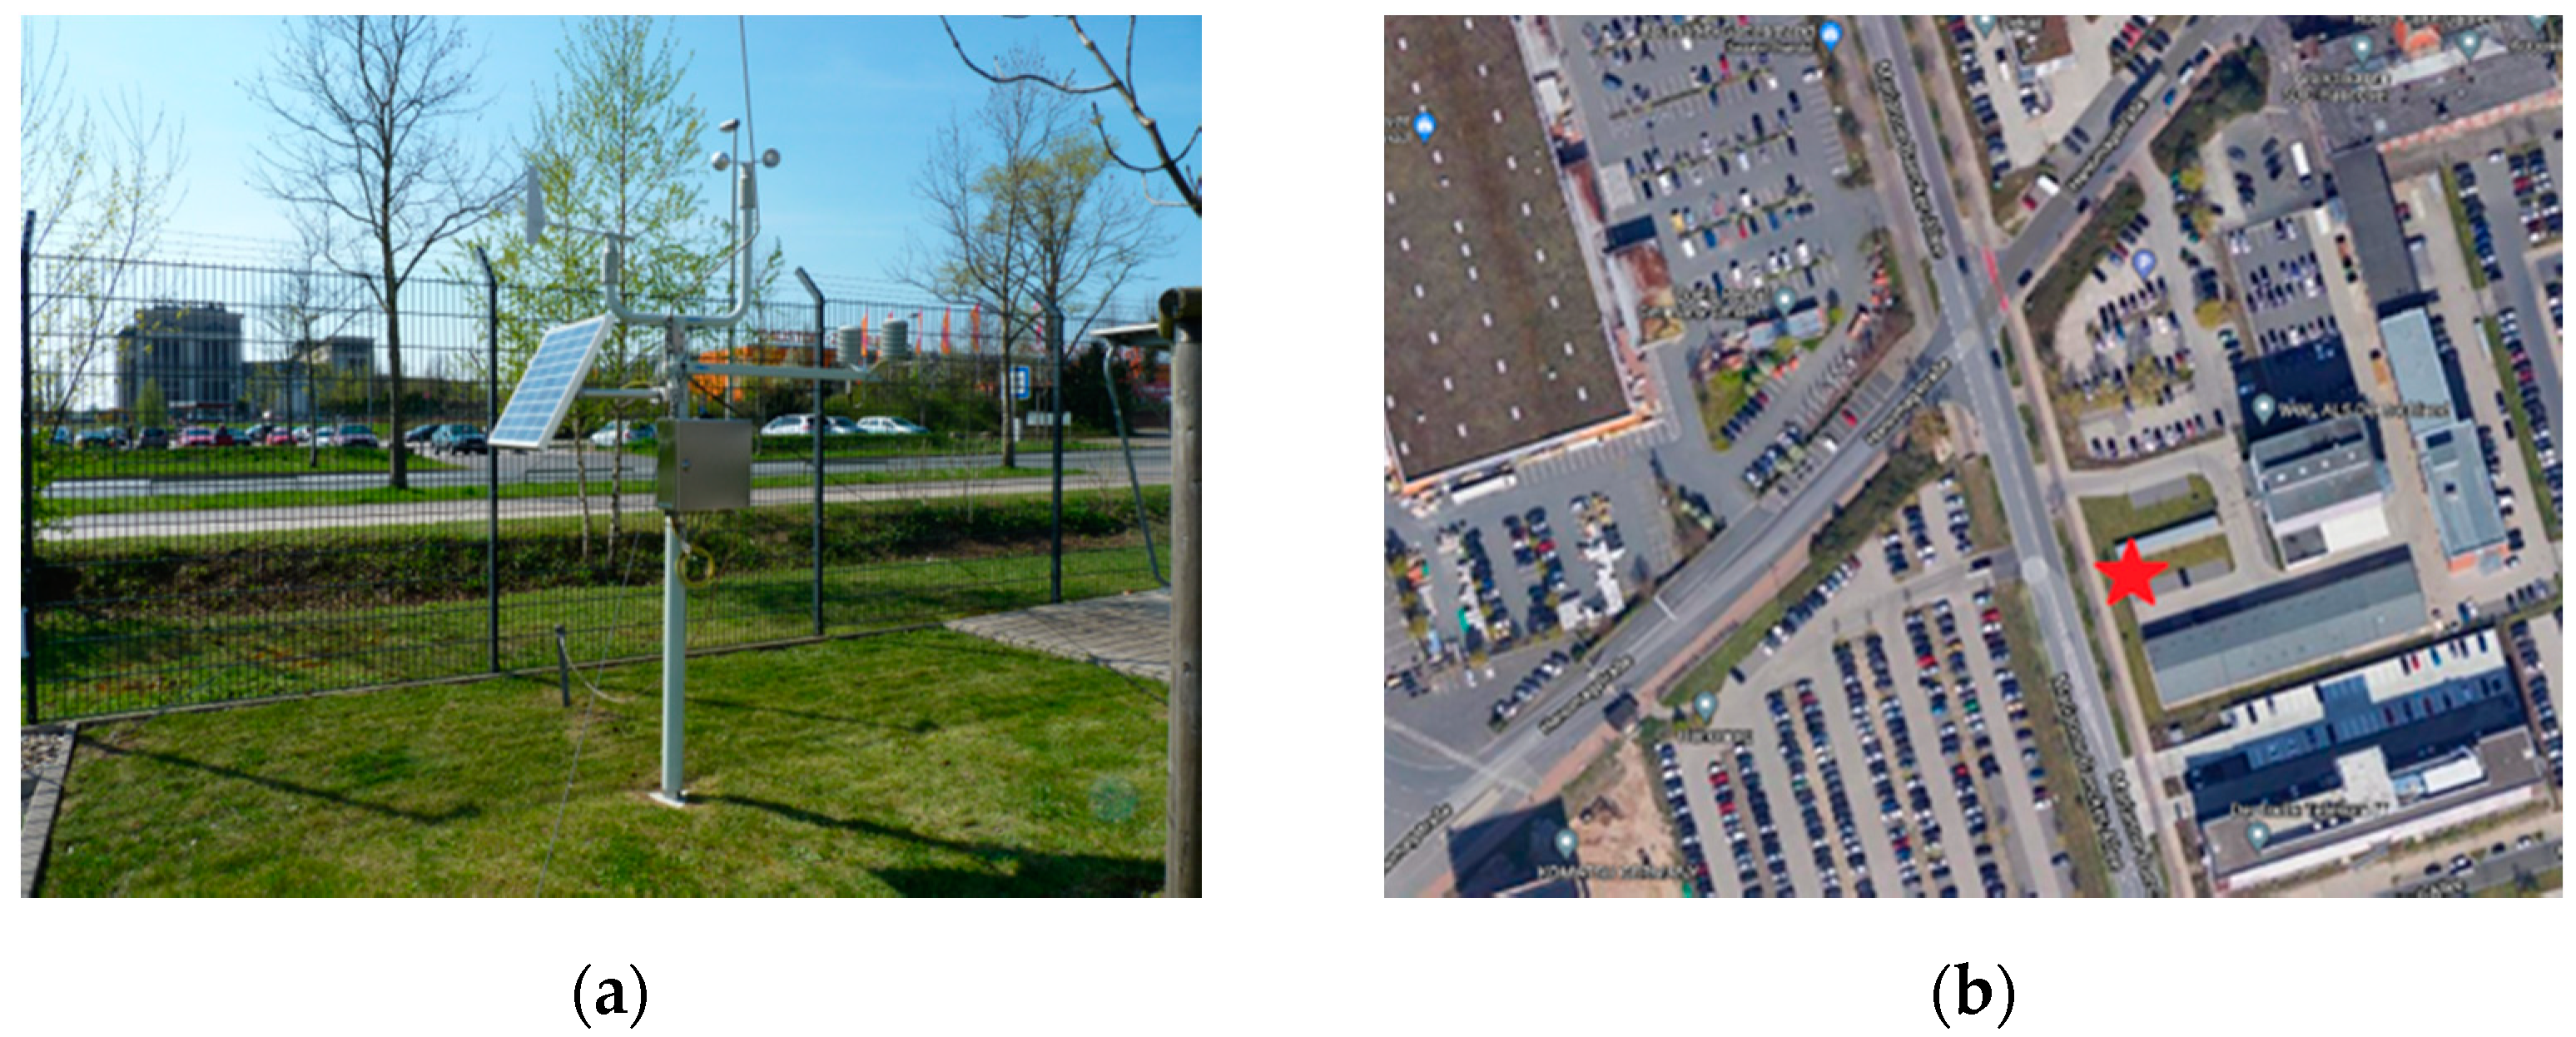
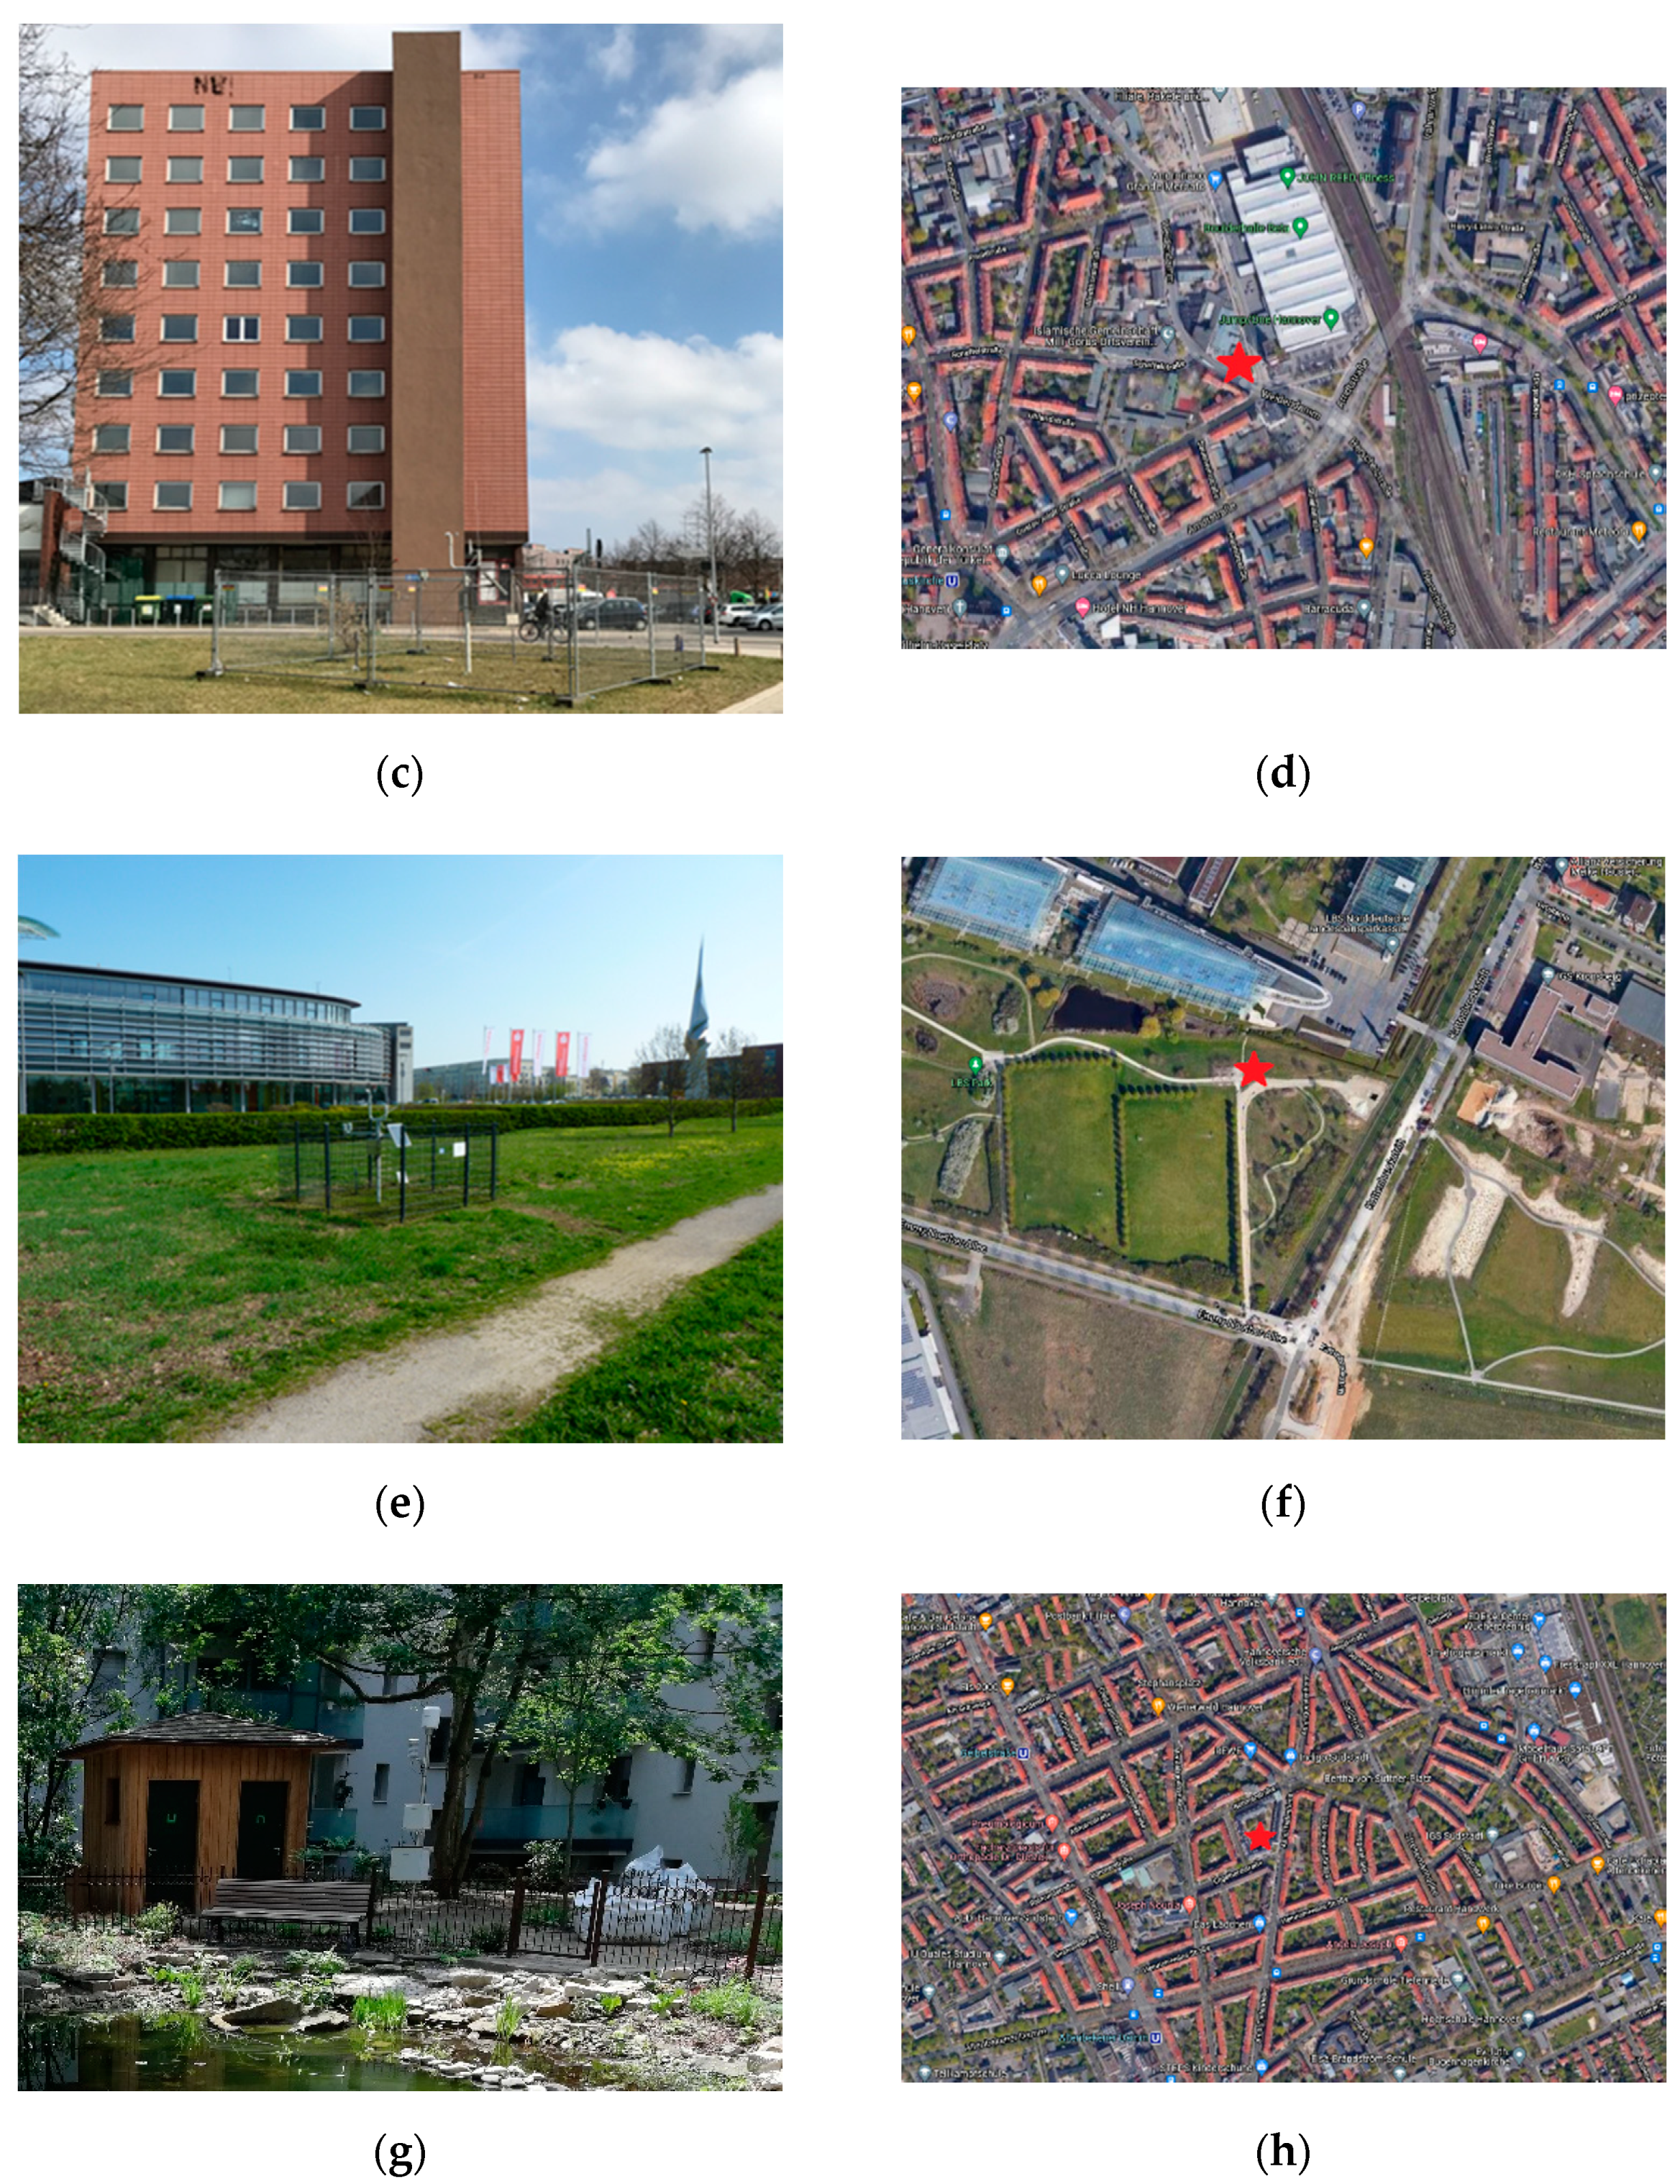
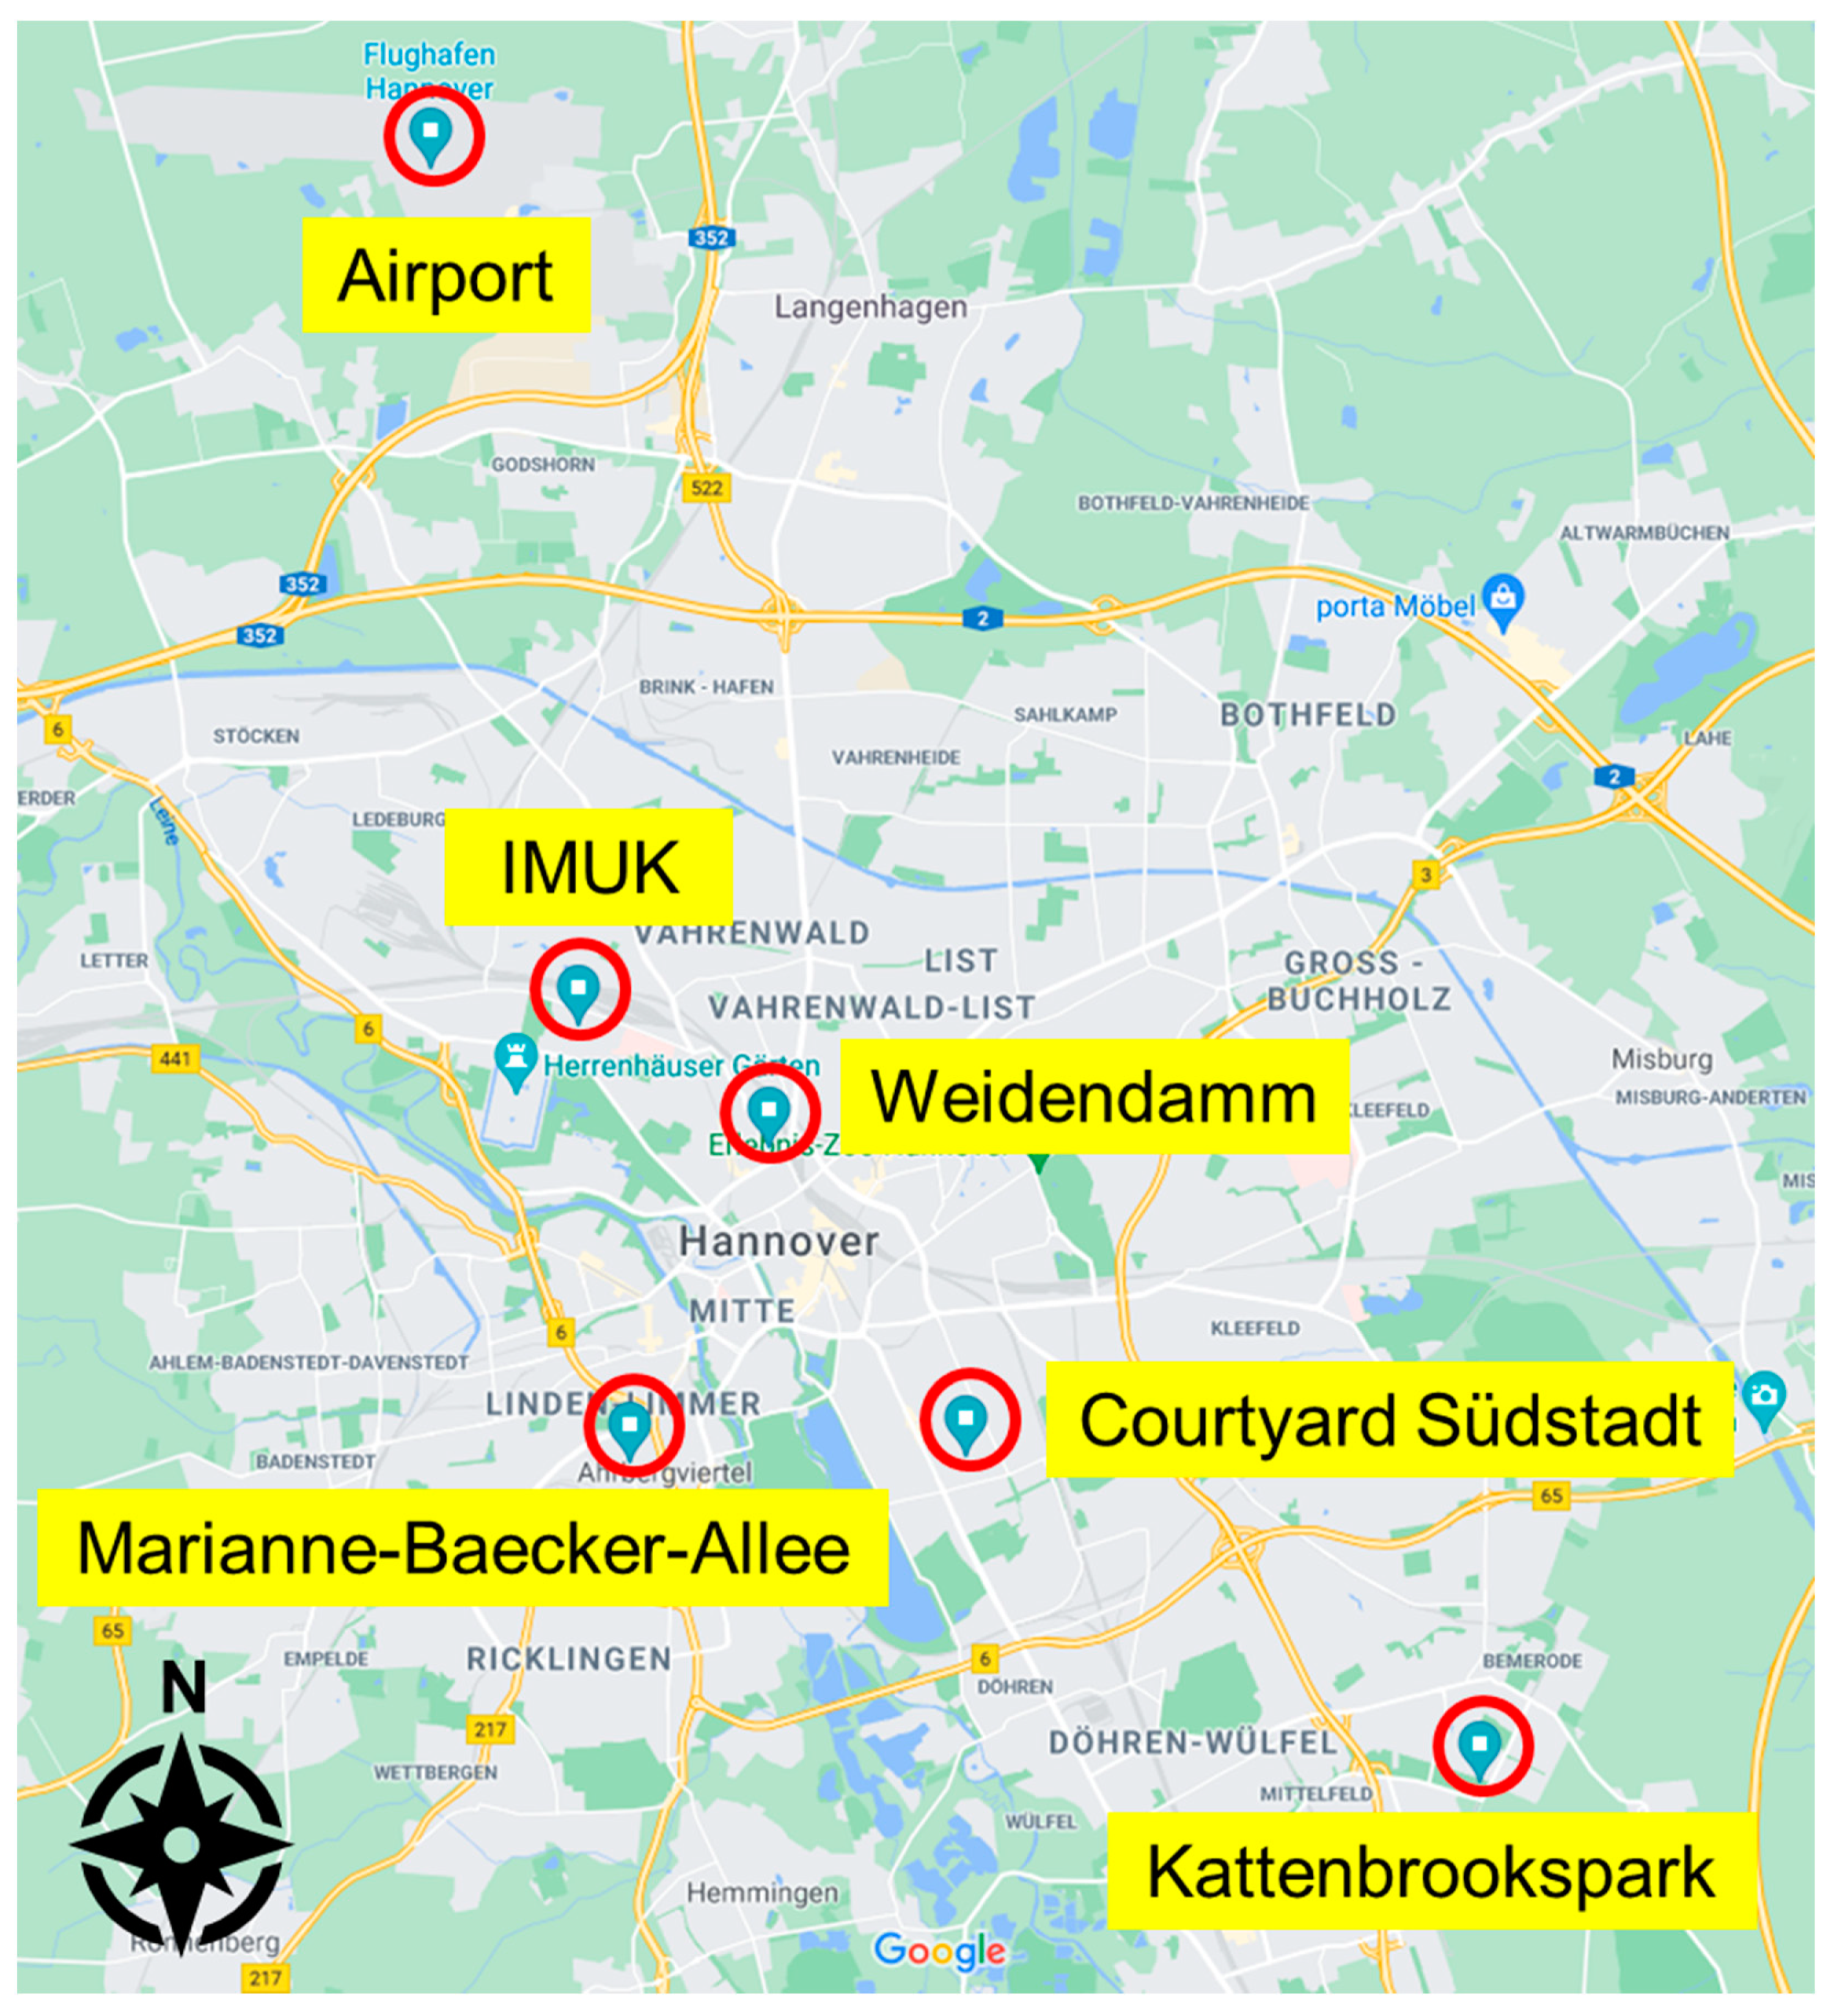
2.1. Observation Area
2.2. Weather Stations
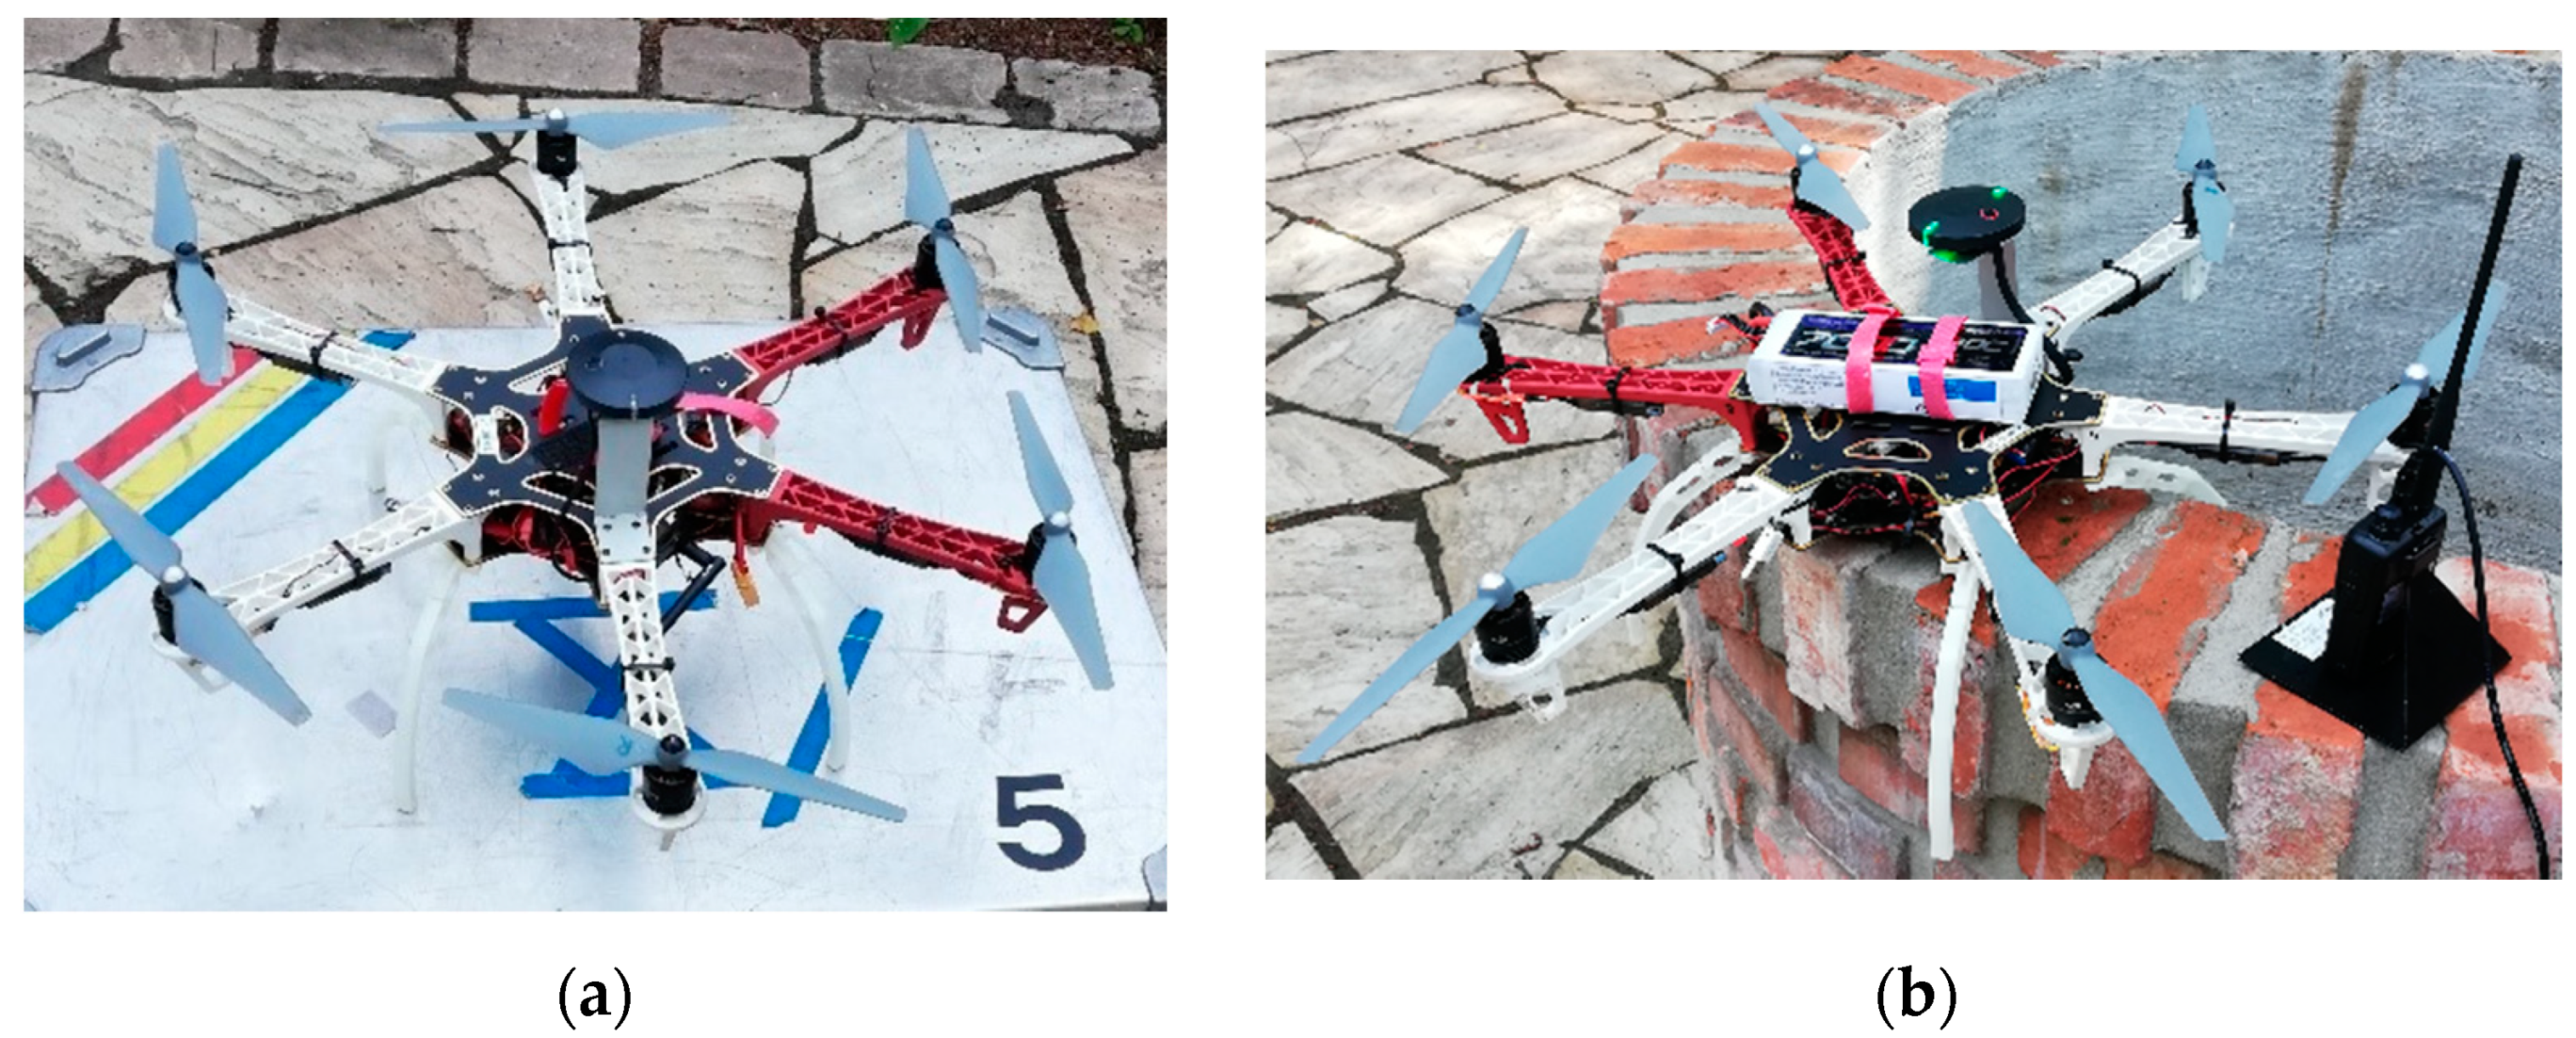
2.3. Drone Measurement
2.4. PALM-4U Model Description
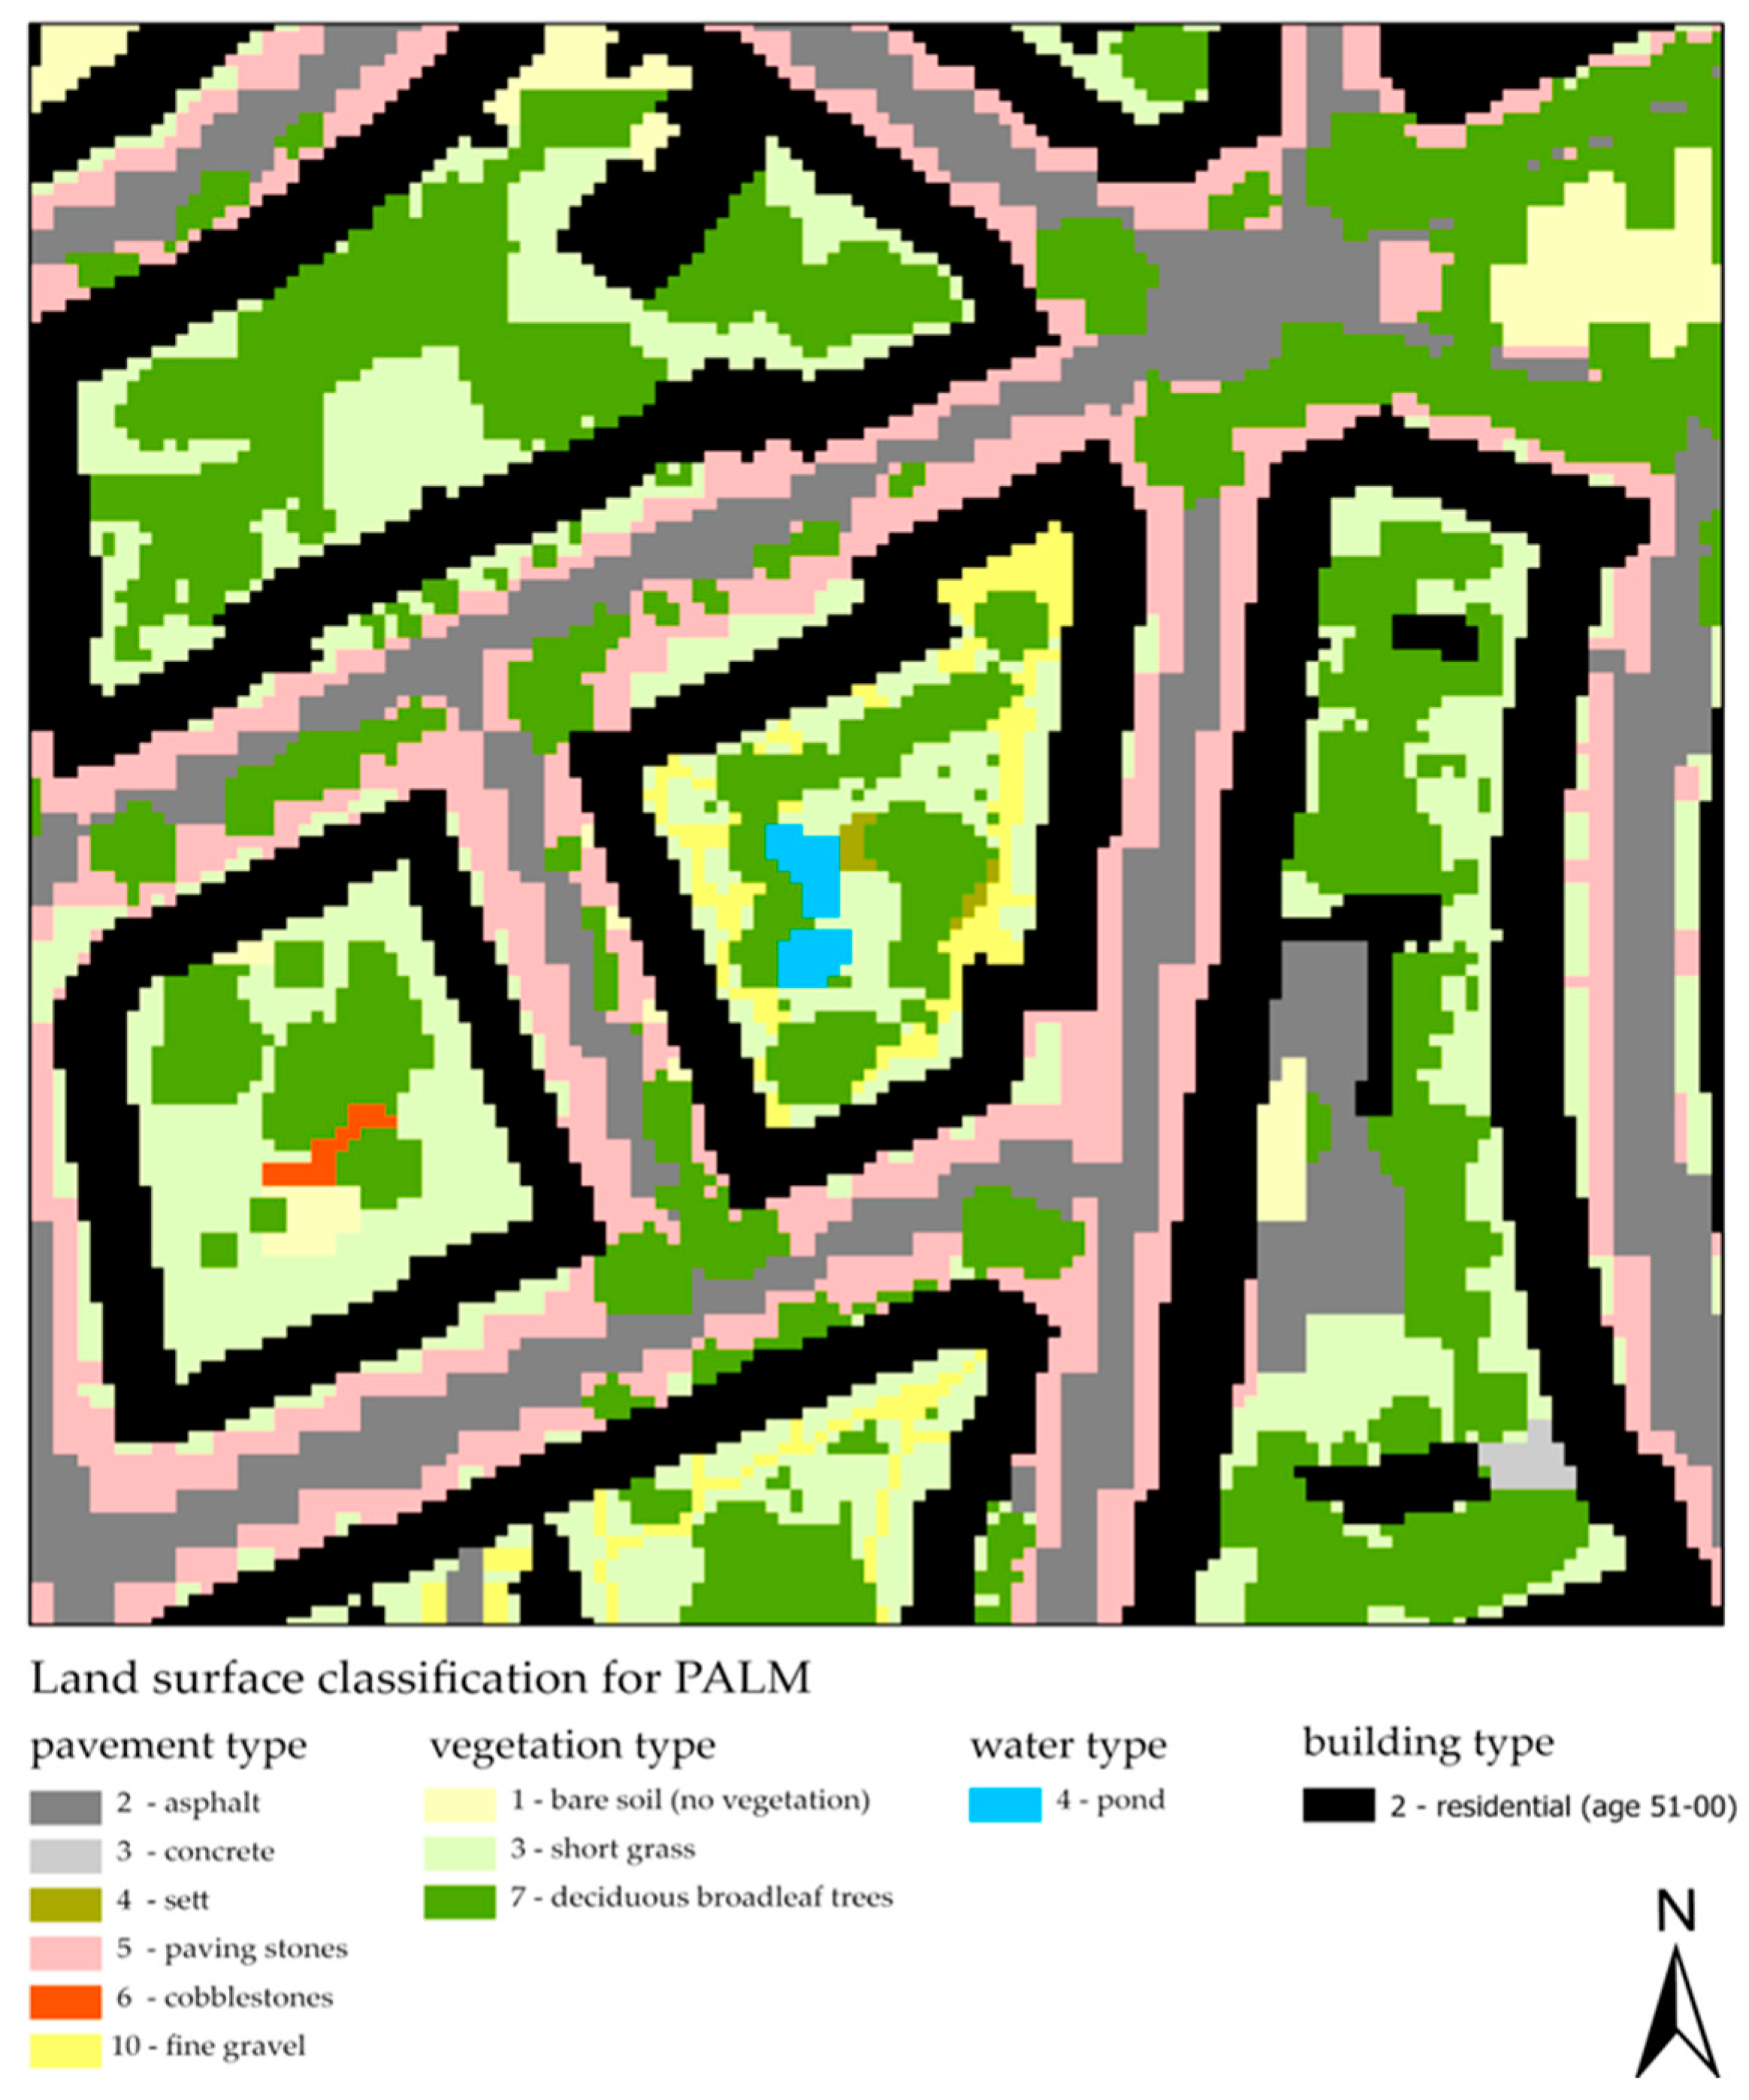
2.4.1. Input Data
- elevation
- surface layer properties (vegetation, pavement, water)
- buildings (footprint and height)
- soil
- 3D vegetation (optional)
- 3D buildings (optional)
2.4.2. Model Setup
3. Results
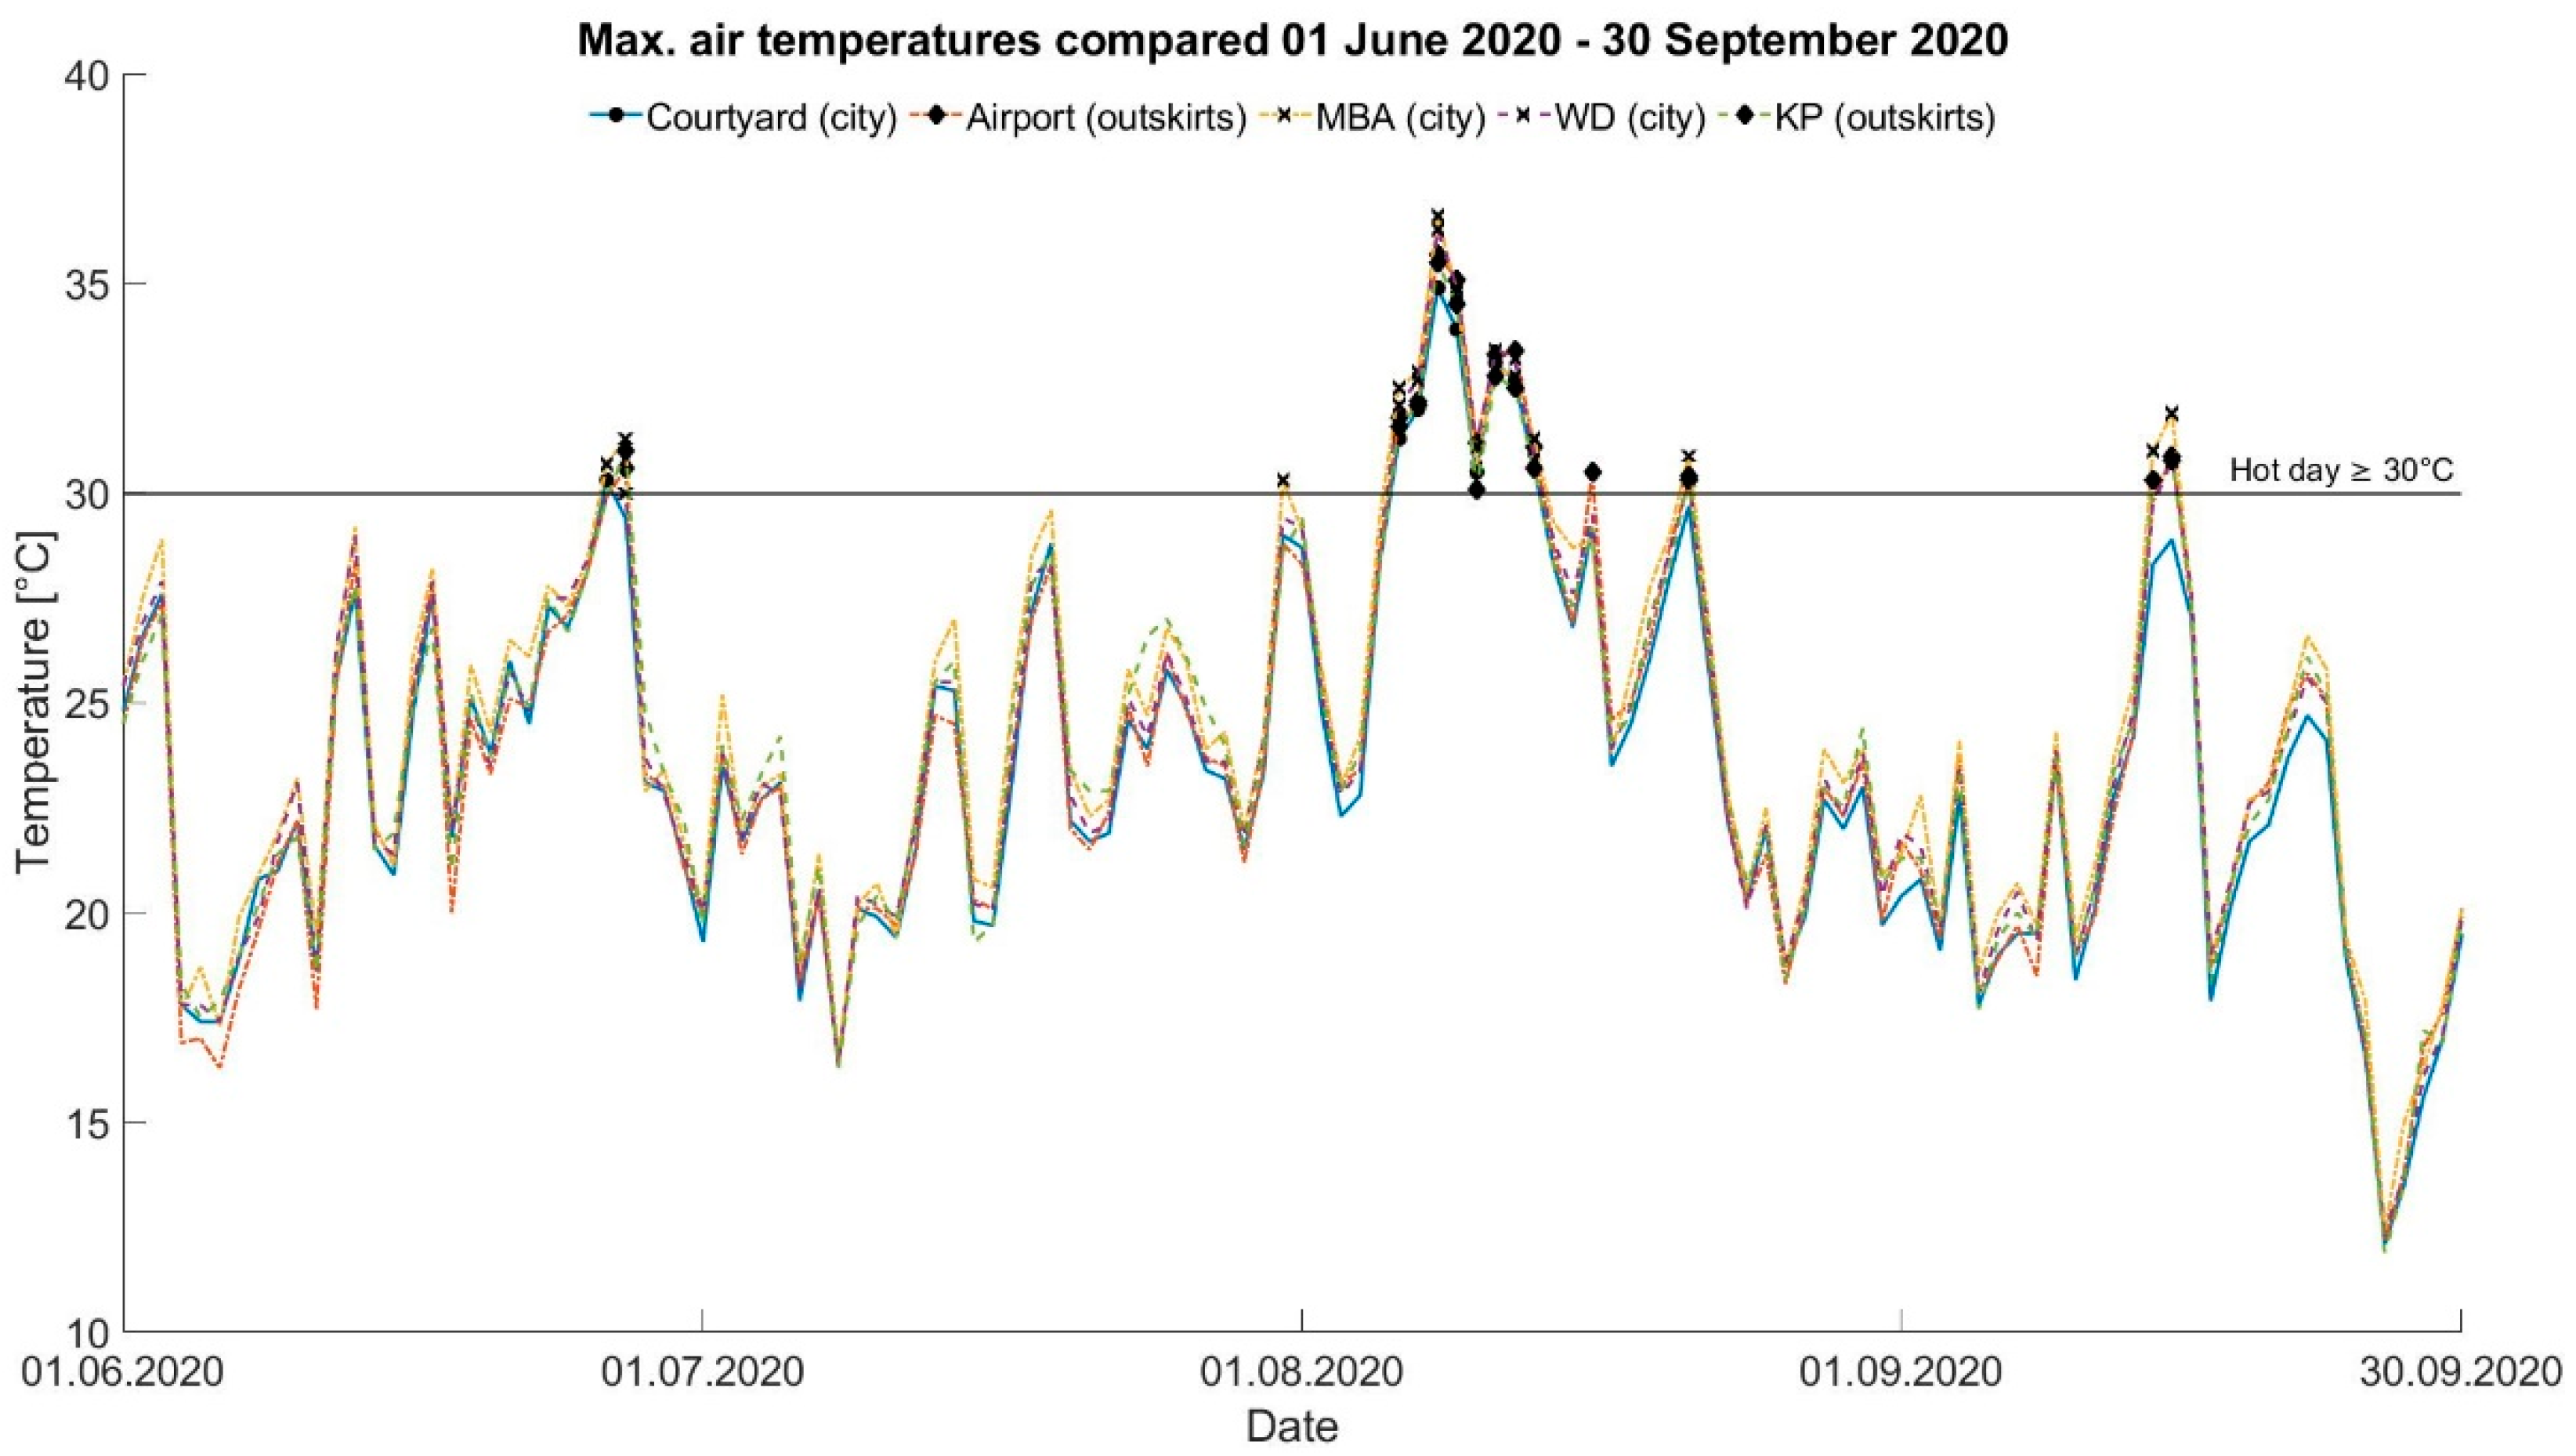
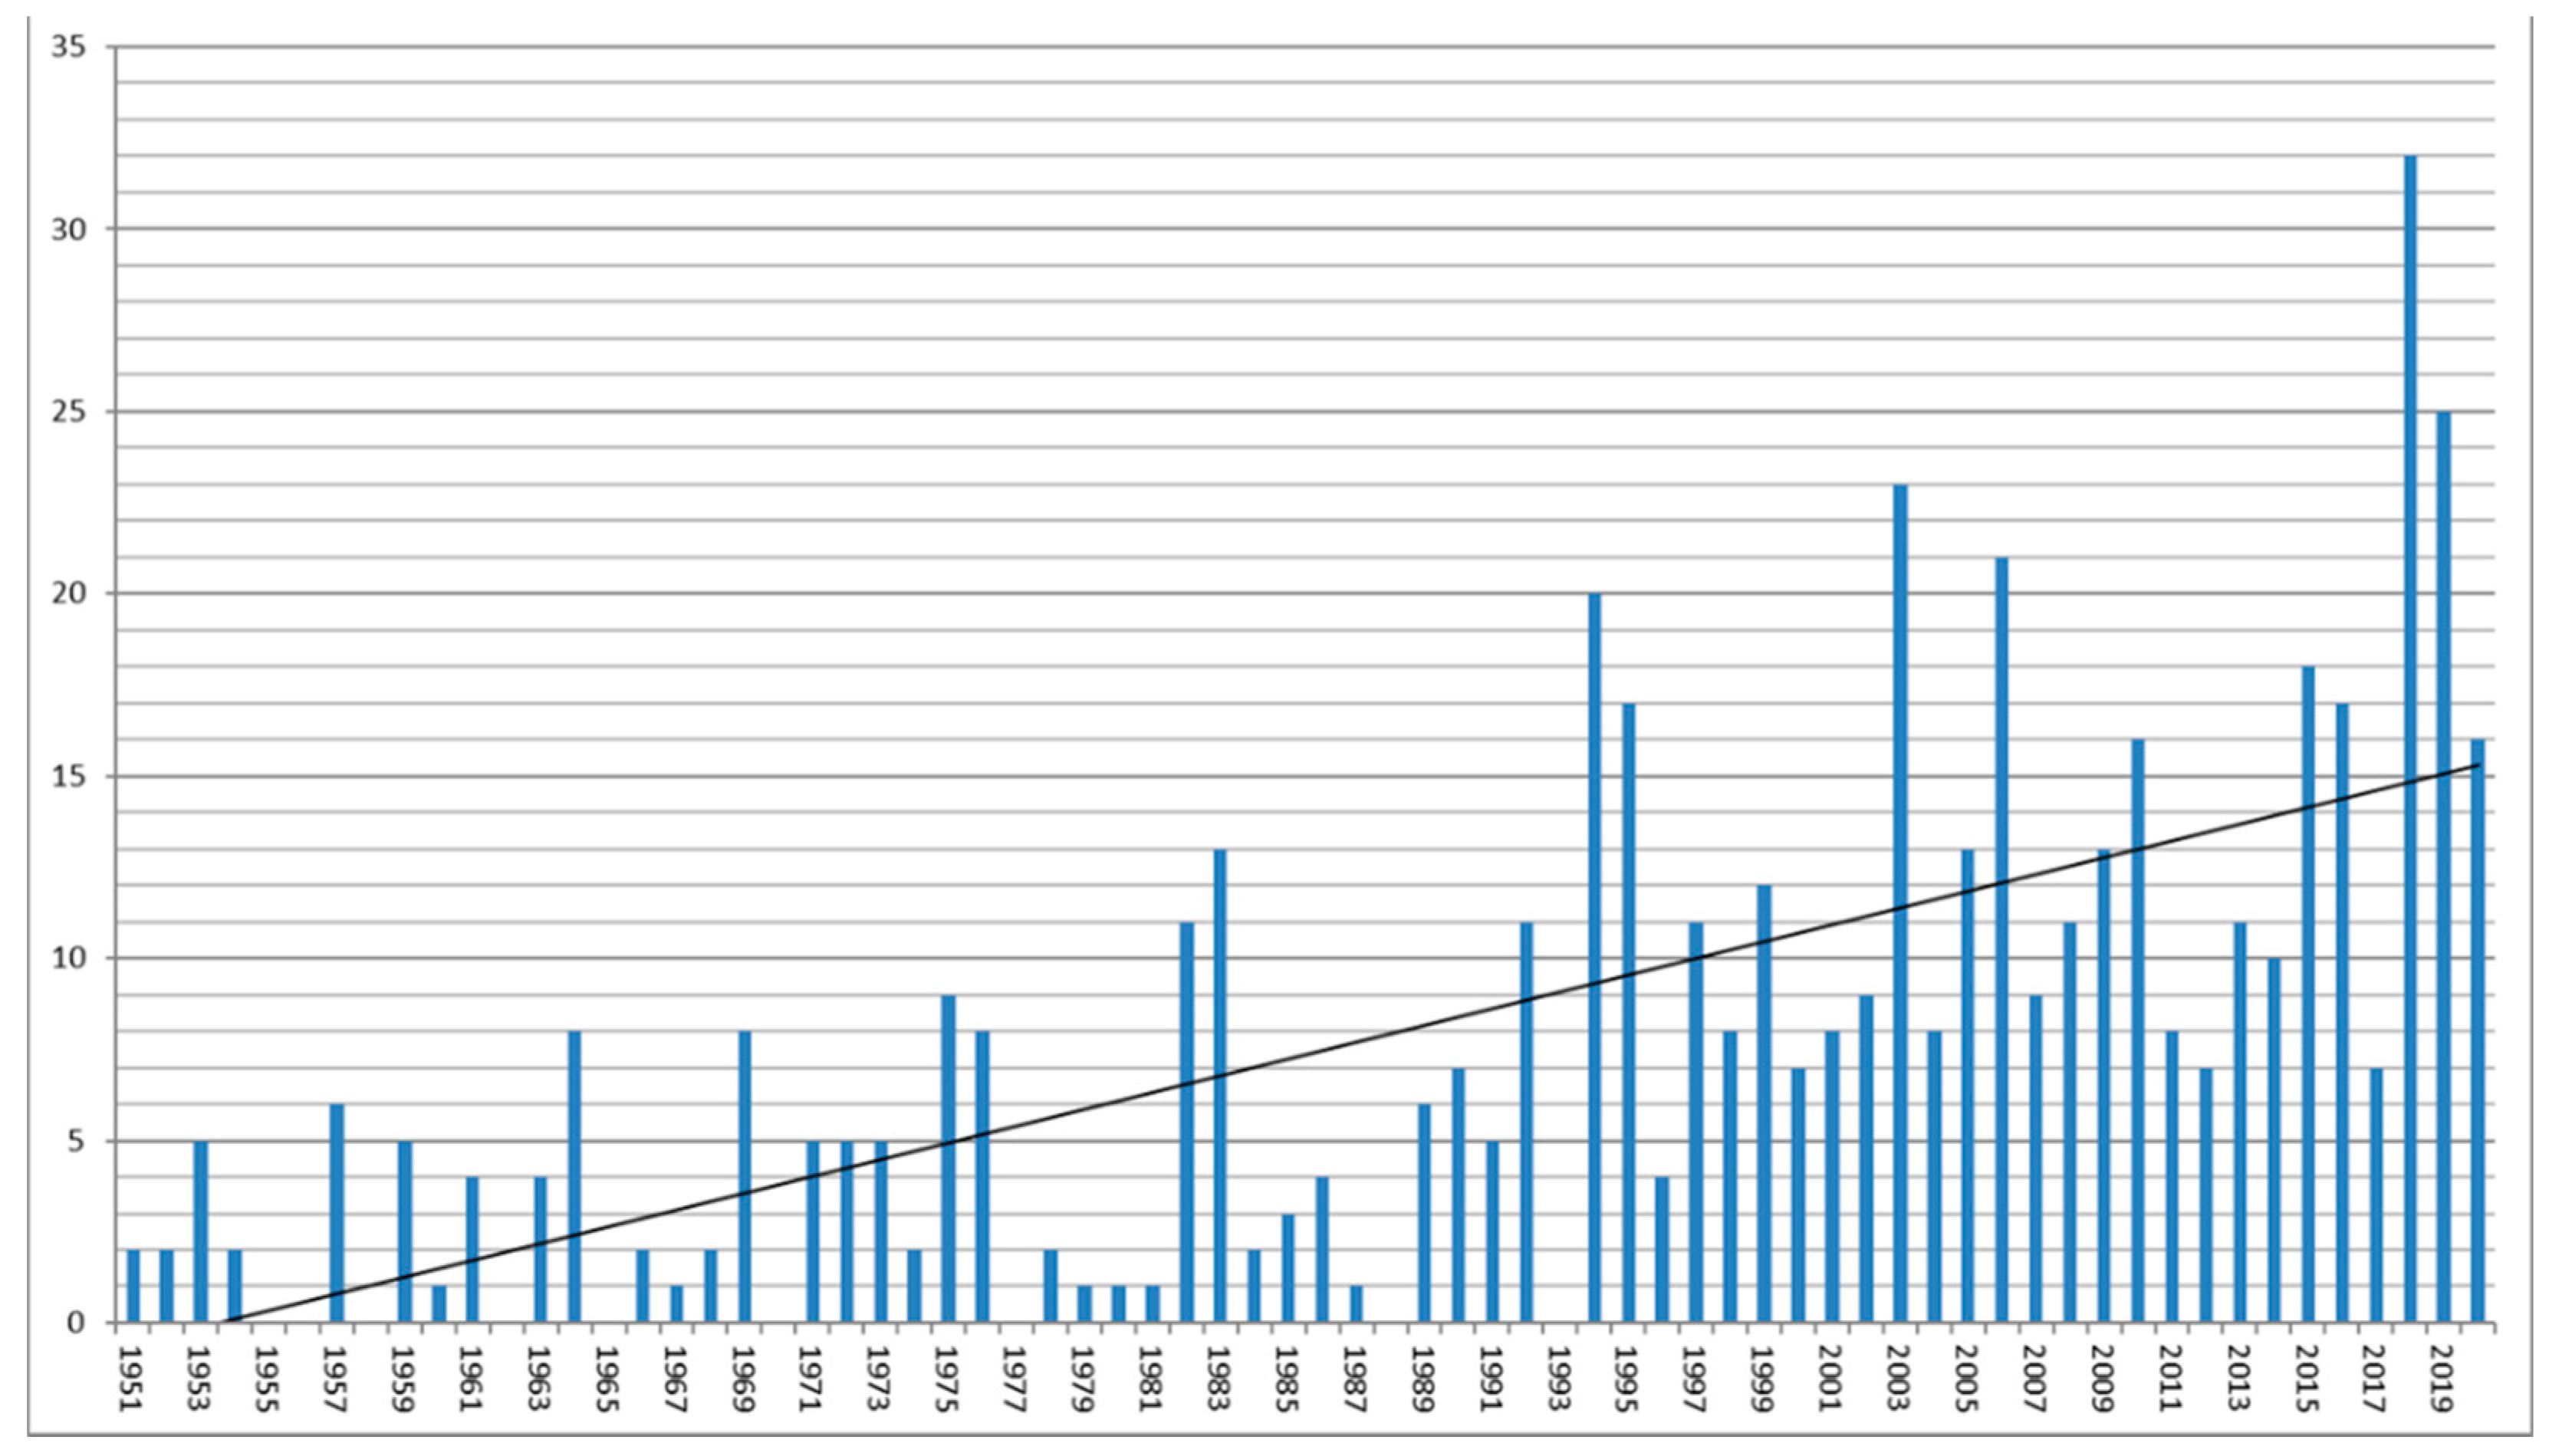
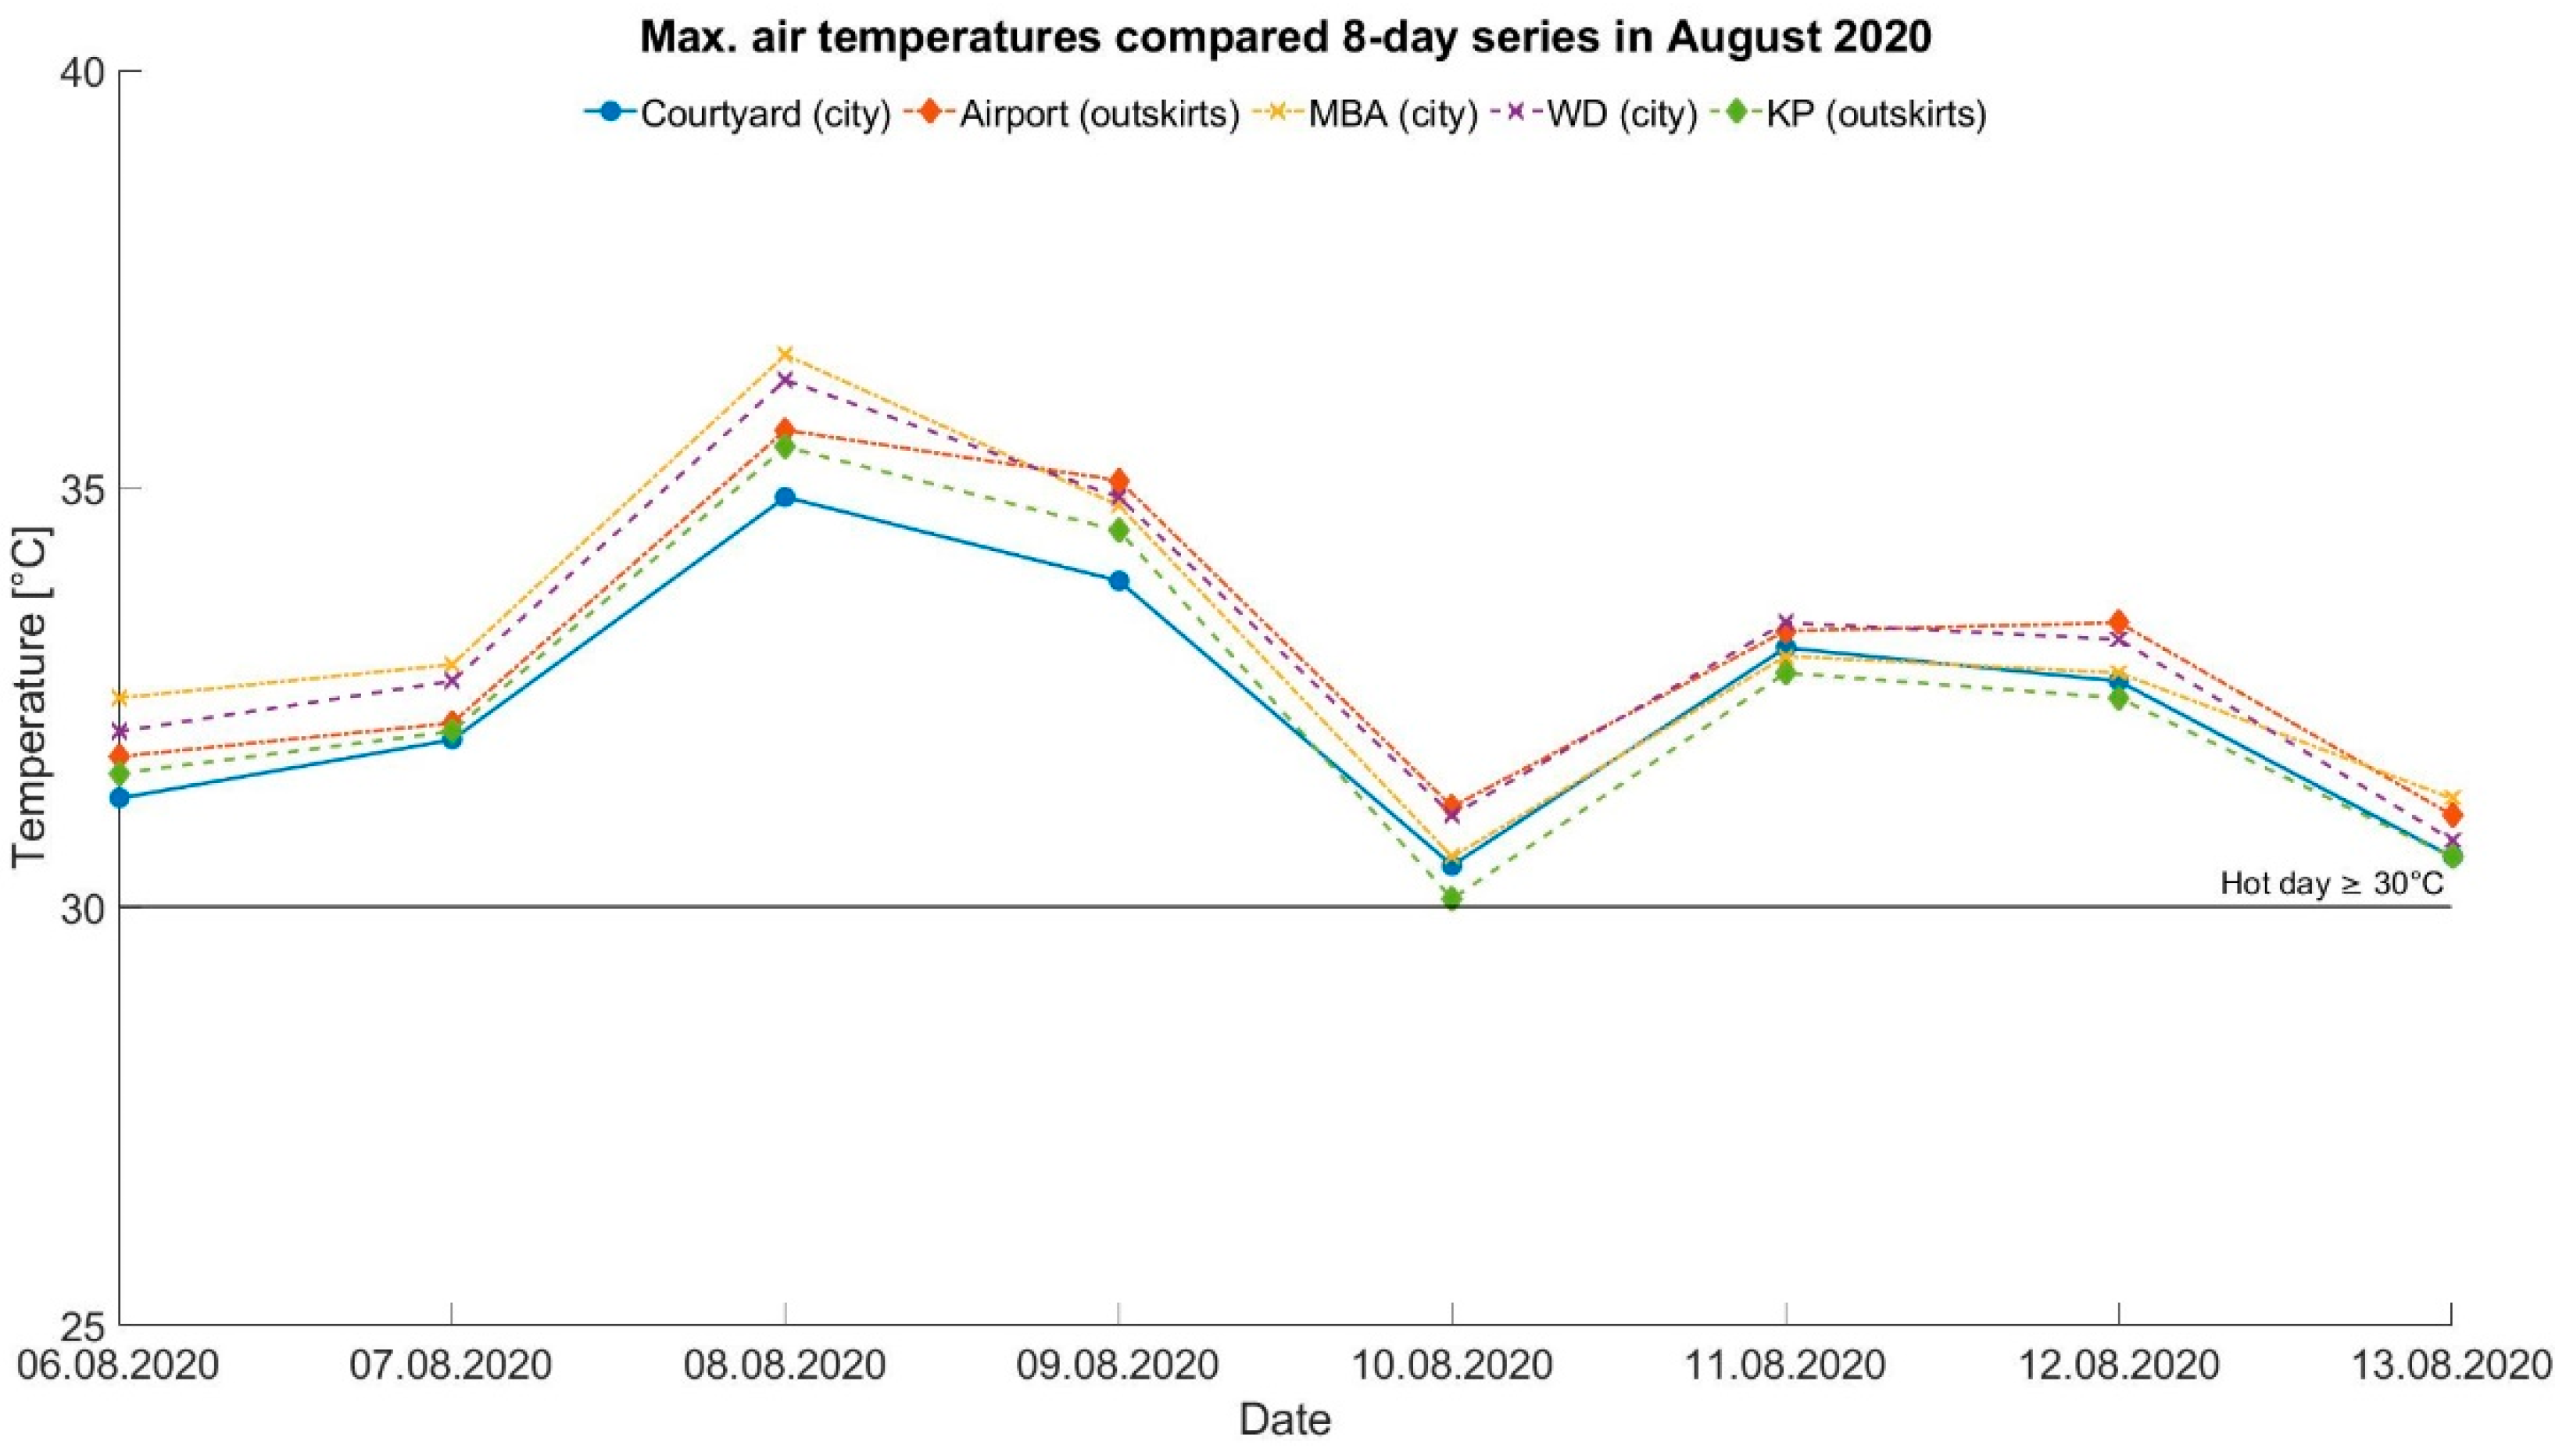
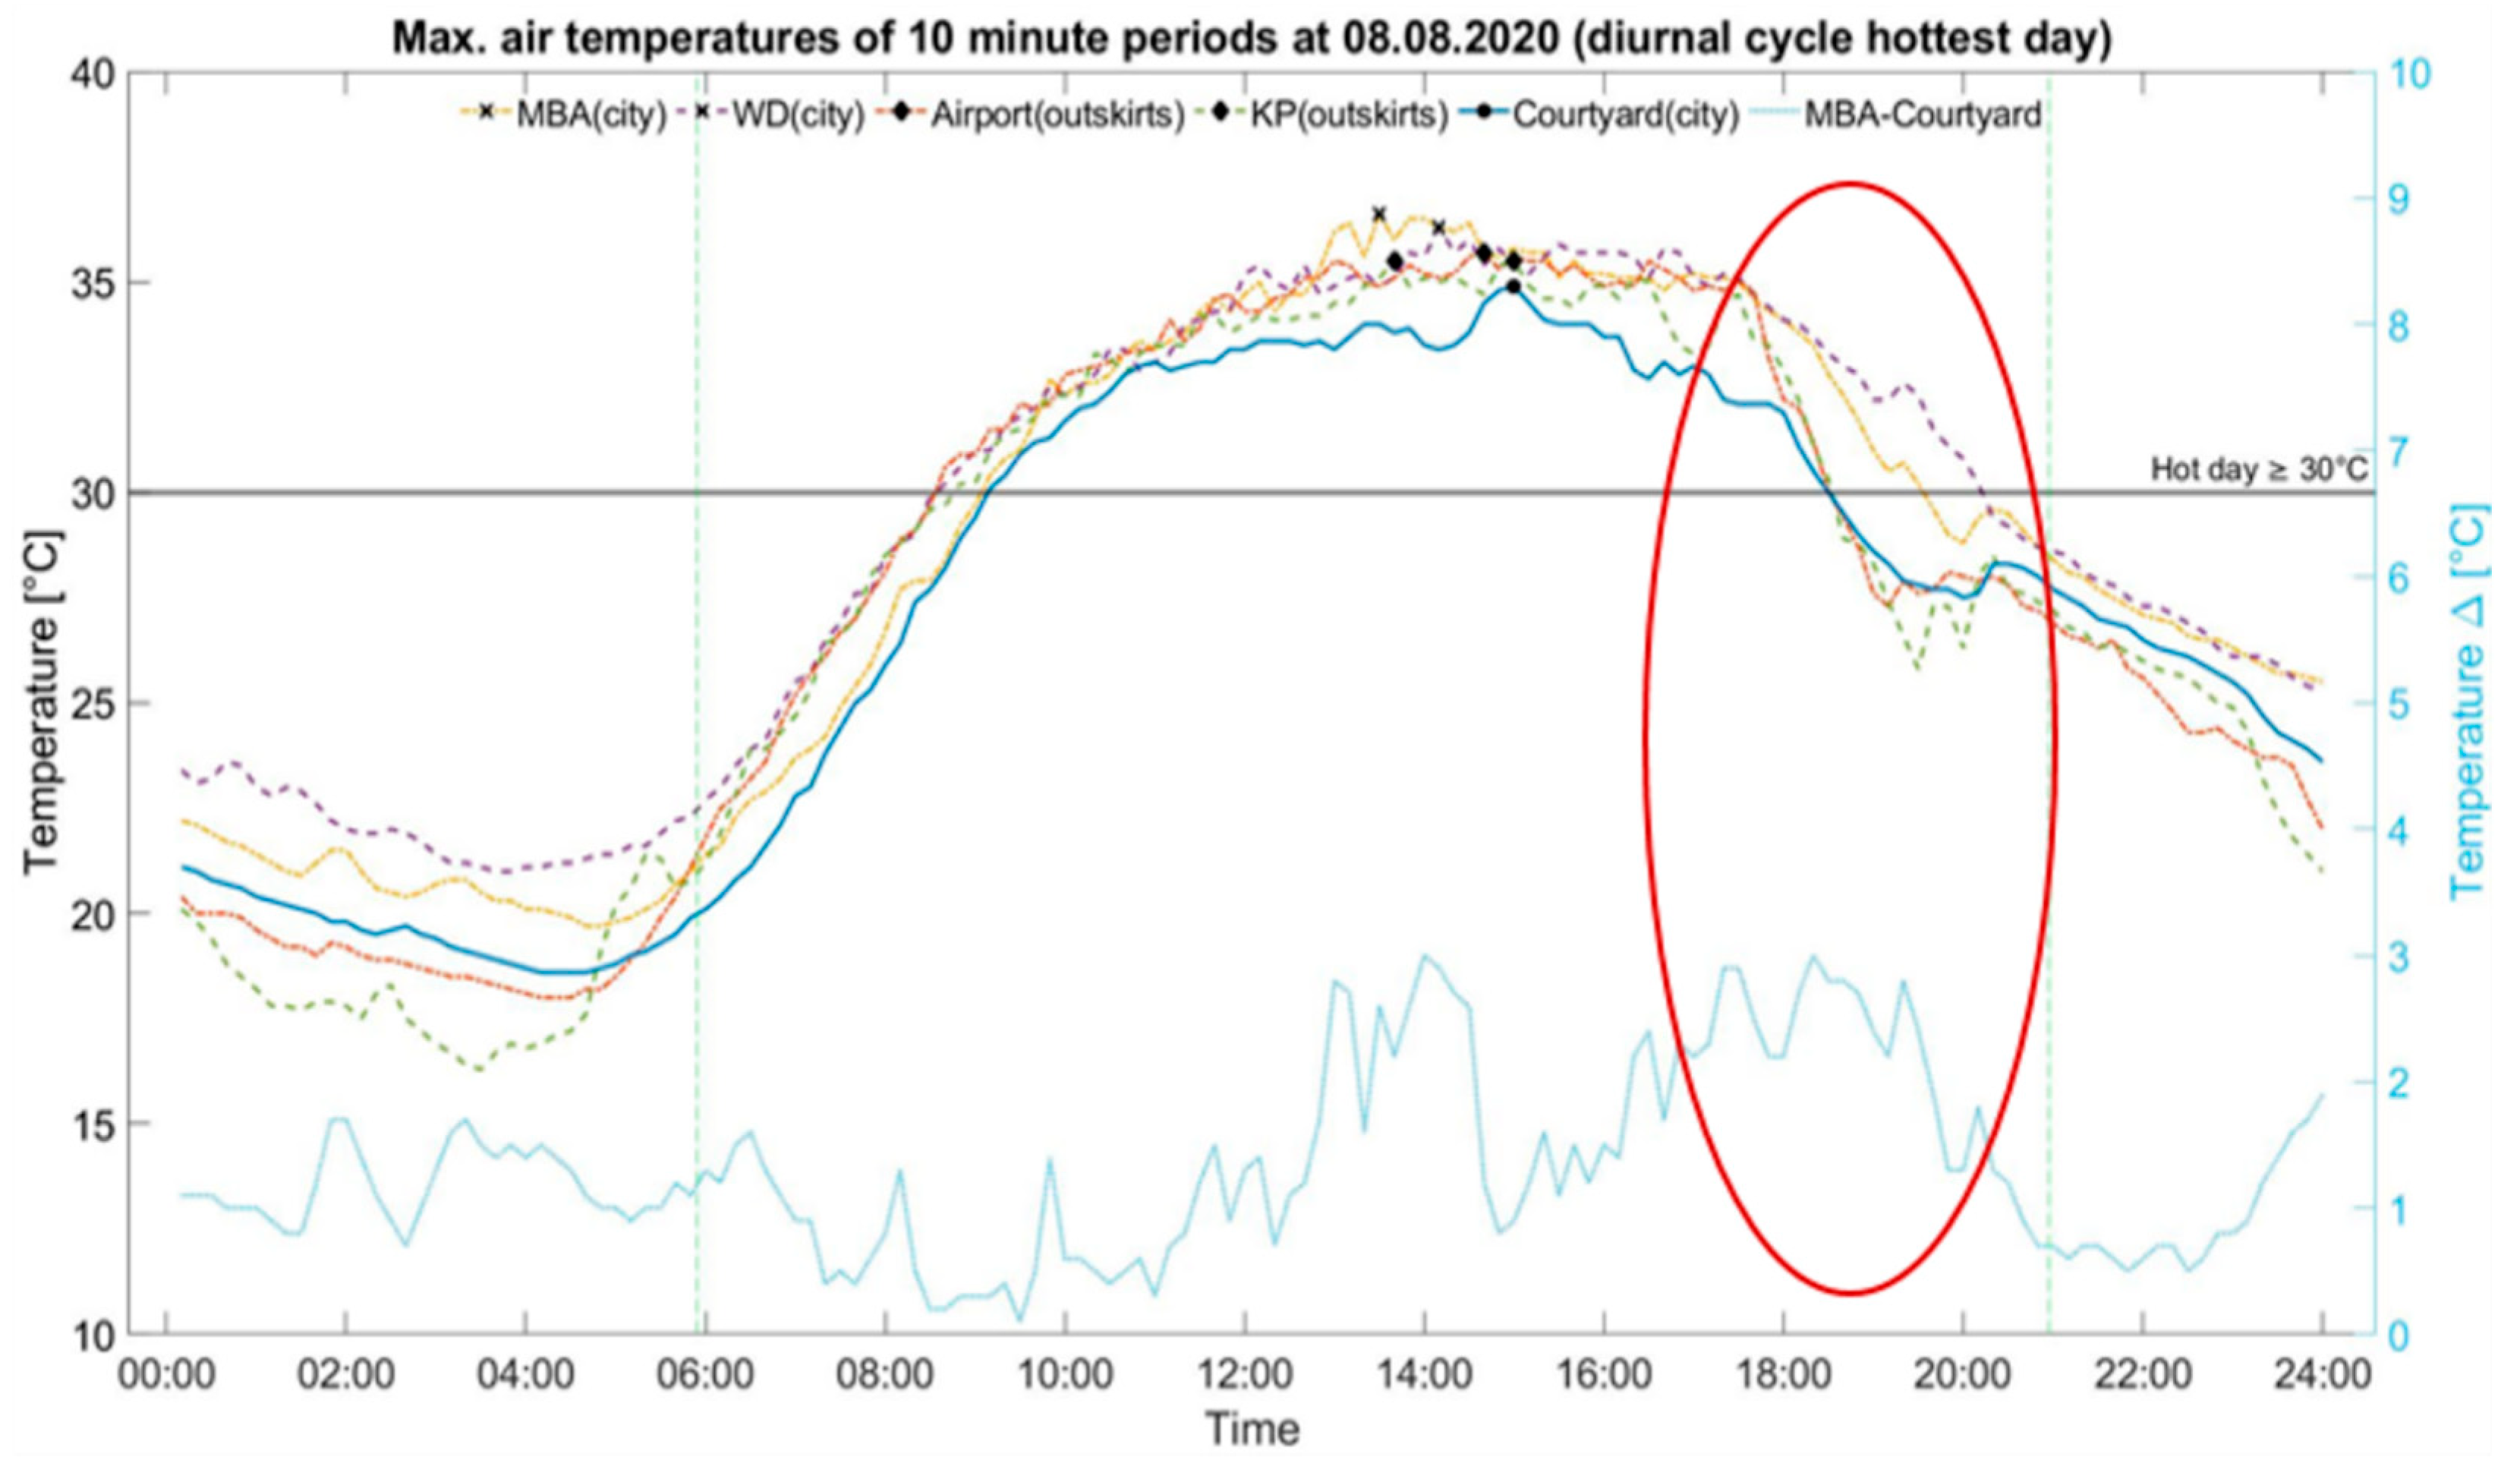
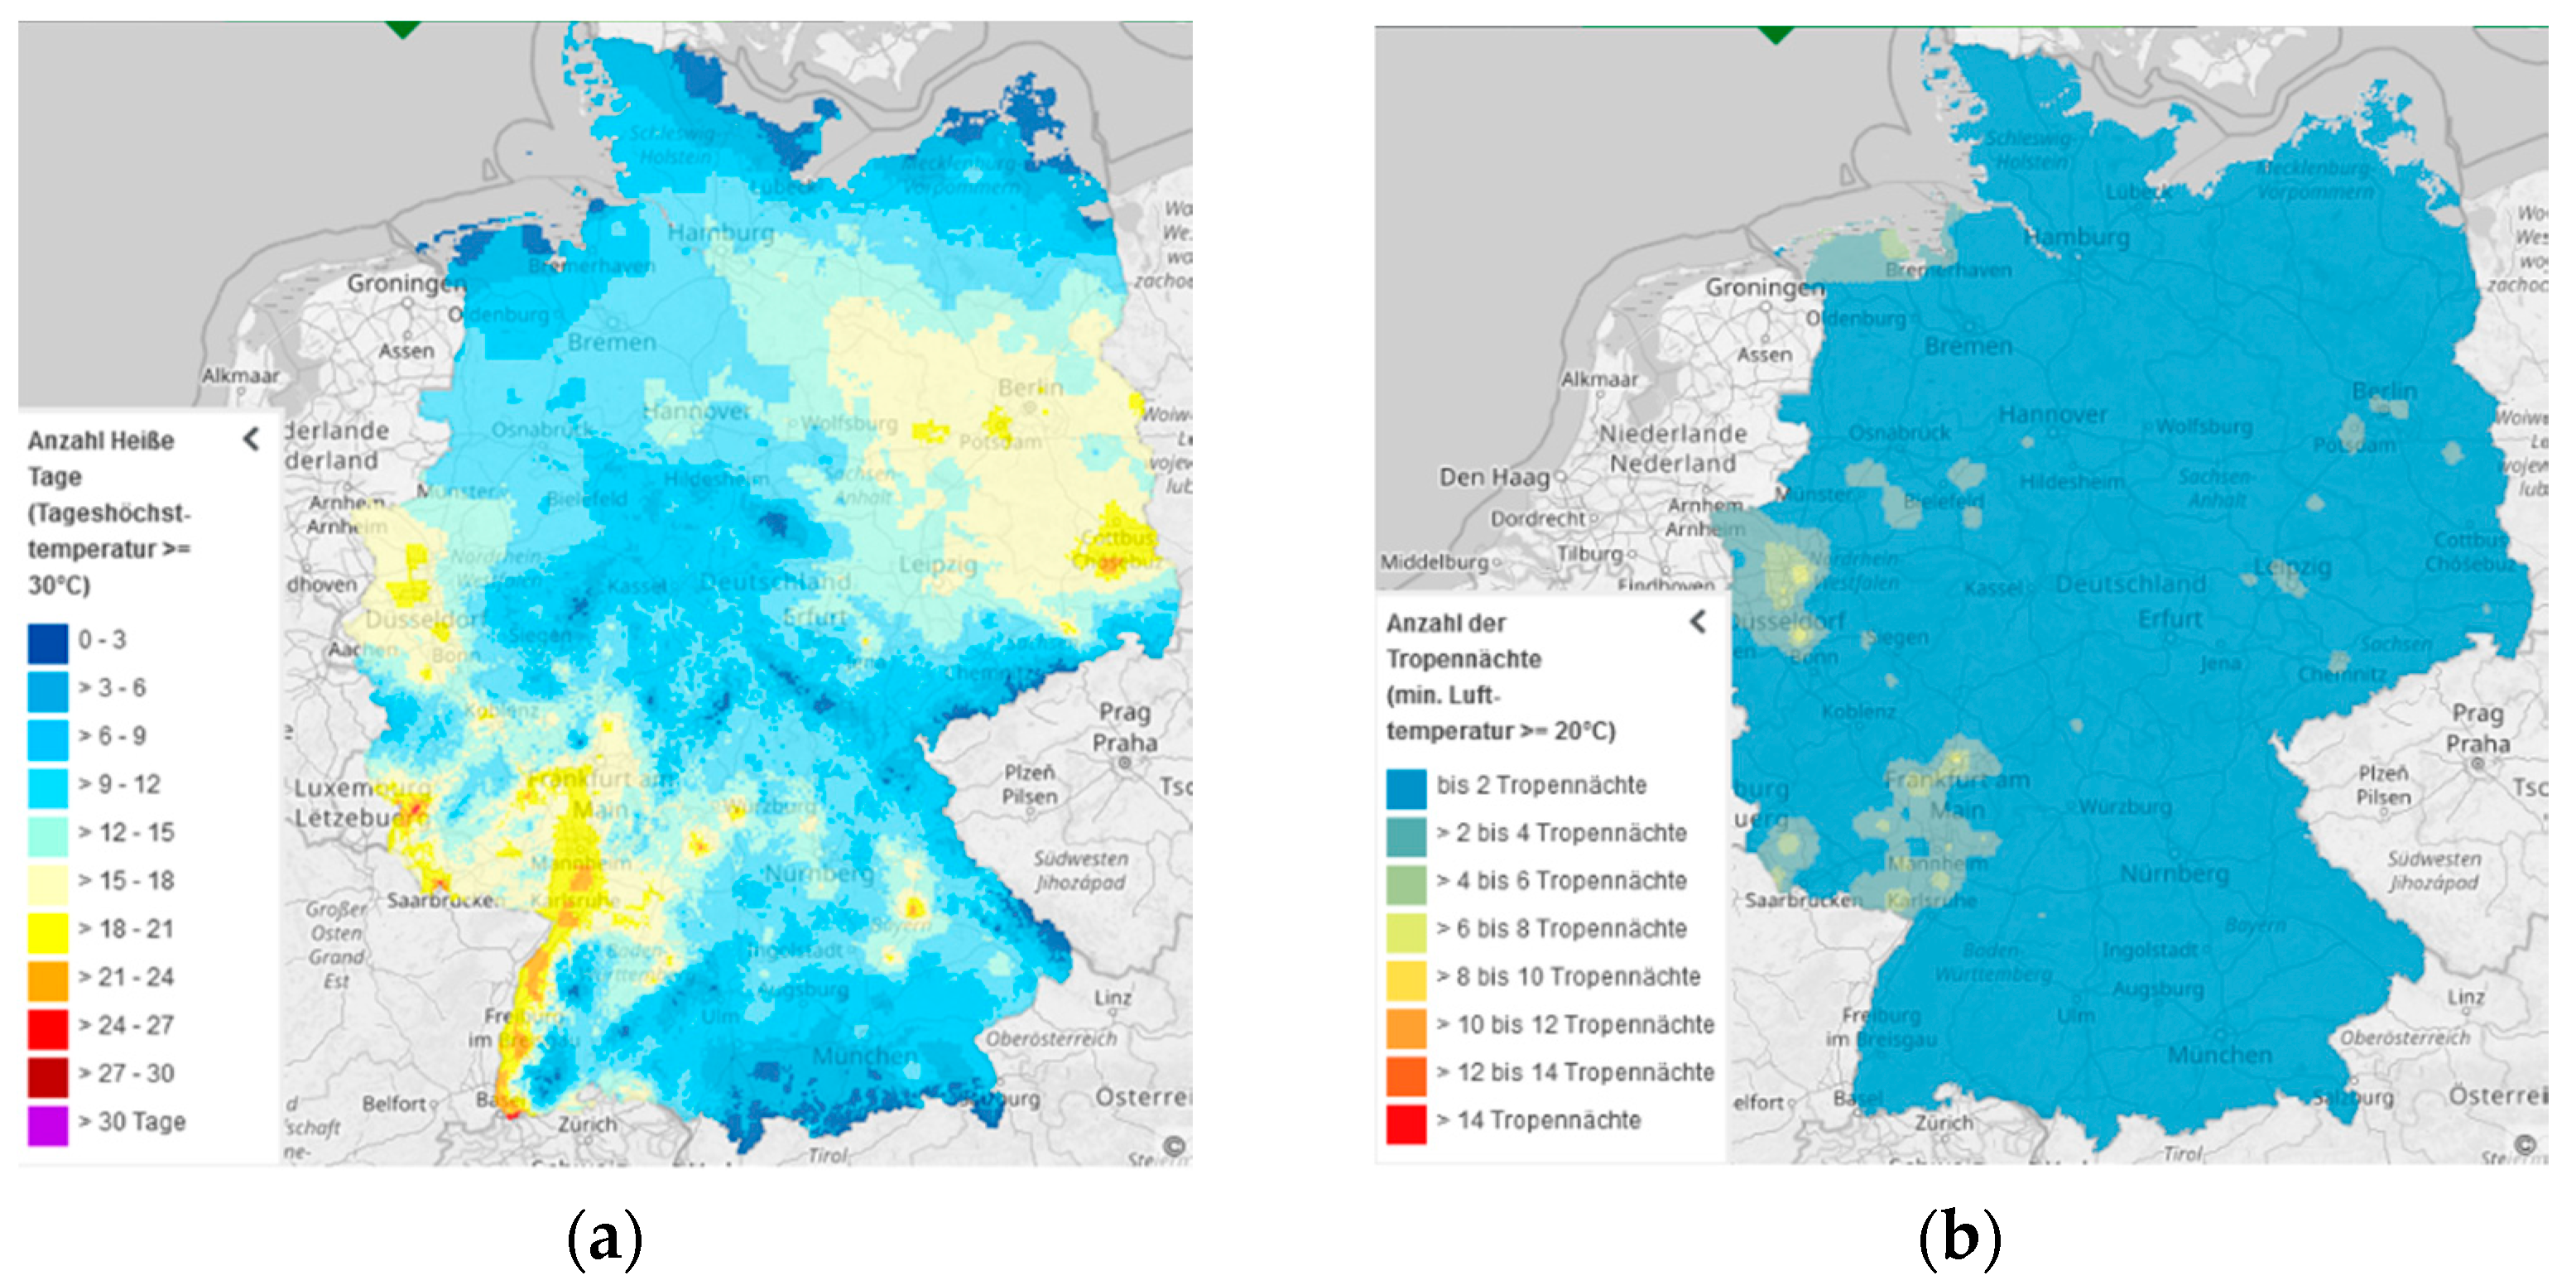
3.1. Hot Days
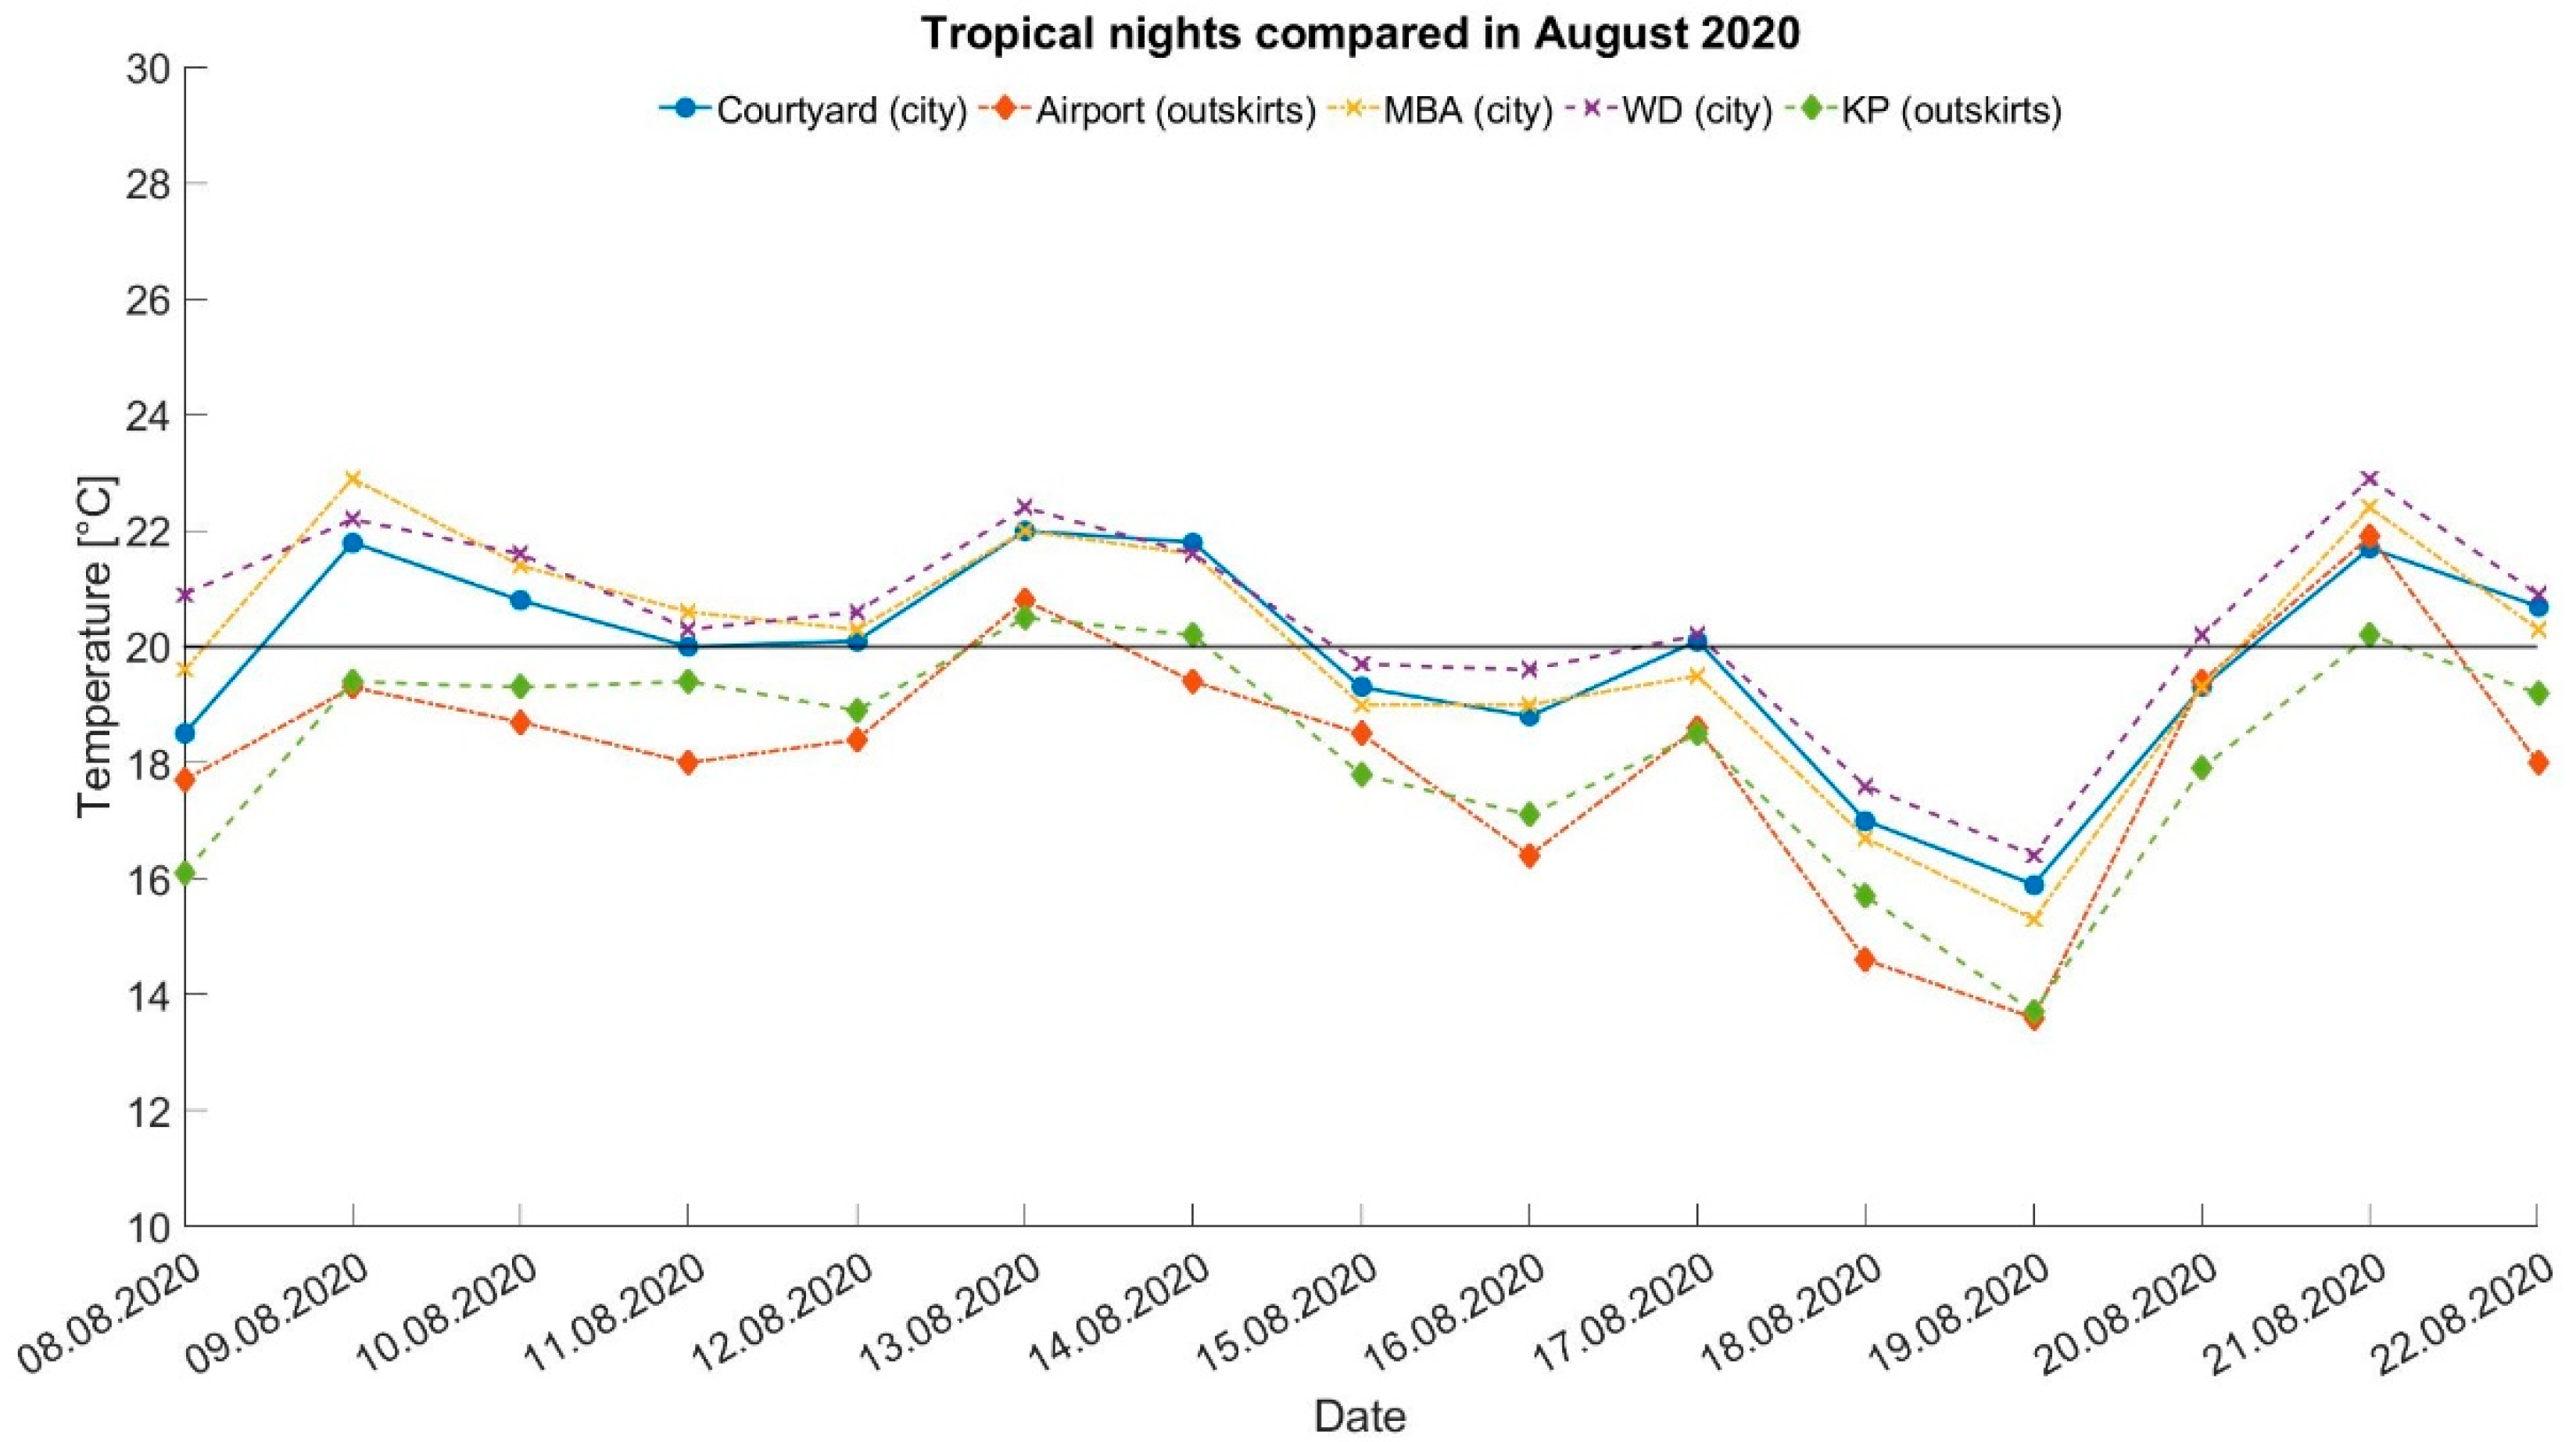
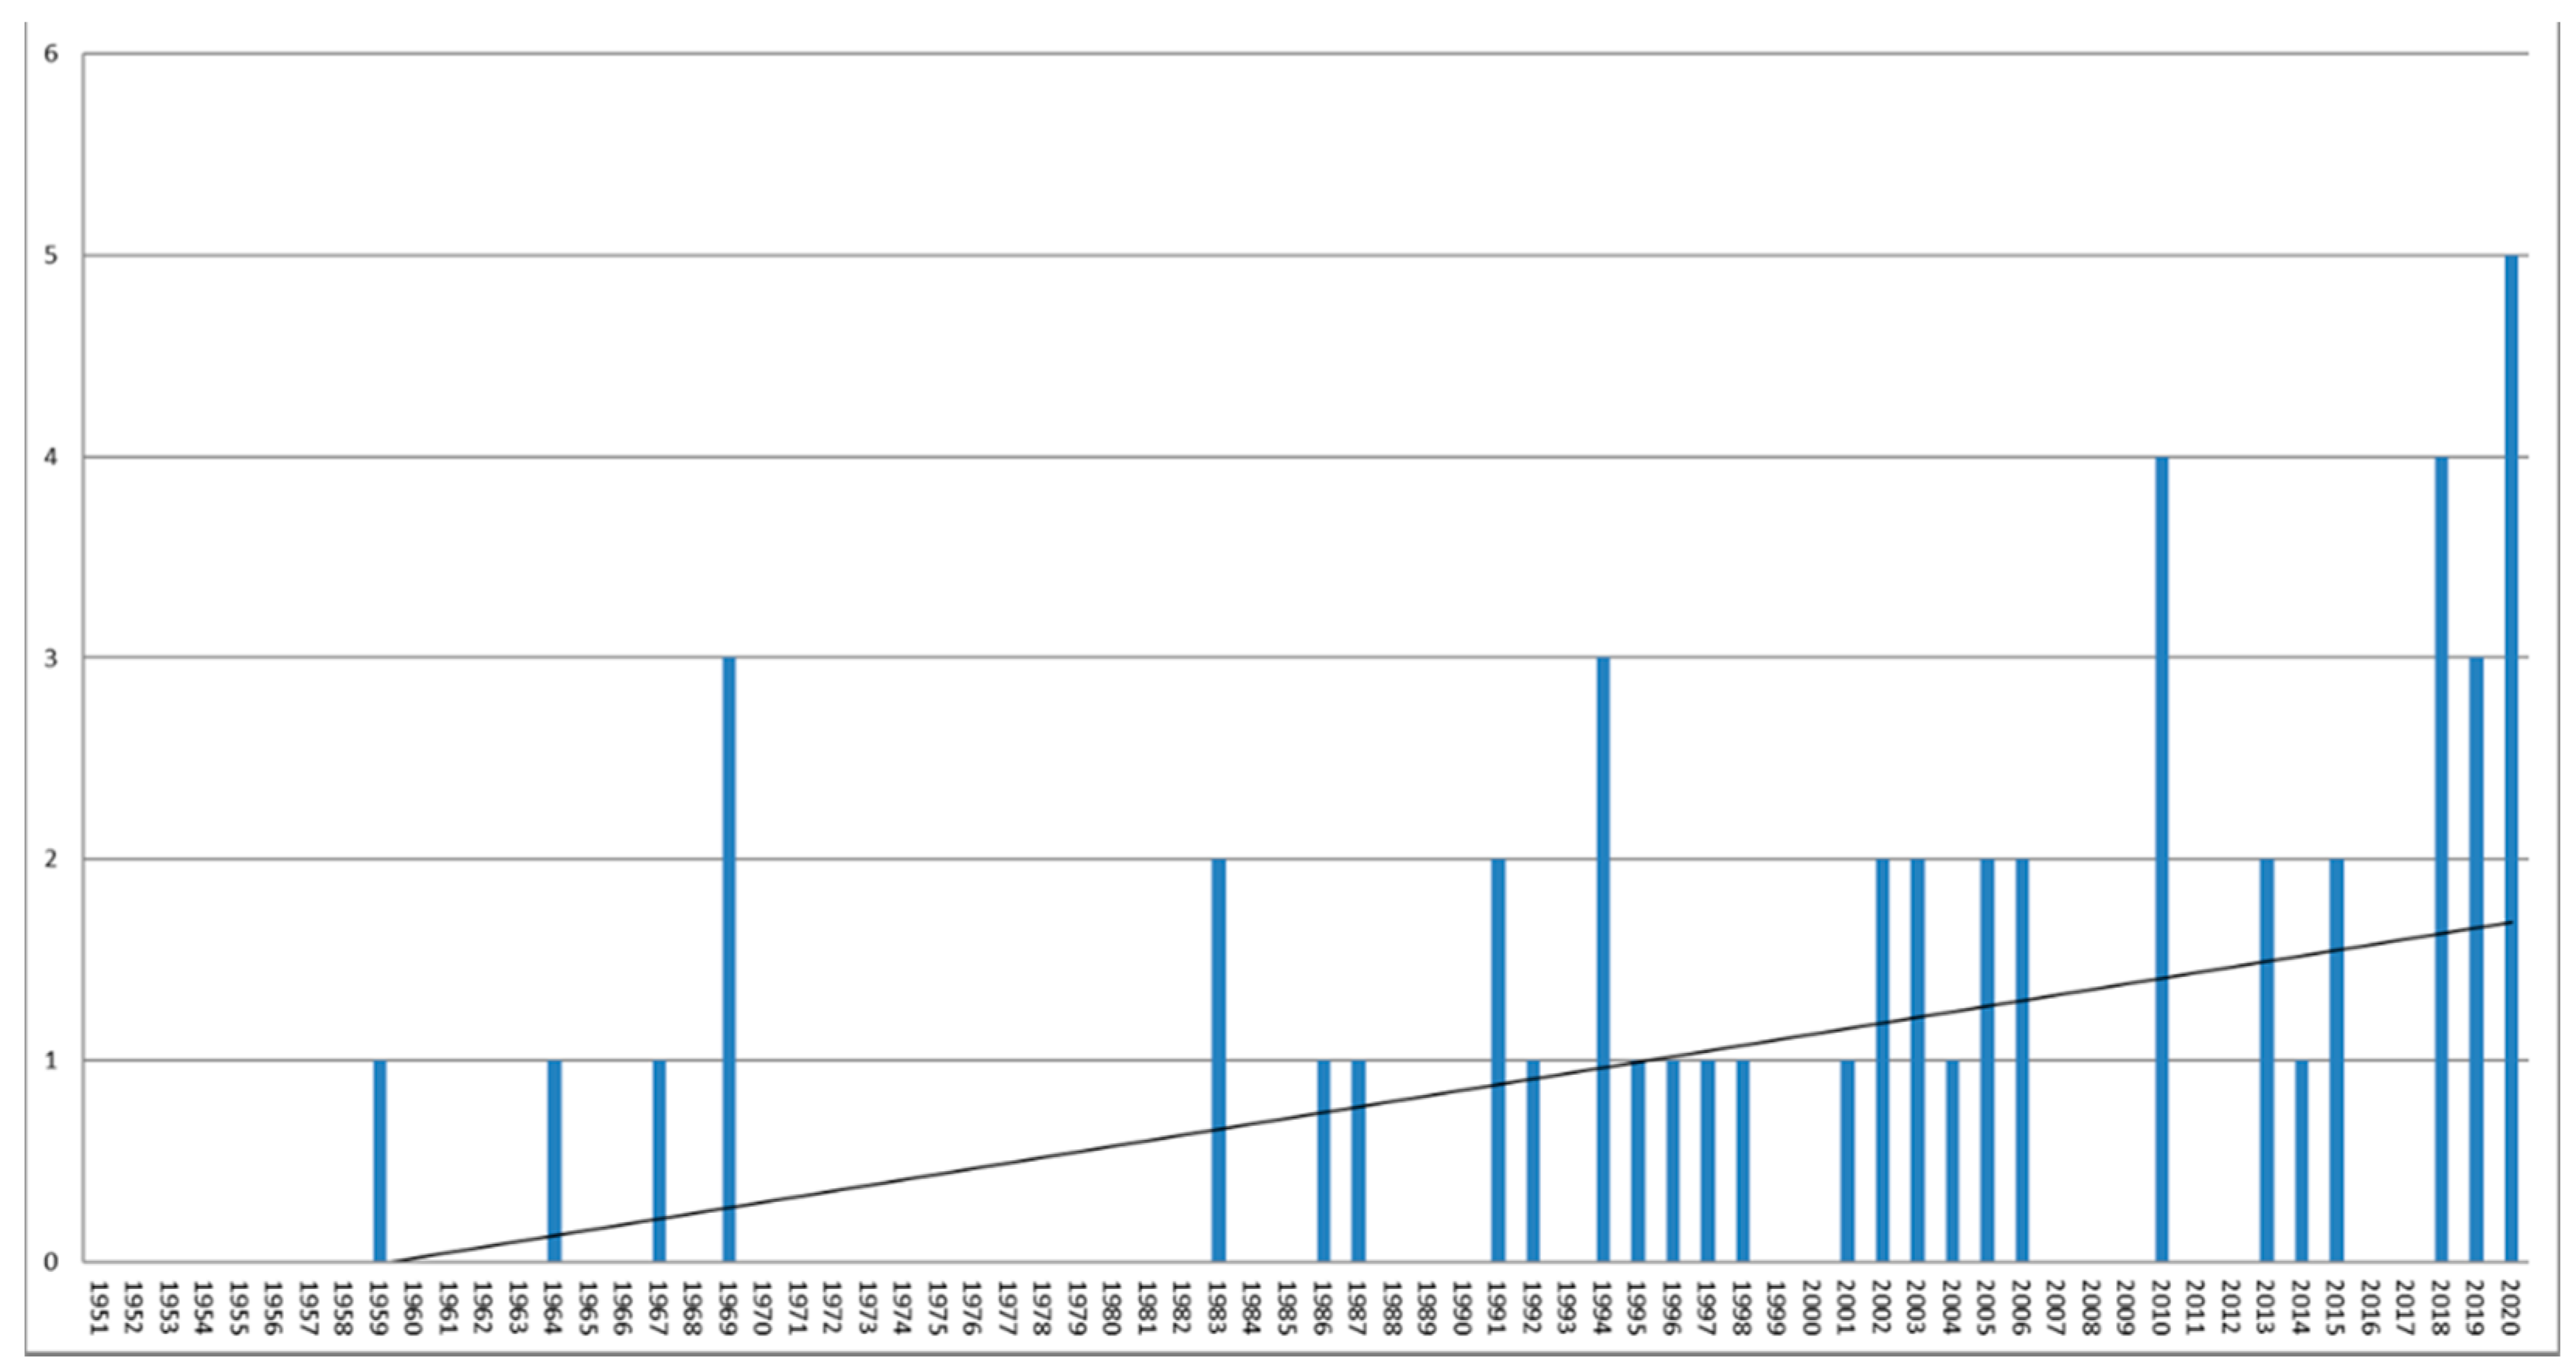
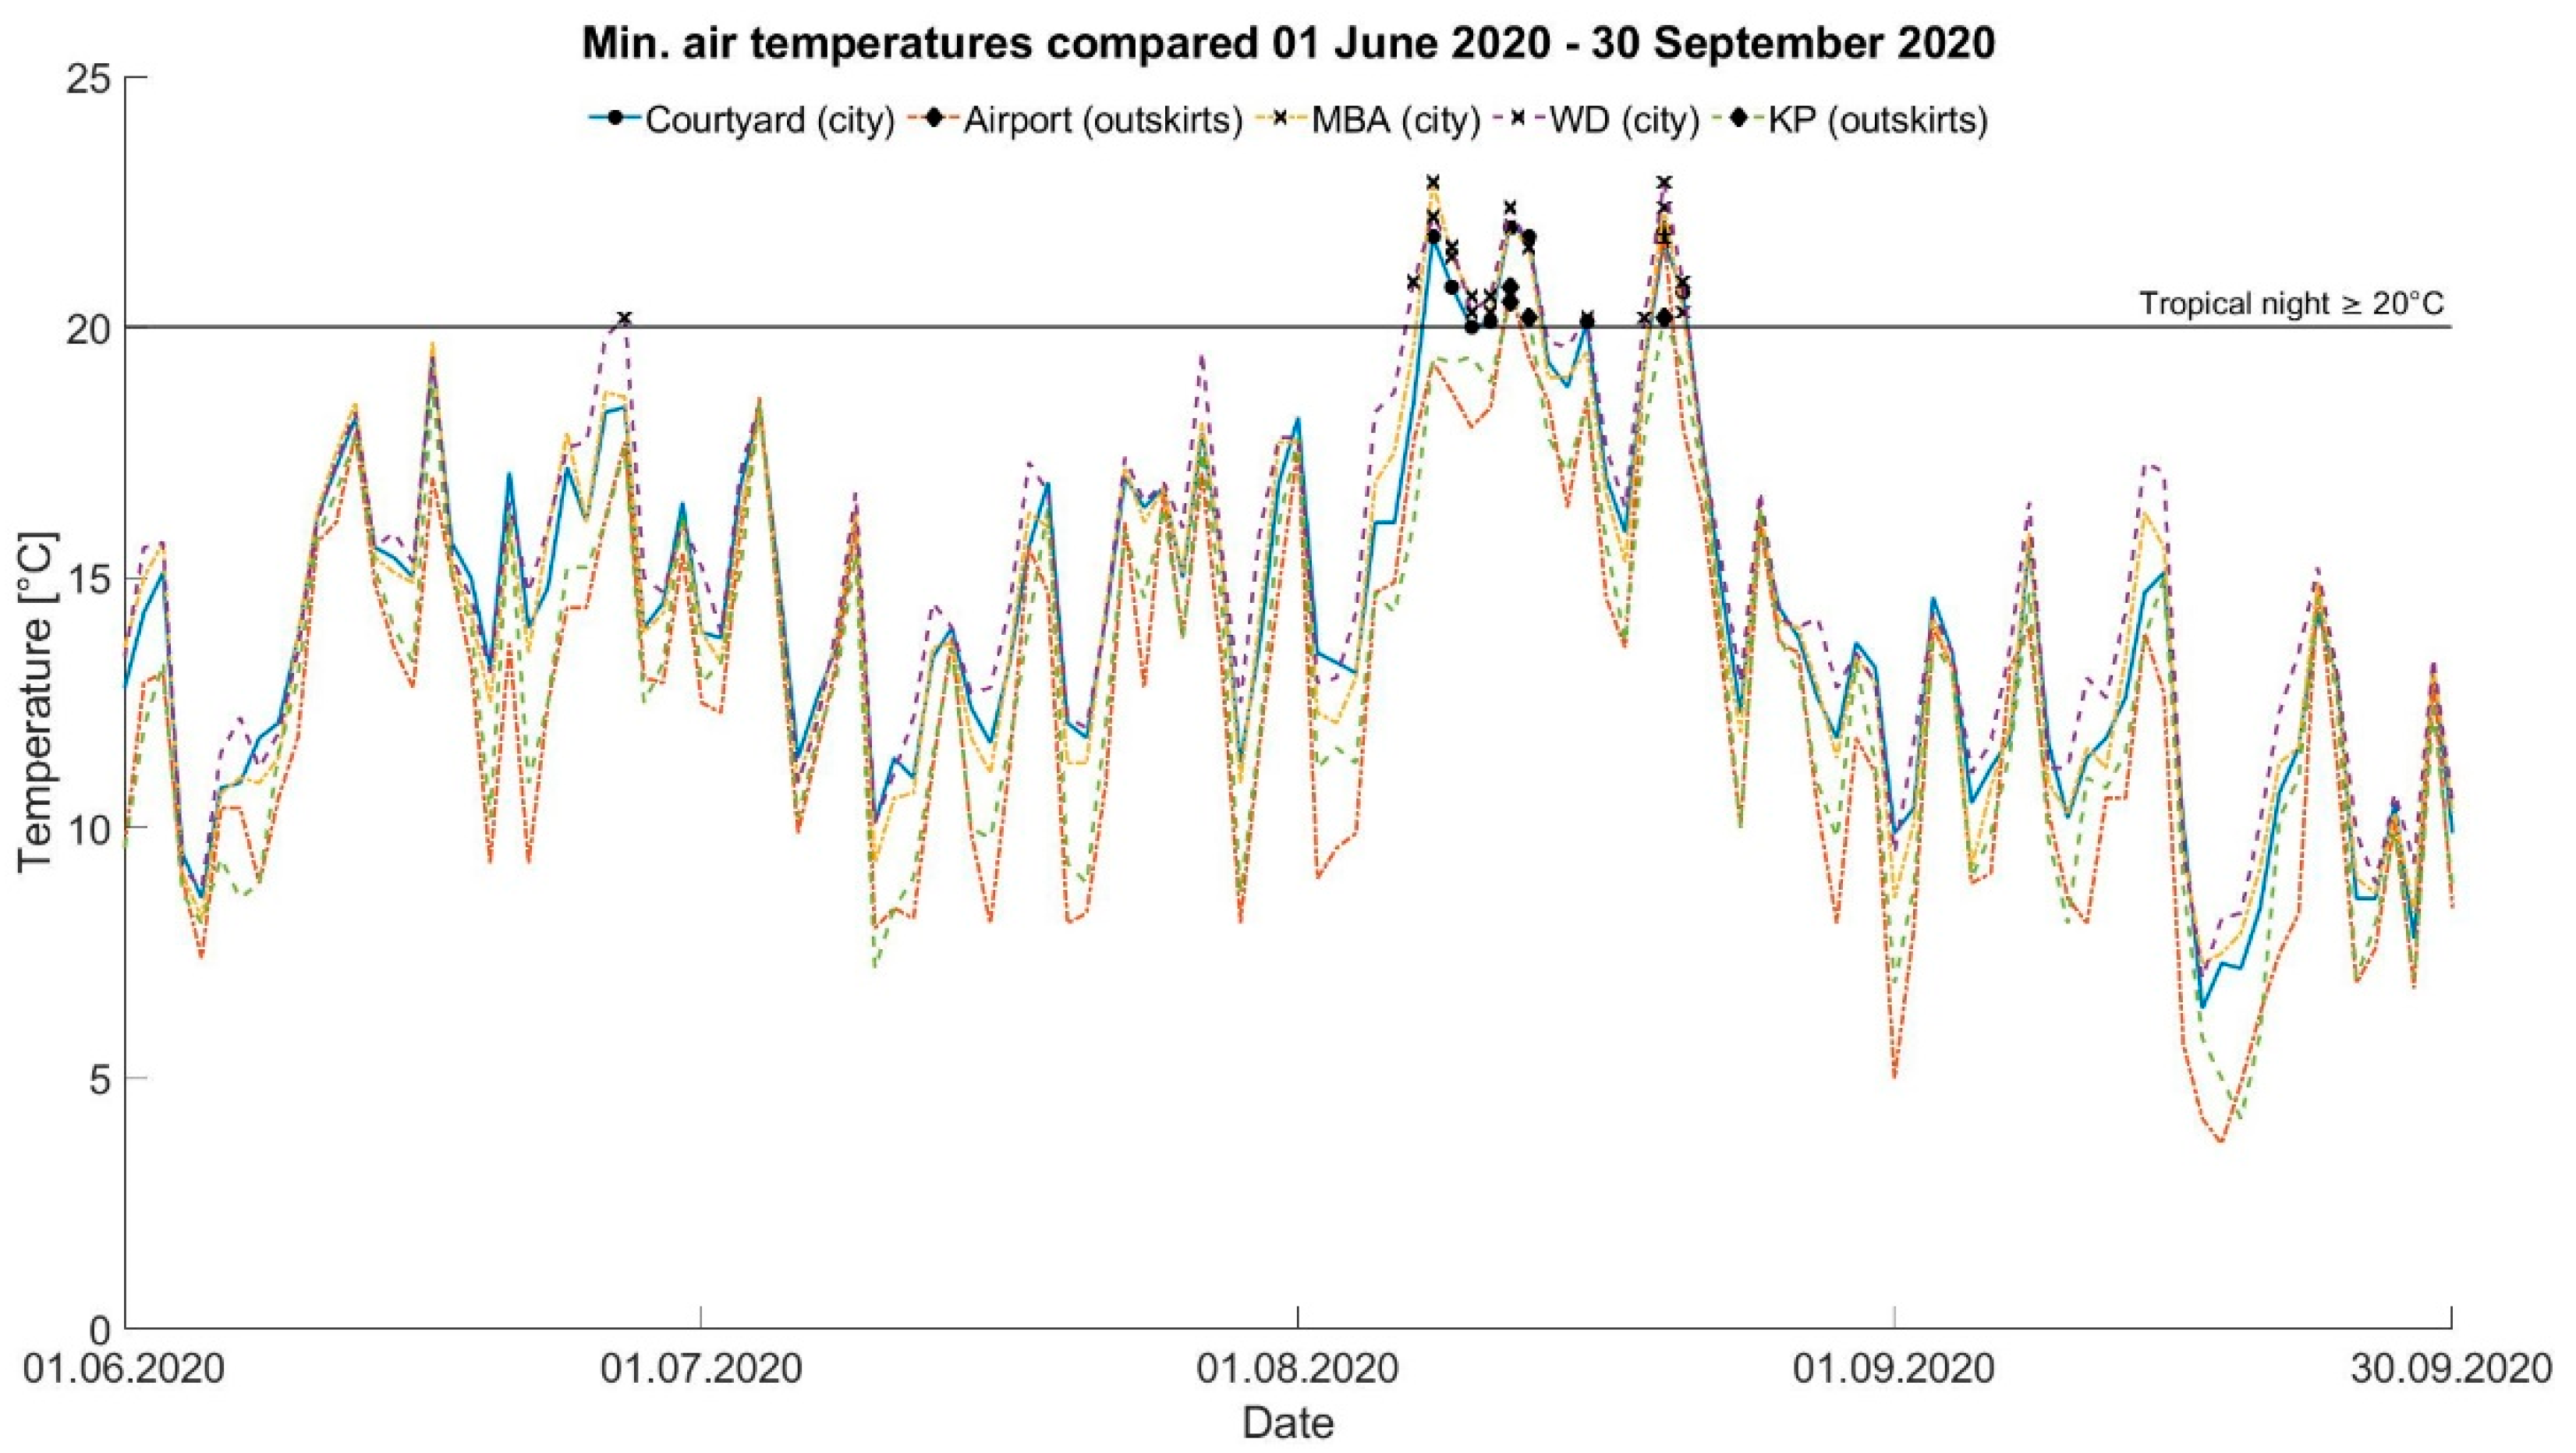
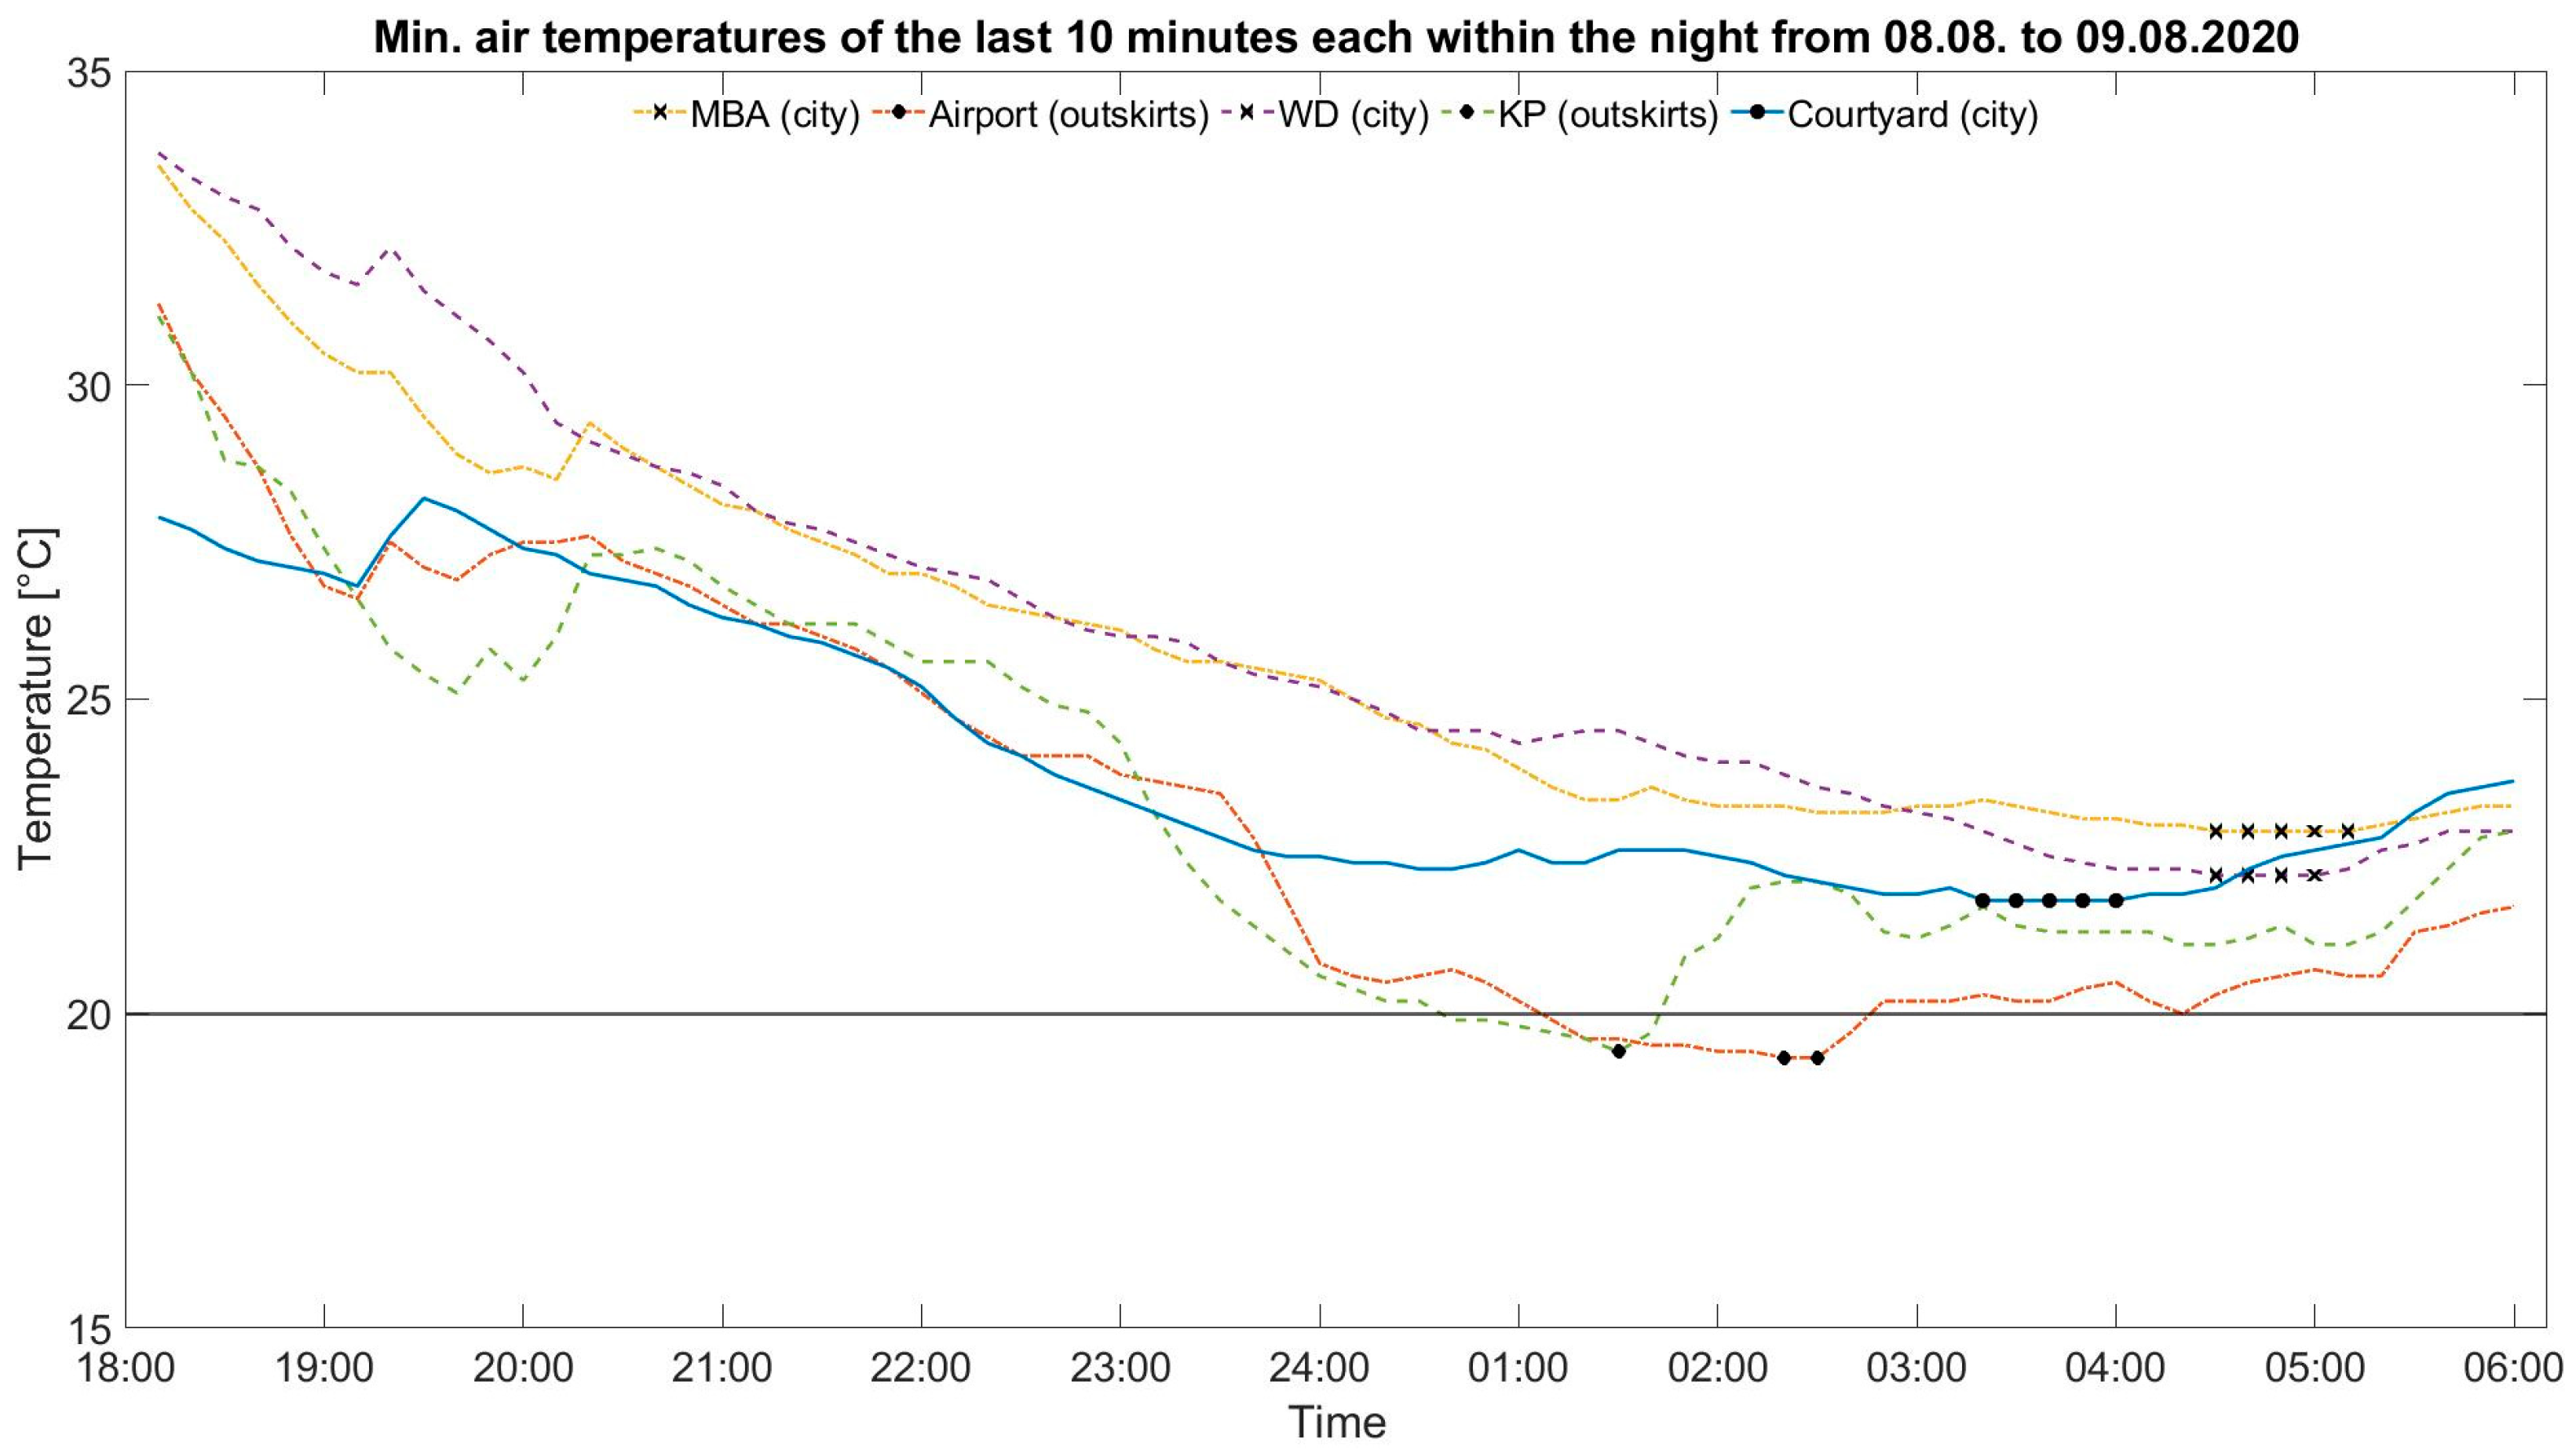
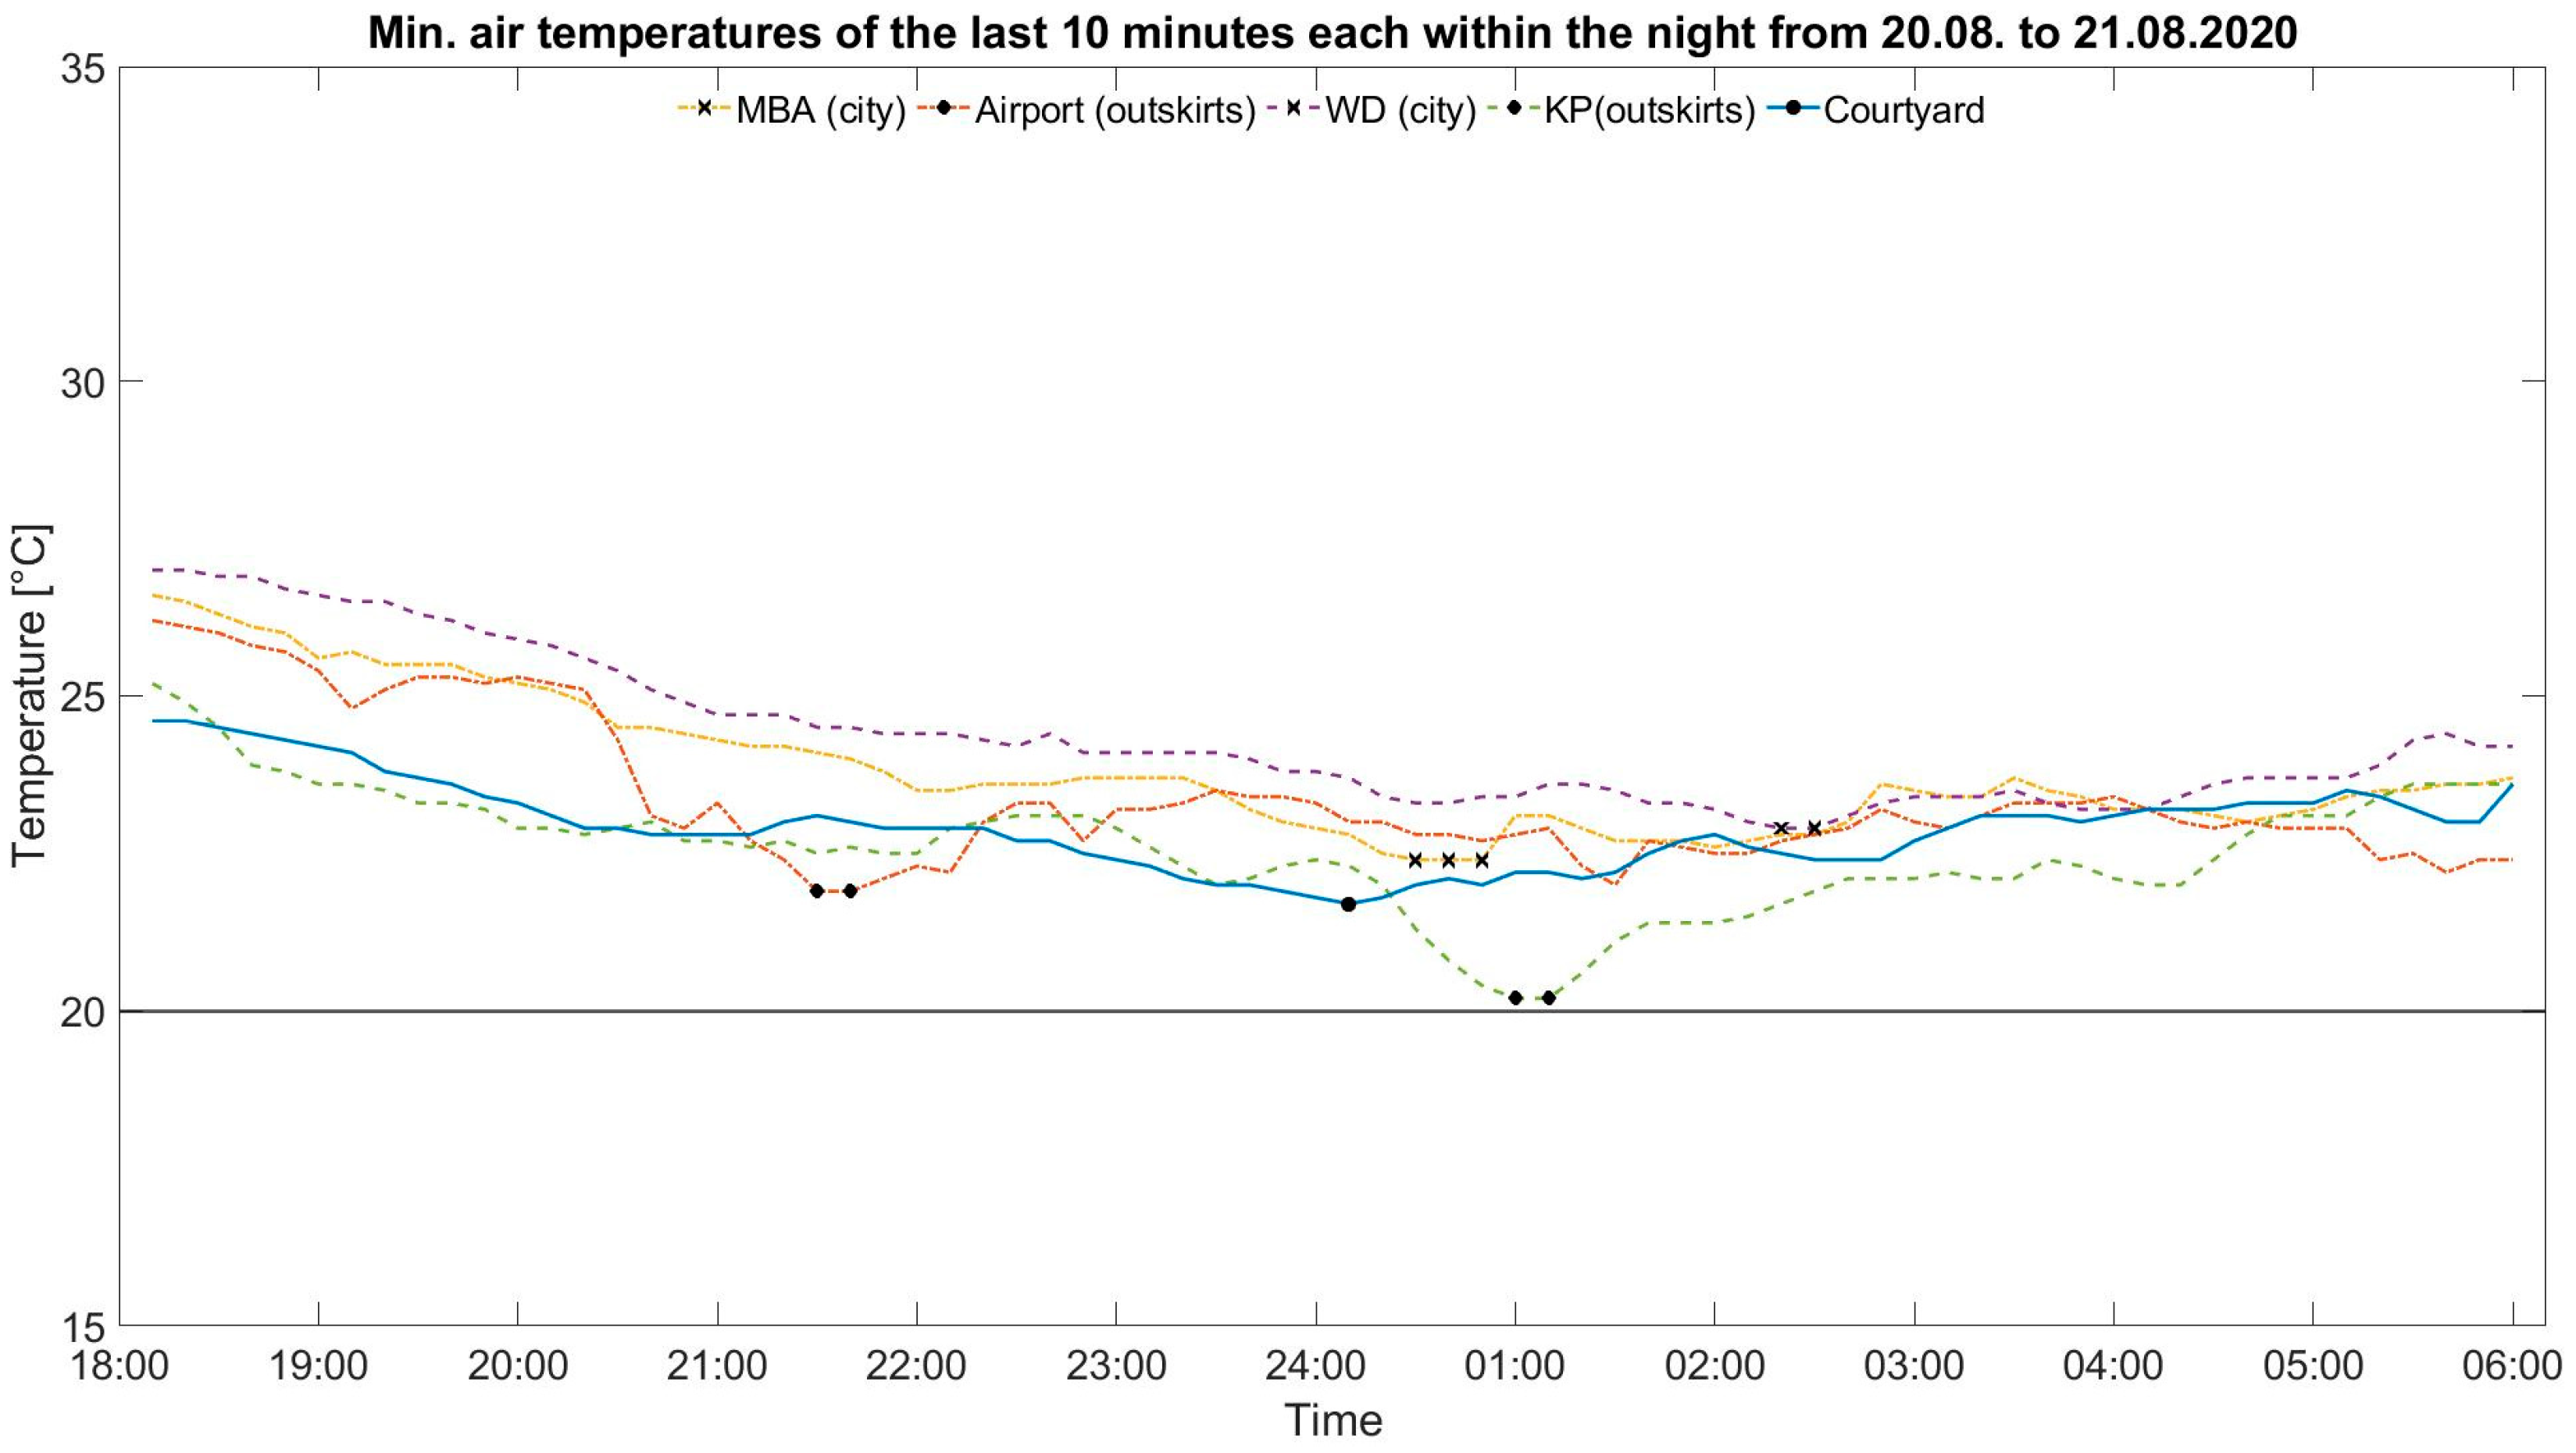
3.2. Tropical Nights
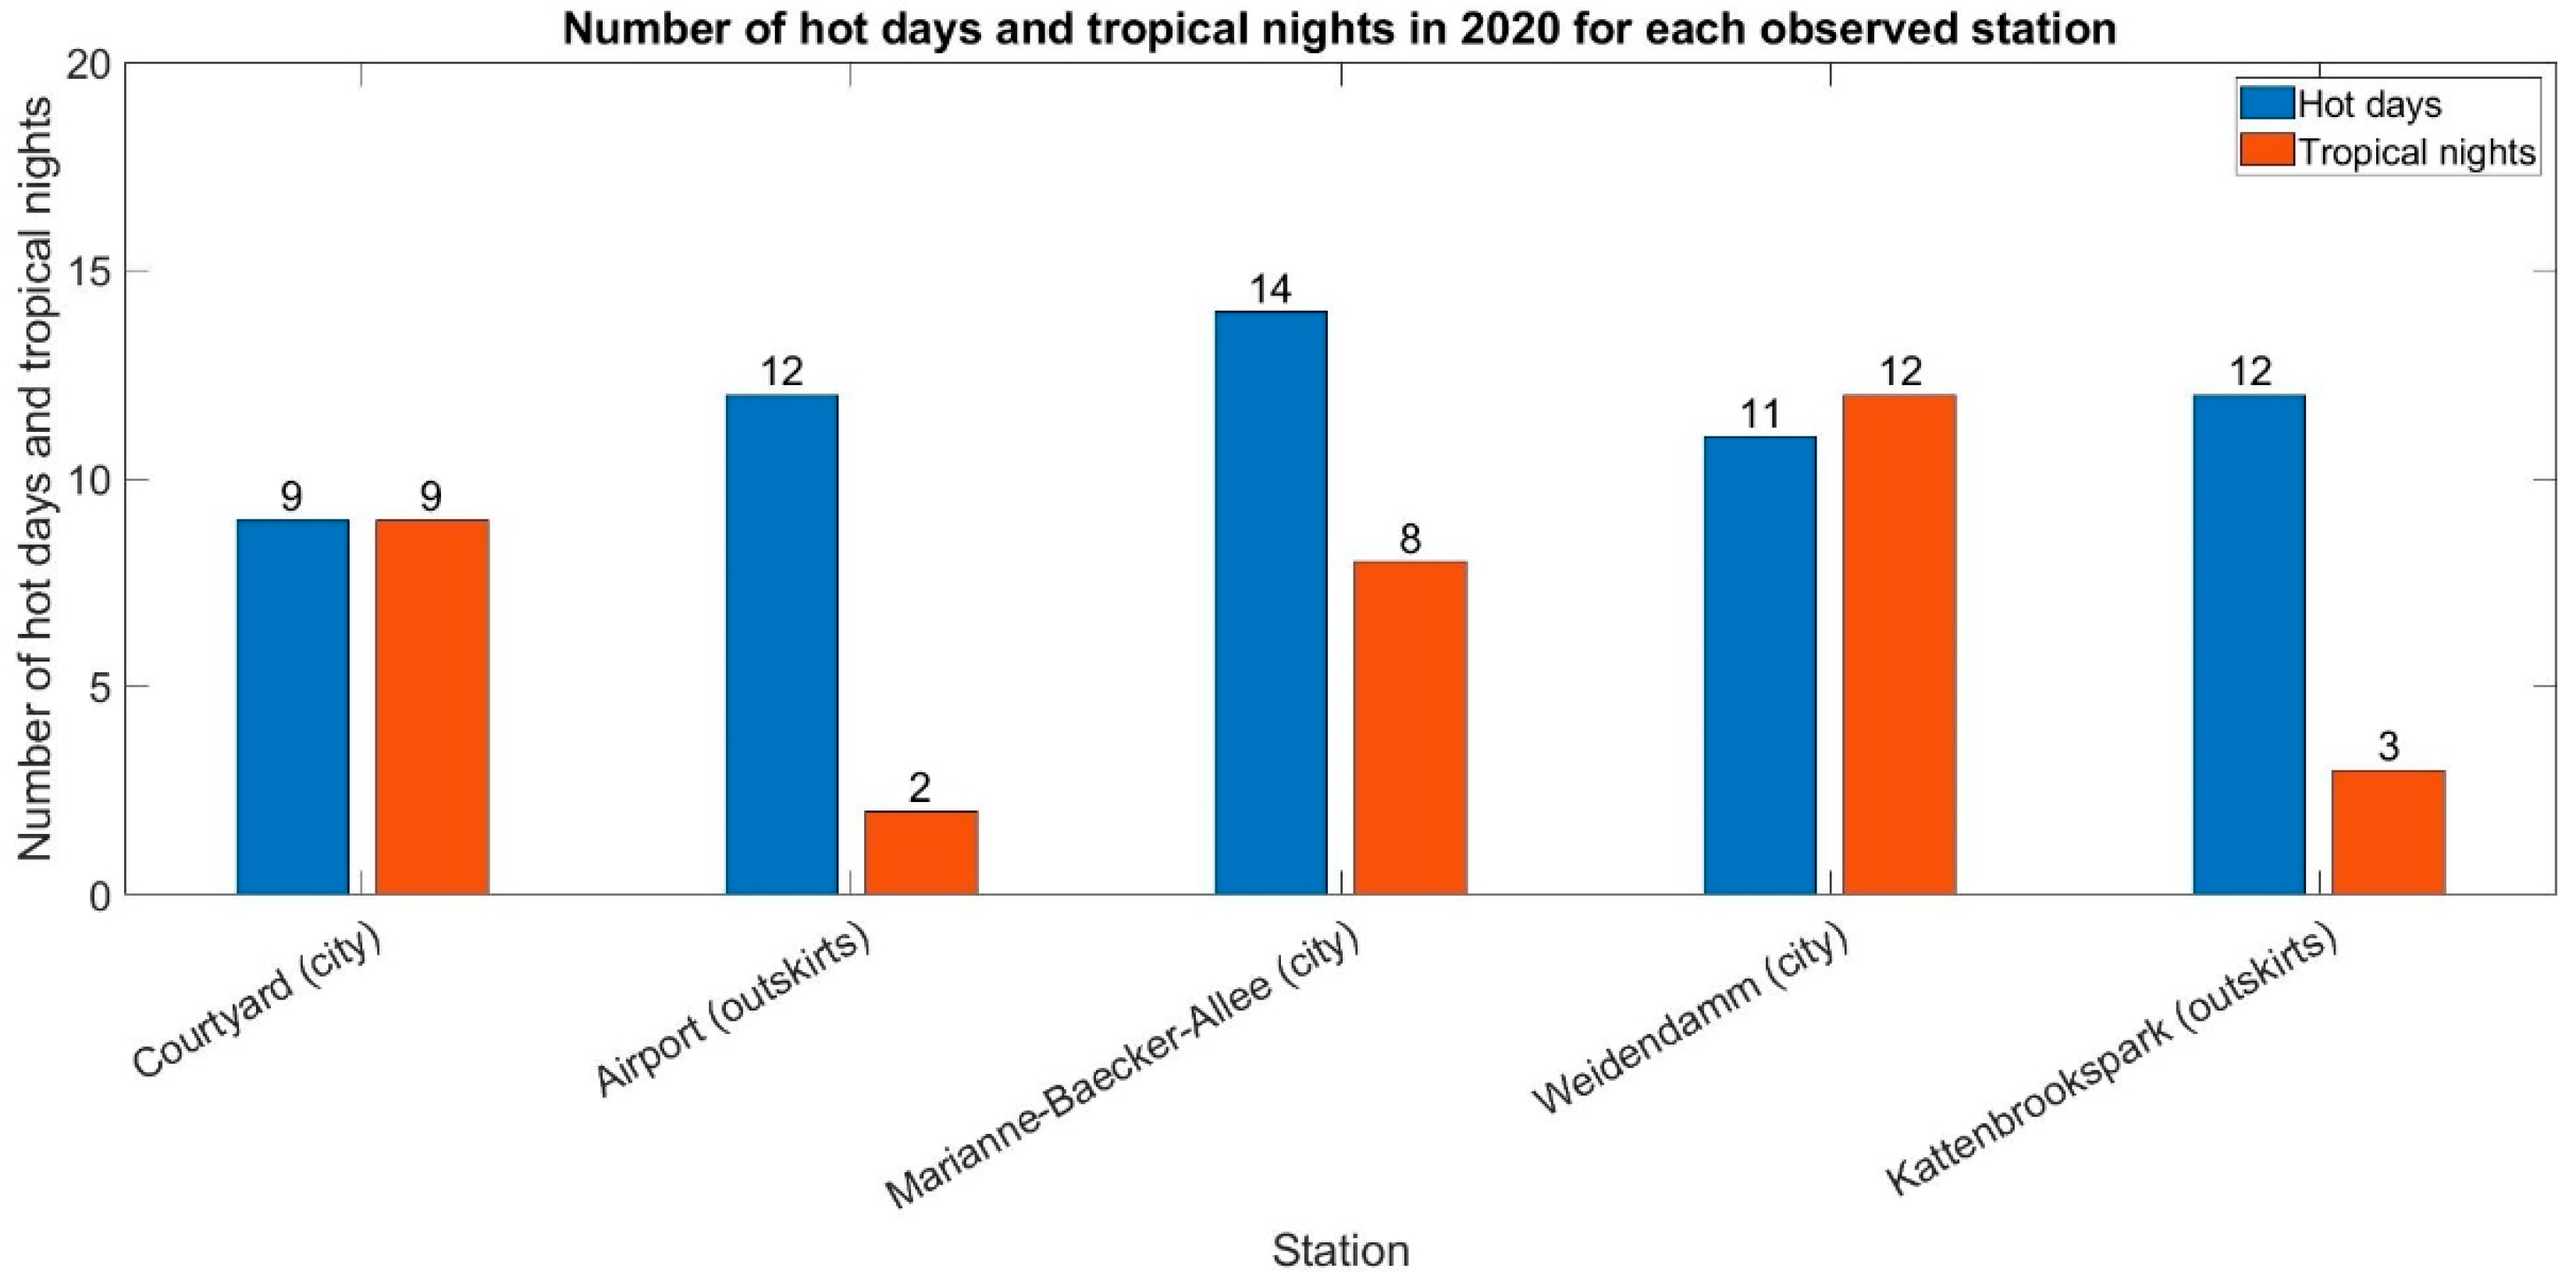
3.3. Tropical Nights and Hot Days in Comparison
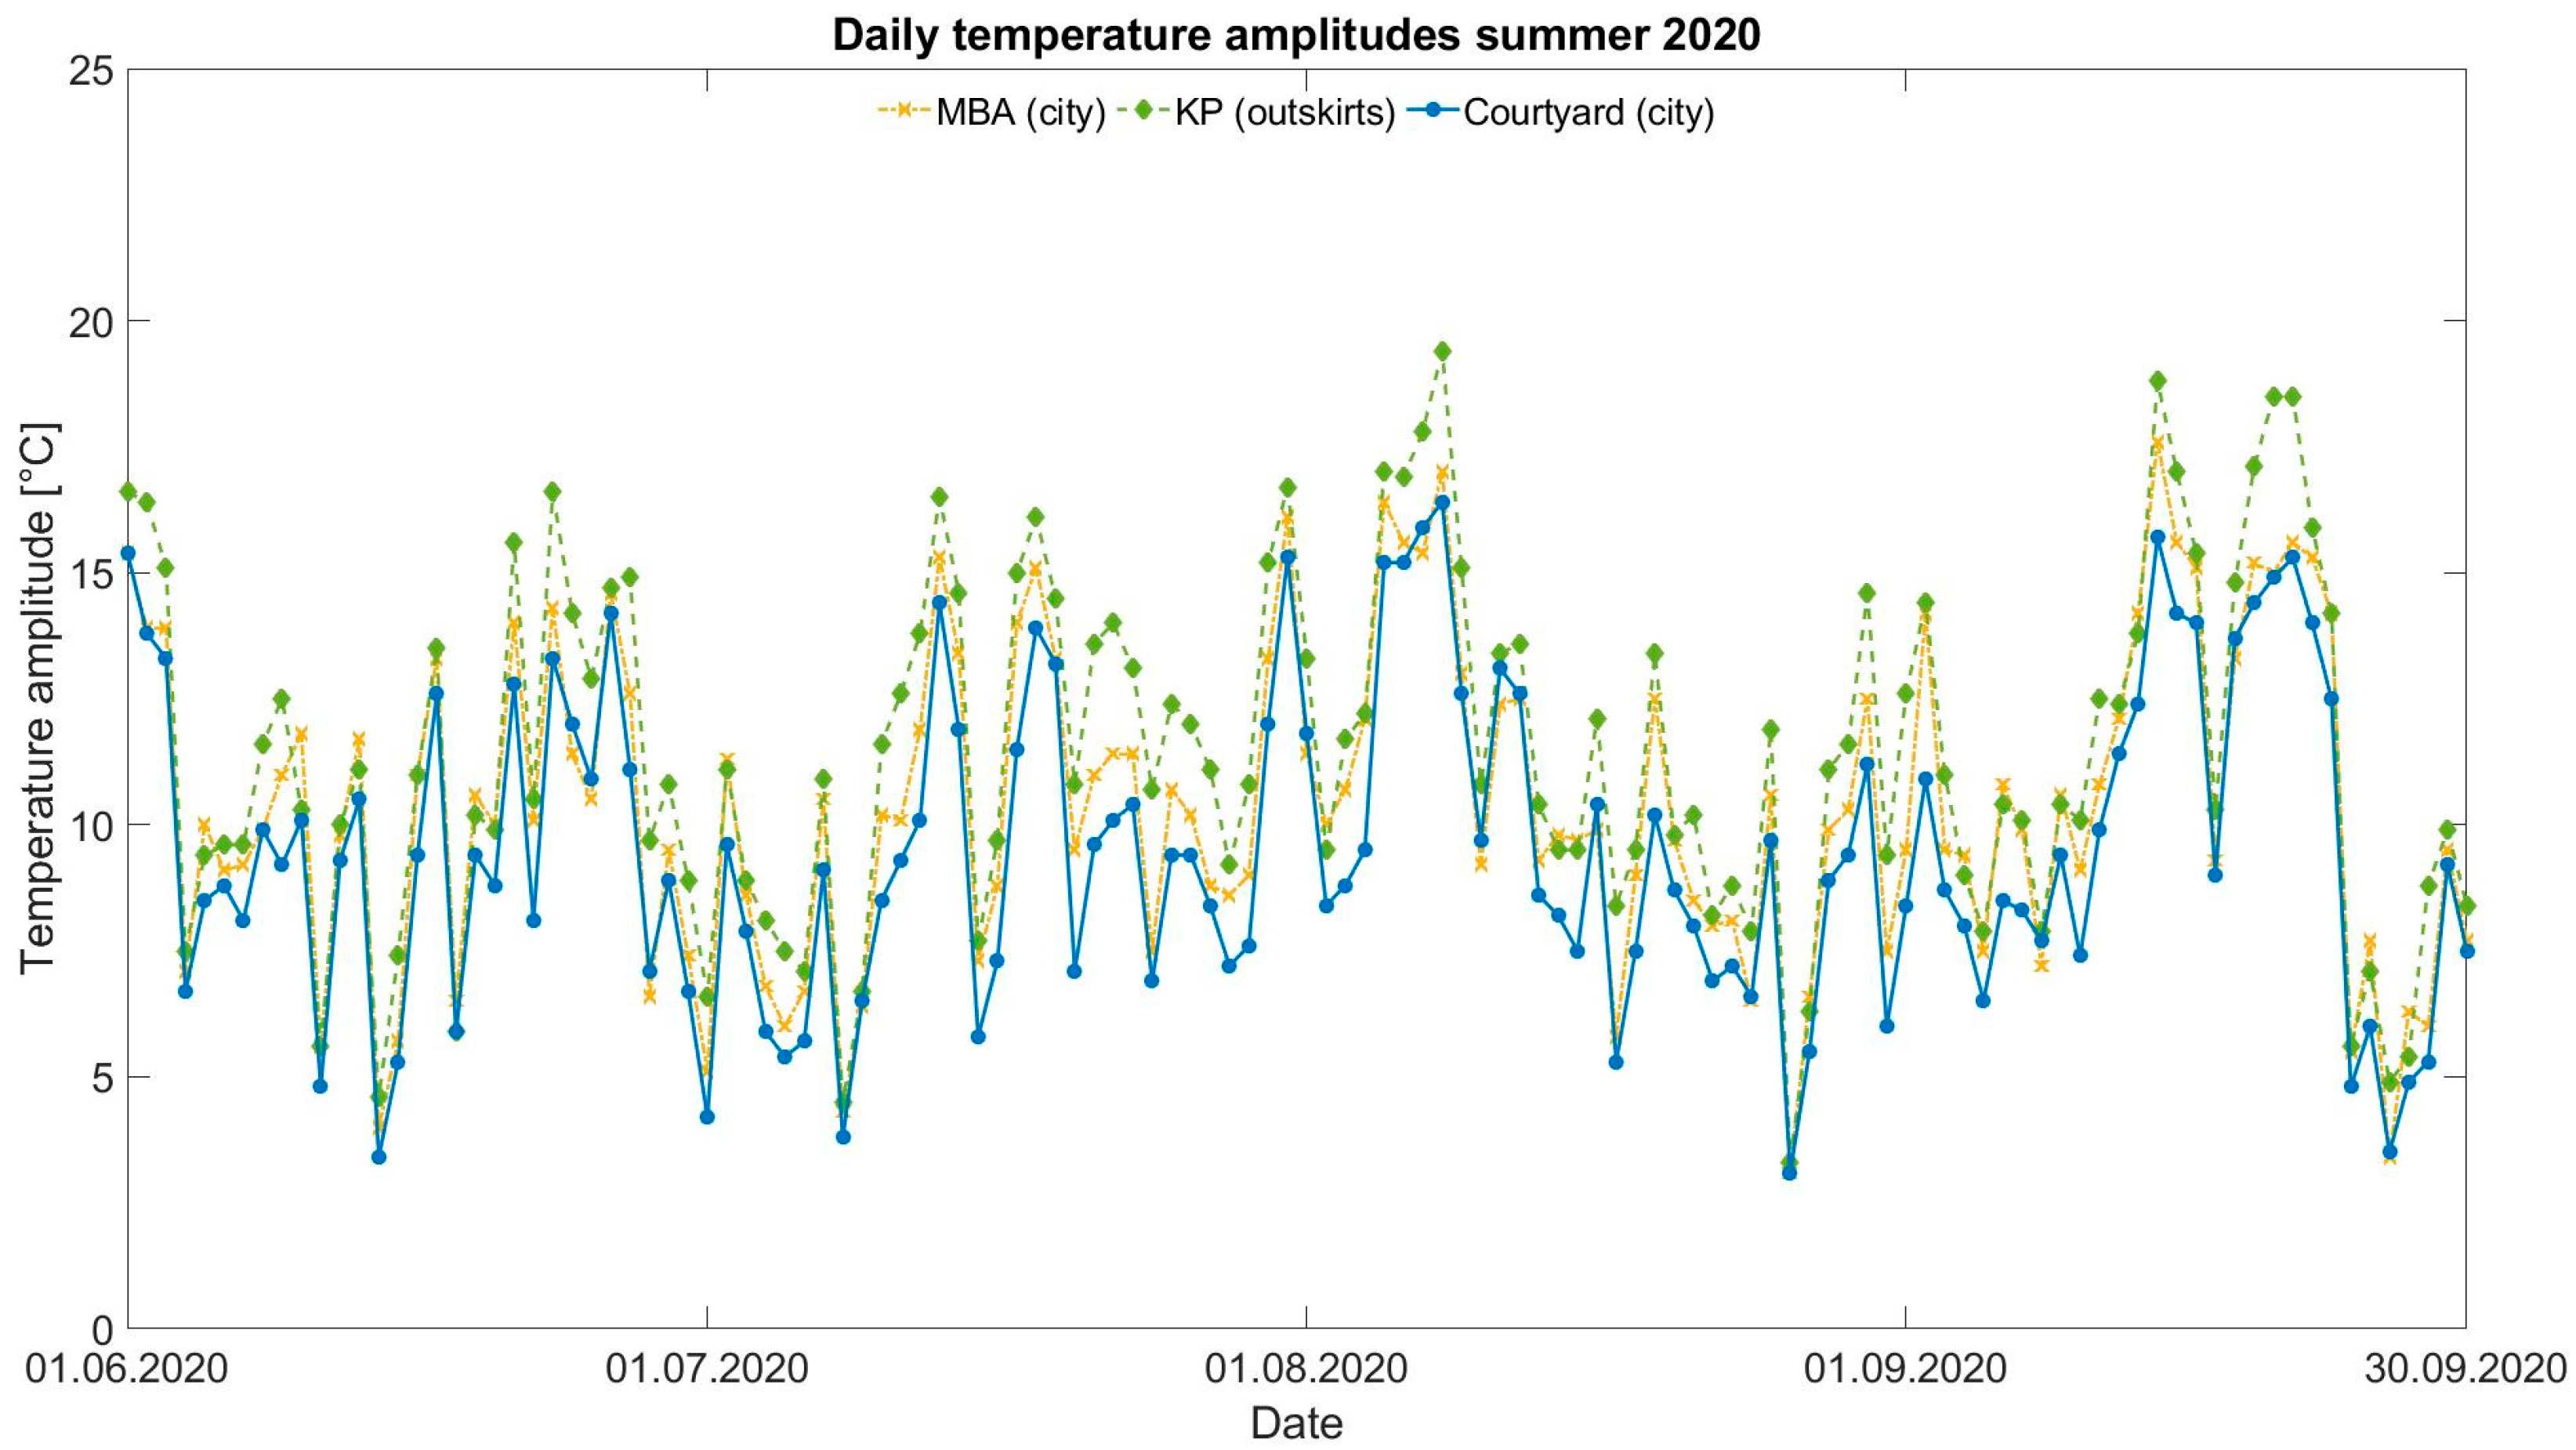
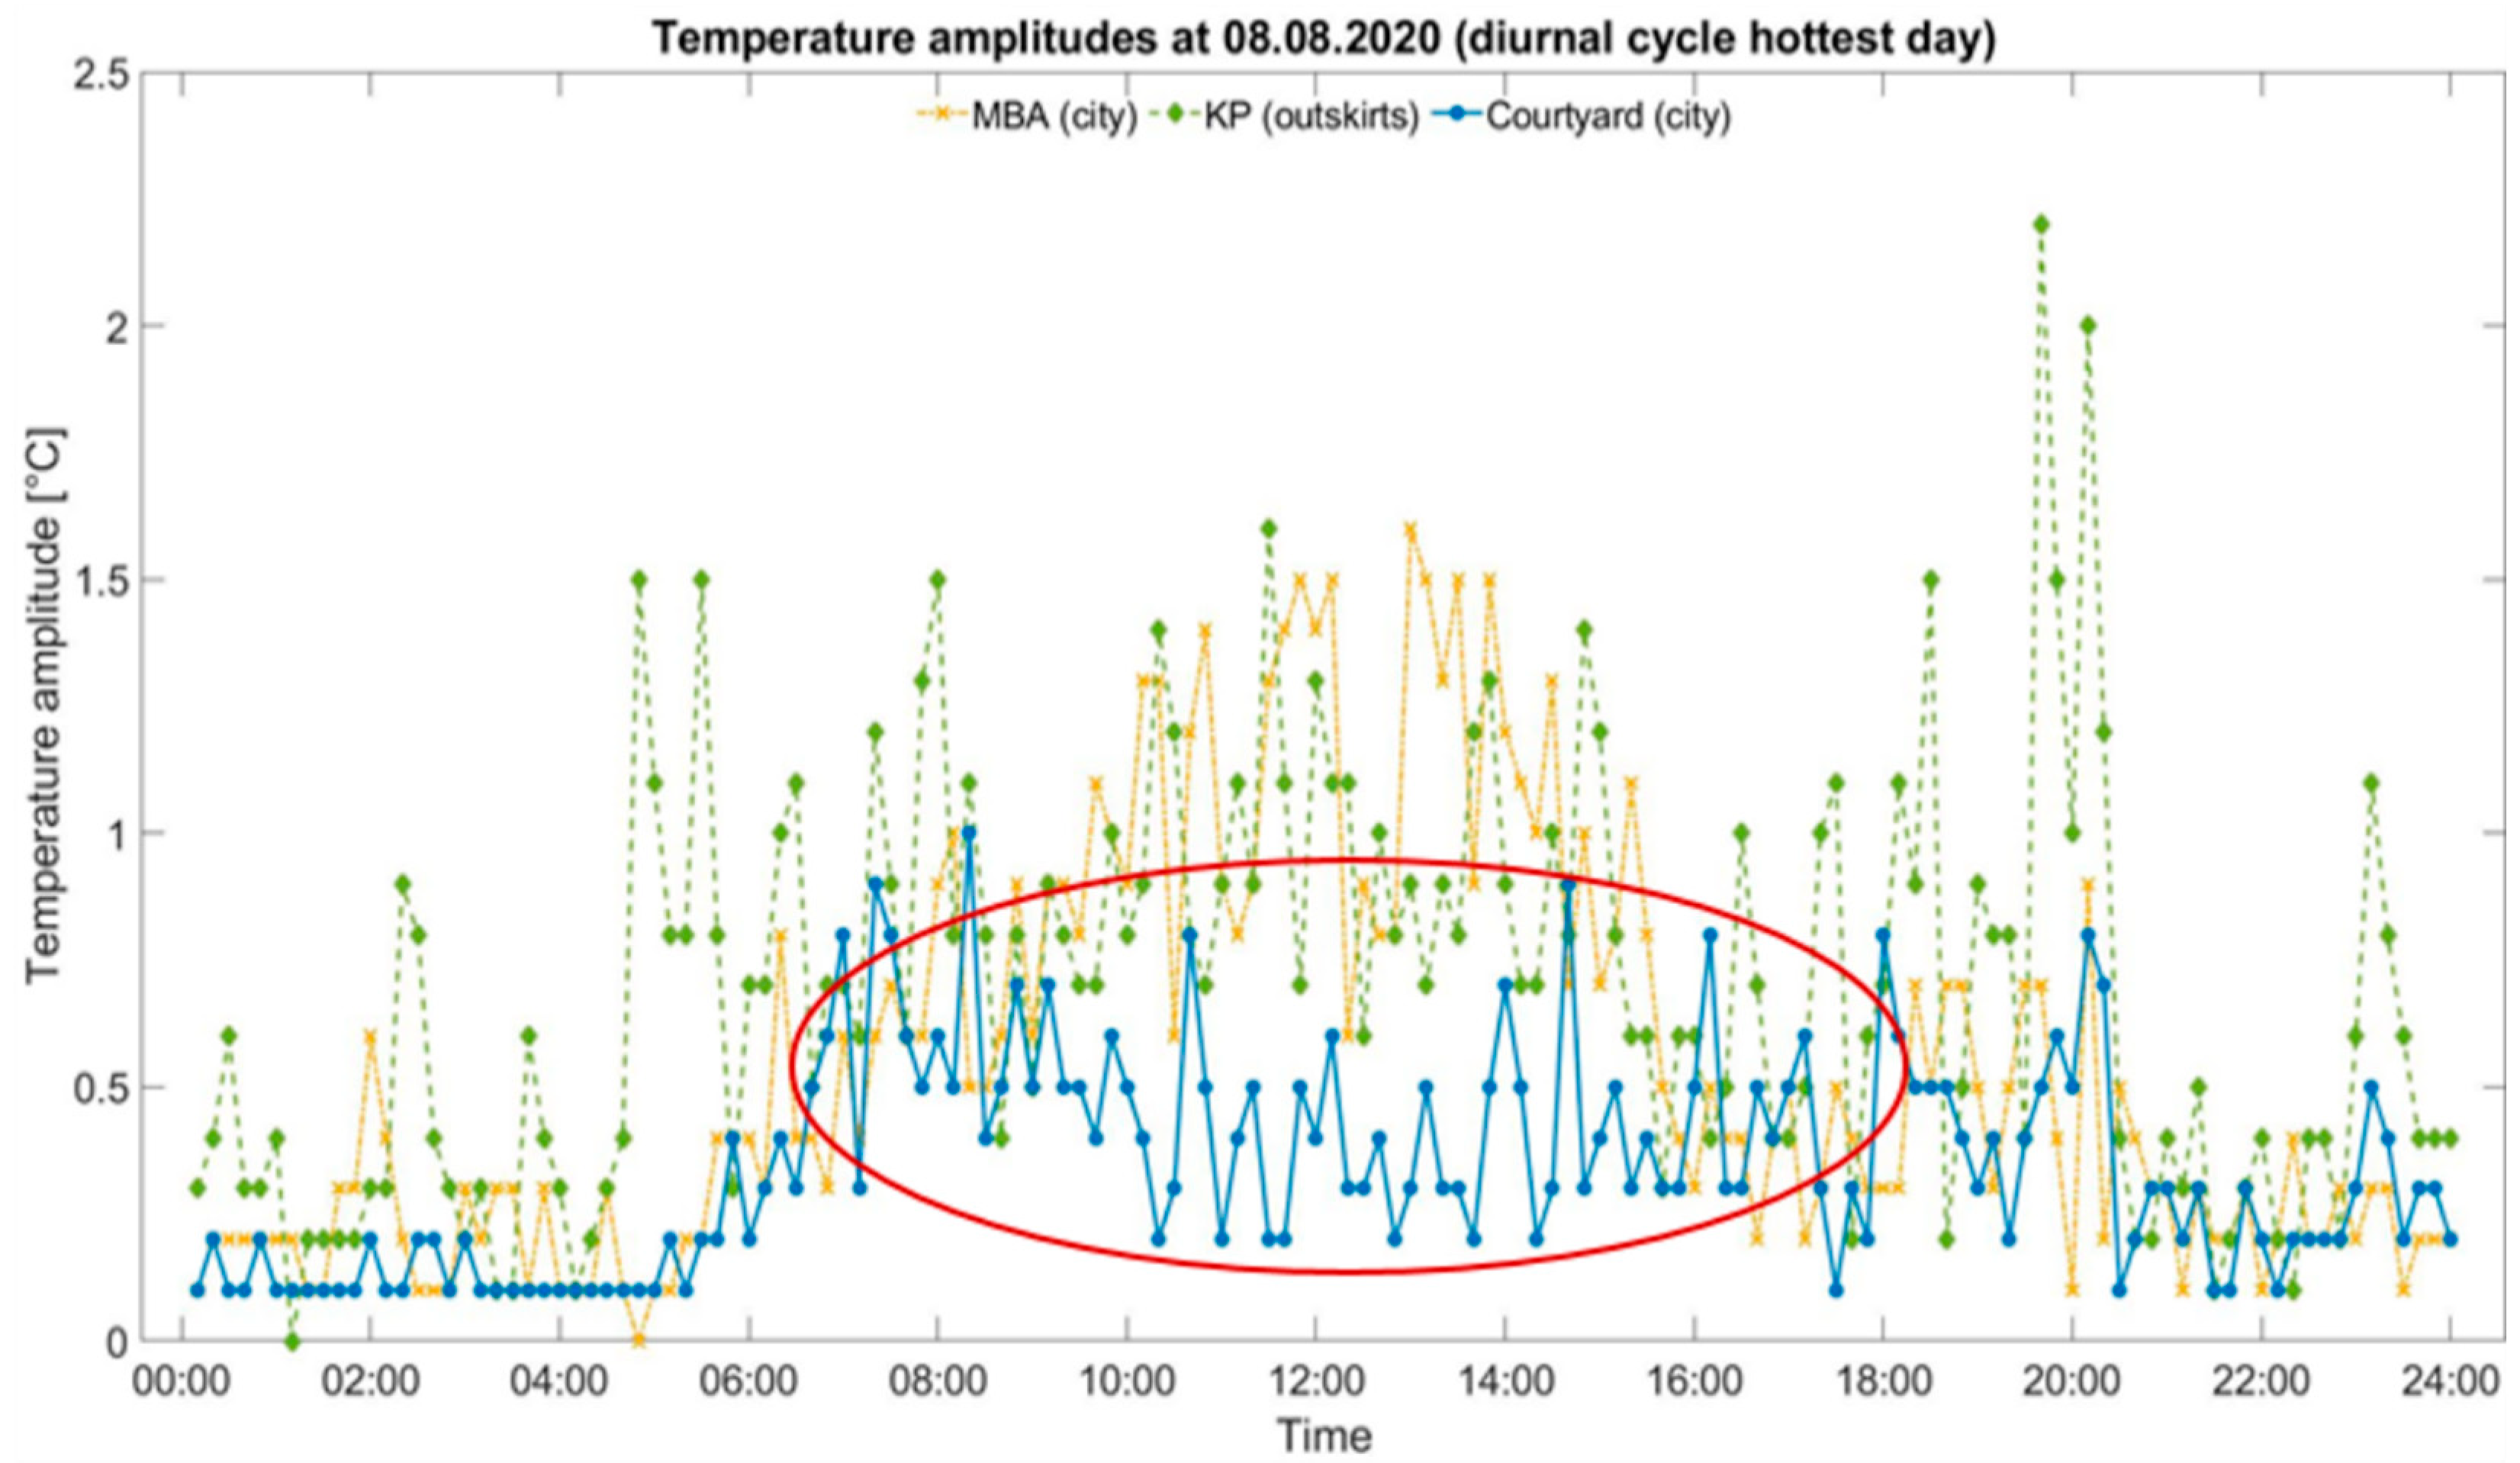
3.4. Amplitudes
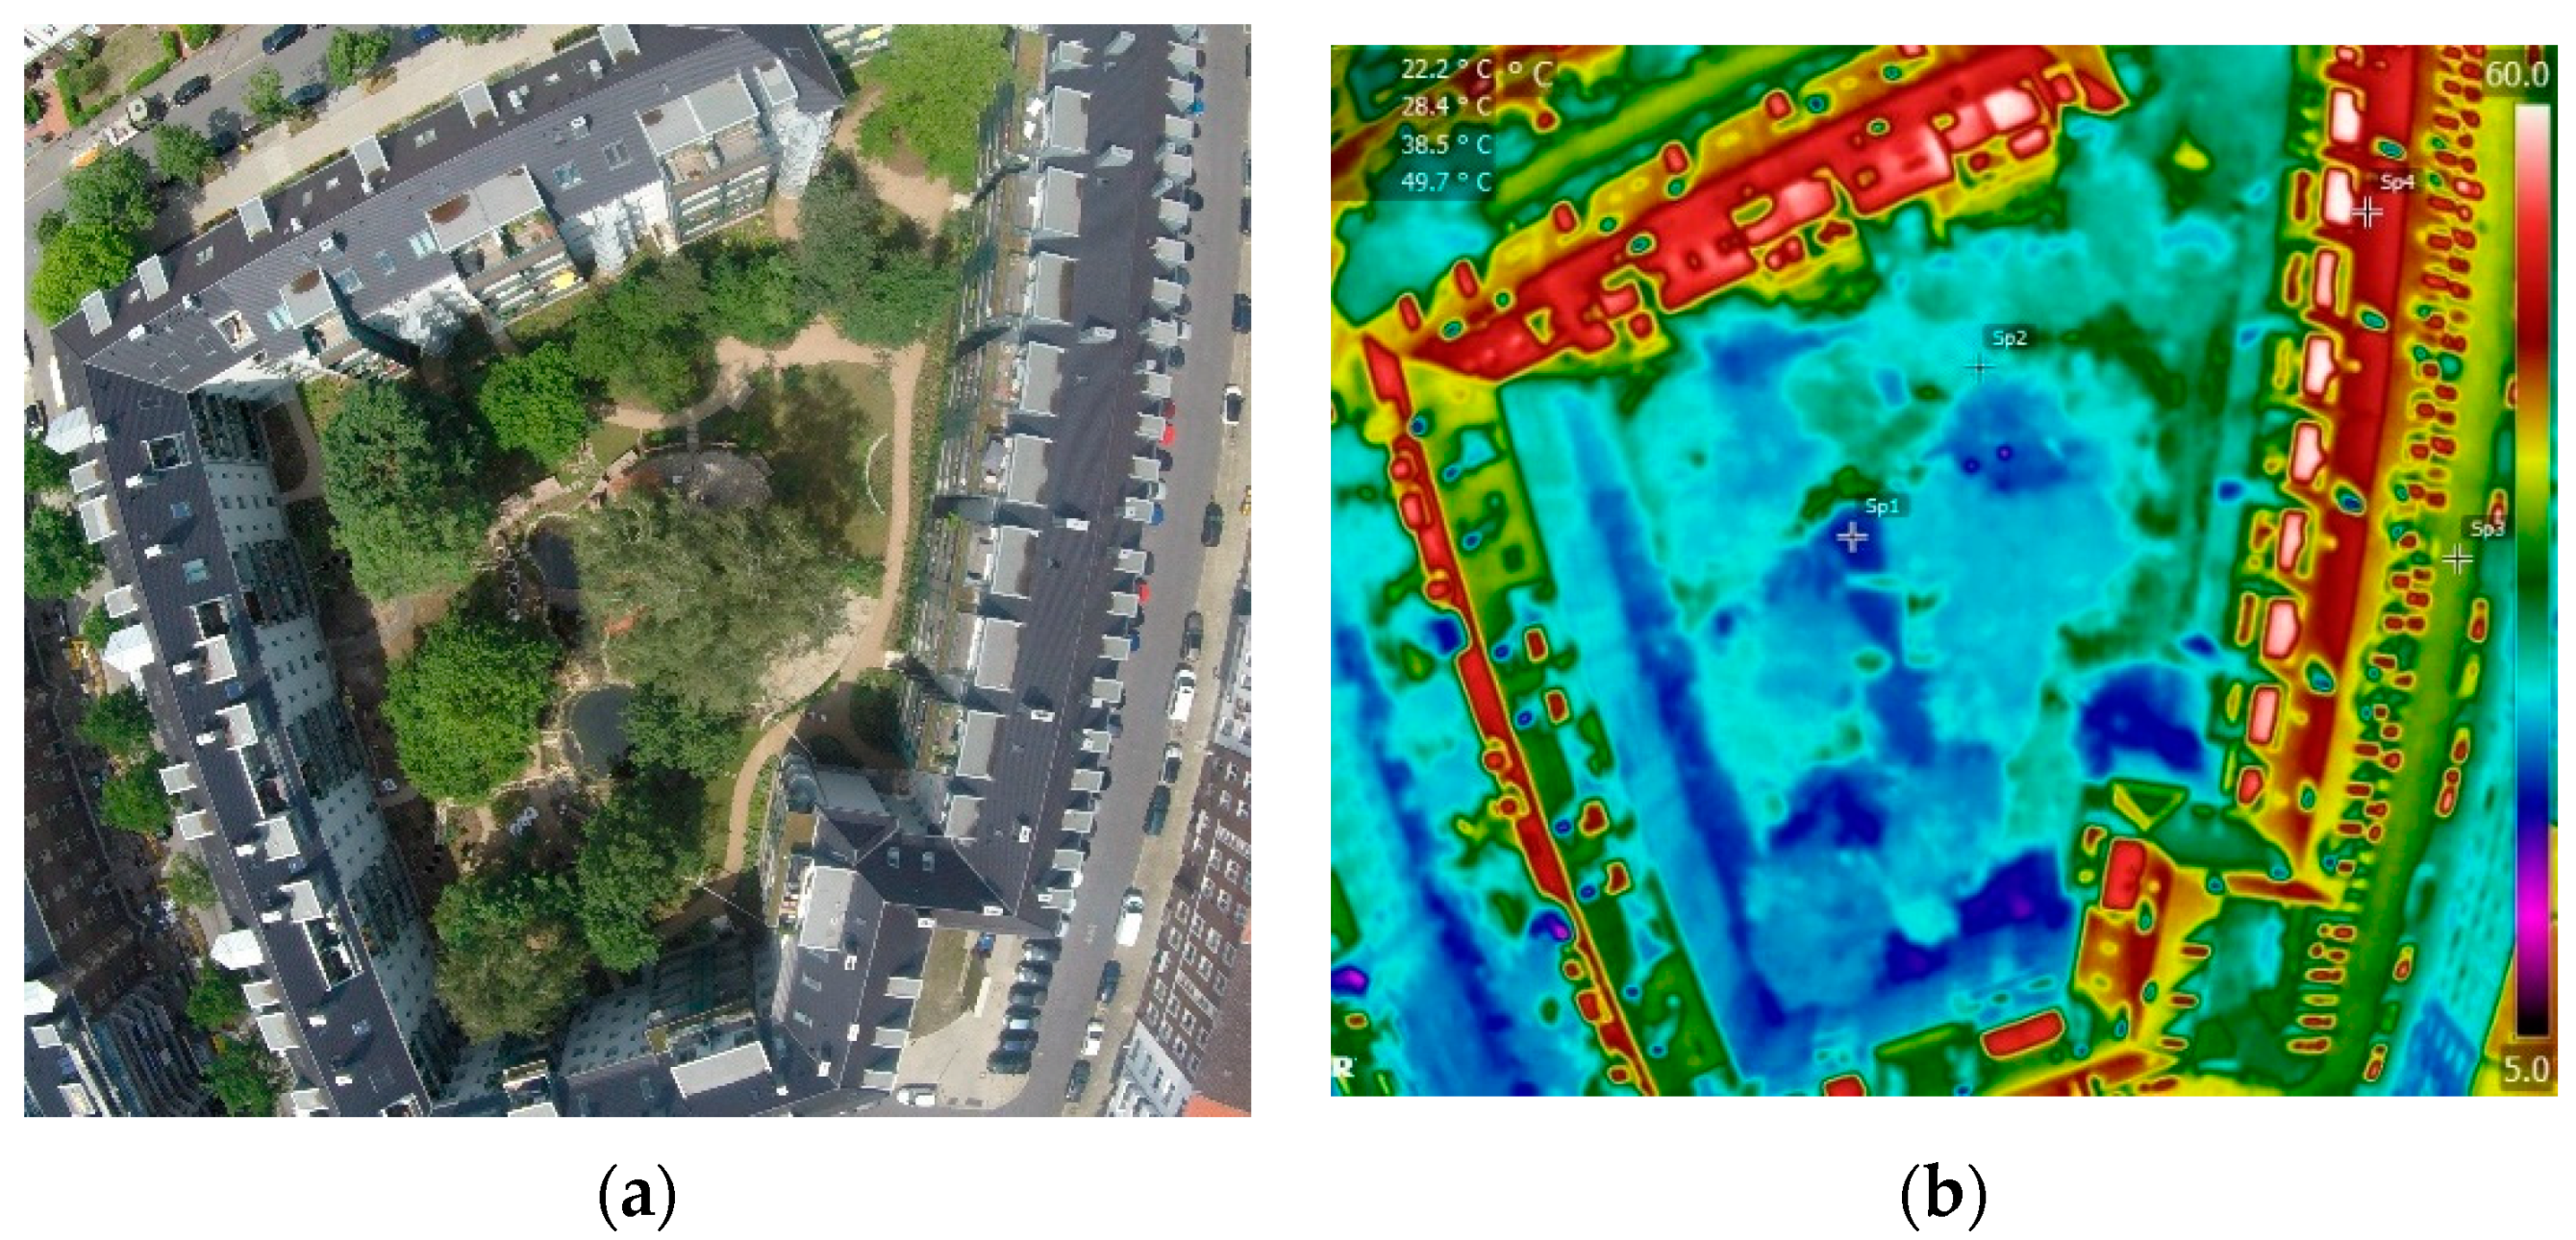
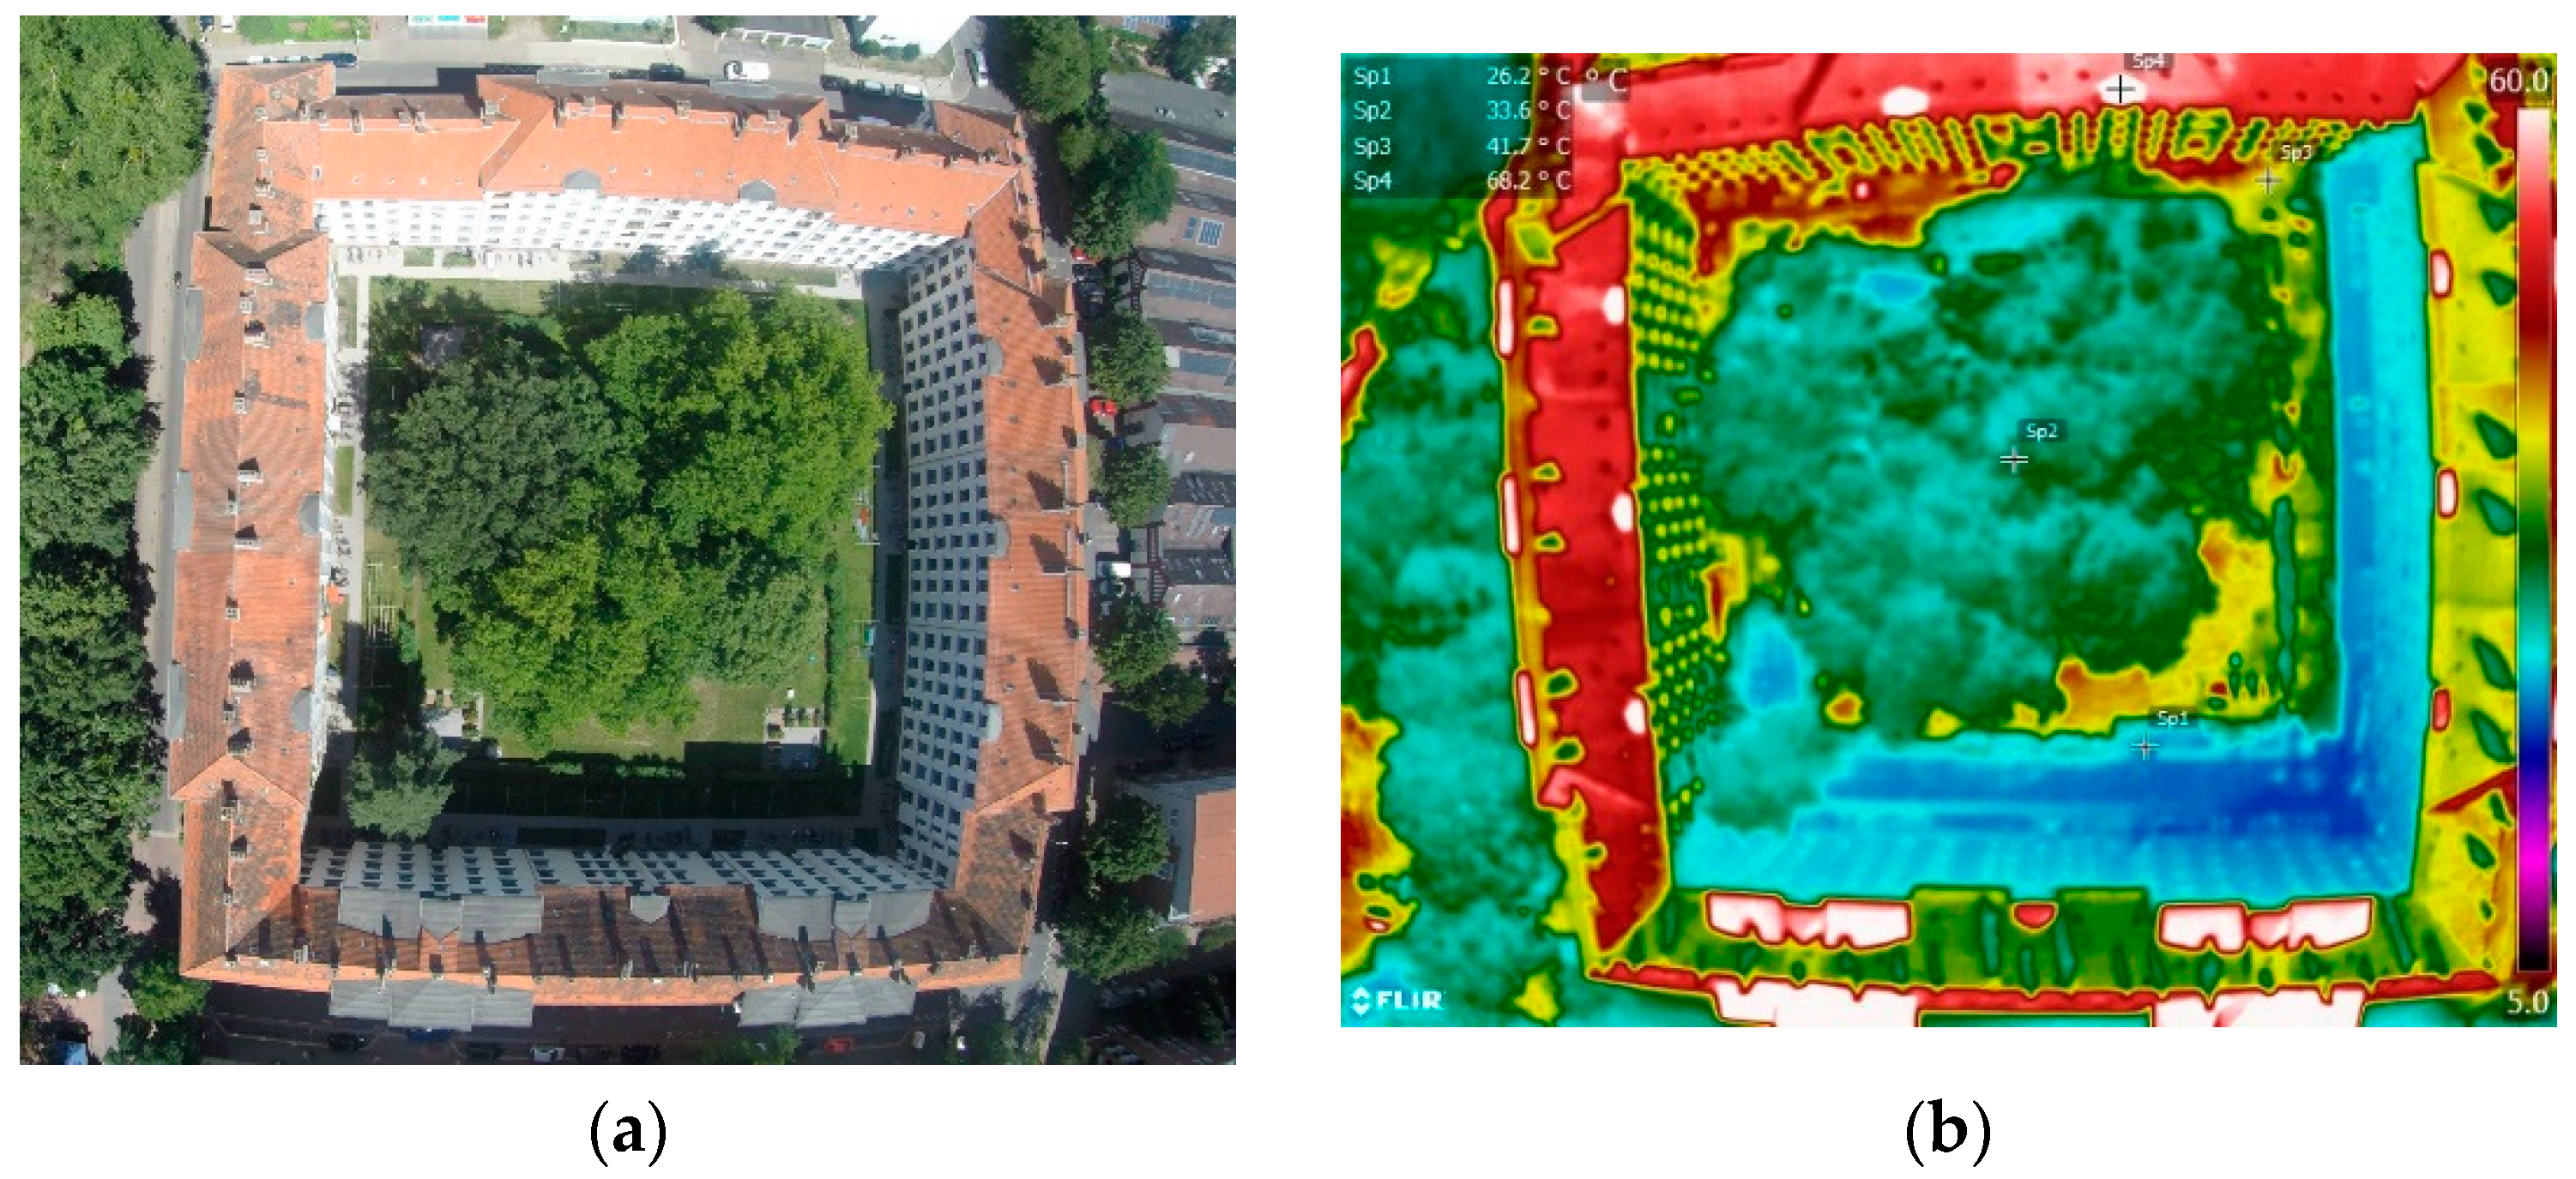
3.5. Drone Measurement
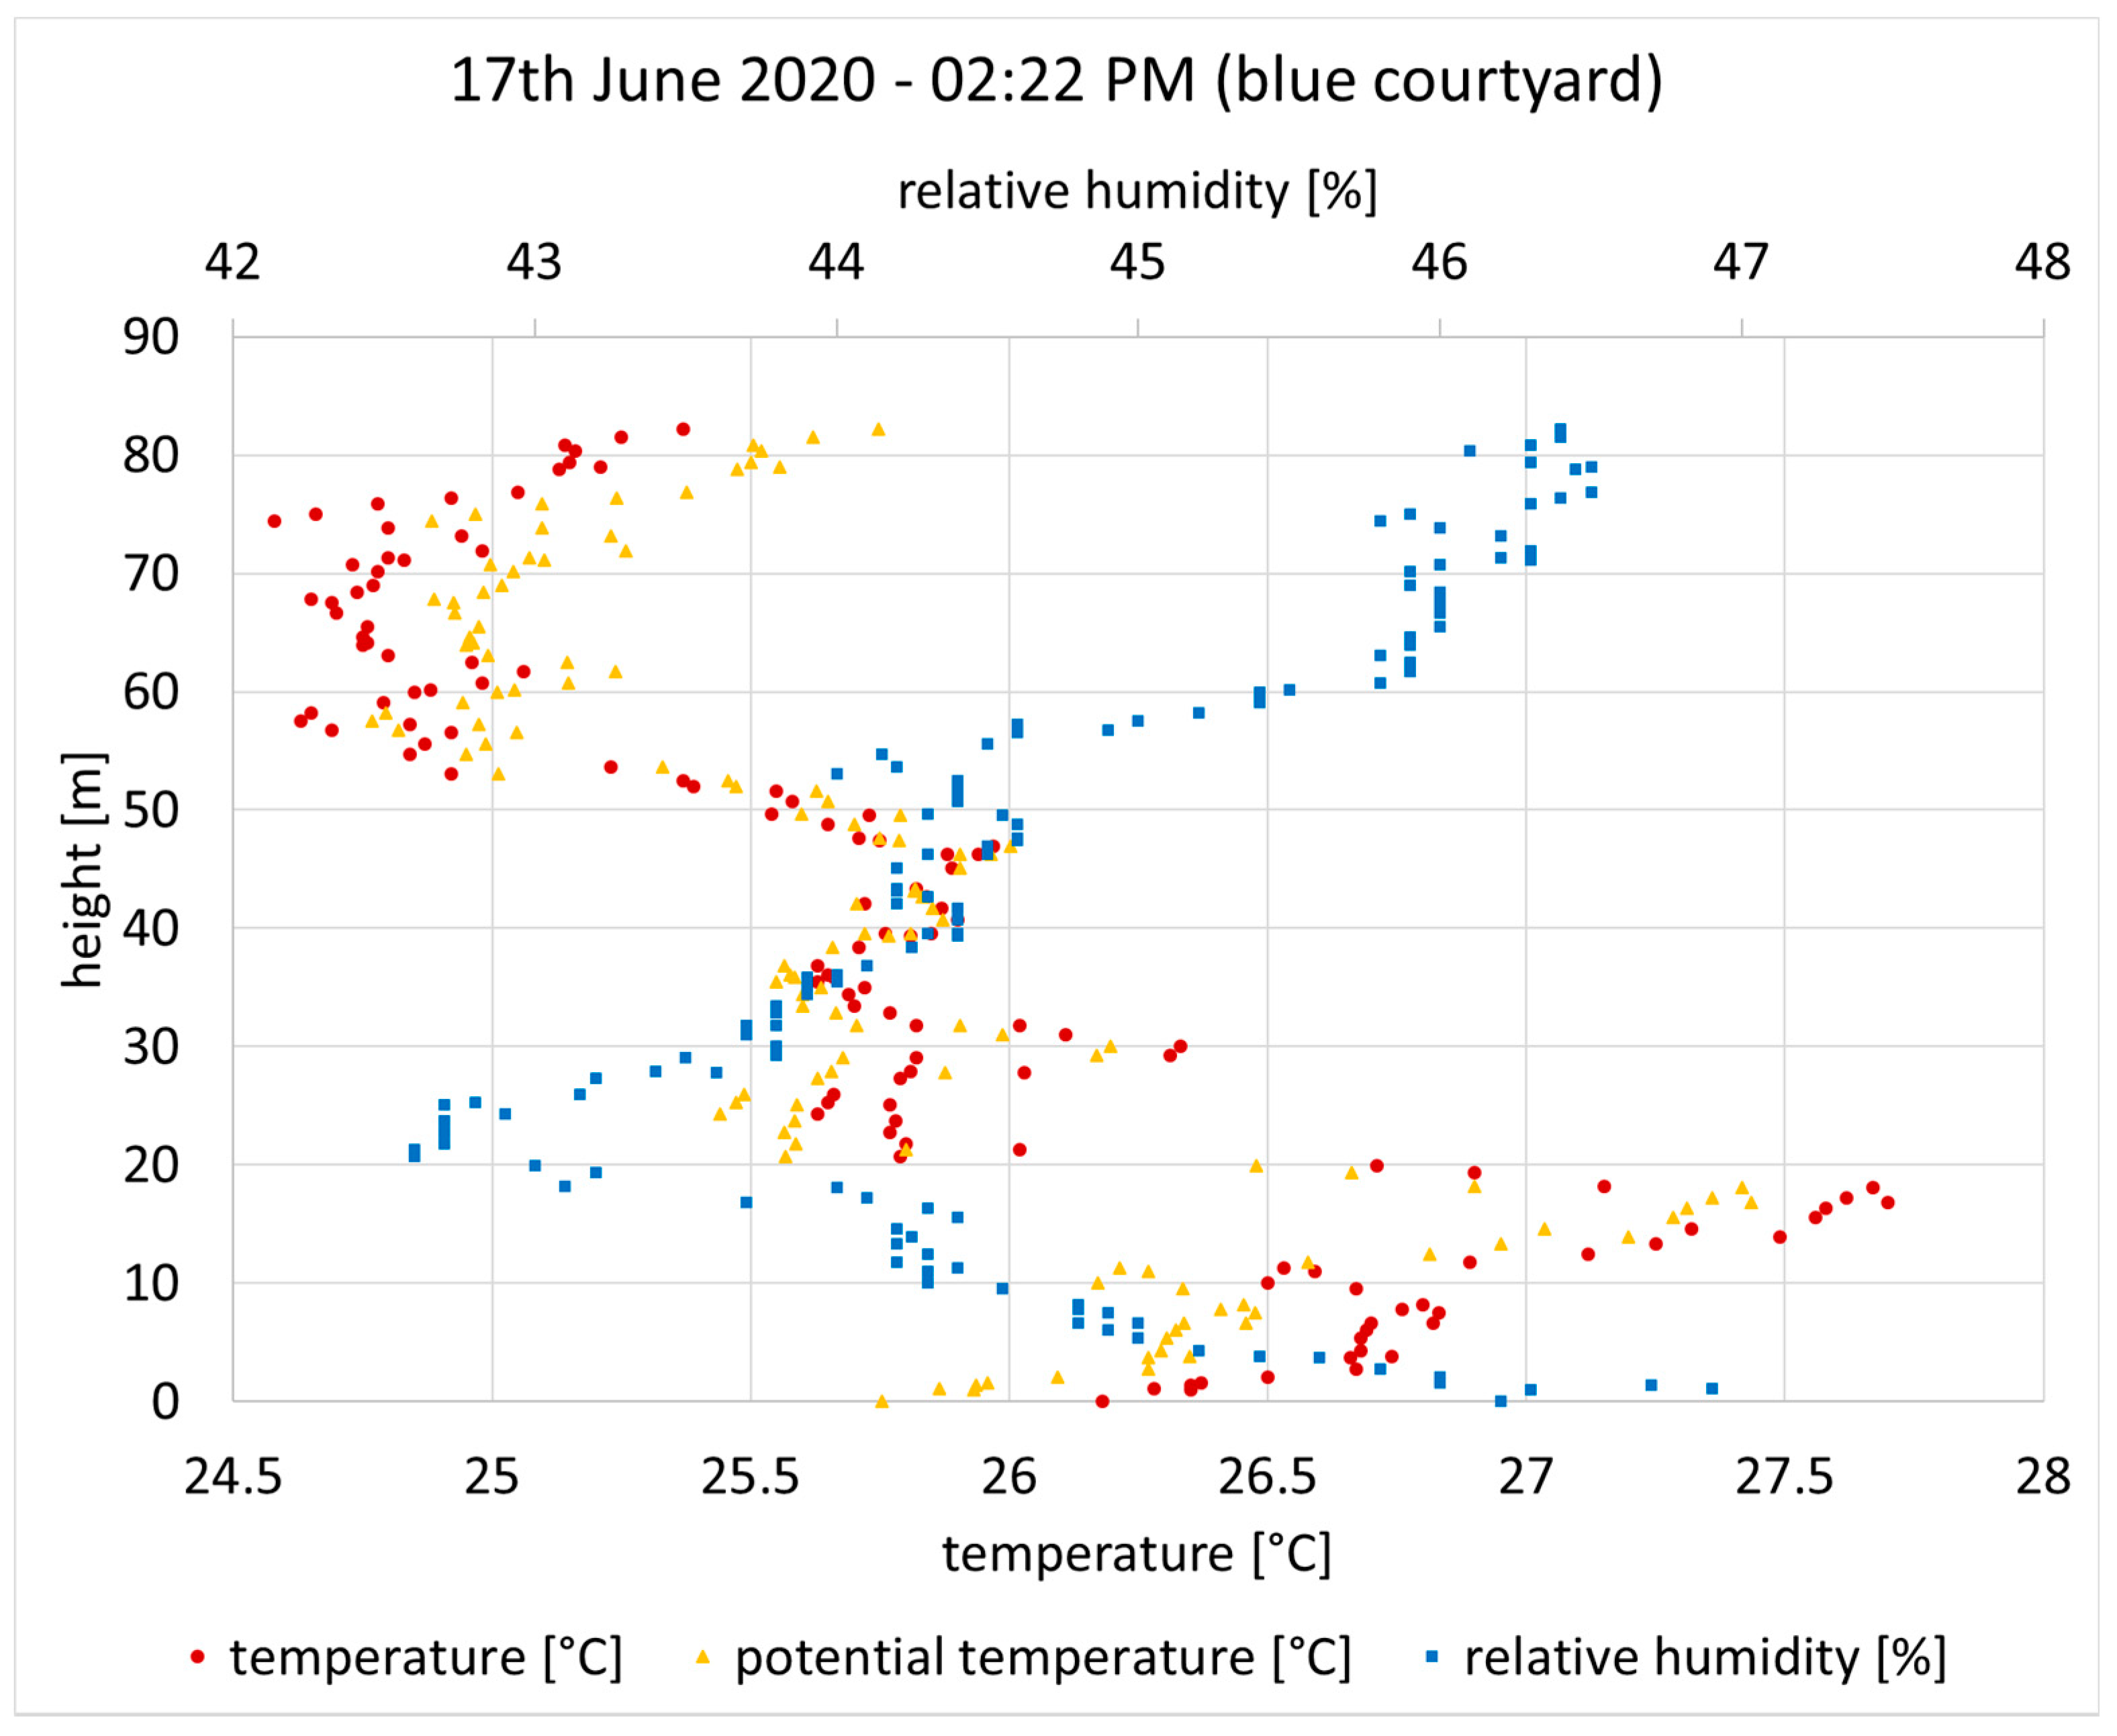
3.5.1. Blue Courtyard (Südstadt) Measurements
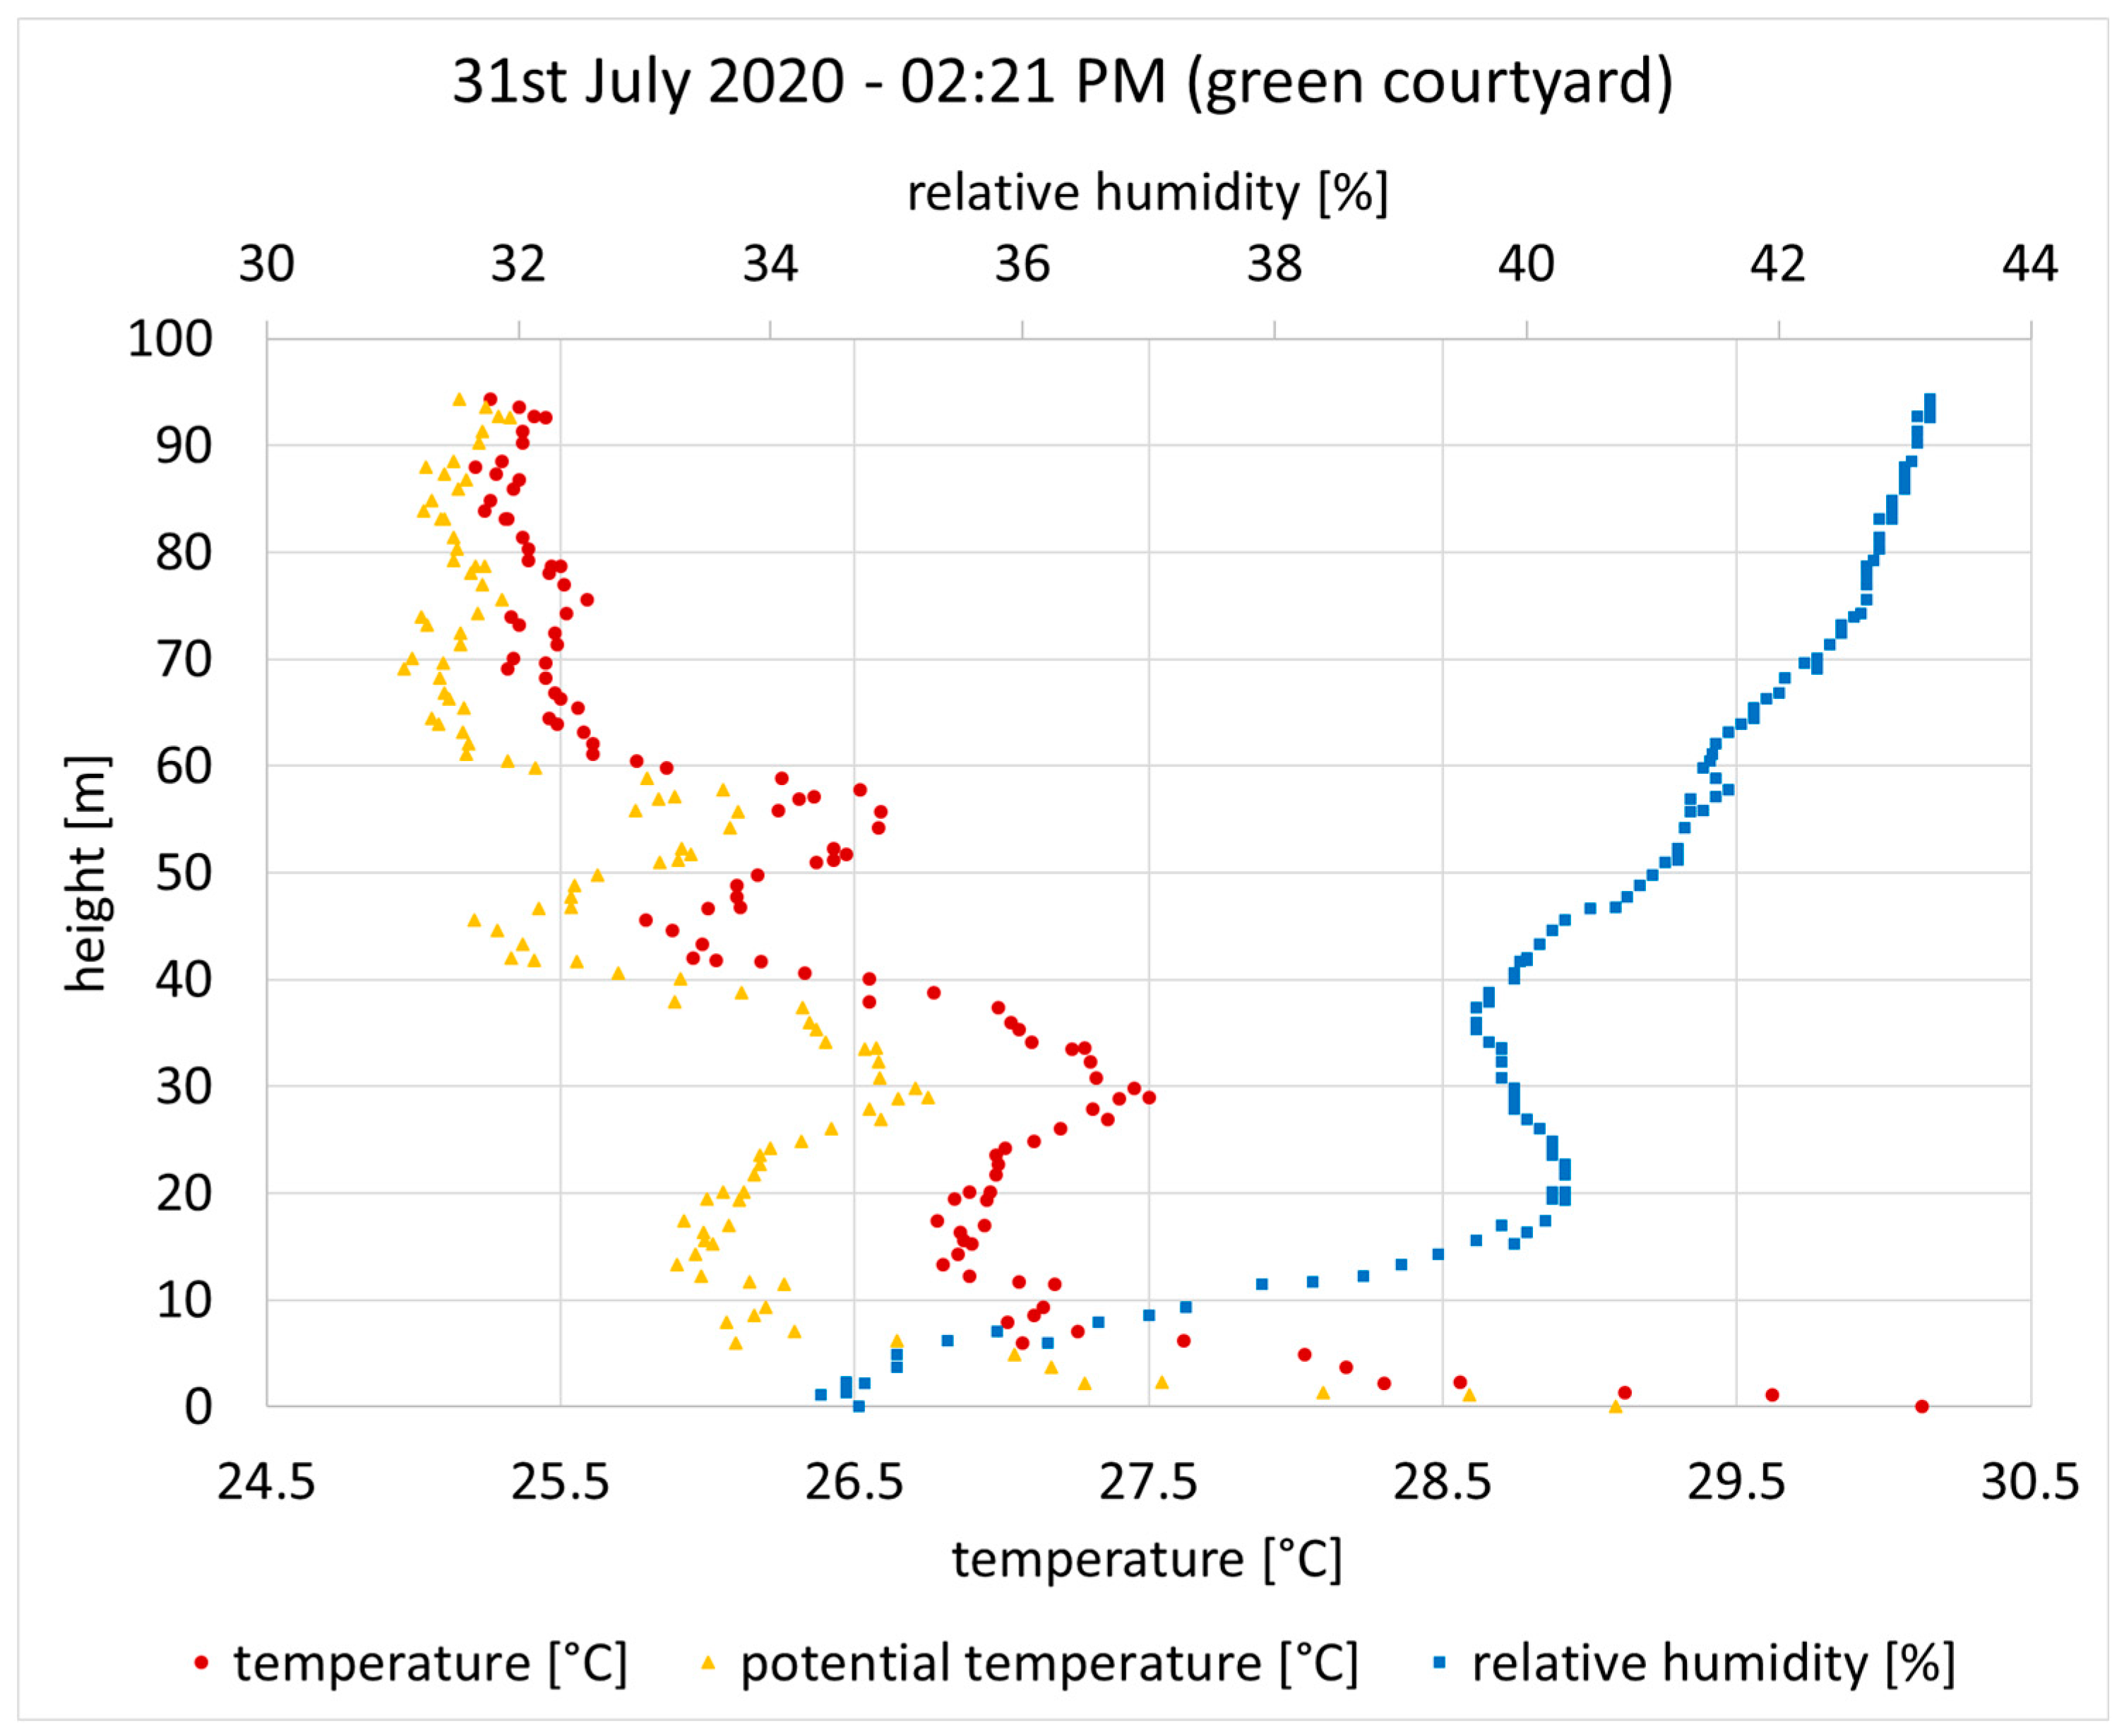
3.5.2. Green Courtyard (Linden) Drone Measurements
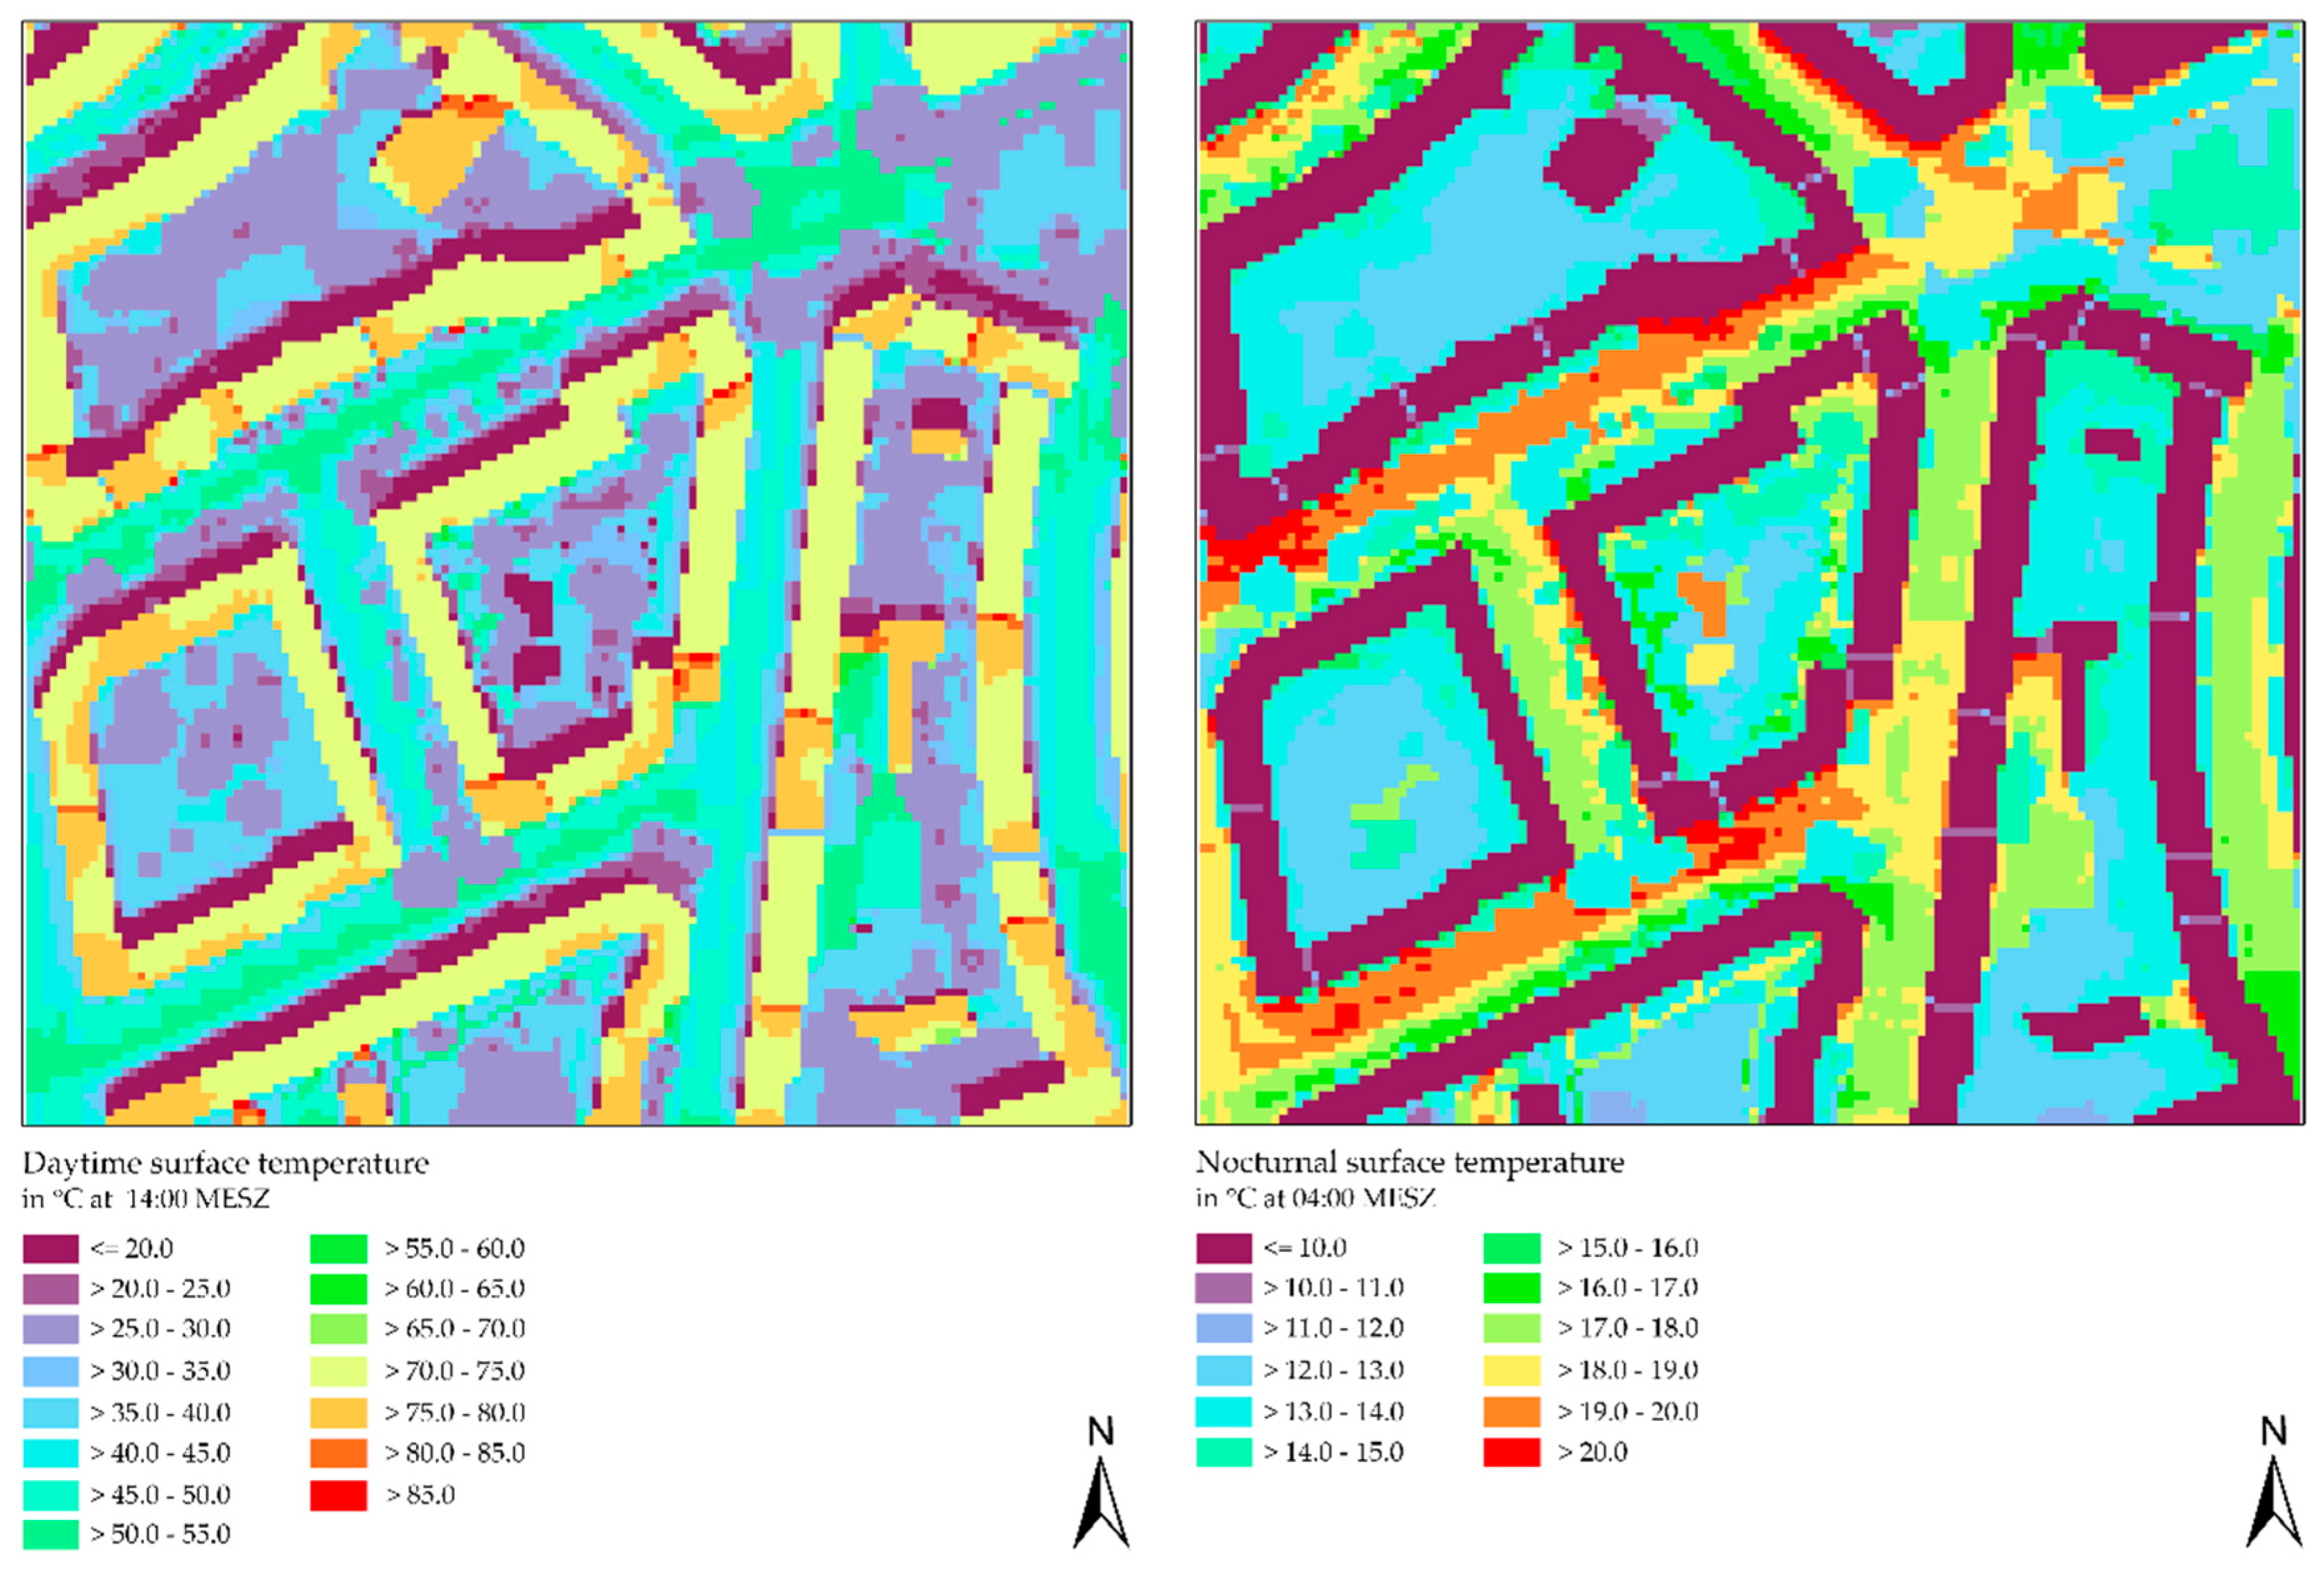
3.6. PALM Simulation
4. Discussion
5. Conclusions and Outlook
Author Contributions
Funding
Acknowledgments
Conflicts of Interest
Appendix A

| Variables | Manufacturer | Equipment | Accuracy | Range | Resolution |
|---|---|---|---|---|---|
| air temperature | LAMBRECHT meteo | THP[pro] Modbus | ±0.1 K (0…60 °C) and ±0.2 K (−40…0 °C) | −40…+70 °C | 0.1 °C |
| air pressure | LAMBRECHT meteo | THP[pro] Modbus | ±2 hPa (at −30…+70 °C) ±1 hPa (at −10…+60 °C) ±0.5 hPa (at 25 °C) | 500…1100 hPa | 0.1 hPa |
| relative humidity | LAMBRECHT meteo | THP[pro] Modbus | typ. ±1.5% (0…80%) r.h. ±2% (>80%) r. h. | 0…100% r. F. | 0.1% r. F. |
| water temperature | HOBO® | Pendant® MX 2201 | ±0.5 °C from −20 °C to 70 °C | 20 °C to 70 °C in air −20 °C to 50 °C in water | 0.04 °C |
| precipitation | LAMBRECHT meteo | rain[e]one Modbus | 0.1 mm or 2% | 0.005…∞ mm (no limit) | 0.001 mm (impulse outlet: 0.01 mm) |
| global radiation | LAMBRECHT meteo | Second Class Pyranometer, 16,103.5 series | Long-term stability <±1% change per year Non-linearity <±1% (100 to 1000 W/m2) Directional error <±25 W/m2 Spectral selectivity <±5% (0.35 to 1.5 × 10⁻⁶ m) Temperature response <±3% (−10 to +40 °C) | measurement range 0 to 2000 W/m2 nominal operating temperature range −40 to +80 °C spectral range 285 to 3000 × 10−9 m | Resolution of irradiance 0.2 W/m2 |
Appendix B
Appendix C
References
- Hajat, S.; Armstrong, B.; Baccini, M.; Biggeri, A.; Bisanti, L.; Russo, A.; Paldy, A.; Menne, B.; Kosatsky, T. Impact of high temperatures on mortality: Is there an added heat wave effect? Epidemiology 2006, 17, 632–638. [Google Scholar] [CrossRef] [PubMed]
- Zacharias, S.; Koppe, C.; Mücke, H.-G. Climate Change Effects on Heat Waves and Future Heat Wave-Associated IHD Mortality in Germany. Climate 2015, 3, 100–117. [Google Scholar] [CrossRef] [Green Version]
- German Meteorological Service (DWD). Weather and Climate Lexicon: Heat Warning. Available online: https://www.dwd.de/DE/leistungen/hitzewarnung/hitzewarnung.html (accessed on 28 October 2021).
- Manoli, G.; Fatichi, S.; Schläpfer, M.; Yu, K.; Crowther, T.W.; Meili, N.; Burlando, P.; Katul, G.G.; Bou-Zeid, E. Magnitude of urban heat islands largely explained by climate and population. Nature 2019, 573, 55–60. [Google Scholar] [CrossRef] [PubMed]
- Castiglia, F.R.; Wilkinson, S.J. Attenuating heat stress through green roof and green wall retrofit. Build. Environ. 2018, 140, 11–22. [Google Scholar] [CrossRef]
- Huynen, M.M.; Martens, P.; Schram, D.; Weijenberg, M.P.; Kunst, A.E. The impact of heat waves and cold spells on mortality rates in the Dutch population. Environ. Health Perspect. 2001, 109, 463–470. [Google Scholar] [CrossRef] [PubMed]
- An der Heiden, M.; Muthers, S.; Niemann, H.; Buchholz, U.; Grabenhenrich, L.; Matzarakis, A. Estimation of heat-related deaths in Germany between 2001 and 2015 (Schätzung hitzebedingter Todesfälle in Deutschland zwischen 2001 und 2015). Bundesgesundheitsblatt-Gesundh. Gesundh. (Health Res.) 2019, 5, 571–579. [Google Scholar] [CrossRef] [PubMed]
- Federal Office for the Environment (Bundesamt für Umwelt/BAFU). Heat in Cities: Basis for Climate-Adapted Urban Development (Hitze in Städten: Grundlage für Eine Klimaangepasste Stadtentwicklung); Federal Office for the Environment: Sachsen, Germany, 2018.
- Patryk, A.; Świerk, D.; Krzyżaniak, M. Statistical Review of Quality Parameters of Blue-Green Infrastructure Elements Important in Mitigating the Effect of the Urban Heat Island in the Temperate Climate (C) Zone. Int. J. Environ. Res. Public Health 2020, 17, 7093. [Google Scholar]
- Bin, Z.; Rybski, D.; Kropp, J.P. On the statistics of urban heat island intensity. Geophys. Res. Lett. 2013, 40, 5486–5491. [Google Scholar]
- Oke, T.R. The energetic basis of the urban heat island. Q. J. R. Meteorol. Soc. 1982, 108, 1–24. [Google Scholar] [CrossRef]
- Stewart, I.D.; Oke, T.R. Local climate zones for urban temperature studies. Bull. Am. Meteorol. Soc. 2012, 93, 1879–1900. [Google Scholar] [CrossRef]
- Zeder, J.; Fischer, E.M. Observed extreme precipitation trends and scaling in Central Europe. Weather Clim. Extrem. 2020, 29, 100266. [Google Scholar] [CrossRef]
- Federal Government. German Climate Change Adaptation Strategy; Federal Government: Berlin, Germany, 2008.
- Merz, B.; Blöschl, G.; Vorogushyn, S.; Dottori, F.; Aerts, J.C.; Bates, P.; Bertola, M.; Kemter, M.; Kreibich, H.; Lall, U.; et al. Causes, impacts and patterns of disastrous river floods. Nat. Rev. Earth Environ. 2021, 2, 592–609. [Google Scholar] [CrossRef]
- Reaños Tovar, M.A. Floods, flood policies and changes in welfare and inequality: Evidence from Germany. Ecol. Econ. 2021, 180, 106879. [Google Scholar] [CrossRef]
- Bolik, I. Amphibious Urban Spaces: Integration of Decentralized Stormwater Management into Public Open Space in the Context of Climate-Adaptive Urban Redevelopment (Amphibishe Stadträume: Integration eines Dezentralen Regenwassermanagements in den Öffentlichen Freiraum im Rahmen eines Klimaadaptiven Stadtumbaus). Master’s Thesis, Technical University Darmstadt, Darmstadt, Germany, 2019. [Google Scholar]
- Senate Department for Urban Development and the Environment. Climate Adaption for Berlin; Senate Department for Urban Development and the Environment: Berlin, Germany, 2008. [Google Scholar]
- City of Freiburg im Breisgau, Urban Planning Office. Climate Adaption Concept (Ein Entwicklungskonzept für das Handlungsfeld “Hitze“). 2019. Available online: https://www.freiburg.de/pb/site/Freiburg/get/params_E-1310426138/1340076/2_Klimaanpassungskonzept_Ma%C3%9Fnahmenplan.pdf (accessed on 4 November 2021).
- Reynolds, J.S. Courtyards. Aesthetic, Social and Thermal Delight; John Wiley & sons Inc.: New York, NY, USA, 2002. [Google Scholar]
- Vuckovic, M.; Kiesel, K.; Mahdavi, A. Studies in the assessment of vegetation impact in the urban context. Energy Build. 2017, 145, 331–341. [Google Scholar] [CrossRef]
- Lower Saxony State Office for Statistics. Statistische Berichte Niedersachsen: Bevölkerung der Gemeinden; Lower Saxony State Office for Statistics: Hannover, Germany, 2020. [Google Scholar]
- Statistics Office of the State Capital Hannover. The Urban Area of the State Capital Hannover in Figures. Available online: https://www.hannover.de/Leben-in-der-Region-Hannover/Politik/Wahlen-Statistik/Statistikstellen-von-Stadt-und-Region/Statistikstelle-der-Landeshauptstadt-Hannover/Hannover-kompakt/Stadtgebiet (accessed on 18 November 2021).
- Czorny, E.; Schmidt, D.; Elsner, K.; Beier, M. Building resilience in urban neighborhoods: Reducing heat stress by integrating the water sector (German Article). Transform. Cities 2020, 5, 70–74. [Google Scholar]
- City of Hannover. Leben mit dem Klimawandel–Hannover Passt sich an (Living with Climate Change-Hannover Adapts); Landeshauptstadt Hannover: Hanover, Germany, 2017. [Google Scholar]
- Technical University Berlin. [UC]2-Urban CLimate Under Change. Available online: http://www.uc2-program.org (accessed on 18 March 2022).
- Maronga, B.; Banzhaf, S.; Burmeister, C.; Esch, T.; Forkel, R.; Fröhlich, D.; Fuka, V.; Gehrke, K.F.; Geletič, J.; Giersch, S.; et al. Overview of the PALM model system 6.0. Geosci. Model Dev. 2020, 13, 1335–1372. [Google Scholar] [CrossRef]
- German Meteorological Service (DWD). Weather and Climate Lexicon: Hot Day. Available online: https://www.dwd.de/DE/service/lexikon/Functions/glossar.html?lv2=101094&lv3=101162 (accessed on 23 September 2021).
- Steger, L.; Well, F.; Ludwig, F. Blue-green infrastructures: Transformation studies of urban open spaces using the example of Frankfurt (Blau-grüne Infrastrukturen: Transformationsstudien urbaner Freiräume am Beispiel von Frankfurt). Transform. Cities 2020, 5, 58–63. [Google Scholar]
- German Meteorological Service (DWD). Weather and Climate Lexicon: Heat Wave. Available online: https://www.dwd.de/DE/service/lexikon/Functions/glossar.html?lv2=101094&lv3=624852 (accessed on 23 September 2021).
- German Meteorological Service (DWD). Weather and Climate Lexicon: Tropical Night. Available online: https://www.dwd.de/DE/service/lexikon/Functions/glossar.html?nn=103346&lv2=102672&lv3=102802 (accessed on 23 September 2021).
- Fenner, D.; Mücke, H.-G.; Scherer, D. Inner-City Air Temperature as an Indicator of Health Stress in Large Cities, Using the Example of Berlin (Innerstädtische Luttemperatur als Indikator gesundheitlicher Belastungen in Großstädten am Beispiel Berlins); Umwelt und Mensch-Informationsdienst (Environment and Man-Information Service), 2015; Available online: https://www.umweltbundesamt.de/sites/default/files/medien/378/publikationen/innerstaedtische_lufttemperatur_30-38.pdf (accessed on 30 March 2022).
- Federal Environmental Agency (Umweltbundesamt). Indicator: Hot Days. Available online: https://www.umweltbundesamt.de/daten/umweltindikatoren/indikator-heisse-tage#die-wichtigsten-fakten (accessed on 30 March 2022).
- Weather Lexicon (wetter.net). Amplitude. Available online: https://www.wetter.net/wetterlexikon/eintrag/amplitude (accessed on 30 March 2022).
- German Meteorological Service (DWD). Weather and Climate Lexicon: Inversion. Available online: https://www.dwd.de/DE/service/lexikon/Functions/glossar.html?lv2=101224&lv3=101280 (accessed on 17 November 2021).
- German Meteorological Service (DWD). Weather and Climate Lexicon: Autochthonous Weather. Available online: https://www.dwd.de/DE/service/lexikon/Functions/glossar.html?lv2=100072&lv3=100304 (accessed on 28 February 2022).
- Meusel, G.; Institute for Meteorology and Climatology (IMuK), Hannover, Germany. Data Transfer after Drone Flight. Personal Communication, 2020. [Google Scholar]
- Federal Environmental Agency (Umweltbundesamt). Investigation of the Potential for the Use of Rainwater for Evaporative Cooling in Cities: Final Report; Federal Environmental Agency (Umweltbundesamt): Dessau-Roßlau, Germany, 2019.
- Federal Environmental Agency (Umweltbundesamt). Air Temperature Indicators: Hot Days and Tropical Nights. Available online: https://www.umweltbundesamt.de/daten/umwelt-gesundheit/gesundheitsrisiken-durch-hitze#indikatoren-der-lufttemperatur-heisse-tage-und-tropennachte (accessed on 28 February 2022).
- Ministry for Environment, Energy, Food and Forestry. Answer to Question by Member of Pariament Andreas Hartenfels (BÜNDNIS 90/DIE GRÜNEN)–Printed Matter 17/14185–: Heat Days and Tropical Nights in the Year 2020; Ministry for Environment, Energy, Food and Forestry: Berlin, Germany, 2021. [Google Scholar]
- Fenner, D.; Meier, F.; Scherer, D.; Polze, A. Spatial and temporal air temperature variability in Berlin, Germany, during the years 2001–2010. Urban Clim. 2014, 10, 308–331. [Google Scholar] [CrossRef]
- German Meteorological Service (DWD). Weather and Climate Dictionary: Summer Day. Available online: https://www.dwd.de/DE/service/lexikon/Functions/glossar.html?lv2=102248&lv3=102522 (accessed on 28 February 2022).
- Architectural Office Kozjak. Site Plan Inner Courtyard (An der Tiefenriede/Engelhardstraße/Böhmerstraße/Wilhelm-Bünte-Straße); Architectural Office Kozjak: Kozjak, Croatia, 2019. [Google Scholar]
- Authority for GLL Hannover, Cadastral Office. Hannover Real Estate Map: Parcel 25, 01390/429; Surveying and Cadastral Administration of Lower Saxony: Hannover, Germany, 2009. [Google Scholar]
- Google Maps. Courtyard Hannover-Linden Brackebuschstr./Wilhelm-Bluhmstr./Berdingstr./Leinaustr; Pictures GeoBasis-DE/BKG, GeoContent, Maxar Technologies, Map Data GeoBasis-DE/BKG; 2022; Available online: https://www.marriott.com/en-us/hotels/hajcy-courtyard-hannover-maschsee/overview/?scid=7f0ceae7-4b15-4889-ab3b-881bada3e4c6&gclid=EAIaIQobChMIk8P21I-T-AIV0tKWCh1PhAeZEAAYASAAEgKRyfD_BwE&gclsrc=aw.ds (accessed on 30 March 2022).
- Gartenheim eG, Hannover, Germany. Information Courtyard and Building (An der Tiefenriede/Engelhardstraße/Böhmerstraße/Wilhelm-Bünte-Straße). Personal Communication. 2019. Available online: https://www.gartenheim.de/aktuelles/transmit-erste-auswertungen.html (accessed on 28 February 2022).
- Wedemeier, M.-L.; Hannover, Germany. Information Courtyard and Building (Engelhardstraße/Mendelssohnstraße/Böhmerstraße/Wilhelm-Bünte-Straße). Personal communication, 2021. [Google Scholar]
- Spar- und Bauverein, Hannover, Germany. Cross Sections Building Brackebuschstr./Leinaustr./Wilhelm-Blum-Str./Berdingstr. from 1926/1946. Personal communication, 2020. [Google Scholar]
- Spalink-Sievers Landscape Architects. Overview of Courtyard Remodeling (WE 0120): Brackebuschstr./Leinaustr./Berdingstr./Wilhelm-Bluhm-Str.; Spar- und Bauverein: Hannover, Germany, 2018. [Google Scholar]
- Sperling, I.; Spar- und Bauverein, Hannover, Germany. Permission Request for Reprinting the Overview of Courtyard Remodeling (WE 0120). Personal communication, 2022. [Google Scholar]
- Krugmann, G.; German Meteorological Service (DWD), Climate Office Hamburg, Hamburg, Germany. Information Regarding the Surroundings of the Mobile DWD Stations. Personal communication, 2021. [Google Scholar]
- Schilke, H.; Institute for Meteorology and Climatology (IMuK), Karlsruhe, Germany. Air Temperature Data from the Herrenhausen Measuring Tower and Permission of Use. Personal communication, 2021. [Google Scholar]


| Information | Courtyard 1 | Courtyard 2 | Courtyard 3 |
|---|---|---|---|
| Designation | “blue courtyard” | “comparison courtyard” | “green courtyard” |
| Owner | Housing cooperative Gartenheim eG | Trust GmbH Wedemeier Treuhand | Housing cooperative spar + bau |
| Location | Hannover Südstadt | Hannover Südstadt | Hannover Linden |
| Size | ~3652.10 m2 | ~3696 m2 | ~3700 m2 |
| BGI Specification | Blue elements
| No blue elements | No blue elements |
Green elements
| Green elements
| Green elements
| |
other elements
| other elements
| other elements
| |
| Evaluation | weather station | - | - |
| drone measurement | - | drone measurement | |
| Simulation | Simulation | - |
| T [°C] Courtyard (C) | T [°C] Airport (A) | T [°C] MBA | T [°C] WD | T [°C] KP | |
|---|---|---|---|---|---|
| 6 August 2020 | 31.3 | 31.8 | 32.5 | 32.1 | 31.6 |
| 7 August 2020 | 32 | 32.2 | 32.9 | 32.7 | 32.1 |
| 8 August 2020 | 34.9 | 35.7 | 36.6 | 36.3 | 35.5 |
| 9 August 2020 | 33.9 | 35.1 | 34.8 | 34.9 | 34.5 |
| 10 August 2020 | 30.5 | 31.2 | 30.6 | 31.1 | 30.1 |
| 11 August 2020 | 33.1 | 33.3 | 33 | 33.4 | 32.8 |
| 12 August 2020 | 32.7 | 33.4 | 32.8 | 33.2 | 32.5 |
| 13 August 2020 | 30.6 | 31.1 | 31.3 | 30.8 | 30.6 |
| MAX | 34.9 | 35.7 | 36.6 | 36.3 | 35.5 |
| MIN | 30.5 | 31.1 | 30.6 | 30.8 | 30.1 |
| Δ C-A | Δ C-MBA | Δ C-WD | Δ C-KP | |
|---|---|---|---|---|
| 6 August 2020 | −0.5 | −1.2 | −0.8 | −0.3 |
| 7 August 2020 | −0.2 | −0.9 | −0.7 | −0.1 |
| 8 August 2020 | −0.8 | −1.7 | −1.4 | −0.6 |
| 9 August 2020 | −1.2 | −0.9 | −1 | −0.6 |
| 10 August 2020 | −0.7 | −0.1 | −0.6 | 0.4 |
| 11 August 2020 | −0.2 | 0.1 | −0.3 | 0.3 |
| 12 August 2020 | −0.7 | −0.1 | −0.5 | 0.2 |
| 13 August 2020 | −0.5 | −0.7 | −0.2 | 0 |
| MAX Δ | −1.2 | −1.7 | −1.4 | −0.6 |
| MIN Δ | −0.2 | +/−0.1 | −0.2 | 0 |
| T [°C] Courtyard (C) | T [°C] Airport (A) | T [°C] MBA | T [°C] WD | T [°C] KP | |
|---|---|---|---|---|---|
| 8 August 2020 | 18.5 | 17.7 | 19.6 | 20.9 | 16.1 |
| 9 August 2020 | 21.8 | 19.3 | 22.9 | 22.2 | 19.4 |
| 10 August 2020 | 20.8 | 18.7 | 21.4 | 21.6 | 19.3 |
| 11 August 2020 | 20 | 18 | 20.6 | 20.3 | 19.4 |
| 12 August 2020 | 20.1 | 18.4 | 20.3 | 20.6 | 18.9 |
| 13 August 2020 | 22 | 20.8 | 22 | 22.4 | 20.5 |
| 14 August 2020 | 21.8 | 19.4 | 21.6 | 21.6 | 20.2 |
| 15 August 2020 | 19.3 | 18.5 | 19 | 19.7 | 17.8 |
| 16 August 2020 | 18.8 | 16.4 | 19 | 19.6 | 17.1 |
| 17 August 2020 | 20.1 | 18.6 | 19.5 | 20.2 | 18.5 |
| 18 August 2020 | 17 | 14.6 | 16.7 | 17.6 | 15.7 |
| 19 August 2020 | 15.9 | 13.6 | 15.3 | 16.4 | 13.7 |
| 20 August 2020 | 19.3 | 19.4 | 19.3 | 20.2 | 17.9 |
| 21 August 2020 | 21.7 | 21.9 | 22.4 | 22.9 | 20.2 |
| 22 August 2020 | 20.7 | 18 | 20.3 | 20.9 | 19.2 |
| MAX | 22 | 21.9 | 22.9 | 22.9 | 20.5 |
| MIN | 15.9 | 13.6 | 15.3 | 16.4 | 13.7 |
| Δ C-A | Δ C-MBA | Δ C-WD | Δ C-KP | |
|---|---|---|---|---|
| 8 August 2020 | 0.8 | −1.1 | −2.4 | 2.4 |
| 9 August 2020 | 2.5 | −1.1 | −0.4 | 2.4 |
| 10 August 2020 | 2.1 | −0.6 | −0.8 | 1.5 |
| 11 August 2020 | 2 | −0.6 | −0.3 | 0.6 |
| 12 August 2020 | 1.7 | −0.2 | −0.5 | 1.2 |
| 13 August 2020 | 1.2 | 0 | −0.4 | 1.5 |
| 14 August 2020 | 2.4 | 0.2 | 0.2 | 1.6 |
| 15 August 2020 | 0.8 | 0.3 | −0.4 | 1.5 |
| 16 August 2020 | 2.4 | −0.2 | −0.8 | 1.7 |
| 17 August 2020 | 1.5 | 0.6 | −0.1 | 1.6 |
| 18 August 2020 | 2.4 | 0.3 | −0.6 | 1.3 |
| 19 August 2020 | 2.3 | 0.6 | −0.5 | 2.2 |
| 20 August 2020 | −0.1 | 0 | −0.9 | 1.4 |
| 21 August 2020 | −0.2 | −0.7 | −1.2 | 1.5 |
| 22 August 2020 | 2.7 | 0.4 | −0.2 | 1.5 |
| MAX Δ | 2.7 | −1.1 | −2.4 | 2.4 |
| MIN Δ | −0.1 | 0 | −0.1 | 0.6 |
Publisher’s Note: MDPI stays neutral with regard to jurisdictional claims in published maps and institutional affiliations. |
© 2022 by the authors. Licensee MDPI, Basel, Switzerland. This article is an open access article distributed under the terms and conditions of the Creative Commons Attribution (CC BY) license (https://creativecommons.org/licenses/by/4.0/).
Share and Cite
Beier, M.; Gerstendörfer, J.; Mendzigall, K.; Pavlik, D.; Trute, P.; von Tils, R. Climate Impact and Model Approaches of Blue-Green Infrastructure Measures for Neighborhood Planning. Sustainability 2022, 14, 6861. https://doi.org/10.3390/su14116861
Beier M, Gerstendörfer J, Mendzigall K, Pavlik D, Trute P, von Tils R. Climate Impact and Model Approaches of Blue-Green Infrastructure Measures for Neighborhood Planning. Sustainability. 2022; 14(11):6861. https://doi.org/10.3390/su14116861
Chicago/Turabian StyleBeier, Maike, Jessica Gerstendörfer, Katja Mendzigall, Dirk Pavlik, Peter Trute, and Robert von Tils. 2022. "Climate Impact and Model Approaches of Blue-Green Infrastructure Measures for Neighborhood Planning" Sustainability 14, no. 11: 6861. https://doi.org/10.3390/su14116861
APA StyleBeier, M., Gerstendörfer, J., Mendzigall, K., Pavlik, D., Trute, P., & von Tils, R. (2022). Climate Impact and Model Approaches of Blue-Green Infrastructure Measures for Neighborhood Planning. Sustainability, 14(11), 6861. https://doi.org/10.3390/su14116861