Article

A Sustainability Improvement Strategy of Interconnected Data Centers Based on Dispatching Potential of Electric Vehicle Charging Stations

1
School of Electrical Engineering, Beijing Jiaotong University, Beijing 100044, China
2
State Grid Shanxi Marketing Service Center, Taiyuan 030032, China
3
State Grid Electric Vehicle Service Company, Ltd., Beijing 100052, China
*
Author to whom correspondence should be addressed.
Sustainability 2022, 14(11), 6814; https://doi.org/10.3390/su14116814
Submission received: 29 April 2022 / Revised: 22 May 2022 / Accepted: 31 May 2022 / Published: 2 June 2022

Abstract

:
With the rapid development of information technology, the electricity consumption of Internet Data Centers (IDCs) increases drastically, resulting in considerable carbon emissions that need to be reduced urgently. In addition to the introduction of Renewable Energy Sources (RES), the joint use of the spatial migration capacity of IDC workload and the temporal flexibility of the demand of Electric Vehicle Charging Stations (EVCSs) provides an important means to change the carbon footprint of the IDC. In this paper, a sustainability improvement strategy for the IDC carbon emission reduction was developed by coordinating the spatial-temporal dispatch flexibilities of the IDC workload and the EVCS demand. Based on the Minkowski sum algorithm, a generalized flexible load model of the EVCSs, considering traffic flow and Road Impedance (RI) was formulated. The case studies show that the proposed method can effectively increase the renewable energy consumption, reduce the overall carbon emissions of multi-IDCs, reduce the energy cost of the DCO, and utilize the EV dispatching potential. Discussions are also provided on the relationship between workload processing time delay and the renewable energy consumption rate.

1. Introduction

1.1. Background

With the rapid development of information technologies such as big data, cloud computing, and so on, internet data centers (IDCs) have been widely deployed around the world. Rapidly growing data load causes the explosive growth of electricity load, resulting in an increasingly severe carbon pollution situation [1]. Currently, China’s data center industry uses about 117.181 billion kWh of thermal power throughout the year, resulting in 98.55 million tons of carbon emissions. It is reported that by 2025, carbon emissions from the IDCs will account for 3.2% of global carbon emissions. In 2040, this figure will increase to 14% [2]. This growing trend runs counter to global energy sustainability goals. Europe’s strategy is to drive data centers to be carbon neutral by 2030 [3]. Events like the COVID-19 pandemic also place a special burden on information and communication technology (ICT) [4]. The sustainability of the energy and environment of the IDCs becomes a priority for the ICT industry. Reducing carbon emissions is the main goal and social responsibility of the data center, which is one of the most energy-intensive industries [5]. However, the implementation of a scientific strategy must take into account the economic costs of its wide-scale implementation and the required infrastructure [6]. In addition to the goal of reducing carbon emissions, one of the important driving forces for data center operators to purchase renewable energy is that the price of renewable energy power generation is lower than the current grid price due to the policy support and low-cost generation (thermal power generation accounted for 73.36% of China’s public power grid in March 2022 [7], and the feed-in tariff of thermal power generation is higher than that of solar power generation and wind power generation). At present, low-carbon energy sources are favored by cloud service operators in the ICT industry, such as wind and solar energy. These renewable energy sources (RES) are introduced into the IDCs to supply power, thereby alleviating their carbon pollution problems. A high proportion of RES generation has replaced traditional thermal power in a large proportion. However, due to the intermittent output and the severe lack of adjustment capacity of RES, the IDCs cannot reduce their heavy dependence on traditional energy. Relying solely on purchasing renewable energy is not the most effective solution to the IDC sustainability issues.
To solve this problem, it is necessary to make full use of the flexible dispatching capacity of data load among multiple interconnected IDCs to realize the transfer of electricity load on the spatial scale, which can improve the flexibility of the IDC power consumption and reduce the negative impact of the intermittent RES. The IDC workload has considerable dispatching potential. According to a research report on the IDC energy efficiency released by the National Resource Defense Council, the average utilization rate of servers in a typical IDC is only 12% to 18% of its computing power [8]. Therefore, making full use of the flexible dispatching capability of the IDCs for their workloads is one of the important ways to improve the sustainable development of interconnected IDCs. The IDC workload can be divided into two categories: interactive workload and batch workload. The interactive workload is not time-shiftable. At present, most of the IDC workload dispatching systems under the cloud computing framework will back up the data according to the importance of Interactive workload in the offsite servers in advance. This process is called “redundant backup” [9]. In non-emergency situations, this technique can be used to alter the spatial distribution of workloads. Therefore, it is possible to realize the remote processing of online loads in a very short time by changing the calculation dispatching instructions, which provides the feasibility for the realization of spatial dispatching of workload.
Based on these methods, it is necessary to fully exploit the potential of local adjustable resources in the IDCs to further realize the efficient use of RES and fundamentally reduce the carbon emission pollution caused by traditional energy. Under the vision of sustainable global energy development, the method of replacing gasoline vehicles with electric vehicles (EVs) for decarbonization has been emphasized. The phasing out of sales of new conventional gasoline vehicles by a specified date is one of a series of regulatory policies announced over the past few years. The UK Department for Transport’s report (the “Road to Zero” strategy, or R2Z) proposes an ambition for ultra-low emission vehicles (ULEVs) sales of 50–70% by 2030, ahead of a ban on sales of diesel and petrol cars by 2040 [10]. The development of plug-in electric vehicle (PEV) technology and quantity provide the opportunity to become a flexible and adjustable resource [11]. Plenty of EVs forms a key element of global sustainability strategies.

1.2. Previous Work

At present, many scholars have studied the application of data load spatial dispatching in pieces of literature. Hu. C proposed a Dynamic Time Scale-based server Provision (DTSP) method, considering the variability of workloads when providing servers for workload demands [12]. Yu L. et al. proposed a cross-domain distributed IDC and power system collaborative operation framework to achieve the optimal cost of energy and energy storage investment [13]. Li J. et al. defined the demand responsiveness of the IDC to participate in the electricity market, minimizing electricity costs through dynamic IDC server consolidation and dispatching [14]. Li Y. et al. integrated the utility grid with the IDCs through dynamic pricing, directing workload to areas where green energy is more readily available, reducing the IDC costs [15]. Renugadevi T. et al. proposed renewable energy-aware algorithms to dispatch workload, reducing cloud data center operating costs and carbon emissions [16]. Yang. T proposed a spatio-temporal task migration mechanism to pursue low carbon in dual-dimension without considering the regulation ability of EVs in the future [17].
Some studies utilize UPS backup battery bank response to optimize the IDC performance and improve RES utilization [18,19]. In addition to power components such as wind turbines, solar panels, etc., DATAZERO proposed by PIERSON J M et al. conceives a new IDC electric-gas structure considering supercapacitors and H2 fuel cells [20]. Yu L. et al. integrated the IDC and RES power generation into a microgrid for coordinated operation, and the transfer of data load can reduce the uncertainty of RES power generation [21].
EVs have been widely studied as flexible and adjustable resources to improve the consumption rate of RES. Dai Q. et al. established an integrated system including EV charging stations, small photovoltaic systems, and energy storage systems, effectively improving the utilization of solar energy resources and sustainable urban efficiency [22]. Longo M. et al. showed that the significant introduction of RES and EVs in Canada and Italy can provide huge opportunities for energy production capacity and demand [23]. Yue J. et al. established a microgrid aggregator model including RES and EVs, coordinating the economic desire of microgrid (MG) owners and the stability operation demand of the distribution system operator (DSO) through the Stackelberg game method [24]. In reference [25], Yu L. et al. proposed a total cost minimization problem of the IDC operators by jointly managing the IDC load and EV charging, using ADMM distributed algorithm to achieve joint energy management, reducing the demand charge of the IDC. However, the scenario considered in this study is the charging of EVs of the IDC employees where the IDC can collect the information of each EV and make a dispatching plan. Considering the issue of user privacy protection, this scenario does not apply to the EVCSs open to the public. With the increasing number of EVs and the improvement of load aggregation technology and market, a wider range of EV flexibility resources can be used to reduce the carbon emissions of the IDCs and improve their sustainability. In addition, Li M. analyzed the cyber security risks that may have existed when EVs were connected to the cyber-physical power system [26].
From the previous work, the strategies for joint dispatching of the IDC workload mostly focus on reducing costs, and the impact of their carbon emissions is rarely considered. In addition, the potential of the EVCS has not been fully stimulated, and the research on its use in the IDC energy dispatching needs to be improved. In this study, the carbon emission reduction problem of the spatial-temporal coupling of the IDCs is solved considering the workload space adjustment potential of the IDC and the dispatching potential model of the EVCS.

1.3. Contributions

This work aims to minimize the DCO carbon emissions. Energy-intensive workloads are transferred to locations with sufficient RES for processing, so that excess carbon emissions caused by high-intensity loads are shifted, and these carbon emissions are offset by RES. The data center operator (DCO) can purchase the flexibility resources of an entire EVCS from a load aggregator, so that the DCO can fully utilize the load temporal adjustment capability of the EVCS, for better matching the RES output curve. The main contributions of this paper are presented, as follows:
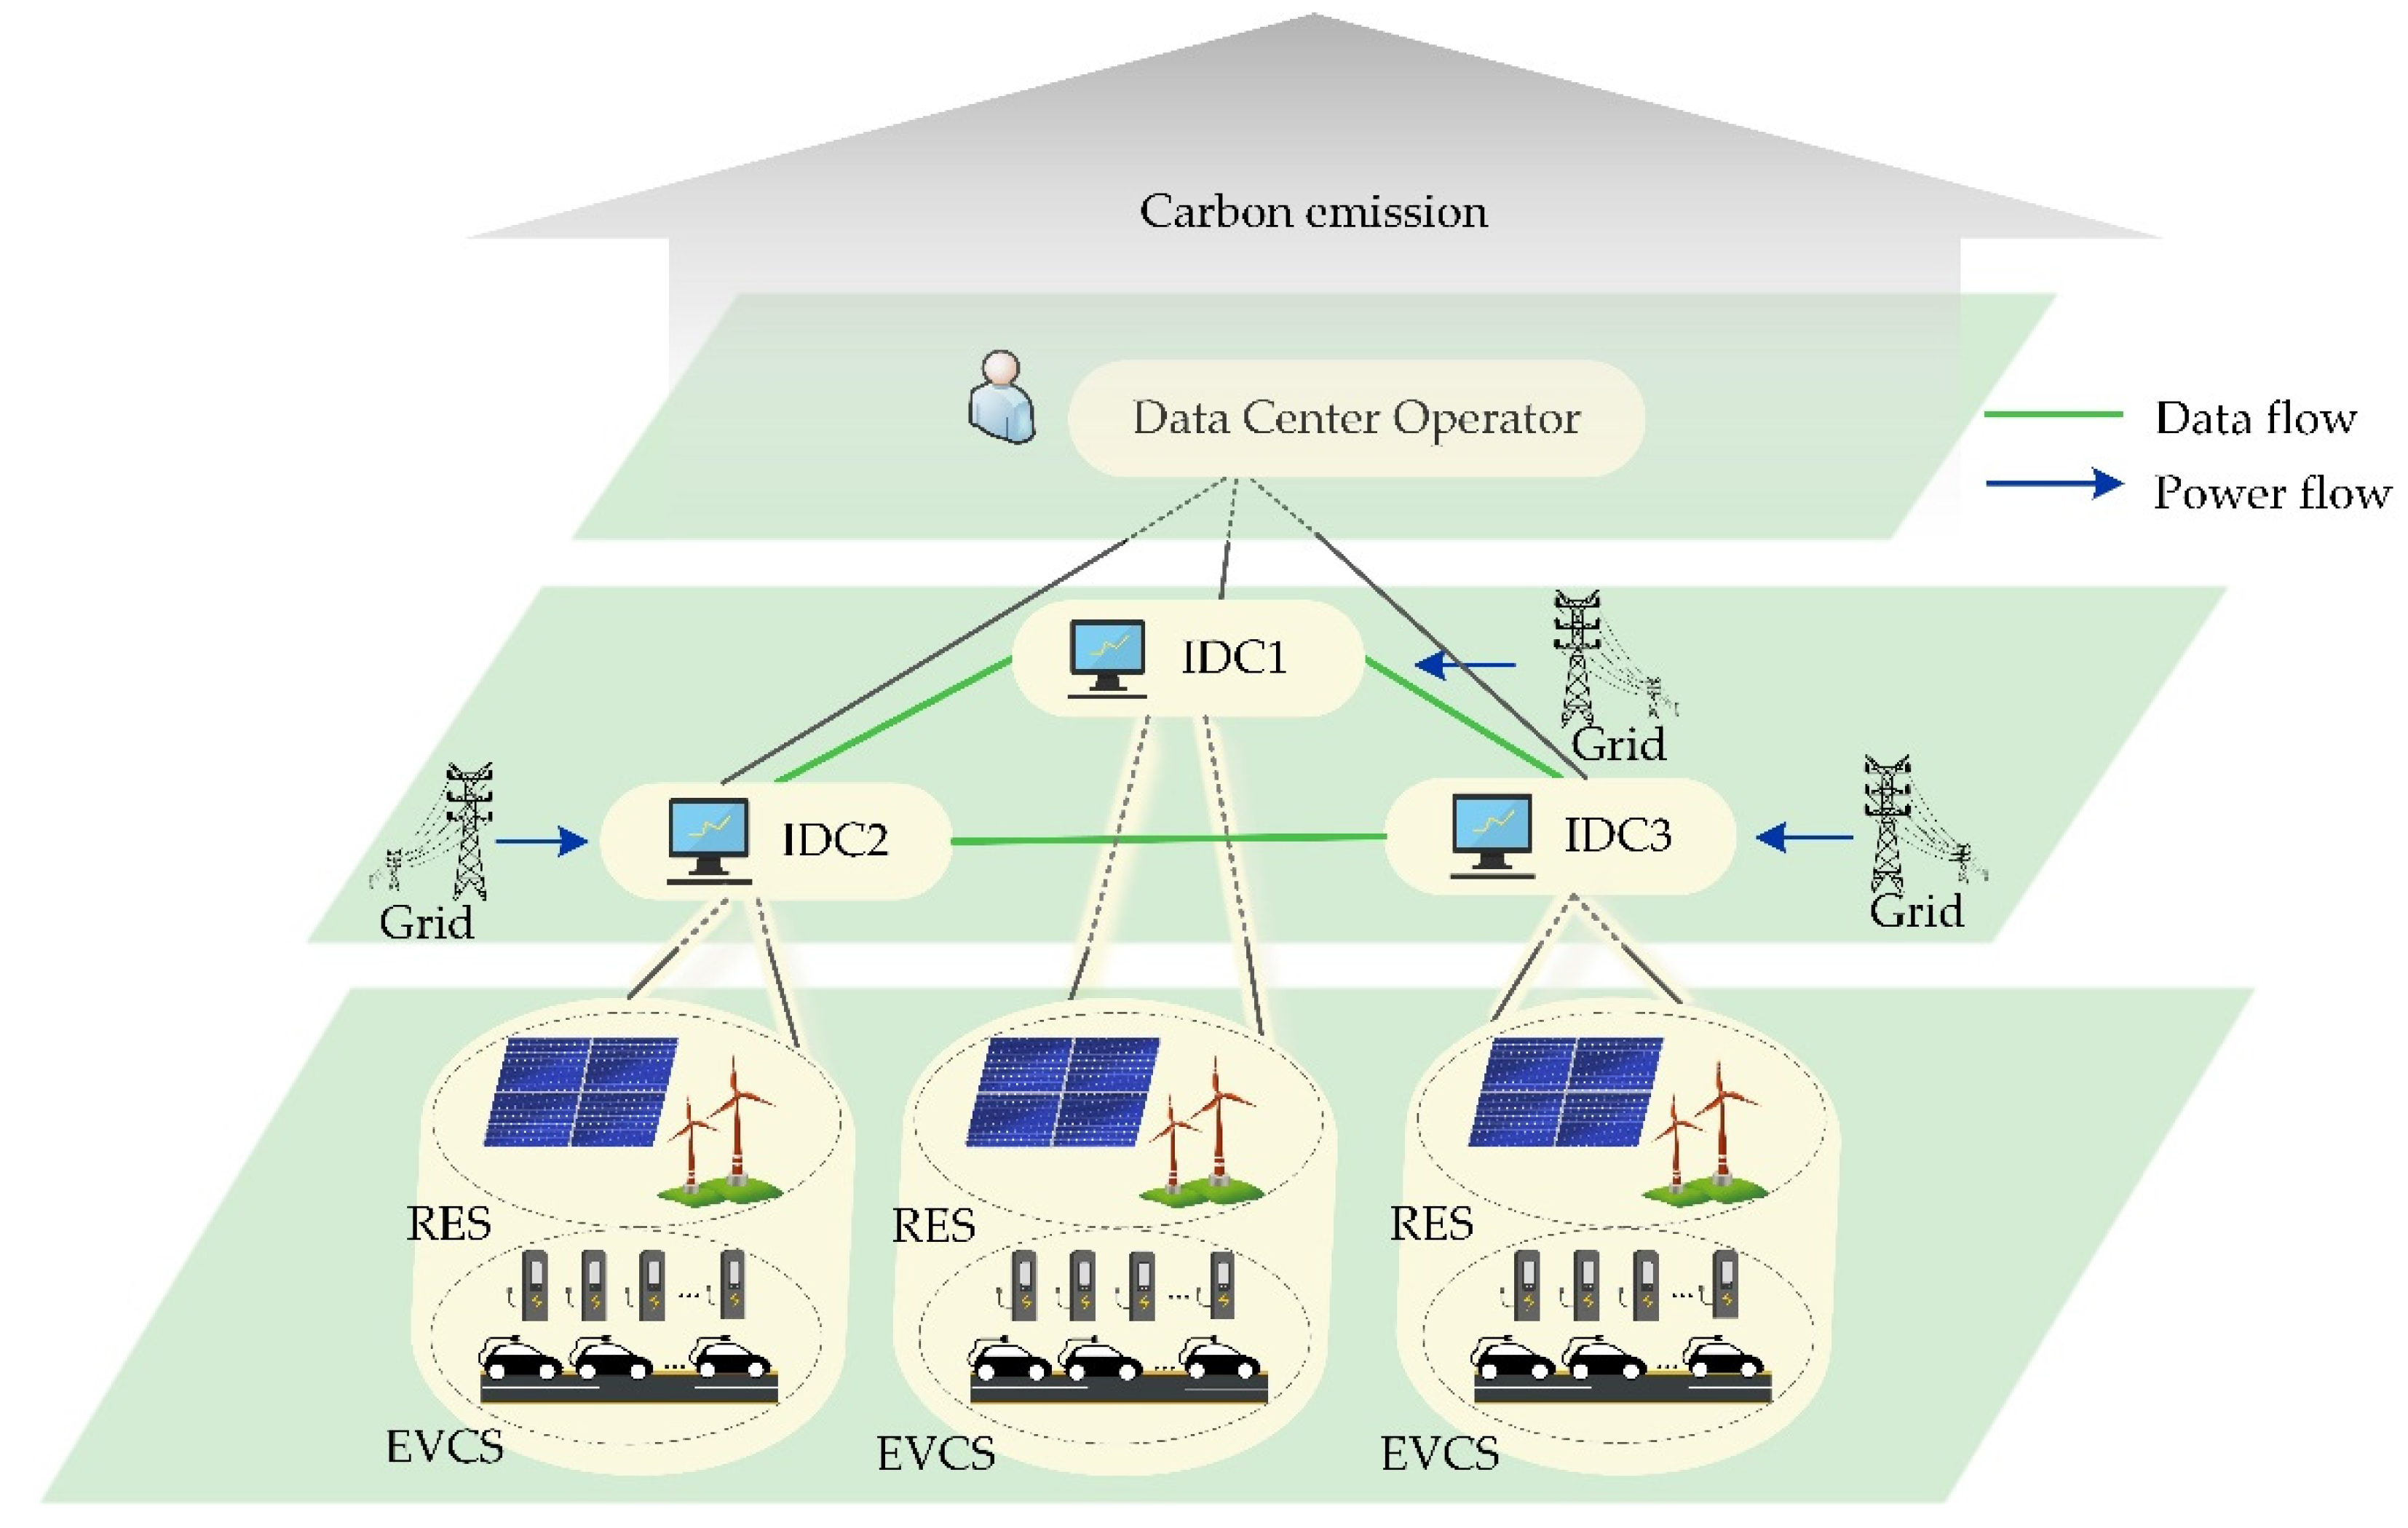
  • A spatial-temporal coupled dispatching strategy aimed at DCO carbon emission reduction is proposed. The spatial dispatching ability of workload in interconnected IDCs and temporal dispatching ability of the EVCSs as generalized flexible load are considered.
  • A generalized flexible load dispatching potential evaluation method for the EVCSs and their surrounding road networks based on the Minkowski sum algorithm is proposed. Combined with the Road Impedance (RI) model, the dispatching potential assessment of the EVCS is more realistic.
  • Based on the proposed strategy, the impact of the time delay of processing workload in the IDC on the carbon emission and renewable energy consumption capacity is analyzed.

1.4. Organization of This Article

The remainder of this paper is organized, as follows. Section 2 introduces the dispatching strategy of the system and DCO carbon emission model. The IDC power consumption model and the EVCS dispatching potential model considering traffic flow are presented in Section 3. Subsequently, the model and solution of the DCO carbon emission optimization problem are completed in Section 4. A case study is conducted and discussed in Section 5. Finally, Section 6 concludes this paper.

2. Problem Formulation

A DCO operating N geographically distributed IDCs is considered. These IDCs are interconnected through the data transmission network, and the workloads can be transmitted between different IDCs, as shown in Figure 1. Due to the structure of power systems, they are located in different regional power grids or distribution networks with their own local RES and EVCS. There is no power flow among different IDCs.
The IDCs consume a lot of power due to the processing workload and they get power from the utility grid, where the carbon emission comes from. To reduce the amount of carbon emission, integrated RES including photovoltaic resources and wind power resources are introduced to the local IDC as one of the main energy sources. There are two ways for IDCs to purchase renewable energy. One is to build solar panels, wind turbines, and supporting energy storage equipment to provide energy for itself. Another way is to buy one-day power generation from local RES aggregators. This paper adopts the second way. With the growing amount of EVs, the demand for EVCS can be introduced to further reduce carbon emission. The EVCS contains multiple chargers that can be charged by EV users. Through the unified management of the EVCS, the whole charging station is modeled as a flexible load that can participate in the joint dispatching of the IDC. As the load aggregator, the economic driving force of the EVCSs participating in joint dispatching needs to be discussed. The EVCSs provide auxiliary services for the DCO and receive the remuneration paid by the DCO. This part of the reward is called capacity price [27]. This tariff is paid for the energy regulated by the EVCSs in response to DCO dispatching instructions. For the DCO, although the EVCSs are paid for auxiliary services, joint dispatching reduces the power purchase of the DCO from the power grid, thereby reducing carbon emissions and power purchase costs. Therefore, this strategy will bring benefits to the EVCSs and the DCO. The scenario premise of this paper is that the chargers in the EVCSs and the intelligent control equipment participating in the joint dispatching are existing, and the EVCSs do not need to pay additional equipment construction costs for this strategy.
For sustainable IDCs, their energy comes mainly from the photovoltaic and wind power resources they purchase, and the energy consumption is mainly used for the operation of the IDC itself, including the operation of servers, refrigeration systems, lighting infrastructure, etc. [28] and the charging power of EVs in the charging station. After the temporal dispatching of the EVCS and the spatial dispatching of the IDC workload, the part of the energy shortage of the proposed system is obtained from the utility grid. Therefore, the power balance constraint of the IDC i ( 1 i N ) is established as Equation (1):
P t , i g r i d + P t , i P V + P t , i W T = P t , i o p r + P t , i E V C S ,
where P t , i P V is the average power generated by the photovoltaic power supply in the IDC i in slot t . P t , i o p r is the average operating power consumption of processing workload in slot t of the IDC i . P t , i E V C S is the average charging power of the EVCS i connected to the IDC i in slot t .
It can be assumed that the carbon emissions from wind power and PV are negligible. It is known that the large amount of energy consumption generated by the driving and charging process of EVs will produce carbon emissions that cannot be ignored. However, in this paper, the EVCS is not directly connected to the utility grid to get power. It is integrated into the power supply and consumption balance system of the IDC so that the energy required for EV charging will be included in the energy consumption of the IDC. Therefore, there is no need to consider the carbon emission of EVs.
The total carbon emission C t generated by the DCO with N IDCs in slot t can be calculated as the sum of the carbon emissions generated by the power purchased by each IDC i from the utility grid in slot t . The equation of carbon emission C t is as follows:
C t = e i N P t , i g r i d Δ t ,
where e is the carbon emission rate of utility grid; Δ t is the duration of time slot; P t , i g r i d is the average power injected by the utility grid into the IDC i in slot t .
The calculation methods and constraints of the IDC operation power consumption model and the EVCS aggregation model will be discussed in detail in the next section.

3. Models for the IDC and the Traffic Flow EVCS

In this section, the mathematical models of the main components in the system are listed, including the IDC operation power consumption model and dispatching potential aggregation model of the EVCS considering traffic flow.

3.1. The IDC Operation Power Consumption Model

The operation power consumption of the IDC mainly includes server power consumption, cooling power consumption, lighting, and other auxiliary infrastructure power consumption. Among them, server power consumption is the energy consumed by the processing workload. The power consumption of the IDC can be regarded as a linear function of server power consumption. For the IDC i with M servers, the equation is as follows:
P t , i o p r = k i m t , i + P i i d l e ,
where P i i d l e is the fixed power consumption necessary to maintain the operation of the IDC i ; k i is the power consumption increased by every increase in the number of active servers of the IDC i , which is set as a constant in this paper; m t , i is the number of active servers in the IDC i in slot t , and it meets:
0 m t , i M i ,
where M i is the total number of servers in the IDC i .
The workload of the IDC includes batch workload and interactive workload. The batch workload is also called offline load. After it reaches the IDC, it does not need to be processed immediately, usually within a few hours. The interactive workload needs to be processed within a very short specified delay, and due to the “redundant backup” technology, they can be migrated between different IDCs, as described in Section 1. The workload mentioned in this article is interactive. Therefore, this strategy is only applicable to interactive workloads. The IDCs provide data processing services to users, and the time delay limit D of data processing will be specified in the service level agreement (SLA) signed in advance. The data load is distributed by the front-end to the active server in the IDC, and its average stay time in the IDC cannot exceed the time delay limit D . μ i is set as the service rate of a single active server in the IDC i , which is a fixed parameter depending on server performance. The constraint on time delay can be written as follows:
0 < 1 / [ μ i L t , i / m t , i ] < D ,
where L t , i is the is the amount of data load reaching the IDC i in slot t .
From Equation (3), the relationship between P t , i opr and m t , i can be deduced and substituted into Equation (4) to obtain Equation (6). By substituting it into Equation (5) and summing i on both sides of the formula, Equation (7) can be obtained.
P i i d l e P t , i o p r k i M i + P i i d l e ,
i = 1 N { [ ( μ i 1 / D ) / k i ] ( P t , i o p r P i i d l e ) } i = 1 N L t , i ,
i = 1 N L t , i = i = 1 N L t , i ,
where μ i , D , k i , P i i d l e and M i are fixed parameters for the IDC operation. i = 1 N L t , i represents the total amount of workload that the DCO needs to process in slot t . L t , i represents the data load that the IDC i needs to process in slot t after dispatching. Equation (6) gives the limits of power consumption of the IDC i . Equation (7) shows the relationship between the power consumption of the IDC i and the amount of workload and the average residence time of workload in the IDC i . Equation (8) specifies that the total amount of workload remains unchanged before and after dispatch.
From the above equations, it can be concluded that when the processing workload of a single IDC i remains the same, the shorter the average residence time of the data load in the IDC i (i.e., shorter processing time), the greater the power consumption generated by the IDC i . When the average residence time of all workload in the IDC i is equal to the time delay limit D specified by the user and the IDC i , the constraint on time delay is:
1 / [ μ i L t , i / m t , i ] = D .
In this case, Equation (7) can be written as:
i = 1 N { [ ( μ i 1 / D ) / k i ] ( P t , i o p r P i i d l e ) } = i = 1 N L t , i .
That is, the power consumption of the IDC i is linear to the number of workload.

3.2. Evaluation Model of Dispatching Potential of the EVCS Considering Traffic Flow

In this subsection, a method to form the aggregated EV model in an EVCS is proposed. The DCO purchases EV flexibility resource services from the EVCS which need to be aggregated. In this paper, the Minkowski sum method is used to model. This method can evaluate the dispatching potential of the EVCS while retaining the original variables and constraints of EVs. In addition, since the charging station is open to the public, the dispatching potential of the EVCS considers the EVs driving in the road network around the EVCS, and a generalized flexible load model considering the road network is established. The DCO can effectively use the dispatching resources of EV polymers on the premise of knowing as little user privacy information as possible.
The following assumptions are considered here:
  • The EVCSs obtain information from the intelligent transportation system (ITS) [29], which includes the historical flow data of the road network and the real-time monitoring data of vehicles. The electric vehicle terminal will upload the real-time battery power information, vehicle location information, and the maximum charging power allowed by the battery to the ITS.
  • When an EV is connected to the charger in the EVCS, it is considered to obey the dispatching instructions of the EVCS. The specific implementation of dispatching command and control issued by the EVCS to a single charger is not discussed in this paper.
  • Discrete time is applied in the proposed model [30]. The ITS provides the EVCSs with the monitoring data of EVs that need to be charged. The EVCSs calculate their capacity and power changes every 15 min.
Traffic flow is closely related to road congestion. Therefore, this paper assumes that the average congestion x t of the road near the EVCS represents the average distance between every two adjacent vehicles on the road. Combined with the road type and road length in the actual road network, the traffic flow in the nearby area at a certain time, i.e., the total number of electric vehicles, can be calculated as follows:
J i , t = ( R i 2 t y p e ) / x t ,
where J i , t is the total number of vehicles in the area near the EVCS i in slot t ; R i is the total length of roads in the area near the EVCS i ; t y p e represents each road type in the area near the EVCS i , which can be obtained in Equation (12):
t y p e = { 1 ,   branch   road 2 ,   secondary   trunk   road 3 ,   main   trunk   road .
That is, the main trunk road indicates that there are two-way eight lanes; the secondary trunk road indicates that there are two-way four lanes; the branch road indicates that there are two-way two lanes.
This paper takes a part of the actual road network in Beijing, China as the research object. ArcMap10.7 is used to extract and simplify the critical roads from the actual road network. The processed road network map is classified according to Equation (12). As well, there are three charging stations in the simplified road network, as shown in Figure 2b. Figure 2a shows the actual road network in ArcMap10.7 in the blue rectangle in Figure 2b.
When the historical congestion of the road is known, the data-driven method can be used to predict the total number of vehicles at a certain time in the future. Time series prediction models such as SARIMA and LSTM can be used to predict road congestion. This part is not the focus of this paper and will not be described. The EV j position information L j and battery state S O C j , m o n i at a certain time are monitored. According to the charging habits and psychology of EV users, when the battery S O C j , m o n i is lower than the threshold H T , the EV j needs to be charged. As the EV will consume electricity and time during driving, the BPR road impedance (RI) model is introduced to calculate the SOC loss and arrival time of the EV to be charged from the current location to the charging station for the EVCS dispatching potential evaluation.

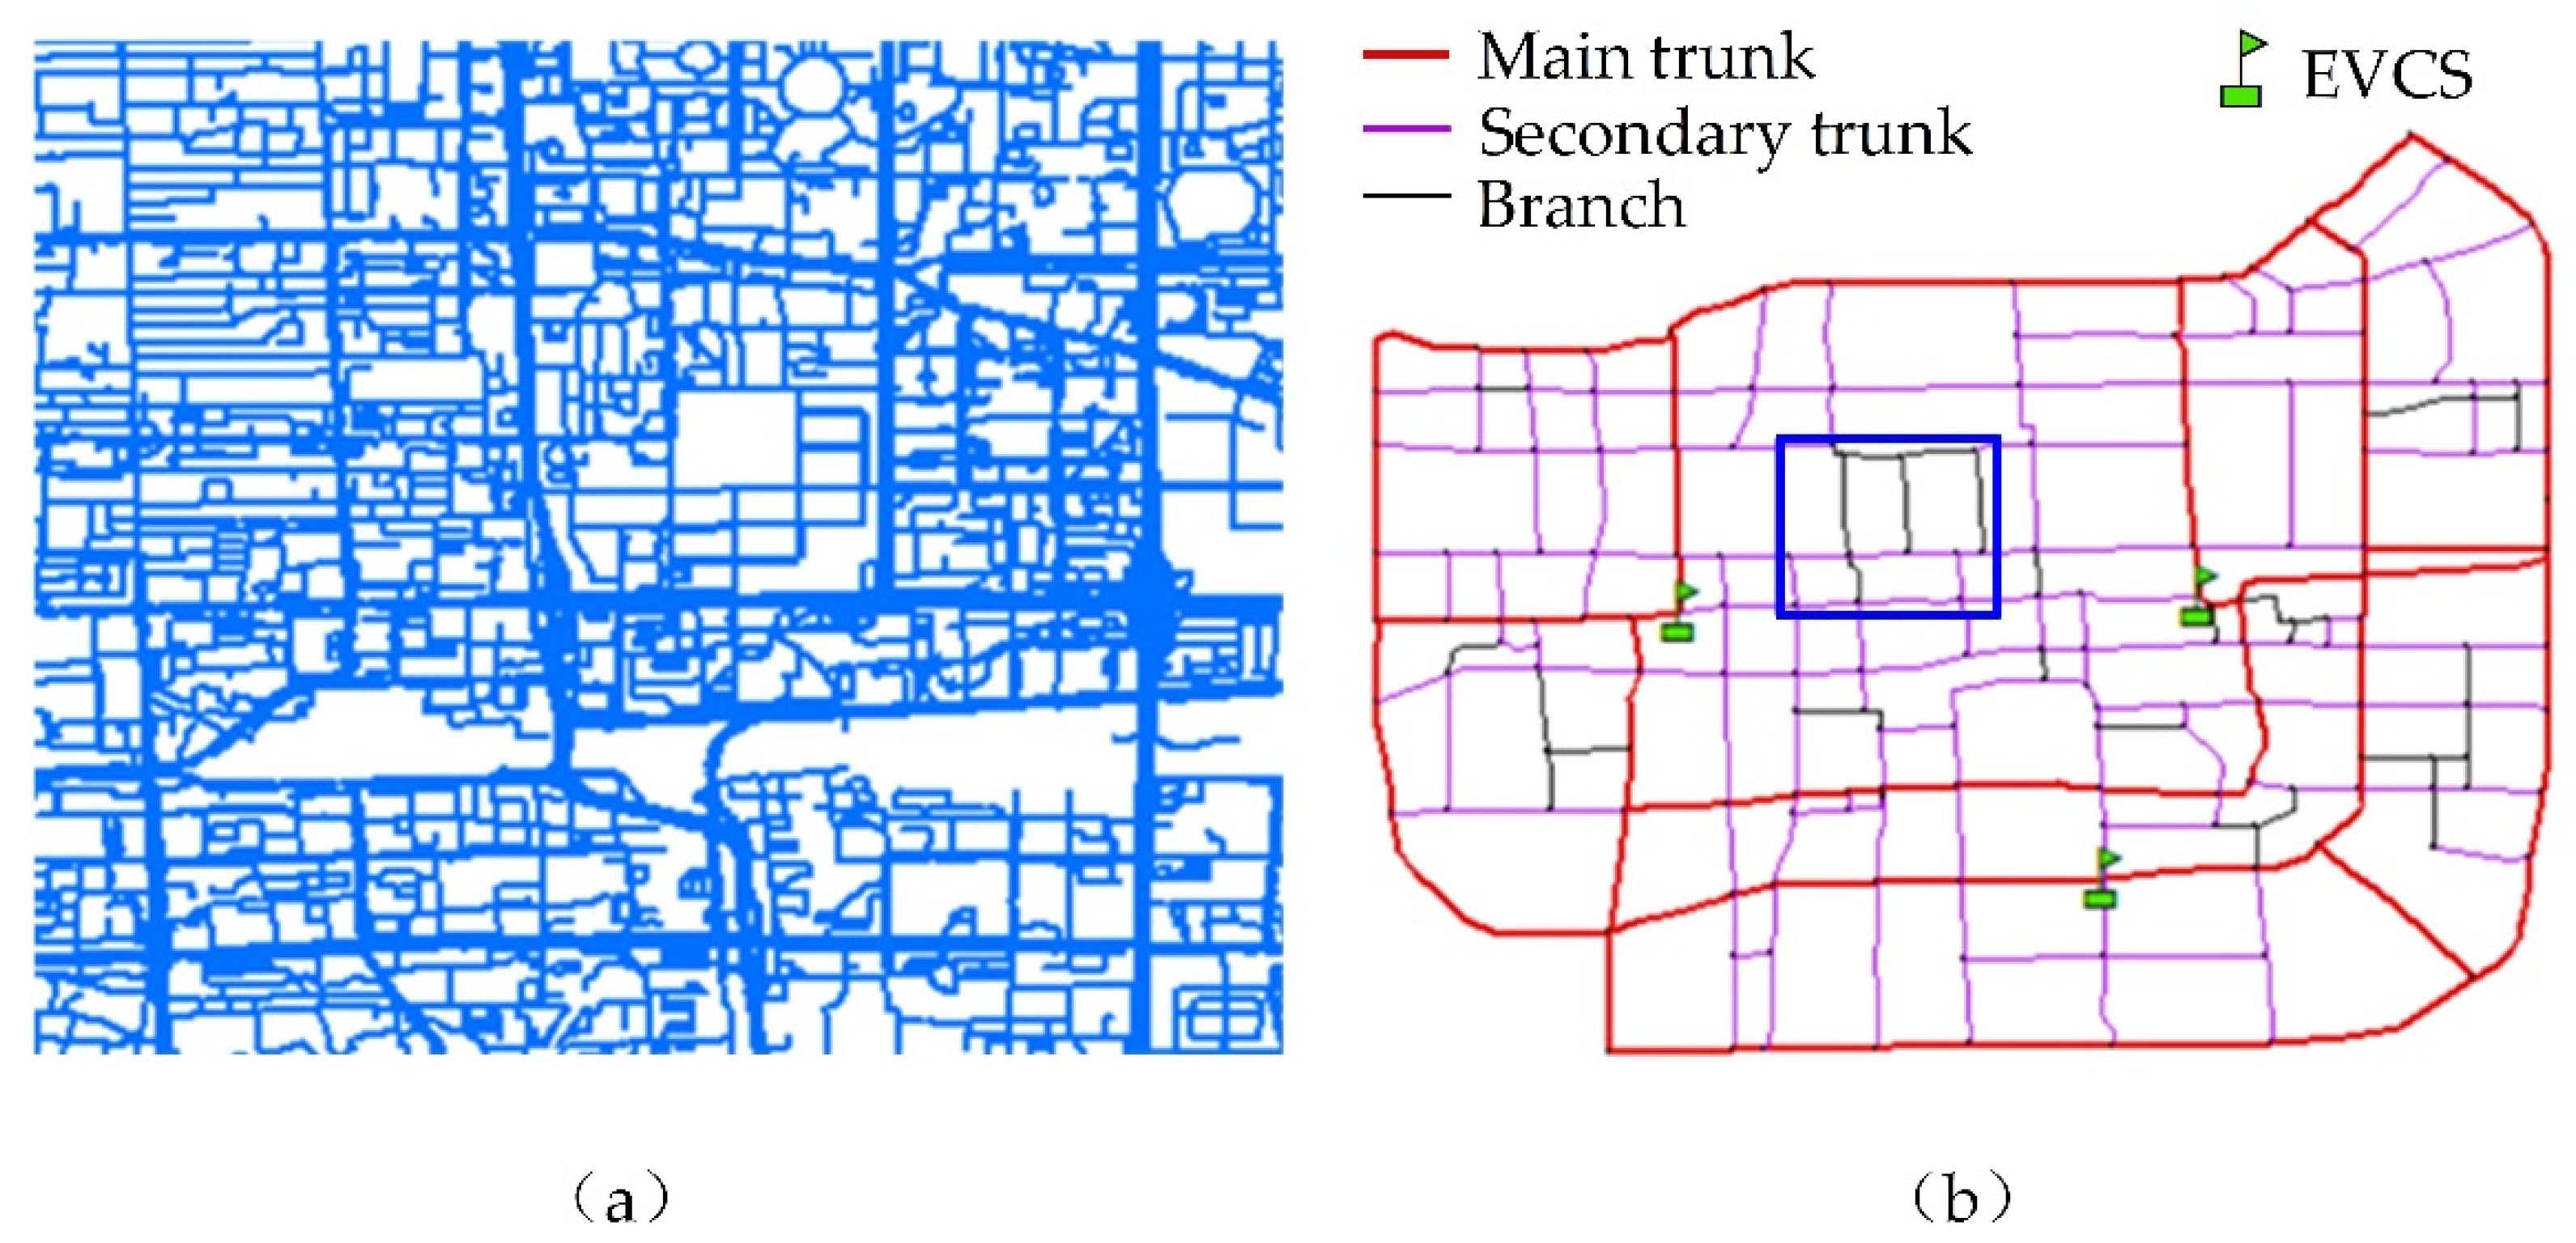
3.2.1. Road Impedance (RI) Model

When comparing a road to a circuit, the capacity of each road can be compared to the conductivity of it, the loss on the road is similar to the impedance in the circuit, which is called road impedance. There are many factors affecting RI, including traffic time, traffic cost, road speed limit, weather environment, toll stations, and urban nodes, but most of them can be indirectly transformed into time-dependent. Therefore, traffic time is used to define RI. The most used RI model is the Federal Highway Administration RI model (BPR), which is defined as:
t j = t 0 [ 1 + λ ( x t / c ) δ ] ,
t 0 = R r / v ,
where t r is the impedance of road r ; x t is the road traffic flow; t 0 is the passage time with no impedance; v is the average speed; c is the traffic capacity of the road and recorded as the number of EVs passing per hour; λ and δ is the impedance parameter, recommended as λ = 0.15 , δ = 4 .
Therefore, the RI model is proportional to the current traffic flow of the road. The passage time of the EV passing through the road is calculated by the RI model, and the time to reach the charging station and the SOC are calculated by the driving mileage and power consumption.
T j , a r r i v e = T j , m o n i + t j , r ,
S O C j , a r r i v e = S O C j , m o n i L j Δ s j ,
where T a r r i v e and S O C j , a r r i v e represent the arrival time and S O C of EV j , respectively; T j , m o n i and S O C j , m o n i are the monitoring time and S O C of EV j , respectively; Δ s j is the average driving power consumption of EV j .

3.2.2. The Charging Model of Single EV

Due to the difference in charging demand, the EVs connected to the grid can be divided into two categories. One is the EVs that need fast charging, such as taxis. They have a short charging time and the power cannot be adjusted. It is difficult to participate in the dispatching strategy. The other category is the private EVs that can be connected to the grid at night or during long working hours, and their charging power is adjustable. Therefore, this category of load can be dispatched and participate in flexible load dispatching. This paper is mainly focused on the second category of EVs.
0 P t , j c h a t , j c h a , max , t j i n t t j o u t ,
s t , j = s t 1 , j + η c h a P t , j c h a Δ t , t j i n t t j o u t ,
s j min s t , j s j max , t j i n t t j o u t .
Equation (17) is the charging power constraint; Equation (18) is the timing constraint of battery capacity; Equation (19) is the battery capacity limit constraint.
To sum up, the parameter set of an EV driving on the road and about to charge at the charging station is
{ T m o n i , S O C m o n i , L , P c h a , max , T l e a v e , s max } .
This set includes user location information, battery power information, expected departure time, and other information related to user privacy. The EVCS cannot share the information with the IDC for joint energy dispatching. Therefore, the load aggregator should process this information.

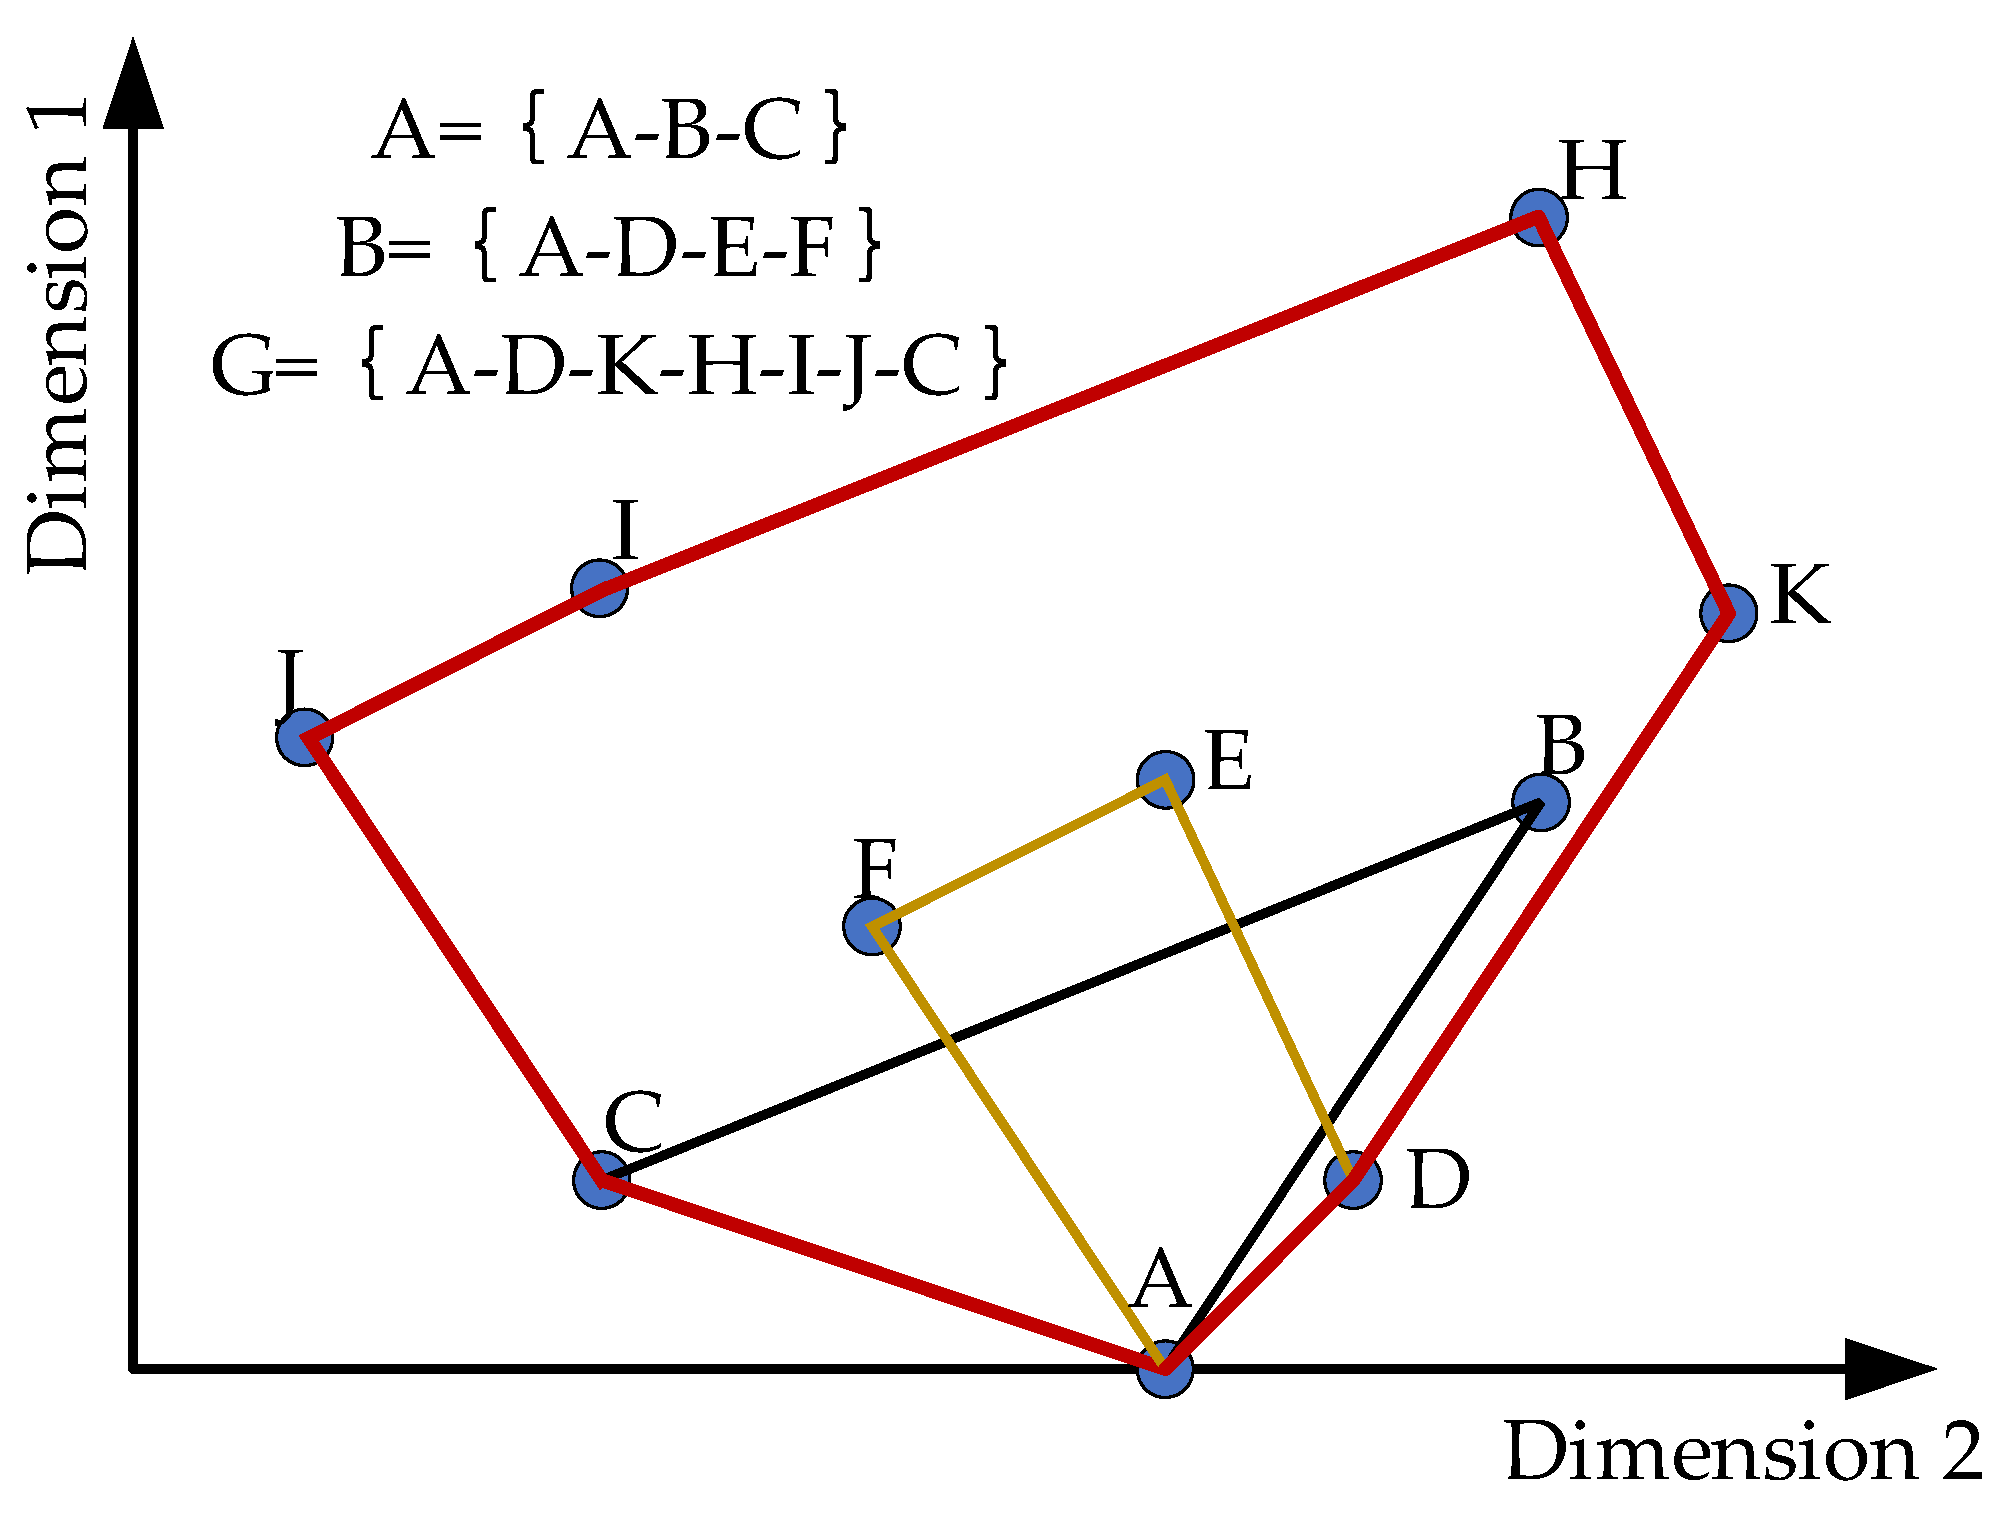
3.2.3. The Generalized Flexible Load Model Based on Minkowski Sum

The dispatching power of the generalized charging station needs to be superimposed on the individual decisions of EVs in the area to form an envelope space, which can hide the user’s privacy information while retaining the constraints of individual EVs, and reduce the number of variables and constraints. Minkowski sum is suitable for calculating the sum of point sets in Euclidean space, and its physical essence is the expansion set of multiple spaces [31]. The Minkowski sum of two sets A and B is as follows:
G = { a + b | a A , b B } .
The Minkowski sum of the two convex hulls is the envelope of the two variable spaces, as shown by the red line in Figure 3.
The area formed by G in Figure 3 is defined as a generalized charging station decisions space. It establishes a flexible load model for the charging station. As well, its parameters are the dispatching potential parameters of the charging station. When the decision variables are two-dimensional, the model forms an area. When the decision variables have higher dimensions, the model forms a hypercube space.
Due to the different grid access time slots of each EV, the definition domain of variable space is different. Therefore, the Minkowski sum cannot be performed directly. When the EV j is connected to the charger q , the information of the EV j is given to the charger q . A state variable X q , t is introduced to characterize the activation state of the charger q :
X q , t = { 0 , t [ t i n , t o u t ] 1 , t [ t i n , t o u t ] .
Thus, the time definition domain of each charging point is extended from the active state to the full dispatching period, so that it can be calculated by Minkowski sum. The energy variation constraint of the charger q can be written as:
s t , q = s t 1 , q + s q , a r r i v e X t , q ( X t , q X t 1 , q ) s q , l e a v e X t 1 , q ( X t 1 , q X t , q ) + η c h a P t , q c h a Δ t , t T .
The electric quantity variation of the charger q is described as follows:
Δ s t , q = s q , a r r i v e X t , q ( X t , q X t 1 , q ) s q , l e a v e X t 1 , q ( X t 1 , q X t , q ) .
The total charging dispatching power of the EVCS i is the sum of the maximum charging power of each charger, which can be expressed as:
P t , i c h a , max = q = 1 Q p q c h a , max X t , q ,
where P j c h a , max represents the maximum charging power of the charger q . Similarly, the minimum and maximum of the total dispatching power of the EVCS i are as follows:
S t , i min = q = 1 Q s q min X t , q ,
S t , i max = q = 1 Q s q max X t , q ,
where s q min and s q max represent the minimum and maximum electric quantity of the charger q , respectively.
Therefore, the parameter of the EVCS generalized flexible load model can be defined as:
{ P i , t c h a , max , S i , t min , S i , t max , Δ S i , t } .
And the constraints of the model can be expressed as:
0 P t , i c h a P t , i c h a , max ,
S t , i = S t 1 , i + Δ S t , i + η c h a P t , i c h a Δ t ,
S t , i min S t , i S t , i max .
This method greatly reduces the dimension of the model. The hypercube space contains all feasible charging decisions of the EVCS.
The above model is the envelope space composed of all charging decisions of the EVCS. In the case study, a baseline needs to be set up. In this baseline, the temporal dispatching ability of EVs is not considered. This requires some corrections to some parameters reported in the above model.
In this case, the EV drives into the EVCS to charge at the maximum power and automatically disconnects the power connection with the piles after it is fully charged. Due to the change of grid access time, the X matrix, in this case, will change, resulting in the change of other parameters related to X . Then, the activation time of the charger q can be calculated as:
T q s t a y = ( S t , q max S t , q a r r i v e ) / P q c h a , max ,
where T q s t a y is the activation time of the charger q in the case of maximum power charging, so the X matrix can be modified according to Equation (22). The new upper limit of charging power P i , t c h a , max of the EVCS i is obtained by Equation (25). The constraint condition only needs to retain the following equation:
P t , i c h a = P t , i c h a , max .
It should be noted that the activation time of the charger (electric vehicle grid access time) has been considered in the above equation. Equation (33) is the constraint that the EVCS needs to comply with in Baseline1 in Section 5.

4. Optimization Problem and Solution of DCO Carbon Emission Reduction

Based on the IDC and the EVCS model in Section 3, a spatial-temporal coupling dispatching mechanism for carbon emission reduction is proposed, which takes into account the spatial migration capacity of workloads in the IDCs and the temporal dispatch capacity of the generalized flexible load of the EVCS. The spatial migration of workload among the IDCs is completed while meeting the constraints of energy balance, server power consumption, and user time delay requirements. Considering the temporal dispatch capacity of the generalized flexible load model of the EVCS, it can better match the output curve of RES and further reduce carbon emissions.
Therefore, according to the analysis in Section 2, to achieve the sustainability of geographically dispersed IDCs, that is, the carbon emission reduction target, the total carbon emission of each single IDC owned by the DCO needs to be calculated, and the total optimization target is formulated as follow:
min C t = e i N P t , i g r i d Δ t ,
where e = 0.968 kg ( kW h ) 1 [32].
By establishing the spatial and temporal migration mechanism, the power consumption of the IDC can track the maximum output of RES to the greatest extent in each control period to reduce the power purchase from the utility grid, and obtain the minimum carbon emission of the DCO in Equation (34).
The constraints of the spatial-temporal coupled dispatching optimization problem are as follows:
1.
The constraints of the IDC power supply and consumption balance.
For each single IDC, the balance of energy supply and consumption must be met. In Section 2, the power supply and consumption of the single IDC are stated. The actual consumption of renewable energy is also constrained by the current maximum output.
P t , i g r i d + P t , i P V + P t , i W T = P t , i o p r + P t , i E V C S ,
{ 0 P t , i P V P t , i P V , max 0 P t , i w t P t , i w t , max .
2.
The constraints of the IDC energy consumption and workload processing time delay.
i = 1 N { [ ( μ i 1 / D ) / k i ] ( P t , i o p r P i i d l e ) } i = 1 N L t , i ,
P i i d l e P t , i s e r k i M i + P i i d l e .
It should be noted that when the average stay time of the workload in the IDC is exactly equal to the time delay limit D specified by the user and the IDC, the workload time delay constraint should be written as:
i = 1 N { [ ( μ i 1 / D ) / k i ] ( P t , i o p r P i i d l e ) } = i = 1 N L t , i .
3.
The conservation constraint of the total workload.
The total workload handled by the DCO before and after load dispatching must remain unchanged, and the workload can be transferred between the IDCs:
i = 1 N L t , i = i = 1 N L t , i .
4.
The constraints of the EVCS.
0 P t , i E V C S P t , i c h a , max ,
S t , i = S t 1 , i + Δ S t , i + η c h a P t , i E V C S Δ t ,
S t , i min S t , i S t , i max .
According to the above constraints, it can be found that the difference between the workloads of the IDCs and the traditional flexible load is that the constraints of the workloads of the IDCs are spatial, as shown in Equation (40). While the constraint of the EVCS is temporal, as shown in Equation (42). The decision variables of the model are the power consumption P t , i o p r of the IDC i , the workload L t , i allocated to the IDC i after migration, the electricity S t , i of the EVCS i and the charging power P t , i E V C S of the EVCS i .
Through the modeling work in Section 3, a large number of EVs that may produce a large number of constraints and variables is aggregated into the generalized flexible load model, which greatly reduces the dimension of the model and the complexity of the joint dispatching solution. In this process, Boolean variables X t , q are generated. Through further analysis, they are encapsulated in the variables Δ S t , q , to avoid the problem becoming a mixed integer programming problem and further reduce the difficulty of solving.

5. Case Study

In this Section, the spatial-temporal coupling dispatching problem of carbon emission reduction in DCO is validated, which takes into account the workload spatial migration capacity of three IDCs and the temporal dispatching capacity of a generalized flexible load of three EVCSs ( N = 3 ) . Simulation is based on the real workload curves [33]. The time slot is set as Δ t = 15 min , T = 96 within one dispatch day.
For performance comparisons, the following strategies are adopted as the cases:
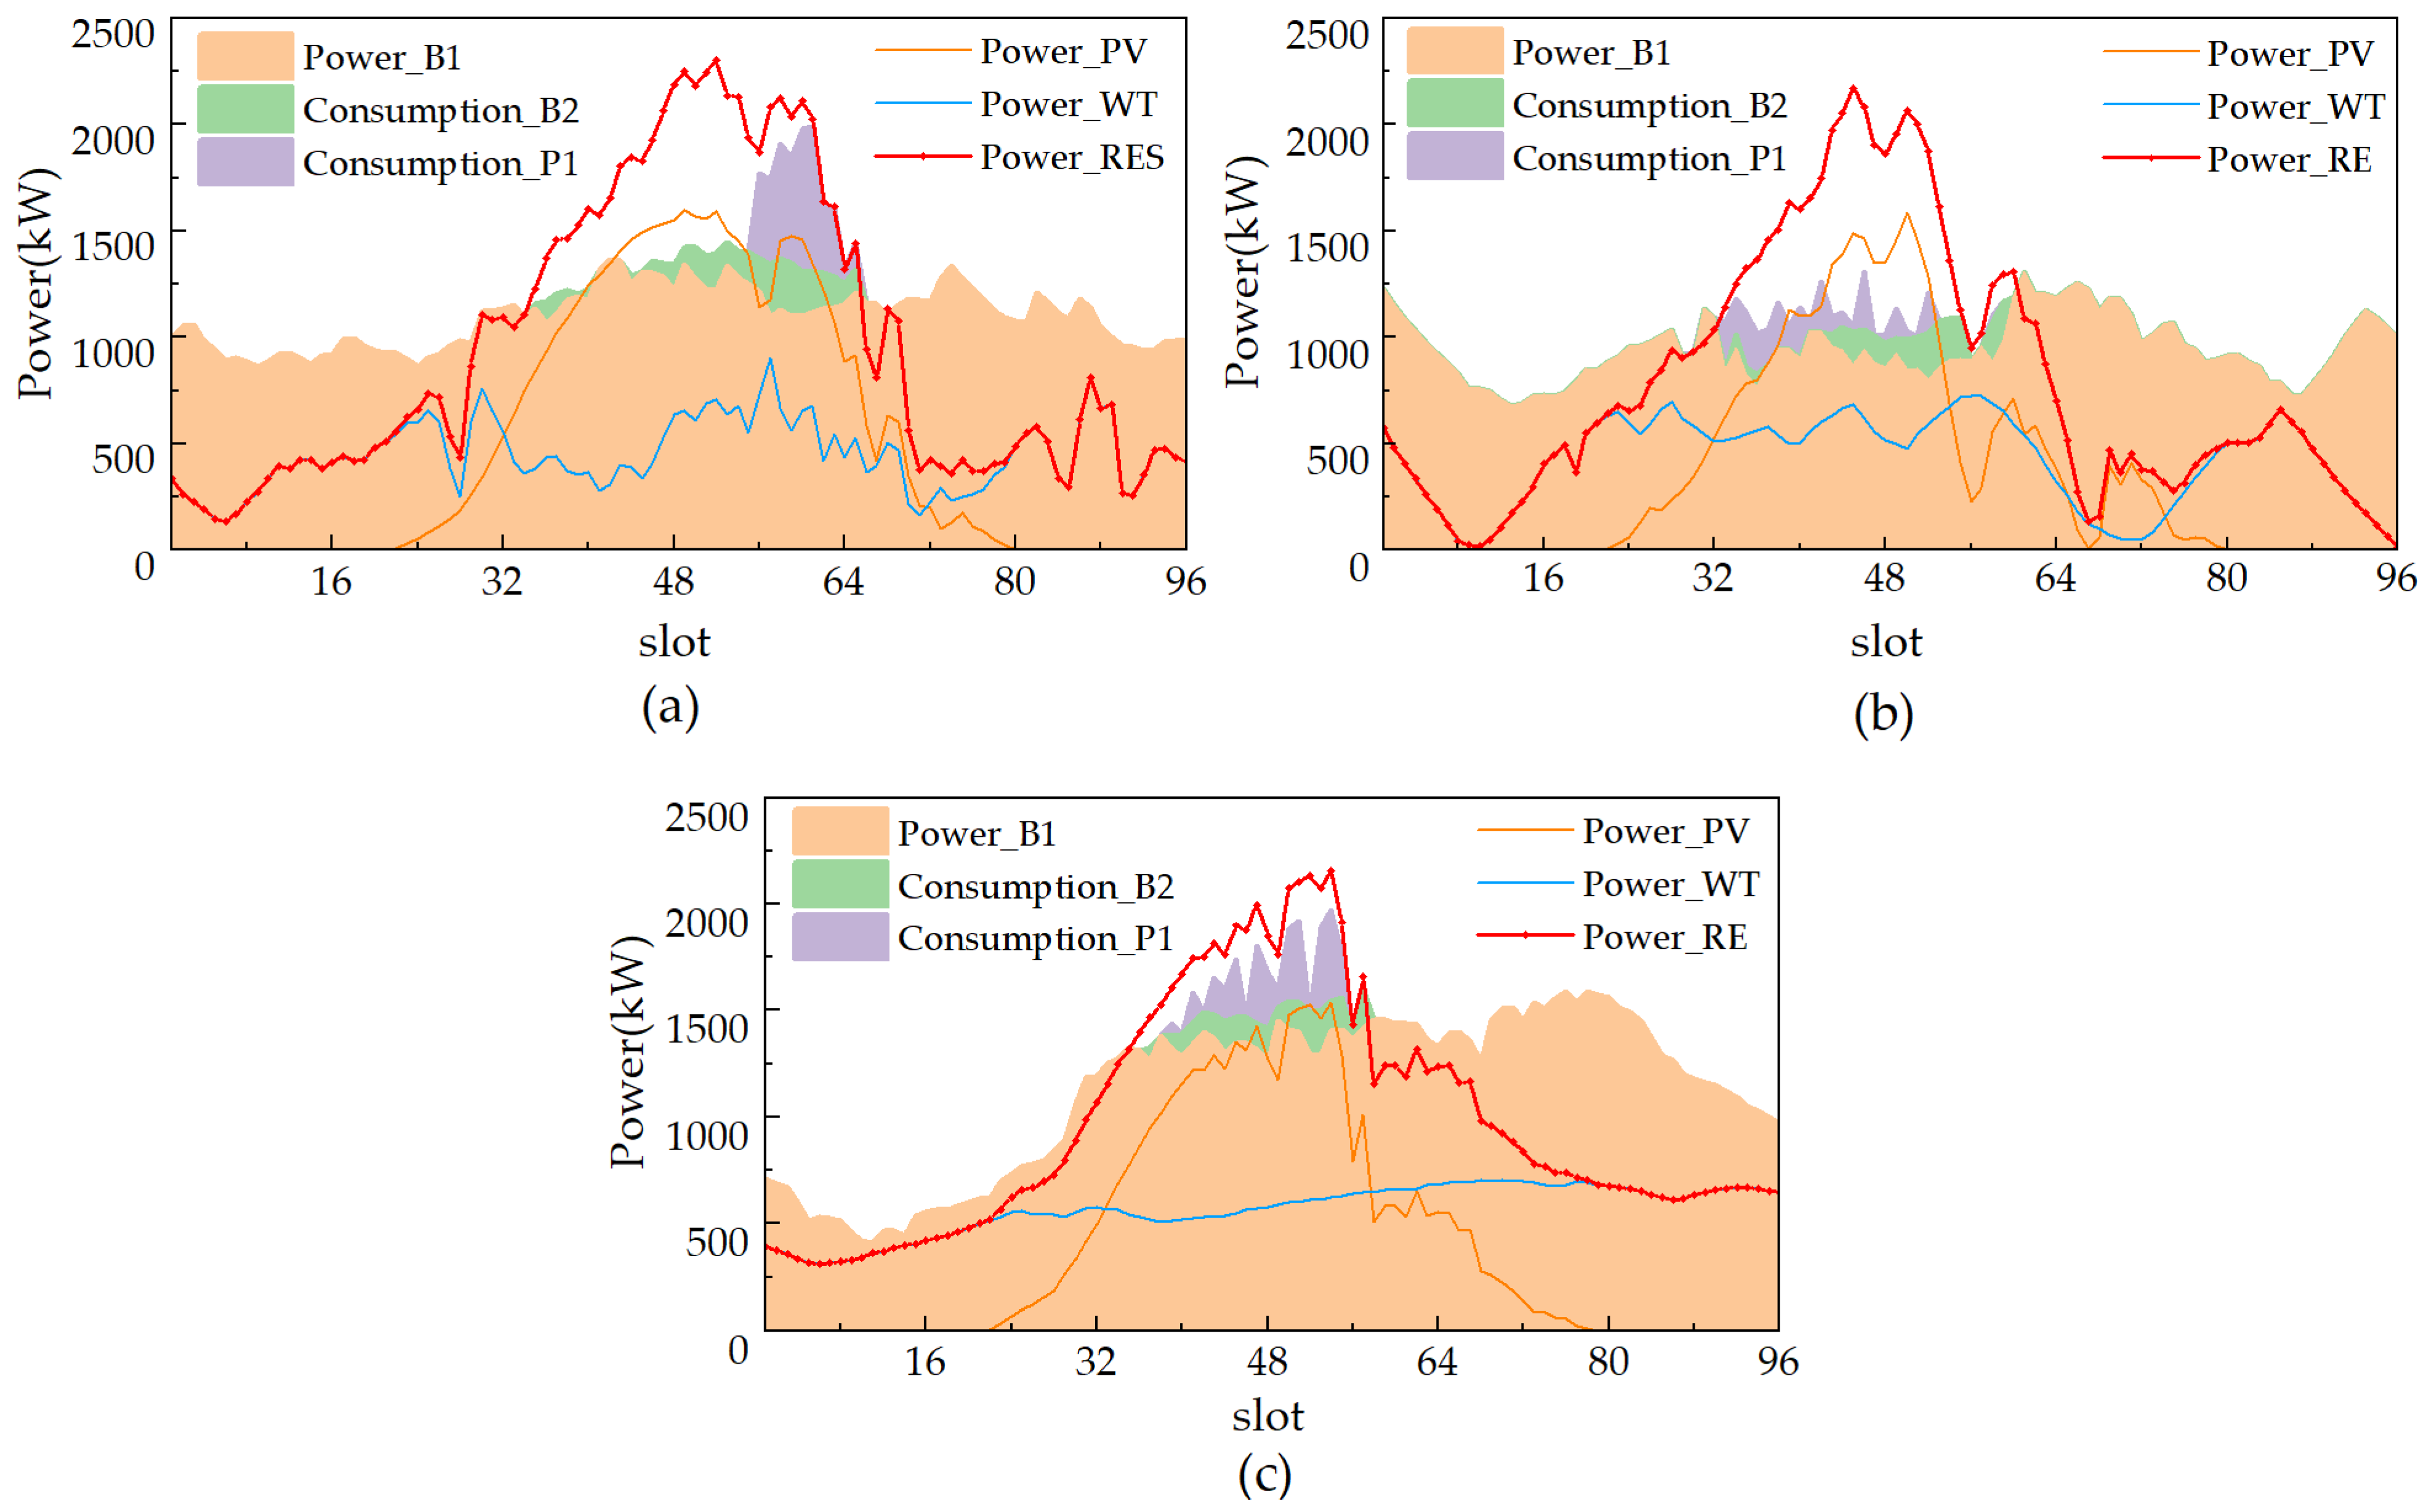
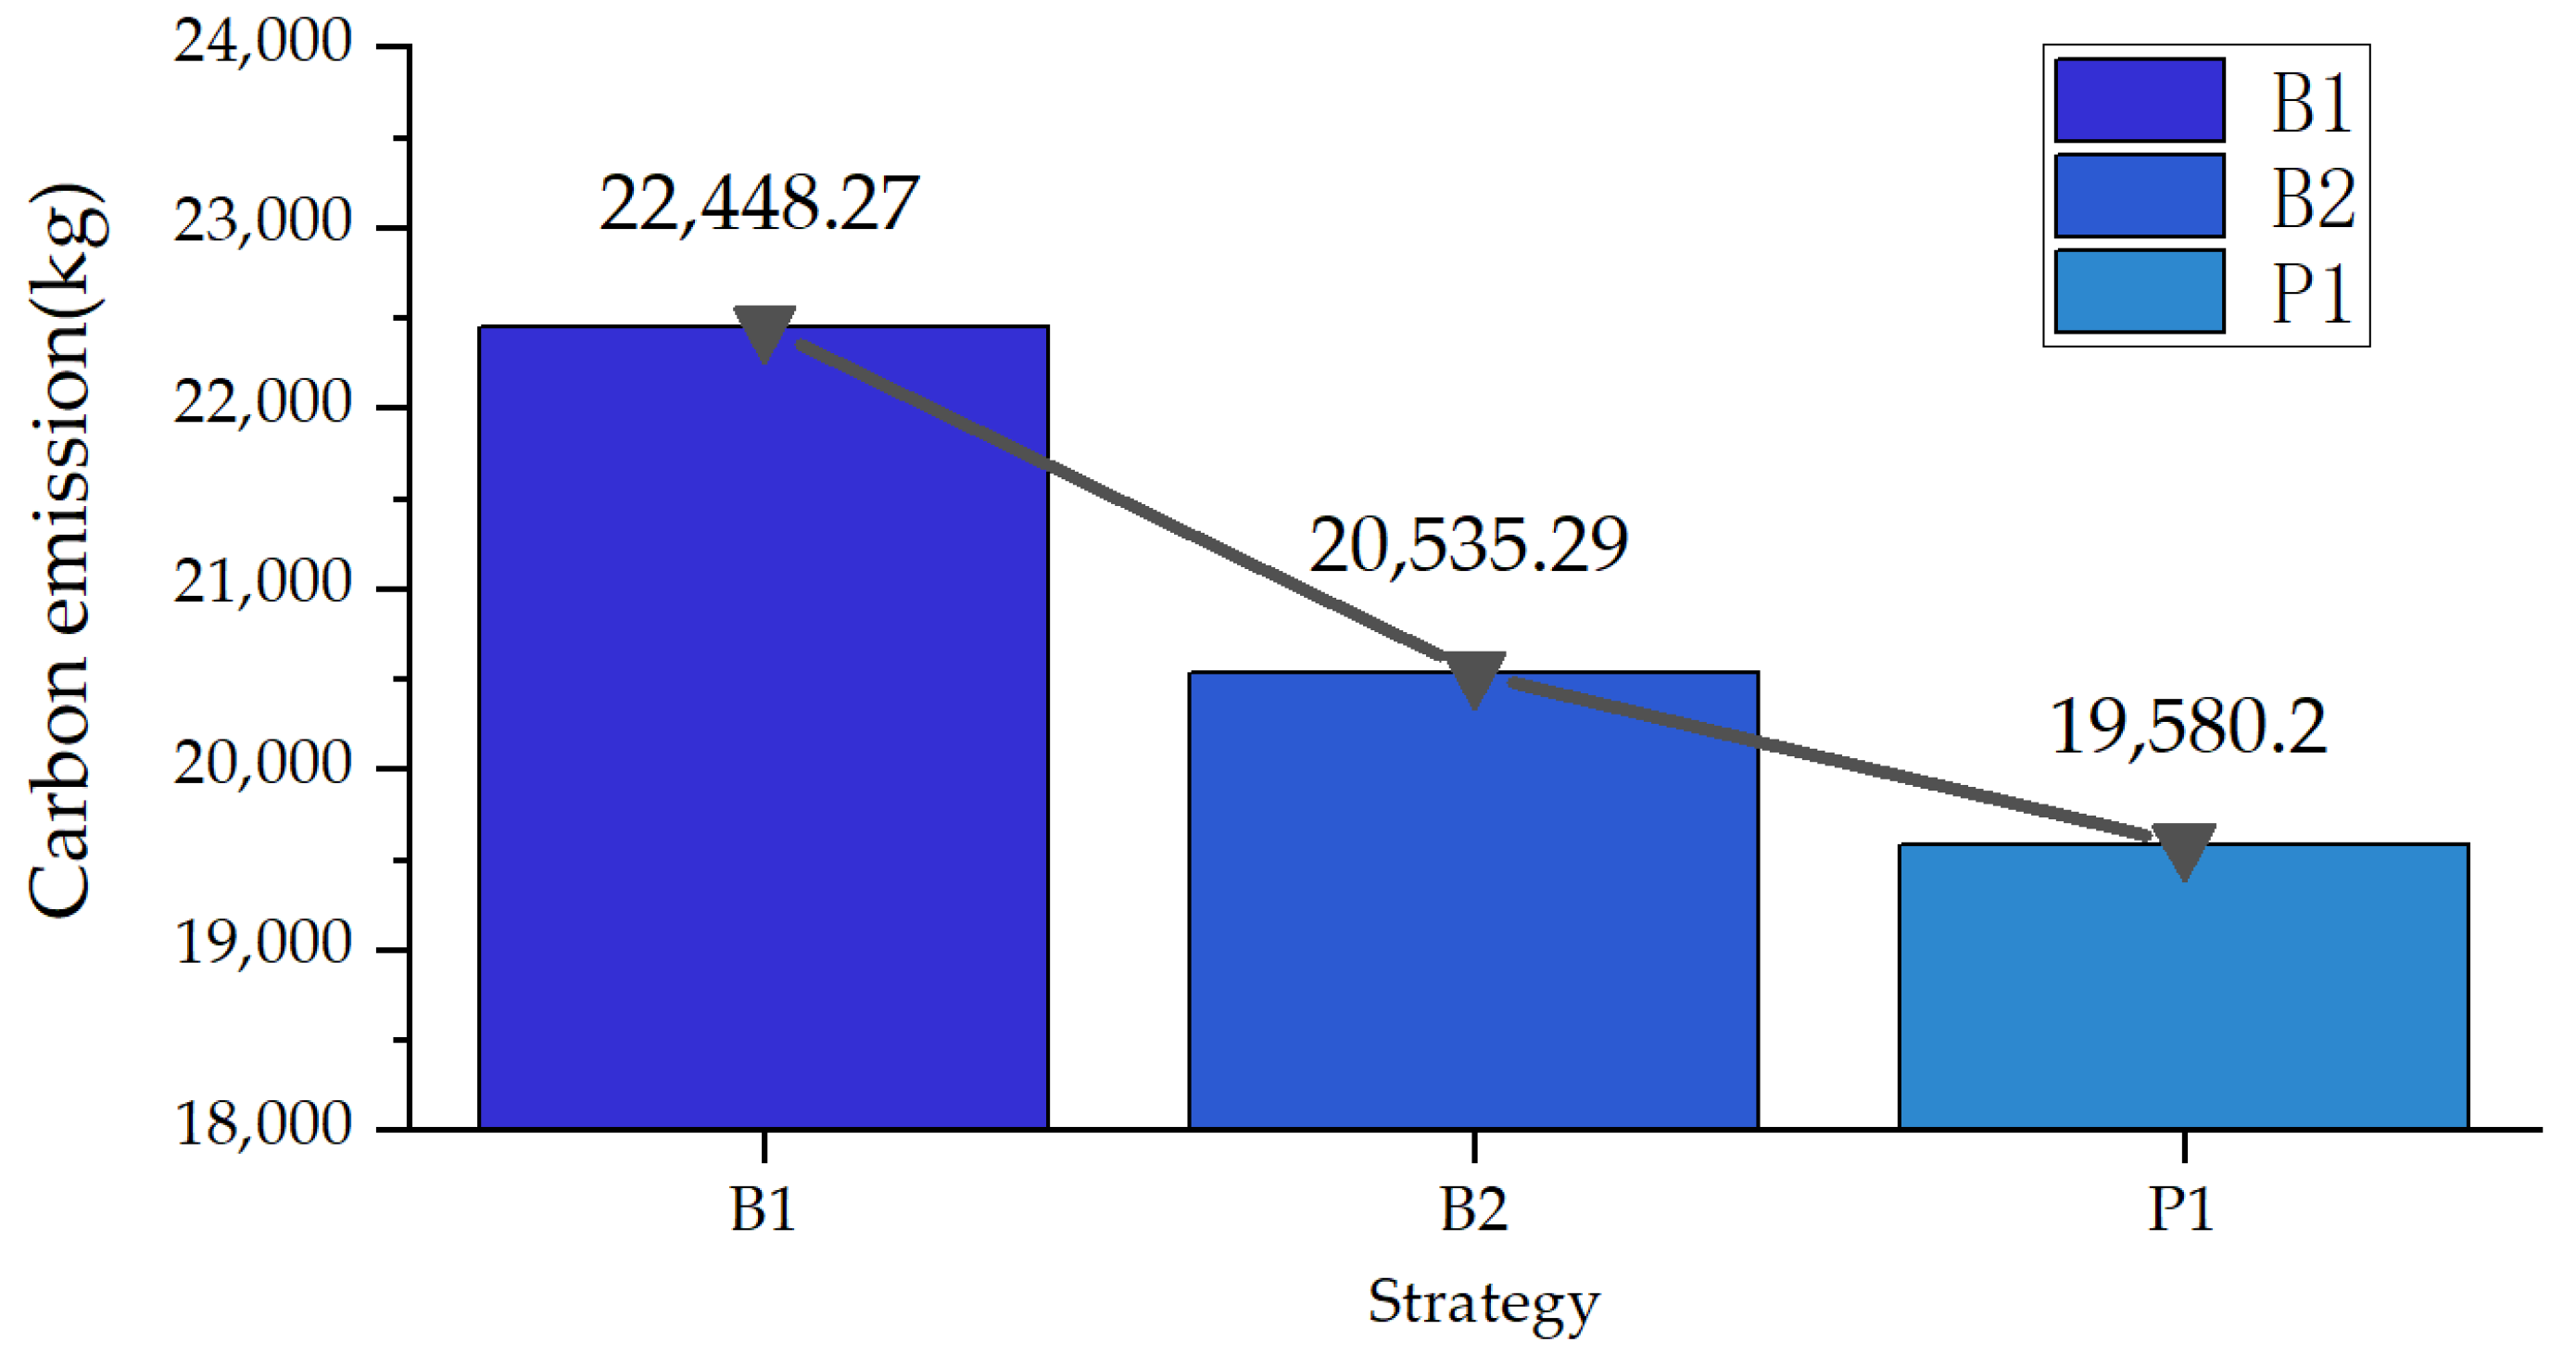
  • Baseline1(B1): The workload of the IDC is processed locally, that is, the spatial migration of workload is not considered. The EV does not consider the orderly charging with adjustable power, that is, after each EV arrives at the charging station, it will be charged at the maximum power, and the charging will be stopped automatically after it is full charged. Therefore, the load of the EVCS will no longer have the flexibility of temporal adjustment.
  • Baseline2(B2): The workload of the IDC is processed locally, that is, the spatial migration of workload is not considered. As a dispatchable flexible load, the temporal dispatching ability of the EVCS under constraints is considered.
  • Proposed(P1): Considering the spatial migration ability of workloads between IDCs and the temporal dispatching ability of generalized flexible load of the EVCS, the spatial-temporal coupling joint dispatching of the IDCs is carried out.

5.1. Carbon Emissions and RES Consumption of the IDCs

The curves of RES purchased locally by the three IDCs are shown in Figure 4. The experiments compare the RES consumption and carbon emissions of the above three dispatching strategies. Figure 4 shows the matching results between the power consumption of each IDC and the maximum power generation of RES in one dispatching day. It can be derived from Figure 4 that without migration dispatching, due to the fluctuation of RES output, the RES supply in some periods cannot meet the power consumption of the IDC, as shown in dispatching slots (0–33) and (66–96) of the IDC1 in Figure 4a. During this two periods, the power consumption of the IDC is higher than the output of local RES. The part of the power shortage needs to be supplemented by thermal power generation from the utility grid, resulting in large carbon emissions. In the period with high RES output, as shown in dispatching slots (34–65) of the IDC1 in Figure 4a. During this period, the oversupply of RES has led to the abandonment of wind and solar, resulting in a low consumption rate of renewable energy.
In B2, the flexibility resource of the EVCS is introduced. It can be seen in Figure 4 that the dispatching strategy of introducing flexible resources of the EVCS has a higher consumption rate of RES. Due to the impact of the current charging station infrastructure construction, the equipment capacity of the EVCS adopted in our case is limited, but as a pilot, it has produced the effect of improving the consumption rate of RES. In the future, with the increase in the number of EVs, the increase in battery capacity and charging power of EVs, and the improvement of charging station infrastructure, the use of the EVCS flexibility resources for the IDC carbon emission reduction strategy will bring greater benefits. On this basis, the spatial-temporal coupling optimization strategy proposed in this paper has greater consumption of RES than the B2 strategy, as shown in Figure 4. Among the three strategies, the total power consumption of the IDC remains unchanged, but the B2 and P1 strategies consume more RES, which reduces the power purchased from the utility grid and thus reduces carbon emissions. The carbon emissions of the three strategies are shown in Figure 5.
The results show that the total carbon emissions of DCO simulated by the three strategies are 22,448.27 kg, 20,535.29 kg, and 19,580.20 kg. The carbon emission of the B2 strategy, which introduces the flexibility resources of the EVCSs, is 8.52% lower than that of the B1 strategy. Under the proposed spatial-temporal coupling dispatching strategy P1, the carbon emission is further reduced, which is 4.65% lower than B2 and 12.78% lower than B1. This proves that the established generalized flexible load model of the EVCS and the proposed spatial-temporal coupling model considering the spatial migration capacity of the workloads of the IDCs and the temporal dispatch capacity of the generalized flexible load of the EVCSs are effective in reducing carbon emissions of the IDCs.
In order to verify the economic feasibility of this strategy, the economy of DCO under this strategy needs to be discussed. The cost of DCO in B1 and P1 strategies are compared. The cost of the DCO includes the cost of purchasing RES, the cost of purchasing electricity from the utility grid, and the capacity cost of auxiliary services for the EVCSs. The purchase price of PV is 5.229 cents per kWh, the purchase price of wind power is 4.333 cents per kWh [34], and the purchase price of the utility grid is 5.827 cents per kWh [35]. The capacity price of the EVCSs participating in the auxiliary service market is 5.976 cents per kWh [36]. It is calculated that under the B1 strategy, the costs of the three IDCs are US $6311.80, $5582.18, and $5806.18, respectively, and the total cost of the DCO is $17,700.16. Under the P1 strategy, the costs of the three IDCs are $6162.70, $5506.40, and $5838.02, respectively, and the total cost of DCO is $17,507.11. The P1 strategy reduces the DCO’s total operating cost by 1.09% while reducing its carbon emissions. Among them, the cost of the IDC 3 has increased due to the high matching degree of the IDC 3’s original energy consumption and renewable energy output curve, and the effect of the P1 strategy on reducing power purchase of the utility grid is not obvious. However, we need to treat the DCO as an entire stakeholder in this strategy. The proposed strategy can reduce the cost of the DCO in this scenario. In addition, the reduction of carbon emissions enables DCO to participate in the green certificate market and obtain more benefits, which is beyond the scope of this article.

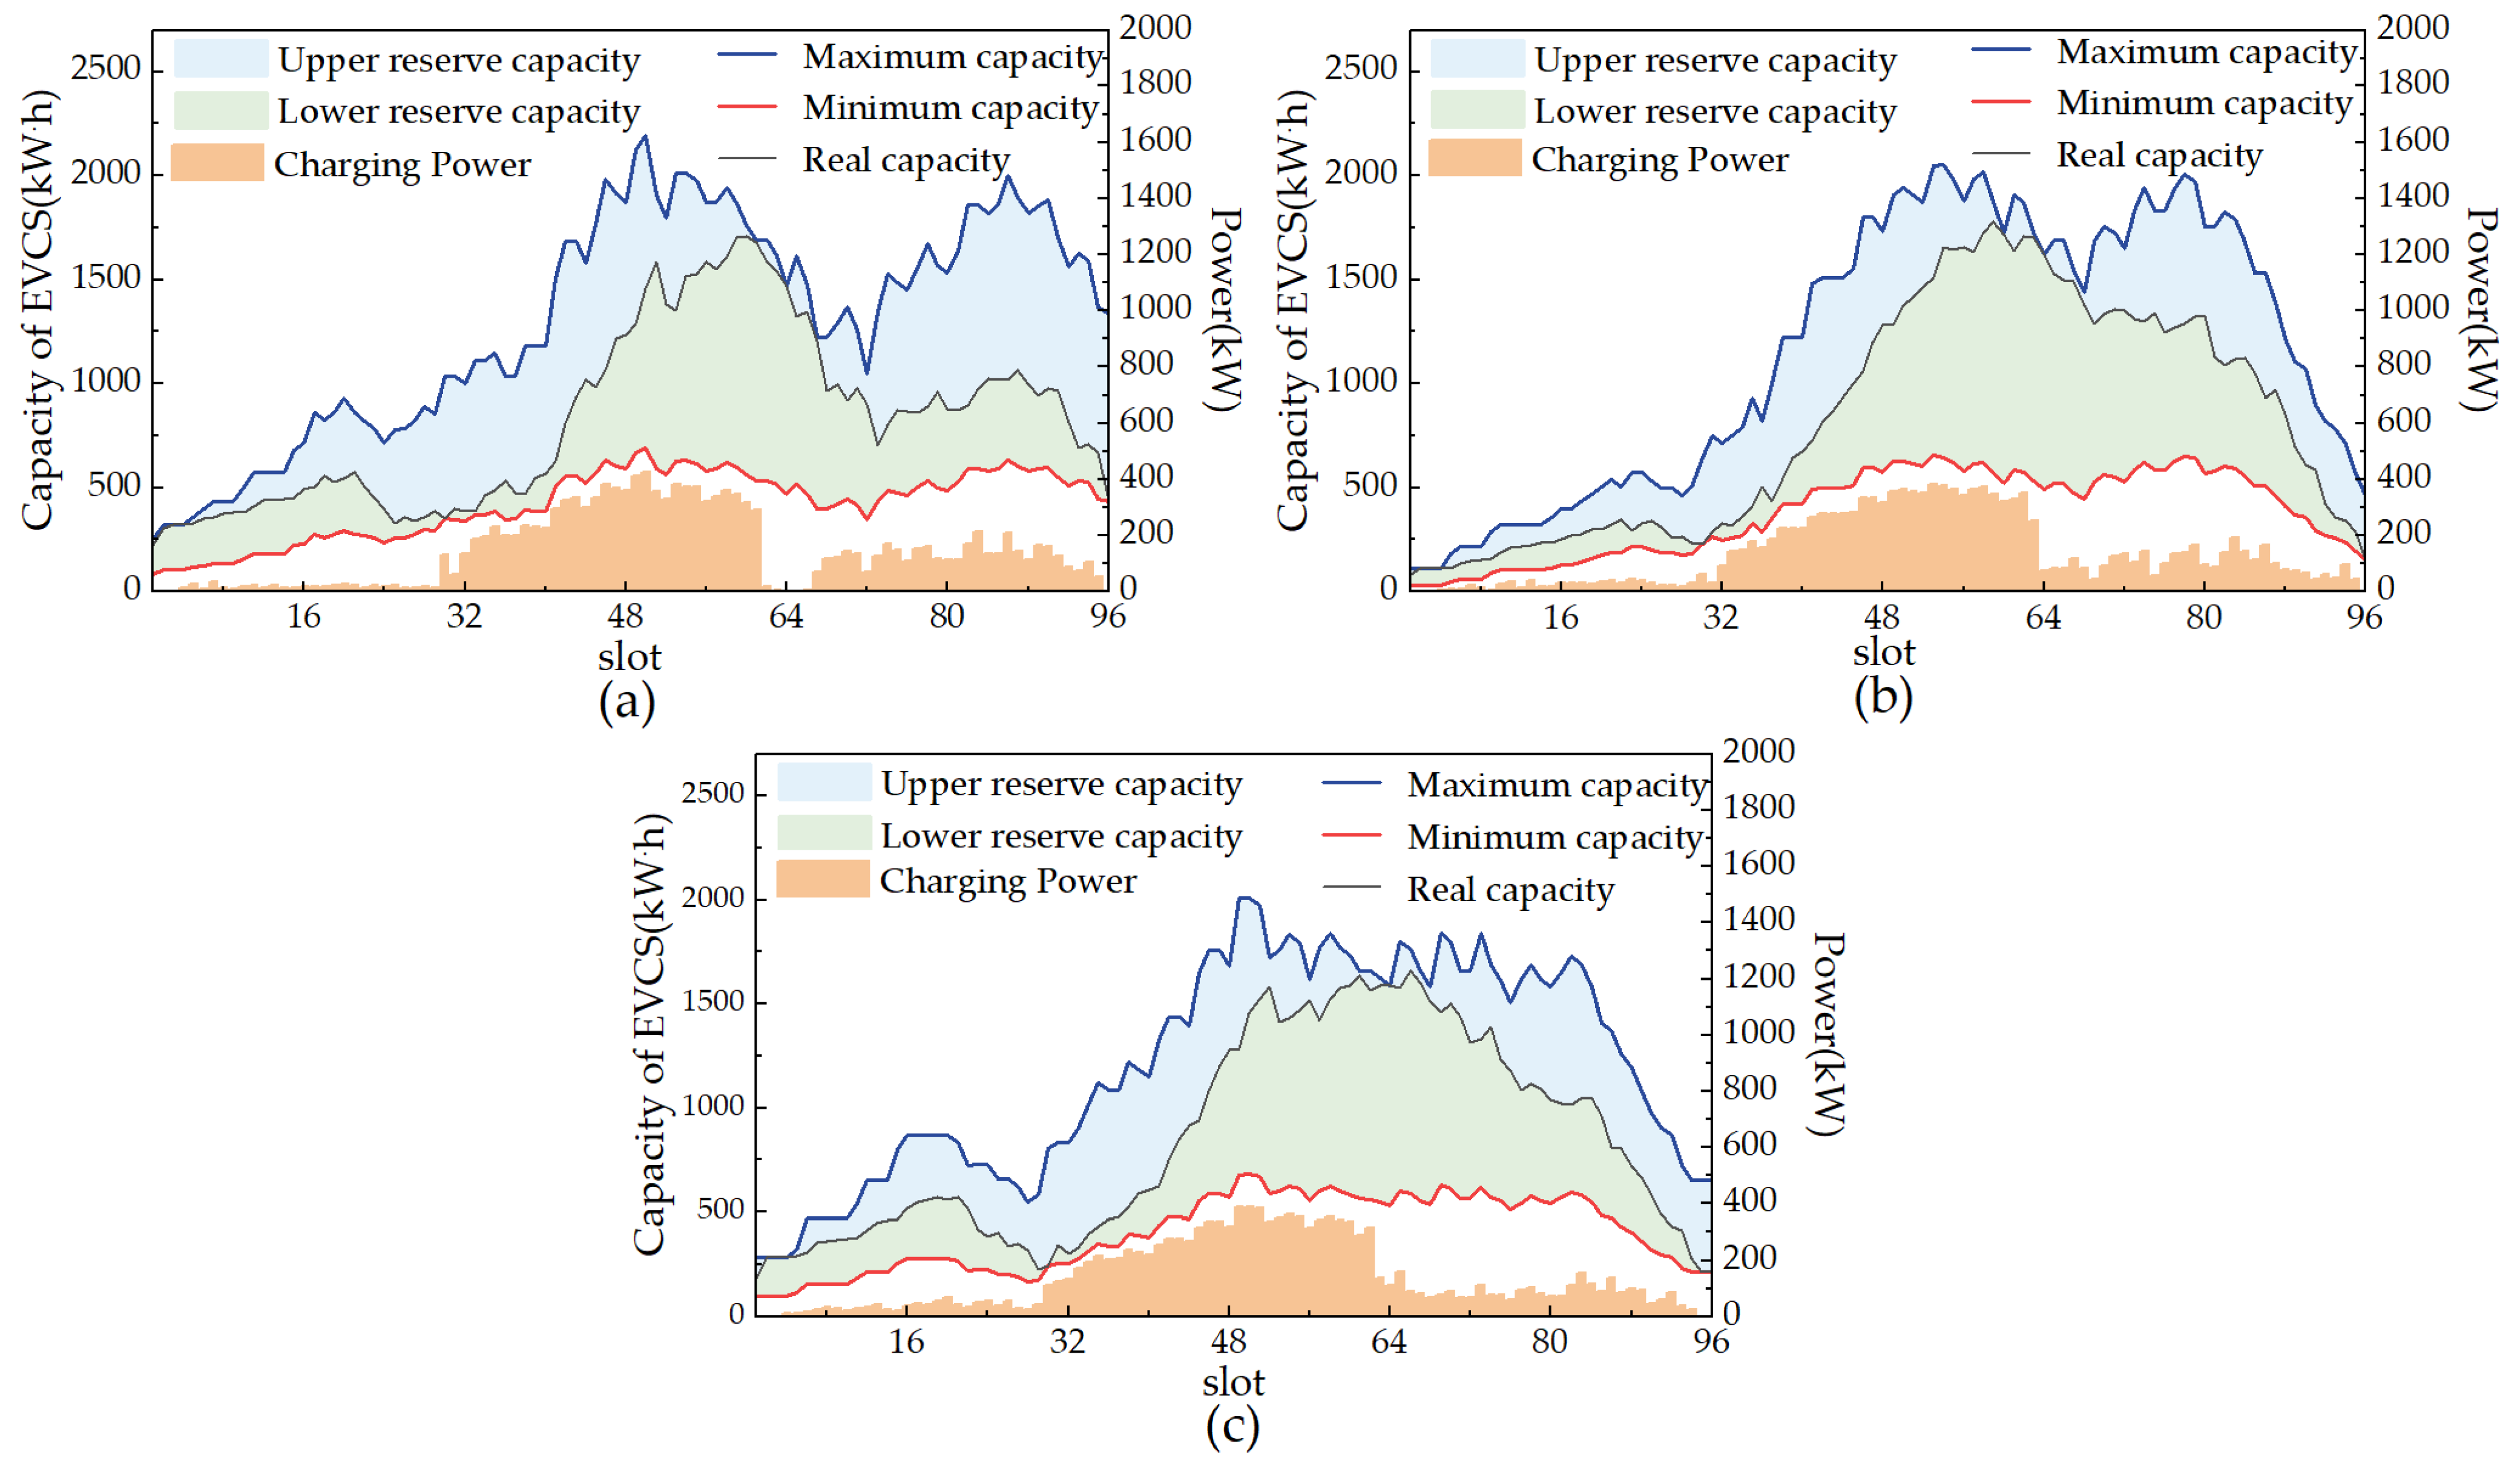
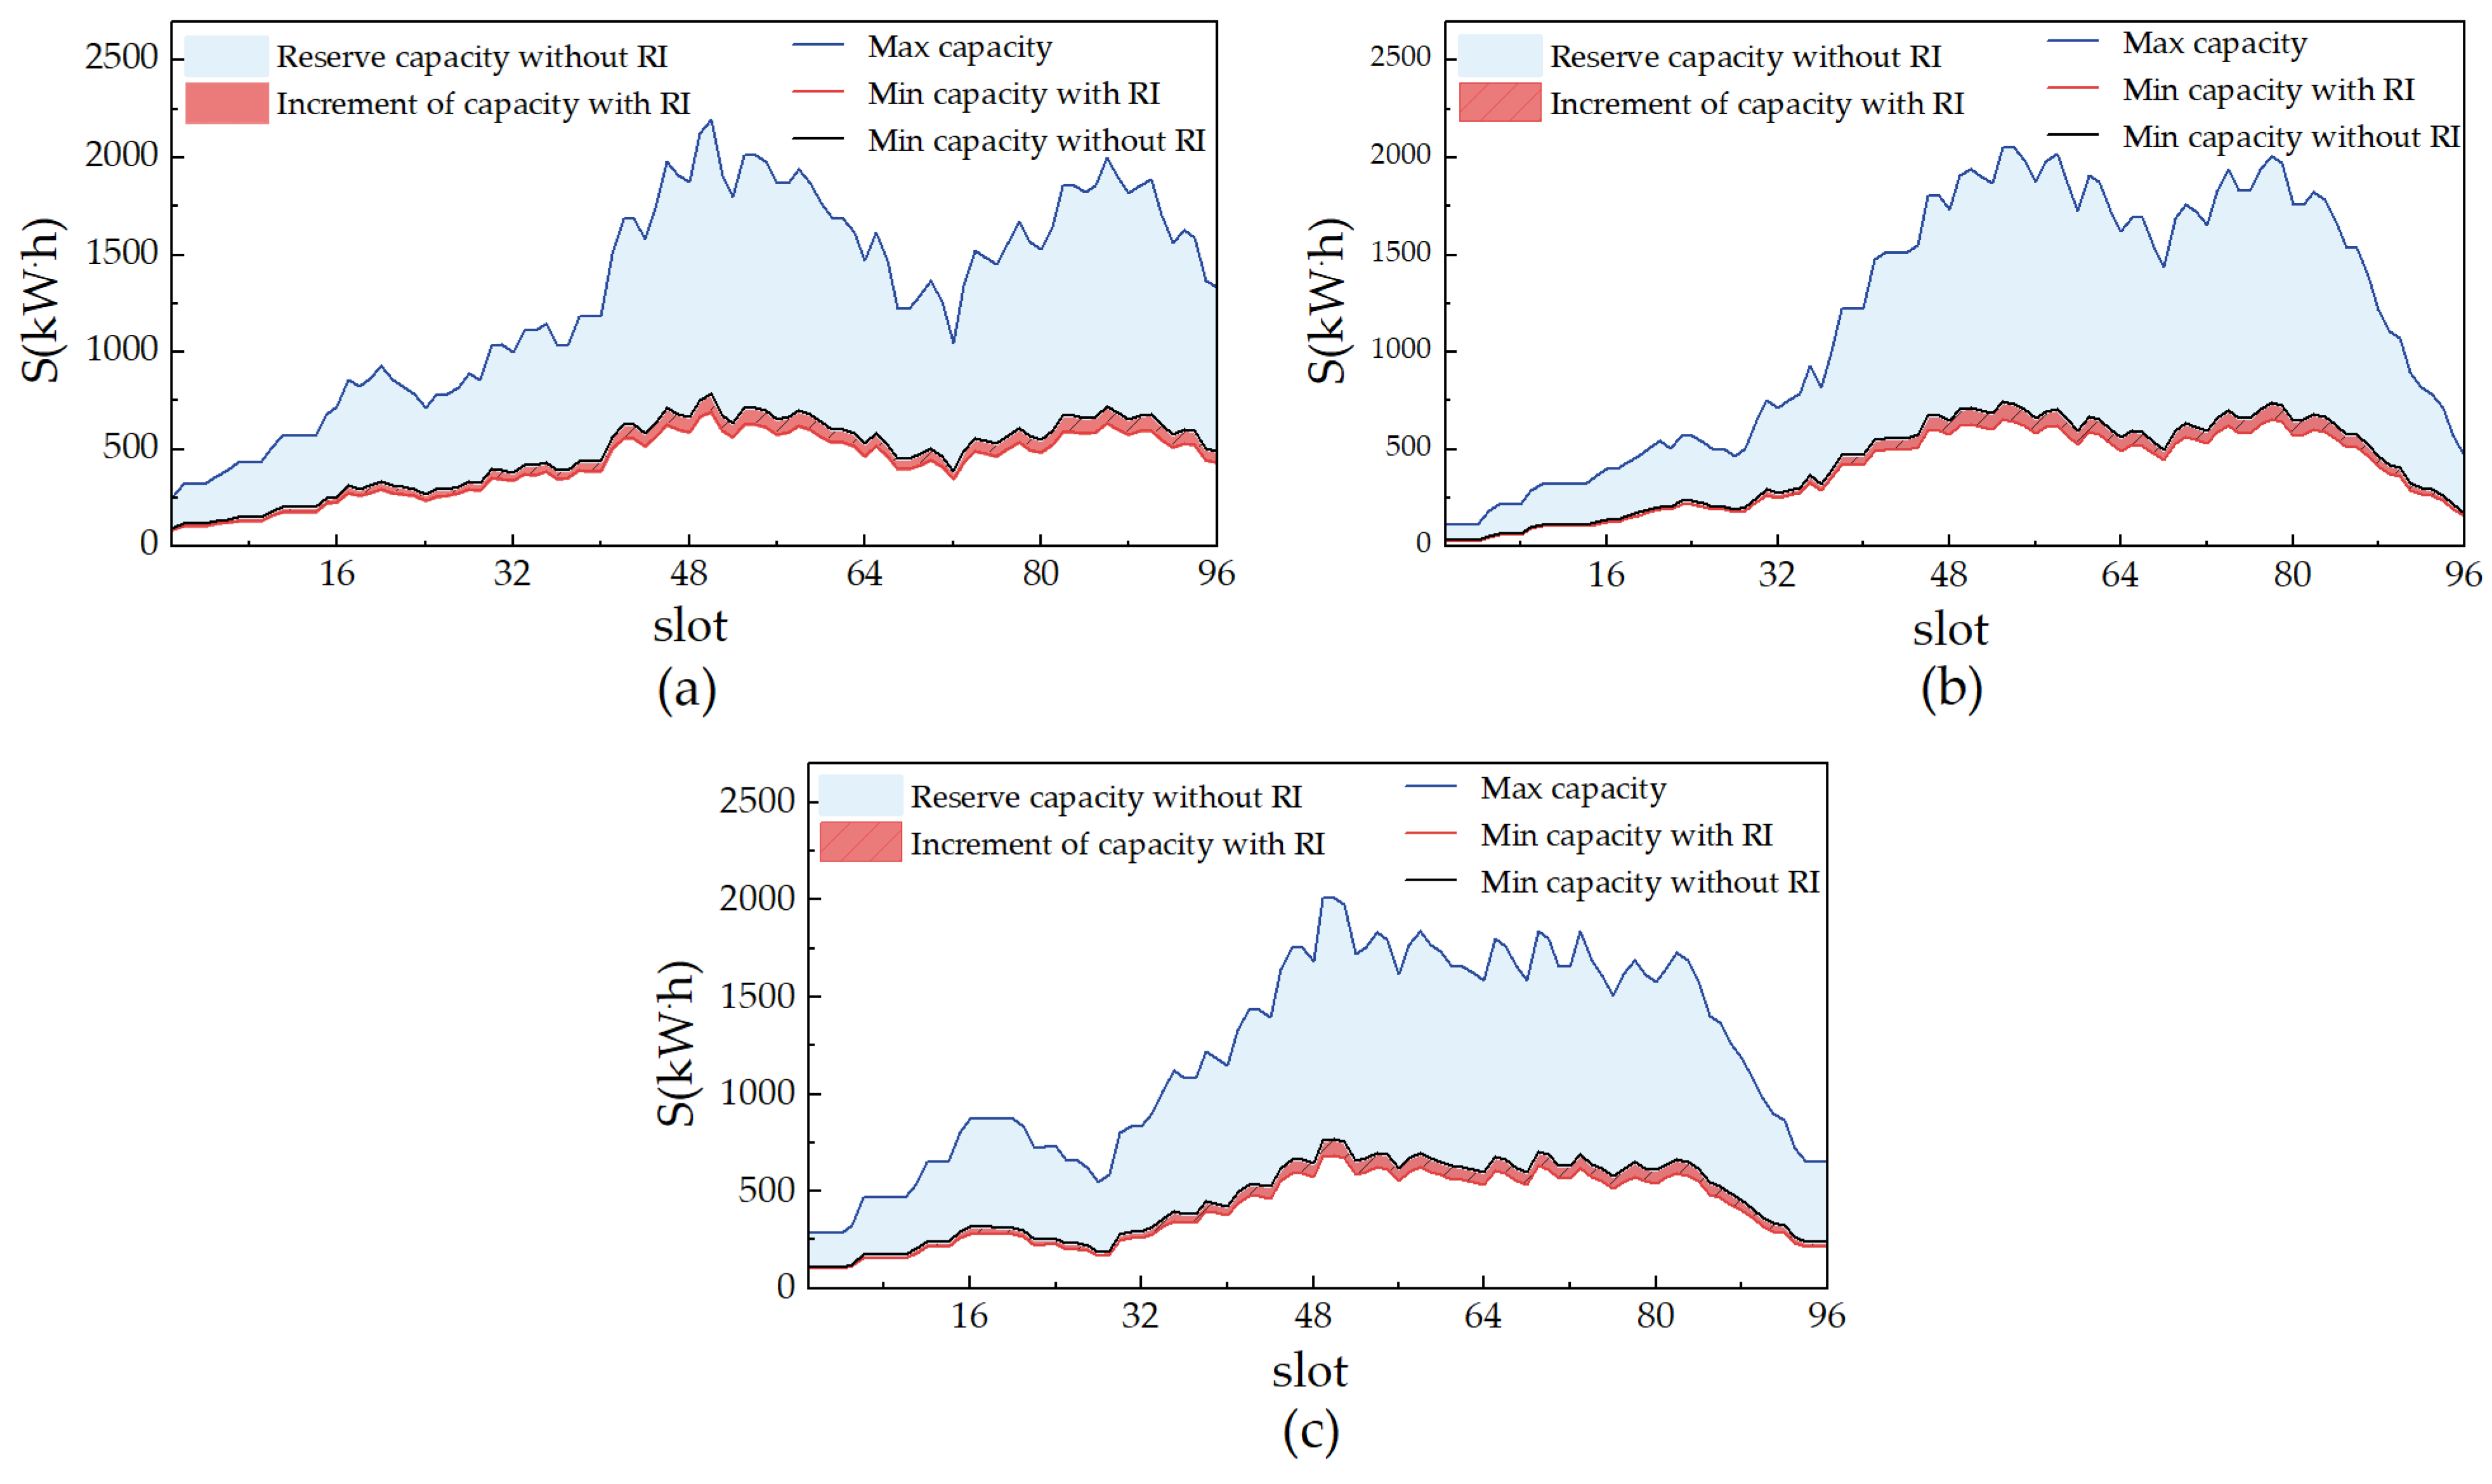
5.2. Analysis of the EVCS Dispatching Result and RI Model Influence

The analysis of the dispatching of the EVCSs is carried out under the spatial-temporal coupling dispatching strategy (P1) proposed in this paper. Figure 6 shows the maximum energy limit S i , t max and minimum energy limit S i , t min of the three EVCSs, as well as their energy and power changes in the dispatching process. Different from flexible loads such as air conditioning, the temporal charging flexible load of the EVCS has its battery capacity limit. Therefore, its capacity change must be considered in dispatching. The proposed generalized flexible load model of the EVCS based on the Minkowski sum algorithm can describe the capacity boundary of the EVCS and make it meet the capacity demand of users in dispatching. On this basis, the aggregate charging power of the charging station is dispatched in the time dimension, focusing on the time when the RES output is high at noon, to better improve the RES consumption rate and reduce the carbon emission of the IDC.
The RI model proposed in this paper describes the time loss and capacity loss of each EV driving in the road network to the charging station. As well, the grid access time and capacity state when an EV connects to a charger can be described more accurately, which has an impact on describing the dispatching potential of the EVCS. Figure 7 shows the deviation of generalized flexible load dispatching potential caused by considering the RI model. If the road network area is larger, it will lead to a longer vehicle driving distance, resulting in more time loss and capacity loss. If the traffic flow increases, i.e., the number of vehicles increases, the slower the vehicle will travel, which will affect the calculation of vehicle time loss and capacity loss.

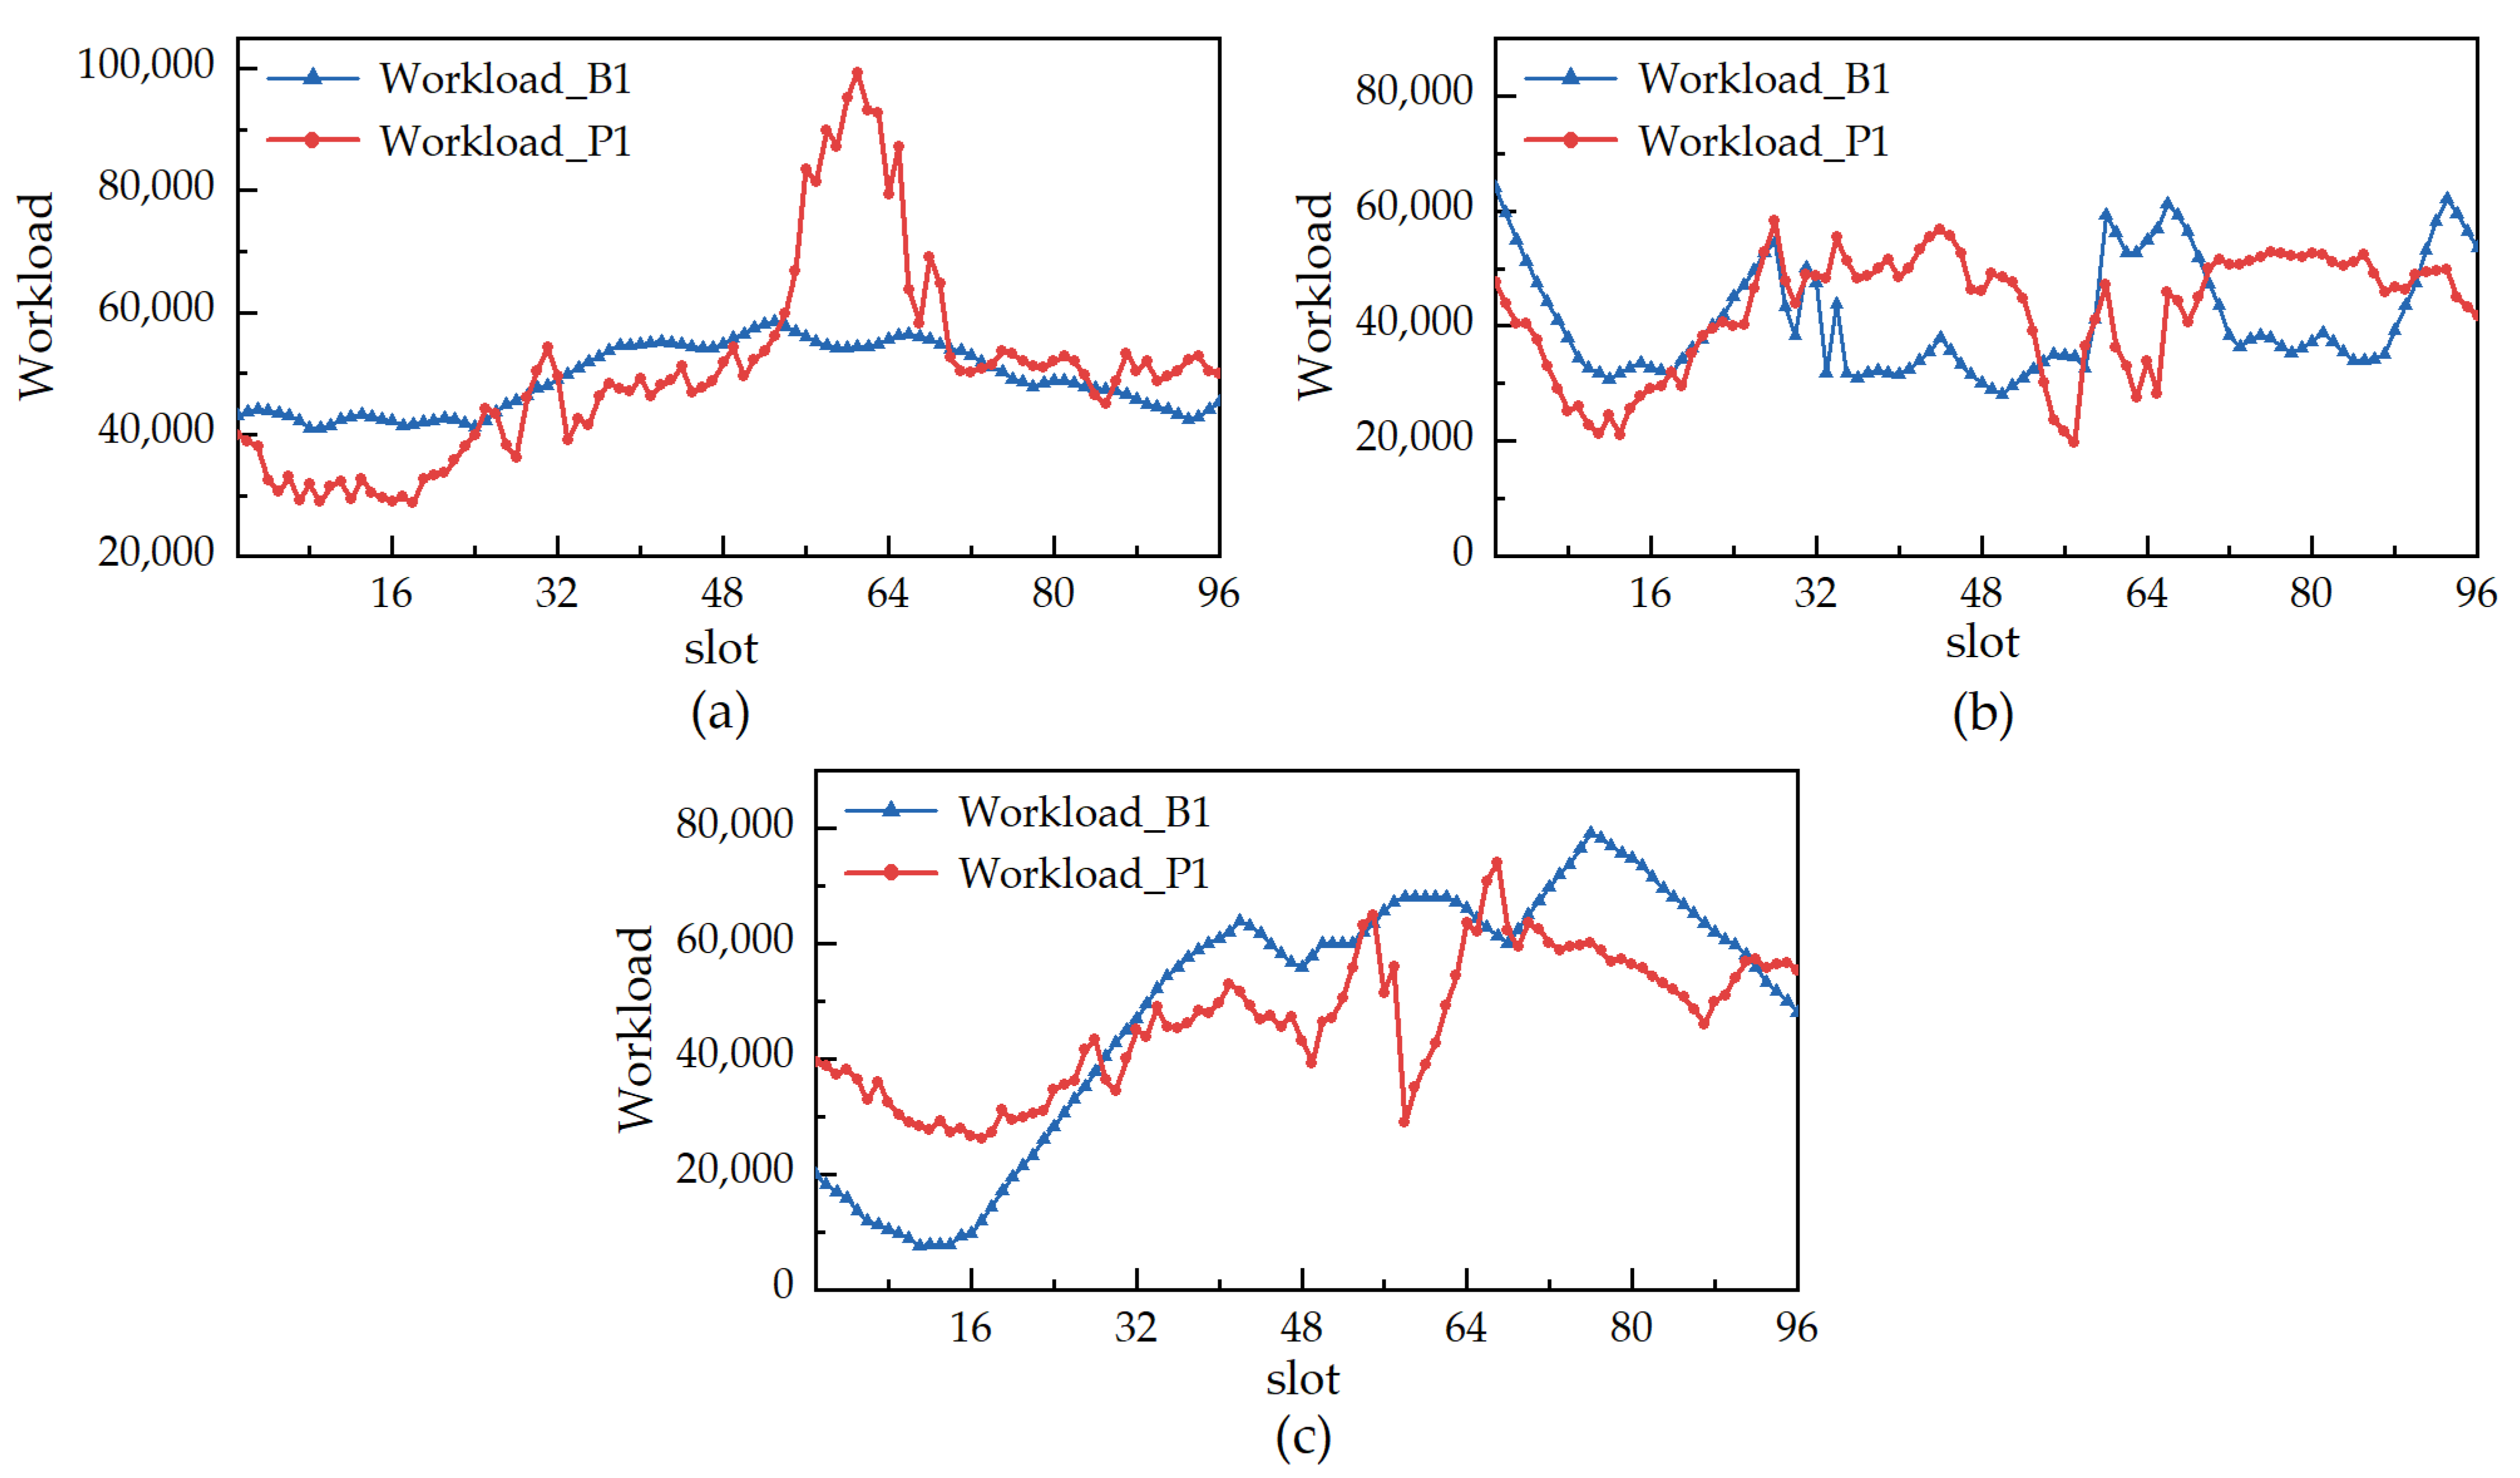
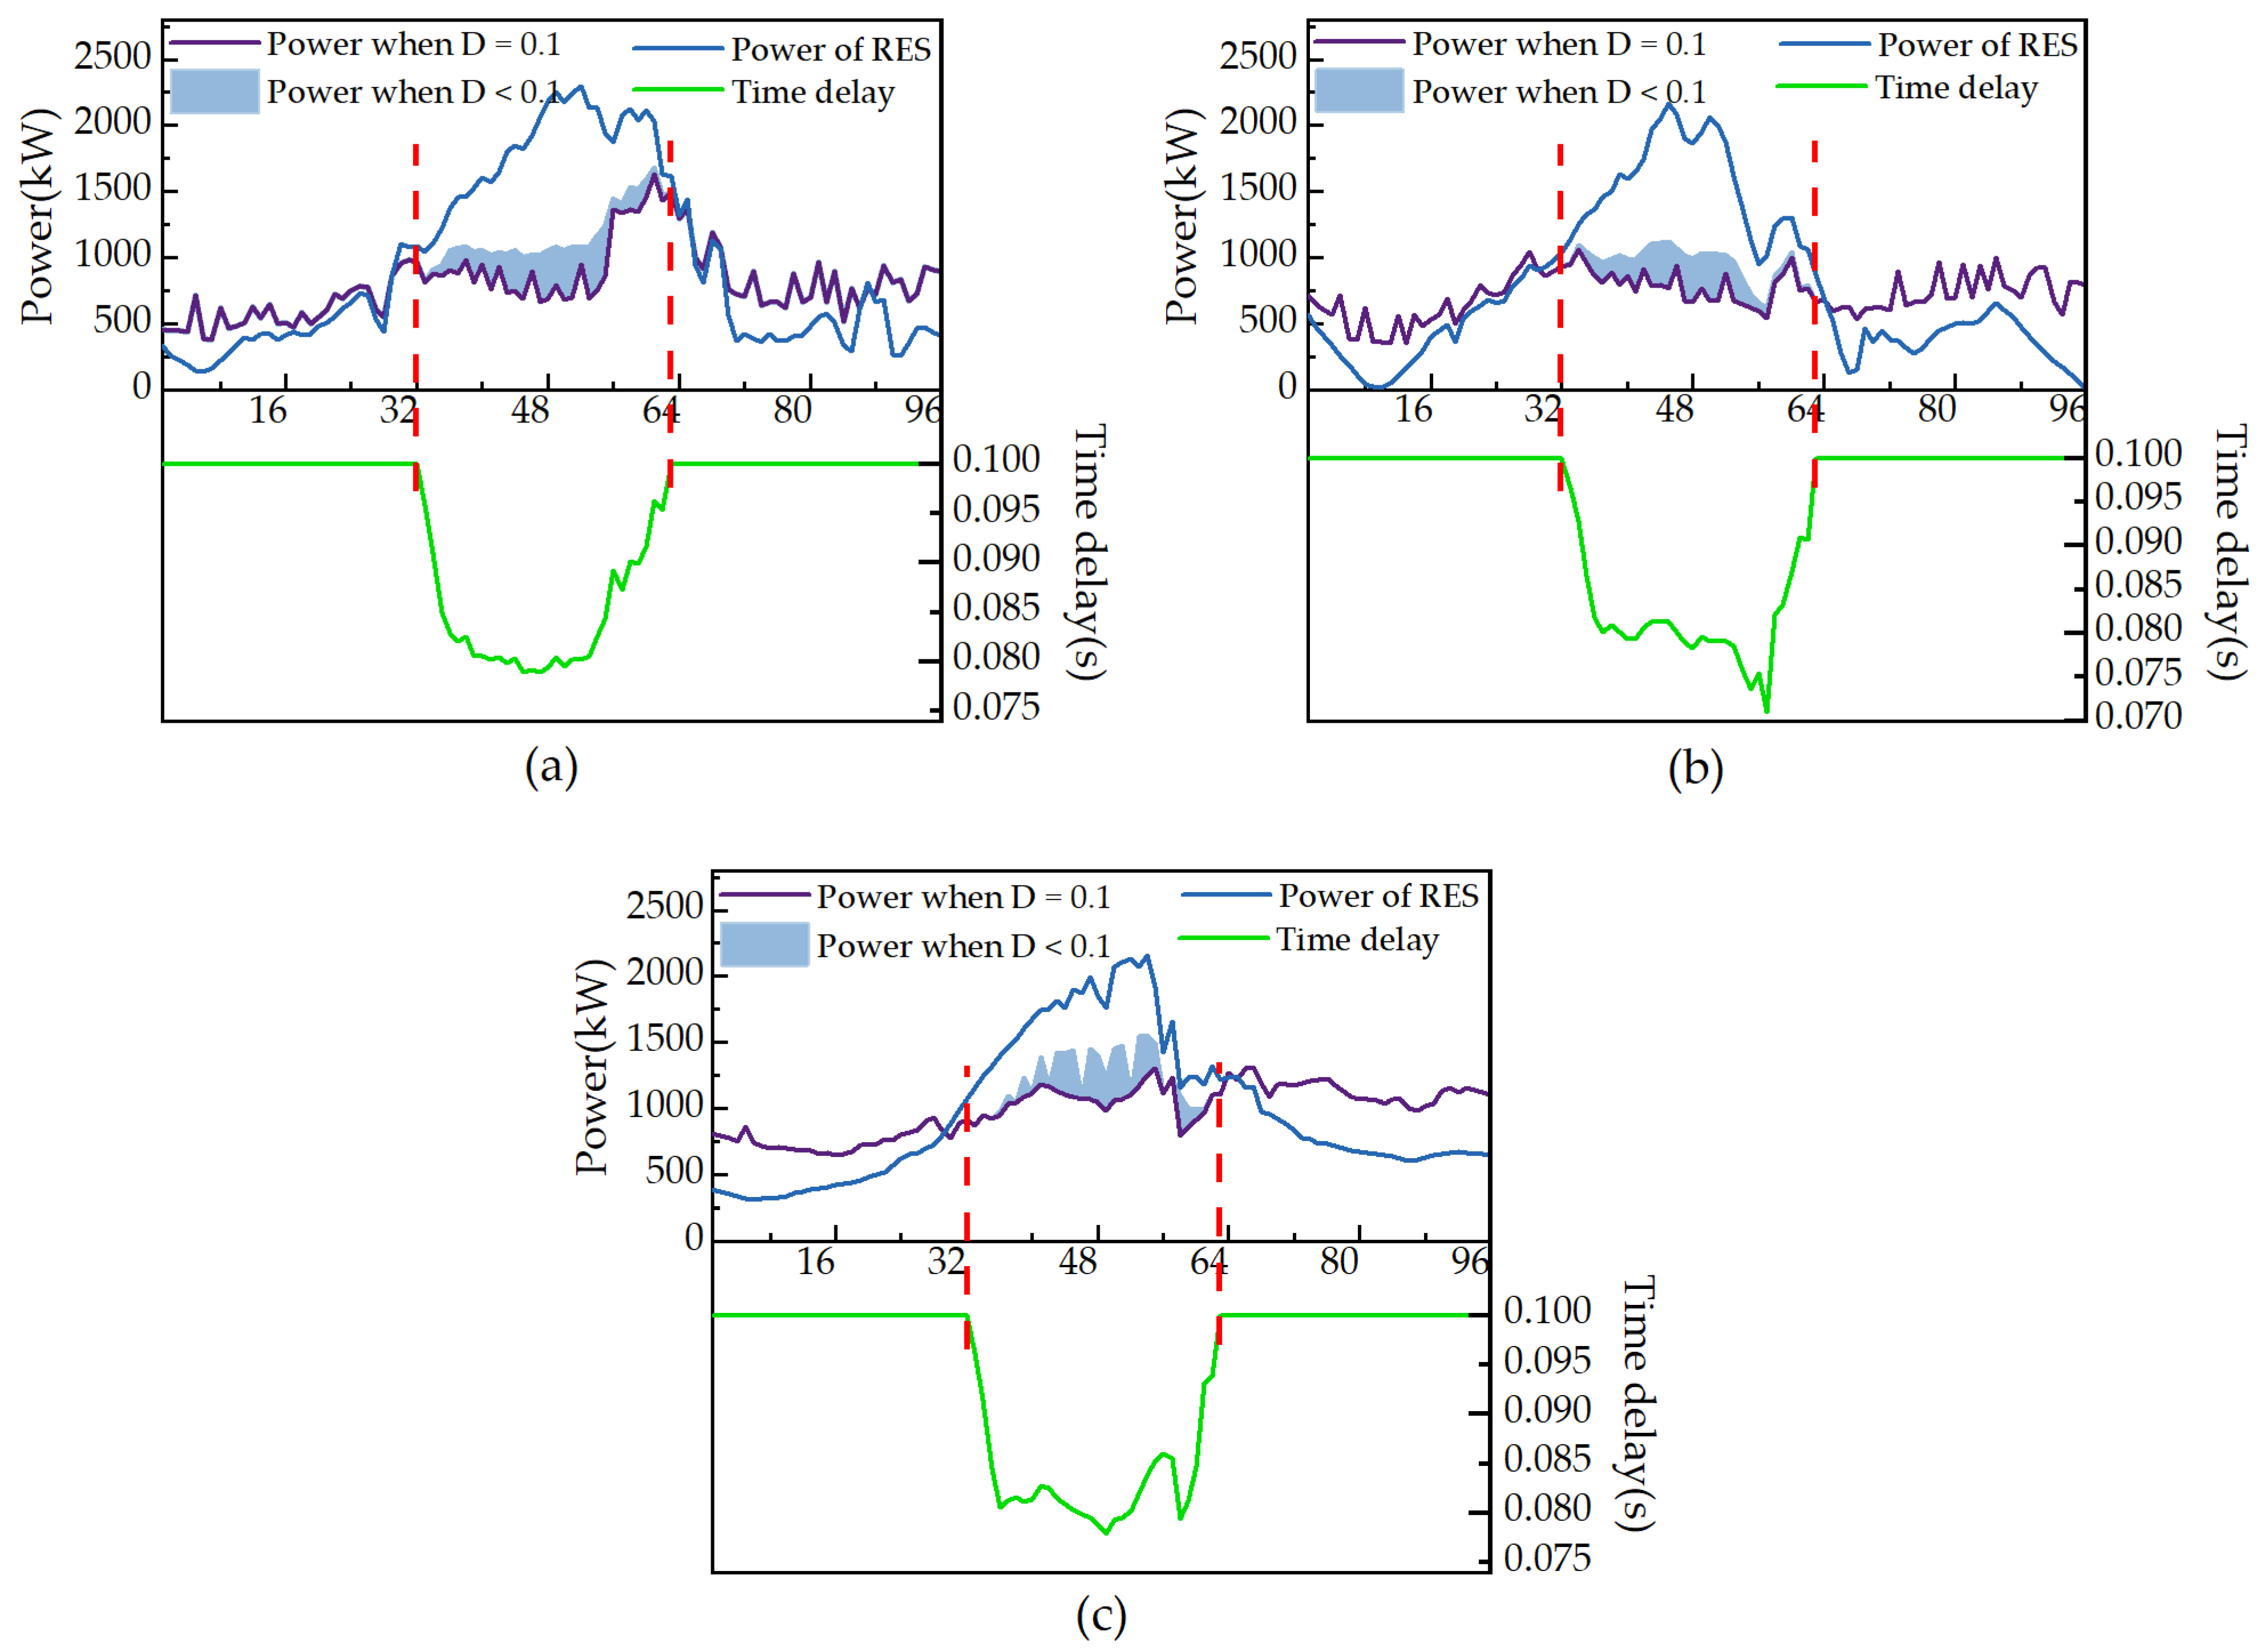
5.3. Analysis of Workload Processing Time Delay and the Impact on RES Consumption

In the comparative analysis in Section 5.1, the power changes of the three strategies are shown. Among them, the P1 case has a positive effect on the improvement of renewable energy consumption rate, which shows that considering the migration ability of the IDC workload has a positive effect on the IDC’s carbon emission reduction. To reveal the workload dispatching in the IDC under this strategy, the workload processed by the IDC before and after migration dispatching is analyzed, as shown in Figure 8. When the total workload processed by DCO remains unchanged, the workload in the IDC can be transferred among the interconnected IDCs. The migration of workload leads to the migration of power consumption. Therefore, the workload can migrate to the IDC with rich renewable energy output.
In the above cases, the waiting time of the workload in the IDC is assumed to equal the time delay limit D = 100 ms signed between the user and the DCO. That is, Equation (10) in Section 3 is satisfied. In this subsection, the impact of workload processing time delay on RES consumption and carbon emission of the IDC under the spatial-temporal coupling dispatching model is discussed. In the simulation, the Equation (37) in the original model is changed to Equation (39). That is, the IDC is allowed to process the workload more efficiently with a higher power, shorten the workload processing time delay as much as possible and improve the user experience on the premise of meeting the carbon emission reduction target.
Figure 9 shows the IDC server power and the corresponding workload processing time delay in the cases of D = 100 ms and D < 100 ms . The simulation results show that when the time delay satisfies D < 100 ms , the overall power consumption of the server in the IDC 1 on a dispatching day increases by 1.66%, and the total carbon emission of DCO on the dispatching day remains unchanged. Figure 9 can well explain this phenomenon. Due to the existence of RES, there is a part of unused energy during the peak period of power generation. This part of the energy can be used to improve the calculation efficiency of the IDC, reduce the workload processing time delay, and improve the user experience while ensuring that the total carbon emission remains unchanged.

6. Conclusions

In this paper, the impact of the interactive workload migration mechanism of the IDCs and the temporal dispatch ability of generalized flexible load of the EVCSs on DCO carbon emission reduction is evaluated. A generalized flexible load model of the EVCSs considering traffic flow is proposed based on the Minkowski sum algorithm. A DCO with three geographically dispersed IDCs and three EVCSs in the Beijing road network are used to demonstrate the effectiveness of the proposed model.
The simulation results show that the joint dispatching of the EVCSs temporal regulation ability and interactive workload spatial migration ability can reduce the carbon emission of the DCO. The proposed strategy can also reduce the energy cost paid by the DCO. The aggregation model of the EVCS considering traffic flow and road resistance meets the technical needs of the social trend of continuous expansion of the scale of EVs. This paper can provide technical support for the DCO carbon emission reduction with multiple geographically dispersed IDCs.
Future research of this strategy could be continued in two directions, considering the strategy of the DCO participating in the green certificate market and the strategy of the EVCS controlling EVs in real time. Participating in the green certificate market can bring more benefits to the DCO and give it a greater driving force to implement carbon emission reduction strategies. As well, the research on the strategy of the EVCS issuing dispatching instructions to each charger in real time is conducive to the application and implementation of the research strategy in this paper.

Author Contributions

Conceptualization, X.W. (Xihao Wang) and Z.L.; methodology, X.W. (Xihao Wang) and X.W. (Xiaojun Wang); validation, Y.L., C.X.; formal analysis, X.W. (Xihao Wang); model implementation, X.W. (Xihao Wang) and X.W. (Xiaojun Wang); data curation, Y.L., Y.Y.; writing, review, and editing, X.W. (Xihao Wang) and Z.L.; resources, C.X., R.Z.; visualization, X.W. (Xihao Wang) and Y.L.; supervision, Z.L.; project administration, R.Z. and Y.Y. All authors have read and agreed to the published version of the manuscript.

Funding

This research was funded by the State Grid Technology Project “Research on Interaction between Large-scale Electric Vehicles and Power Grid and Charging Safety Protection Technology” (5418-202071490A-0-0-00) from State Grid Corporation of China.

Institutional Review Board Statement

Not applicable.

Informed Consent Statement

Not applicable.

Data Availability Statement

Not applicable.

Conflicts of Interest

The authors declare no conflict of interest.

References

  1. Yang, T.; Zhao, Y.; Pen, H.; Wang, Z. Data center holistic demand response algorithm to smooth microgrid tie-line power fluctuation. Appl. Energy 2018, 231, 277–287. [Google Scholar] [CrossRef]
  2. Trueman, C. Why Data Centres Are the New Frontier in the Fight against Climate Change. Available online: https://www.computerworld.com/article/3431148/why-data-centres-are-the-new-frontier-in-the-fight-against-climate-change.html (accessed on 31 March 2022).
  3. Directorate General for Communications Networks Content and Technology. Shaping Europe’s Digital Future. 2020. Available online: http://op.europa.eu/it/publication-detail/-/publication/33b6e417-53c8-11ea-aece-01aa75ed71a1 (accessed on 1 February 2021).
  4. Manganelli, M.; Soldati, A.; Martirano, L.; Ramakrishna, S. Strategies for improving the sustainability of data centers via energy mix, energy conservation, and circular energy. Sustainability 2021, 13, 6114. [Google Scholar] [CrossRef]
  5. Kwon, S. Ensuring renewable energy utilization with quality of service guarantee for energy-efficient data center operations. Appl. Energy 2020, 276, 115424. [Google Scholar] [CrossRef]
  6. Vuong, Q.H. The (ir) rational consideration of the cost of science in transition economies. Nat. Hum. Behav. 2018, 2, 5. [Google Scholar] [CrossRef]
  7. National Bureau of Statistics of China. The Added Value of Industries above Designated Size Increased by 7.5% from January to February 2022; National Bureau of Statistics of China: Beijing, China, 2022.
  8. Natural Resources Defense Council (NRDC). Data Center Efficiency Assessment; Natural Resources Defense Council (NRDC): New York, NY, USA, 2014. [Google Scholar]
  9. Disaster Recovery and Your Data Center’s Redundancy. Available online: https://avtech.com/articles/8269/disasterrecovery-data-centers-redundancy/ (accessed on 31 March 2022).
  10. Brand, C.; Anable, J.L. ‘Disruption’ and ‘Continuity’ in Transport Energy Systems: The Case of the Ban on New Conventional Fossil Fuel Vehicles. In European Council for an Energy Efficient Economy (ECEEE) Summer Study 2019 Proceedings. 2019, pp. 1117–1127. Available online: http://eprints.whiterose.ac.uk/147678/ (accessed on 31 March 2022).
  11. Shafie-Khah, M.; Heydarian-Forushani, E.; Osório, G.J.; Gil, F.; Aghaei, J.; Barani, M.; Catalão, J.P. Optimal behavior of electric vehicle parking lots as demand response aggregation agents. IEEE Trans. Smart Grid 2016, 7, 2654–2665. [Google Scholar] [CrossRef]
  12. Hu, C.; Guo, Y.; Deng, Y.; Lang, L. Improve the Energy Efficiency of Datacenters with the Awareness of Workload Variability. IEEE Trans. Netw. Serv. Manag. 2022. [Google Scholar] [CrossRef]
  13. Yu, L.; Jiang, T.; Cao, Y. Energy cost minimization for distributed internet data centers in smart microgrids considering power outages. IEEE Trans. Parallel Distrib. Syst. 2014, 26, 120–130. [Google Scholar] [CrossRef]
  14. Li, J.; Bao, Z.; Li, Z. Modeling demand response capability by internet data centers processing batch computing jobs. IEEE Trans. Smart Grid 2015, 6, 737–747. [Google Scholar] [CrossRef]
  15. Yang, L.; Chiu, D.; Liu, C.; Phan, L.; Mcmanus, B. Towards dynamic pricing-based collaborative optimizations for green data centers. In Proceedings of the 2013 IEEE 29th International Conference on Data Engineering Workshops (ICDEW), Brisbane, Australia, 8–12 April 2013; pp. 272–278. [Google Scholar]
  16. Renugadevi, T.; Geetha, K.; Muthukumar, K.; Zong, W.G. Optimized energy cost and carbon emission-aware virtual machine allocation in sustainable data centers. Sustainability 2020, 12, 6383. [Google Scholar] [CrossRef]
  17. Yang, T.; Jiang, H.; Hou, Y.; Geng, Y. Carbon Management of Multi-datacenter Based on Spatio-temporal Task Migration. IEEE Trans. Cloud Comput. 2021. [Google Scholar] [CrossRef]
  18. Peng, X.; Kauten, C.; Zhang, C.; Mao, J.; Xiao, Q. REDUX: Managing Renewable Energy in Data Centers Using Distributed UPS Systems. In Proceedings of the 2018 IEEE International Conference on Smart Cloud (SmartCloud), New York, NY, USA, 21–23 September 2018; pp. 46–53. [Google Scholar]
  19. Liu, L.J.; Sun, H.B.; Li, C.; Hu, Y.; Xin, J.M.; Zheng, N.N.; Li, T. Re-ups: An adaptive distributed energy storage system for dynamically managing solar energy in green datacenters. J. Supercomput. 2016, 72, 295–316. [Google Scholar] [CrossRef]
  20. Pierson, J.M.; Baudic, G.; Caux, S.; Celik, B.; Varnier, C. Datazero: Datacenter with zero emission and robust management using renewable energy. IEEE Access 2019, 7, 103209–103230. [Google Scholar] [CrossRef]
  21. Yu, L.; Jiang, T.; Zou, Y. Distributed real-time energy management in data center microgrids. IEEE Trans. Smart Grid 2016, 9, 3748–3762. [Google Scholar] [CrossRef] [Green Version]
  22. Dai, Q.; Liu, J.; Wei, Q. Optimal Photovoltaic/Battery Energy Storage/Electric Vehicle Charging Station Design Based on Multi-Agent Particle Swarm Optimization Algorithm. Sustainability 2019, 11, 1973. [Google Scholar] [CrossRef] [Green Version]
  23. Longo, M.; Yaïci, W.; Zaninelli, D. “Team Play” between Renewable Energy Sources and Vehicle Fleet to Decrease Air Pollution. Sustainability 2016, 8, 27. [Google Scholar] [CrossRef] [Green Version]
  24. Yue, J.; Hu, Z.; Anvari-Moghaddam, A.; Guerrero, J.M. A Multi-Market-Driven Approach to Energy Scheduling of Smart Microgrids in Distribution Networks. Sustainability 2019, 11, 301. [Google Scholar] [CrossRef] [Green Version]
  25. Liang, Y.; Tao, J.; Zou, Y.; Sun, Z. Joint energy management strategy for geo-distributed data centers and electric vehicles in smart grid environment. IEEE Trans. Smart Grid 2016, 7, 2378–2392. [Google Scholar]
  26. Li, M.; Ni, M.; Tong, H.; Ru, Y.; Xu, J.; Wu, Y. Risk Analysis of Electric Vehicles Connected to the Cyber-physical Power System. In Proceedings of the 2021 IEEE Sustainable Power and Energy Conference (iSPEC), Nanjing, China, 23–24 December 2021; pp. 4203–4208. [Google Scholar]
  27. Tomic, J.; Kempton, W. Using fleets of electric-drive vehicles for grid support. J. Power Sources 2007, 1, 459–468. [Google Scholar] [CrossRef]
  28. Pei, P.; Huo, Z.; Martínez, O.S.; Crespo, R.G. Minimal Green Energy Consumption and Workload Management for Data Centers on Smart City Platforms. Sustainability 2020, 12, 3140. [Google Scholar] [CrossRef] [Green Version]
  29. Guo, Q.; Xin, S.; Sun, H.; Li, Z.; Zhang, B. Rapid-charging navigation of electric vehicles based on real-time power systems and traffic data. IEEE Trans. Smart Grid 2014, 5, 1969–1979. [Google Scholar] [CrossRef]
  30. Sun, Y.; Chen, Z.; Li, Z.; Tian, W.; Shahidehpour, M. EV charging schedule in coupled constrained networks of transportation and power system. IEEE Trans. Smart Grid 2018, 10, 4706–4716. [Google Scholar] [CrossRef]
  31. Barot, S. Aggregate Load Modeling for Demand Response via the Minkowski Sum. Ph.D. Thesis, University of Toronto, Toronto, ON, Canada, 2017. [Google Scholar]
  32. Gao, P.X.; Curtis, A.R.; Wong, B. It’s not easy being green. ACM SIGCOMM Comput. Commun. Rev. 2012, 42, 211–222. [Google Scholar] [CrossRef]
  33. Logs of Real Parallel Workloads from Production Systems. Available online: https://www.cs.huji.ac.il/labs/parallel/workload/logs.html (accessed on 31 March 2022).
  34. National Development and Reform Commission (NDRC). Letter on Reply to Proposal No. 3911 (Gongjiao Post and Telecommunications No. 433) of the Second Session of the 13th National Committee of the Chinese People’s Political Consultative Conference; National Development and Reform Commission (NDRC): Beijing, China, 2019.
  35. National Development and Reform Commission (NDRC). Pricing Method for Transmission and Distribution Electricity Price of Provincial Power Grid; National Development and Reform Commission (NDRC): Beijing, China, 2020.
  36. National Energy Administration. Administrative Measures for Electric Power Auxiliary Services; National Energy Administration: Beijing, China, 2021.
Figure 1. Framework of DCO carbon emission reduction dispatching.
Sustainability 14 06814 g001
Figure 2. Road network studied in this paper: (a) part of the actual road network in Beijing, China in ArcMap; (b) simplified road network.
Sustainability 14 06814 g002
Figure 3. The illustration of Minkowski sum for a single EVCS.
Sustainability 14 06814 g003
Figure 4. Comparison of renewable energy consumption optimization of different strategies: (a) IDC1; (b) IDC2; and (c) IDC3.
Sustainability 14 06814 g004
Figure 5. Comparison of carbon emissions of three strategies.
Sustainability 14 06814 g005
Figure 6. Capacity dispatching within the dispatching potential range and power change of the EVCSs: (a) EVCS1; (b) EVCS2; and (c) EVCS3.
Sustainability 14 06814 g006
Figure 7. Influence of RI model on the dispatching potential range of the EVCSs: (a) EVCS1; (b) EVCS2; and (c) EVCS3.
Sustainability 14 06814 g007
Figure 8. Distribution of workloads in three IDCs before and after migration dispatching: (a) IDC1; (b) IDC2; and (c) IDC3.
Sustainability 14 06814 g008
Figure 9. Workload processing time delay and power variation of IDCs under different time delay constraints and the matching between the IDC power consumption and renewable energy output curve: (a) IDC1; (b) IDC2; and (c) IDC3.
Sustainability 14 06814 g009
Publisher’s Note: MDPI stays neutral with regard to jurisdictional claims in published maps and institutional affiliations.

