Article

Study on Strength and Swell Behavioral Change and Properties of the Clay–Fiber Mixtures

Department of Civil Engineering, Bursa Uludağ University, Bursa 16059, Turkey
*
Author to whom correspondence should be addressed.
Sustainability 2022, 14(11), 6767; https://doi.org/10.3390/su14116767
Submission received: 22 April 2022 / Revised: 28 May 2022 / Accepted: 30 May 2022 / Published: 1 June 2022
(This article belongs to the Section Sustainable Materials)

Abstract

:
Clayey soils are spread over large areas of the world. This soil type has numerous problems due to its low strength, high compressibility, and high level of volumetric changes. To overcome these difficulties, many researchers have concentrated their studies on soil improvement techniques. Recently, soil reinforcement has been considered an effective and reliable technique for improving the strength and stability of these soils by using different types of reinforcing materials. This paper aims to investigate the feasibility of using polypropylene fiber as a low-cost and environmentally friendly reinforcing material for high plasticity clay, and assess the strength and swelling behavioral change with fiber content to determine the optimum fiber content that meets the effective improvement rate. A series of laboratory experiments such as a direct shear test, swell test, and unconfined compressive strength (UCS) test were carried out to evaluate the fiber content effect on the strength and swell behavior of composite clay (clay mixed with fiber). The fiber content varied from 0% to 1.5% (by dry weight of the soil). The results show that the inclusion of fiber affects the shear strength (an average increase of 184% at 1.5% fibers), and unconfined compressive strength (an increase of 86% at 1.5% fibers). Likewise, the increase in fiber content causes an increase in the strength properties, cohesion, and friction angle (257% and 62% at 1.5% fibers, respectively). Also, the increase of fiber content causes a decrease in both swelling potential and swell stress (a decrease of 24% and 46% at 1.5% fibers, respectively) in the studied clayey soil.

1. Introduction

Soils that exhibit volume changes due to variations in moisture contents are defined as swelling soils or expansive soils. These soils exhibit large amounts of swelling and shrinkage movements due to environmental and seasonal moisture changes. Thus, these movements seriously cause extensive damage to the structures built upon. It is estimated that shrinking and swelling soils cause about $2.3 billion dollars of damage annually in the United States alone, which is more than twice the annual cost of damage from floods, hurricanes, tornadoes, and earthquakes combined (Dasog and Mermut [1]).
A significant number of studies have been conducted to develop several treatment methods to stabilize expansive soils, and to reduce their damaging effects. These treatment methods comprise stabilization with chemical additives, prewetting, replacement of expansive soils with non-expansive soils, controlling compaction, moisture control, surcharge loading, and thermal methods (Nelson and Miller [2]; Vessely and Wu [3]; Sridharan and Gurtug [4]). All these methods may have the problematic conditions of being inefficient and expensive. Hence, new methods are still being investigated to increase the strength properties and reduce the swelling behaviors of expansive soils by using different materials and additives (Akbulut et al. [5]; Al-Zubaidi et al. [6]; Al-Mahbashi et al. [7]; Al-Bared et al. [8]). Generally, the chemical soil stabilization technique by using conventional materials such as cement, lime, and fly-ash (Panchal et al. [9]; Rios et al. [10,11]) is considered the most used technique. Recently, geo-polymerization (soil-polymer mixtures) has also been presented as an effective technique to improve the properties of problematic soils (Zhang et al. [12]; Kua et al. [13]; Hoy et al. [14]).
Reinforcement techniques are carried out either by adding continuous reinforcement in the form (slides, sheets, bars, mesh, or mat) within the soil mass, after determining their location and direction, or by mixing separate fibers with the “soil fill” before placing it in the required place at the project site. However, the use of geosynthetic materials has confirmed the effectiveness of enhancing both short- and long-term bearing capacity of shallow foundations and reducing the potential post-construction settlements of the constructions established on embankments (Hoy et al. [14]).
Many investigations have been performed on the reinforcement of soils by using randomly oriented natural and synthetic discrete fiber materials to improve soil stability (Akbulut et al. [5]; Kumar et al. [15]; Sivakumar Babu and Vasudevan [16]; Viswanadham et al. [17]). Tang et al. [18] showed that fiber inclusions increased the tensile strength of clayey soils. Yilmaz [19] proved that the unconfined compressive strength for expansive clays has been increased by using a mixture of fly ash and polypropylene fiber. On the other flip, for lime-fiber stabilized clayey soil, swelling potential has been decreased by the increase of fiber content as reported by Cai et al. [20].
However, the reports on the utilization of randomly-oriented natural and synthetic discrete fiber materials to reduce swelling potential in expansive soils have not been settled yet sufficiently, and the optimum fiber content that meets the optimal improving rate for both shear and unconfined strength properties have not fulfilled yet, with respect to the soil type and fiber properties. Furthermore, most recent studies that focused on using the polymer materials as additives to be mixed with weak soils proved that this technique is considered an environmentally friendly and low-carbon stabilization of weak soils in comparison with Portland cement stabilization (Deng et al. [21]). On the contrary, several recent studies documented that the incorporation of higher dosages of coal fly ash into water and soil releases toxic elements, consequently creating soil and groundwater pollution leading to major health, environmental, and land-use problems (Imran Khan and Rashid Umar [22]). Therefore, this research came to assess the feasibility of using short polypropylene fiber as a low-cost and environmentally friendly reinforcing material to improve the swelling and strength behavior of clayey soils and track the behavioral changes with the fiber content. Thus, we aimed to identify the optimum fiber content that should be added to obtain an effective improvement rate for both strength and swell properties and behavior in high compressibility clayey soil.

2. Materials

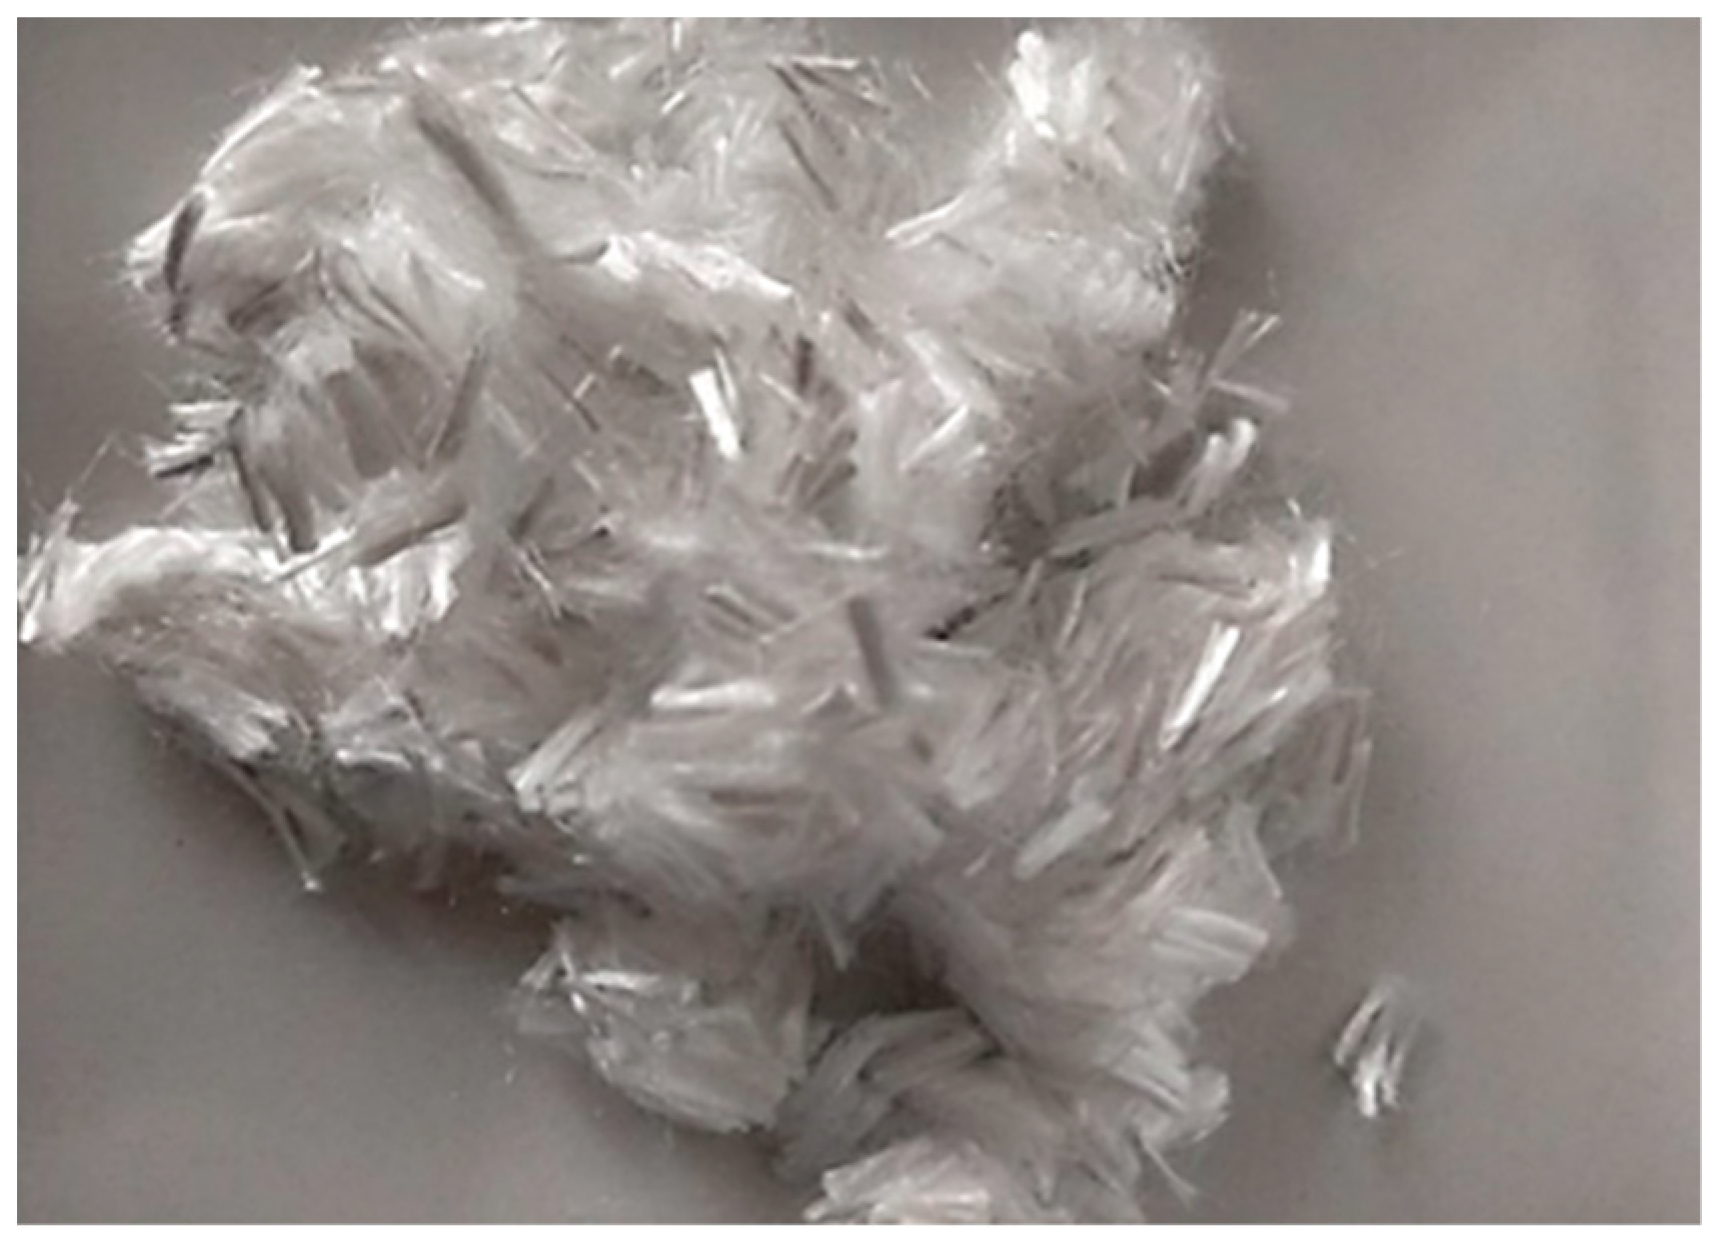
2.1. Polypropylene Fiber

Polypropylene fiber (PP) is a thermoplastic material, produced by the polymerizing process under carefully controlled pressure and heat. Propylene consists of an unsaturated hydrocarbon with only carbon and hydrogen atoms. There are many available forms of polypropylene. One form of PP is a semi-crystalline solid. The crystallizable form of PP is termed “isotactic” PP and the non-crystallizable form is termed “atactic” (Brown et al. [23]).
Polypropylene fibers are also produced as continuous cylindrical monofilaments that can be chopped to specified lengths or as films and tapes that can be fibrillated to form fibrils of rectangular cross-sections. Fibrillated means that the polypropylene film is slit, so it can be expanded into an open network of fibers. Table 1 summarizes the properties of the polypropylene fibers used in this study as shown on its identification card (as provided by the manufacturer). Figure 1 shows the shape and type of the used material.
The main reason for selecting this type of fiber to be considered in this study is the fact that these fibers are more commonly used as industrial materials, as well as, because of their low cost in comparison with other traditional additives, and their chemical inert nature, where these materials cannot be absorbed, and do not interact with soil moisture. In addition, there is good potential of their applications in several areas such as pavements, backfill of retaining walls, liquefaction mitigation, embankments, slopes, and foundation soils (Ramasamy and Arumairaj [24]). According to Hejazi et al. [25], the general advantages of fiber composite soils are the availability, economical benefits, easy to work and rapid to perform, and feasibility of using in all weather conditions. However, it is important to refer that obtaining a homogeneous soil–fiber matrix in the field is troublesome as reported by many researchers in comparison with the hand mixing (lab mixing) that allows fibers to merge properly with the soil mass, but this issue can possibly be overcome and mitigated by oscillatory or helical mixing techniques Hejazi et al. [25].

2.2. Soil

The used soil for the test program was obtained from the excavation of a residential foundation in Gaziantep, Turkey. The site for soil collection was selected because the clayey soil appeared to be rather uniform. Before the tests were conducted, a series of index property tests were performed to determine the general characteristics of the studied soil. The index property tests were comprised of gradation analysis, hydrometer analysis, an Atterberg limit test, and a specific gravity test. The results of laboratory testing are summarized in Table 2.

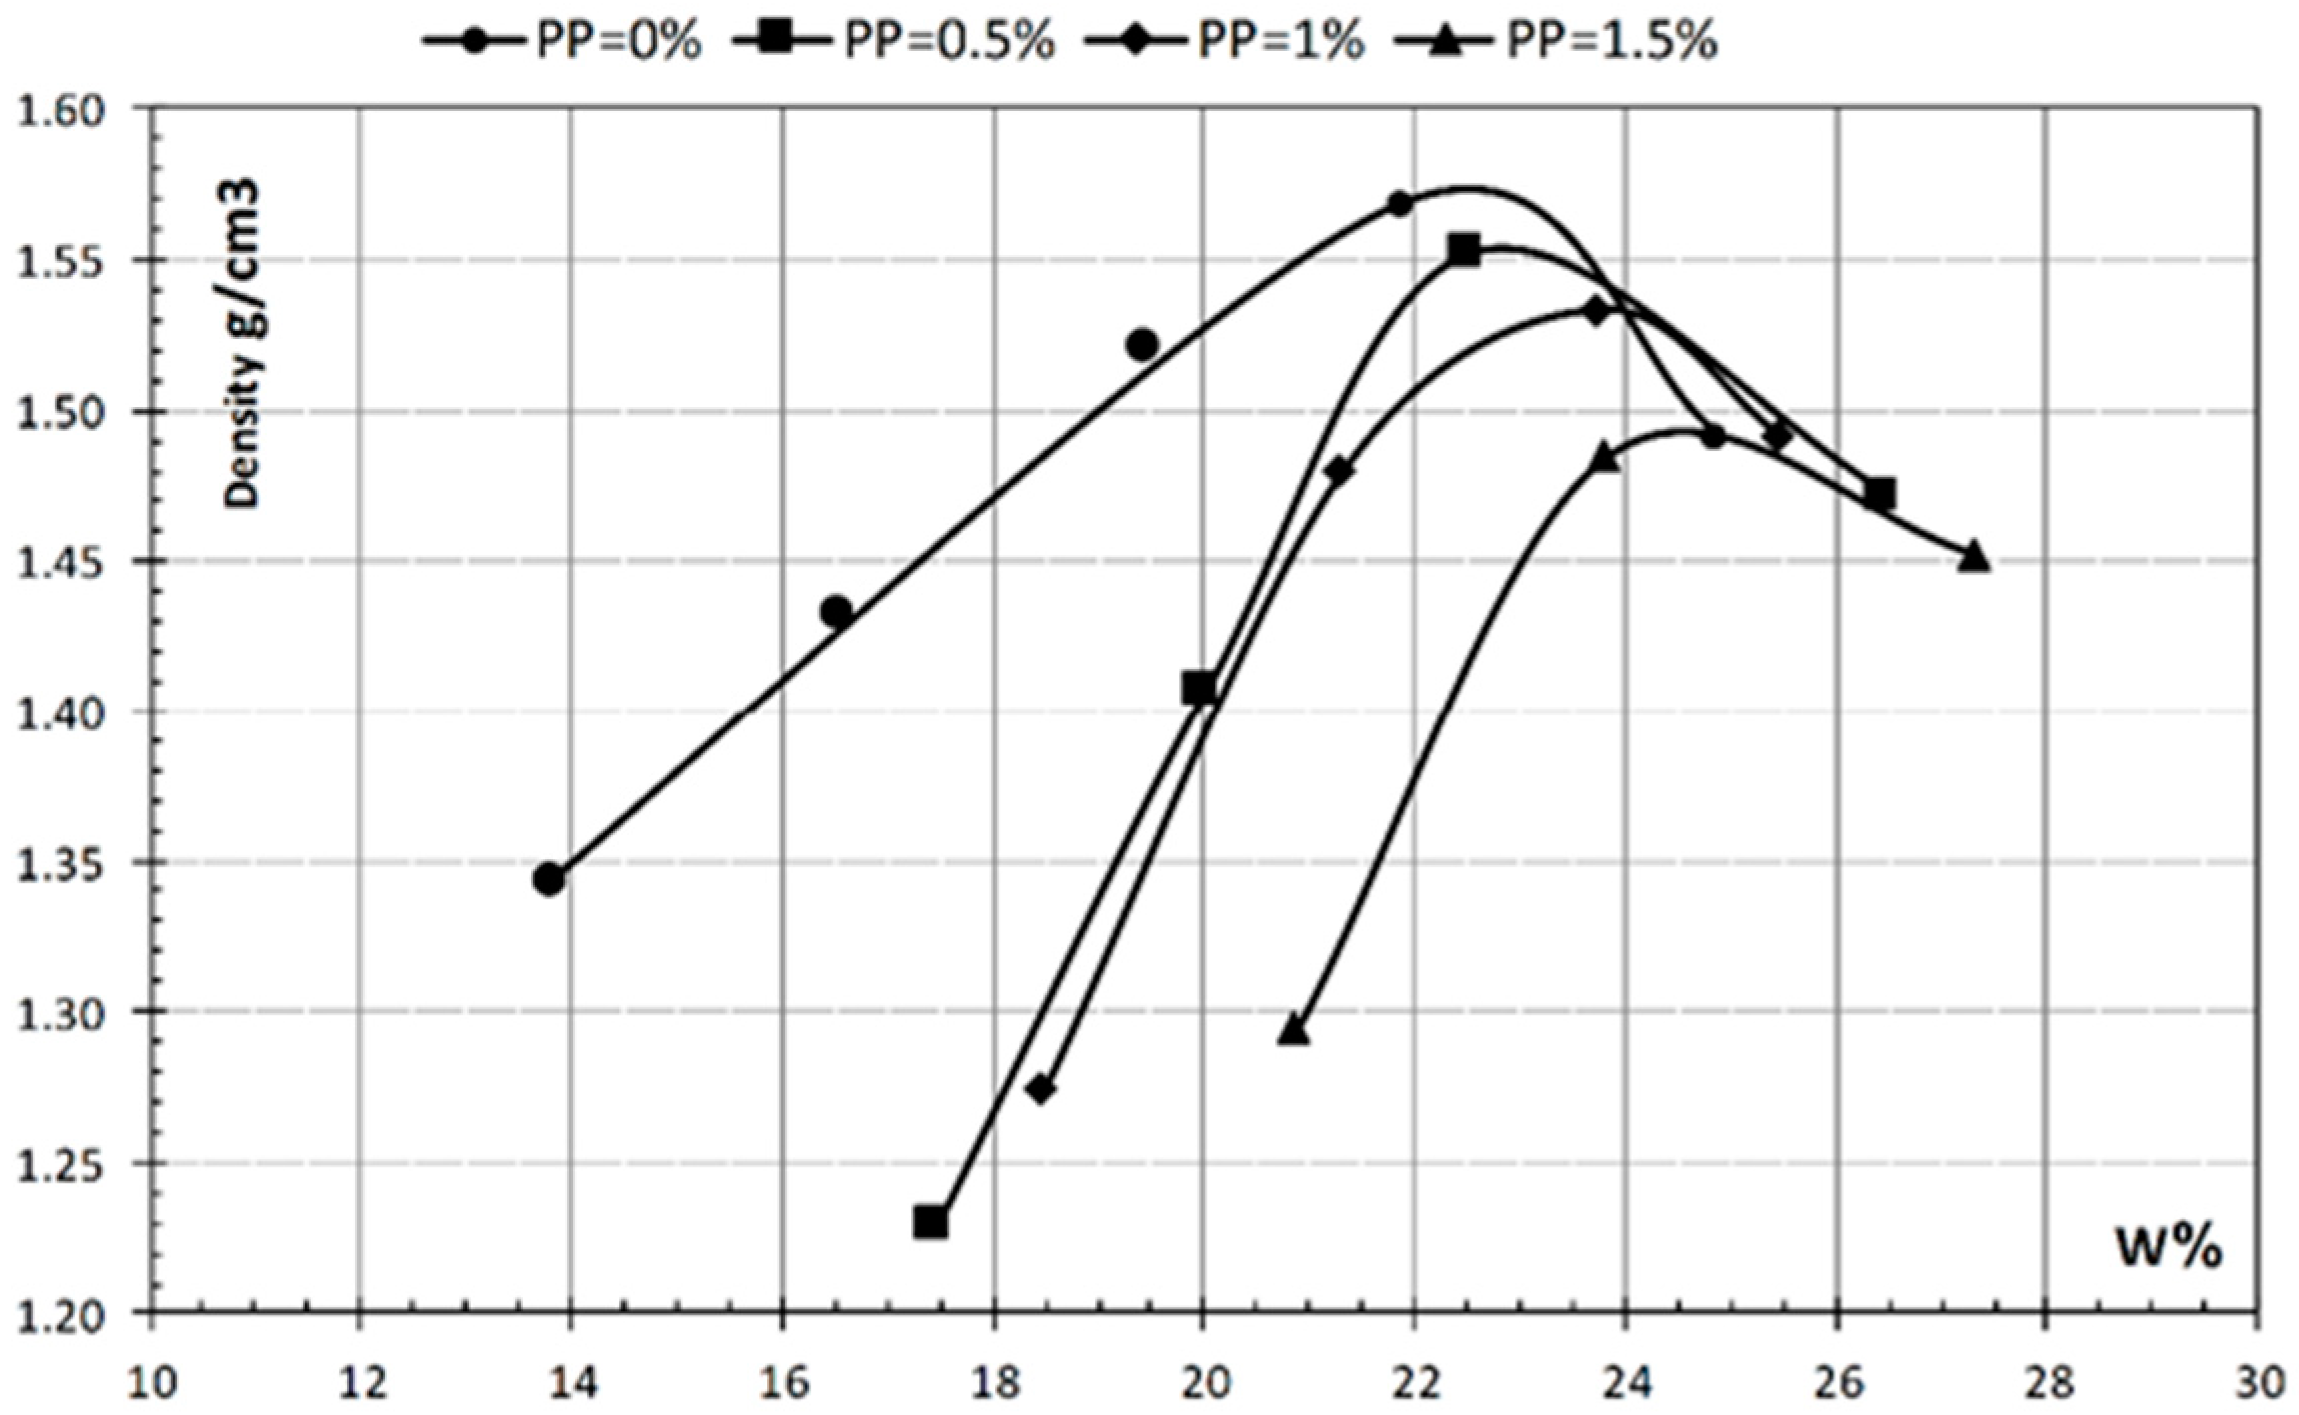
3. Laboratory Investigations

A laboratory experimental program was conducted on clayey soil with high plasticity for studying the influence of polypropylene fibers on swelling characteristics, strength, and index properties. Initially, the studied soil characteristics and index properties were determined and then compared with those of samples stabilized with polypropylene fibers (fibrillated polypropylene fiber), where three fiber contents were considered (0.5%, 1%, and 1.5%) after preparing many samples with different fiber contents (0.5%, 1%, 1.5%, 2%, and 2.5%), and coming up with the optimal contents that could be used without exposing the samples to large pressures during the preparation (easy to form in the lab). The fiber content/weight was the studied ratio multiplied by the dry weight of the soil for each sample.

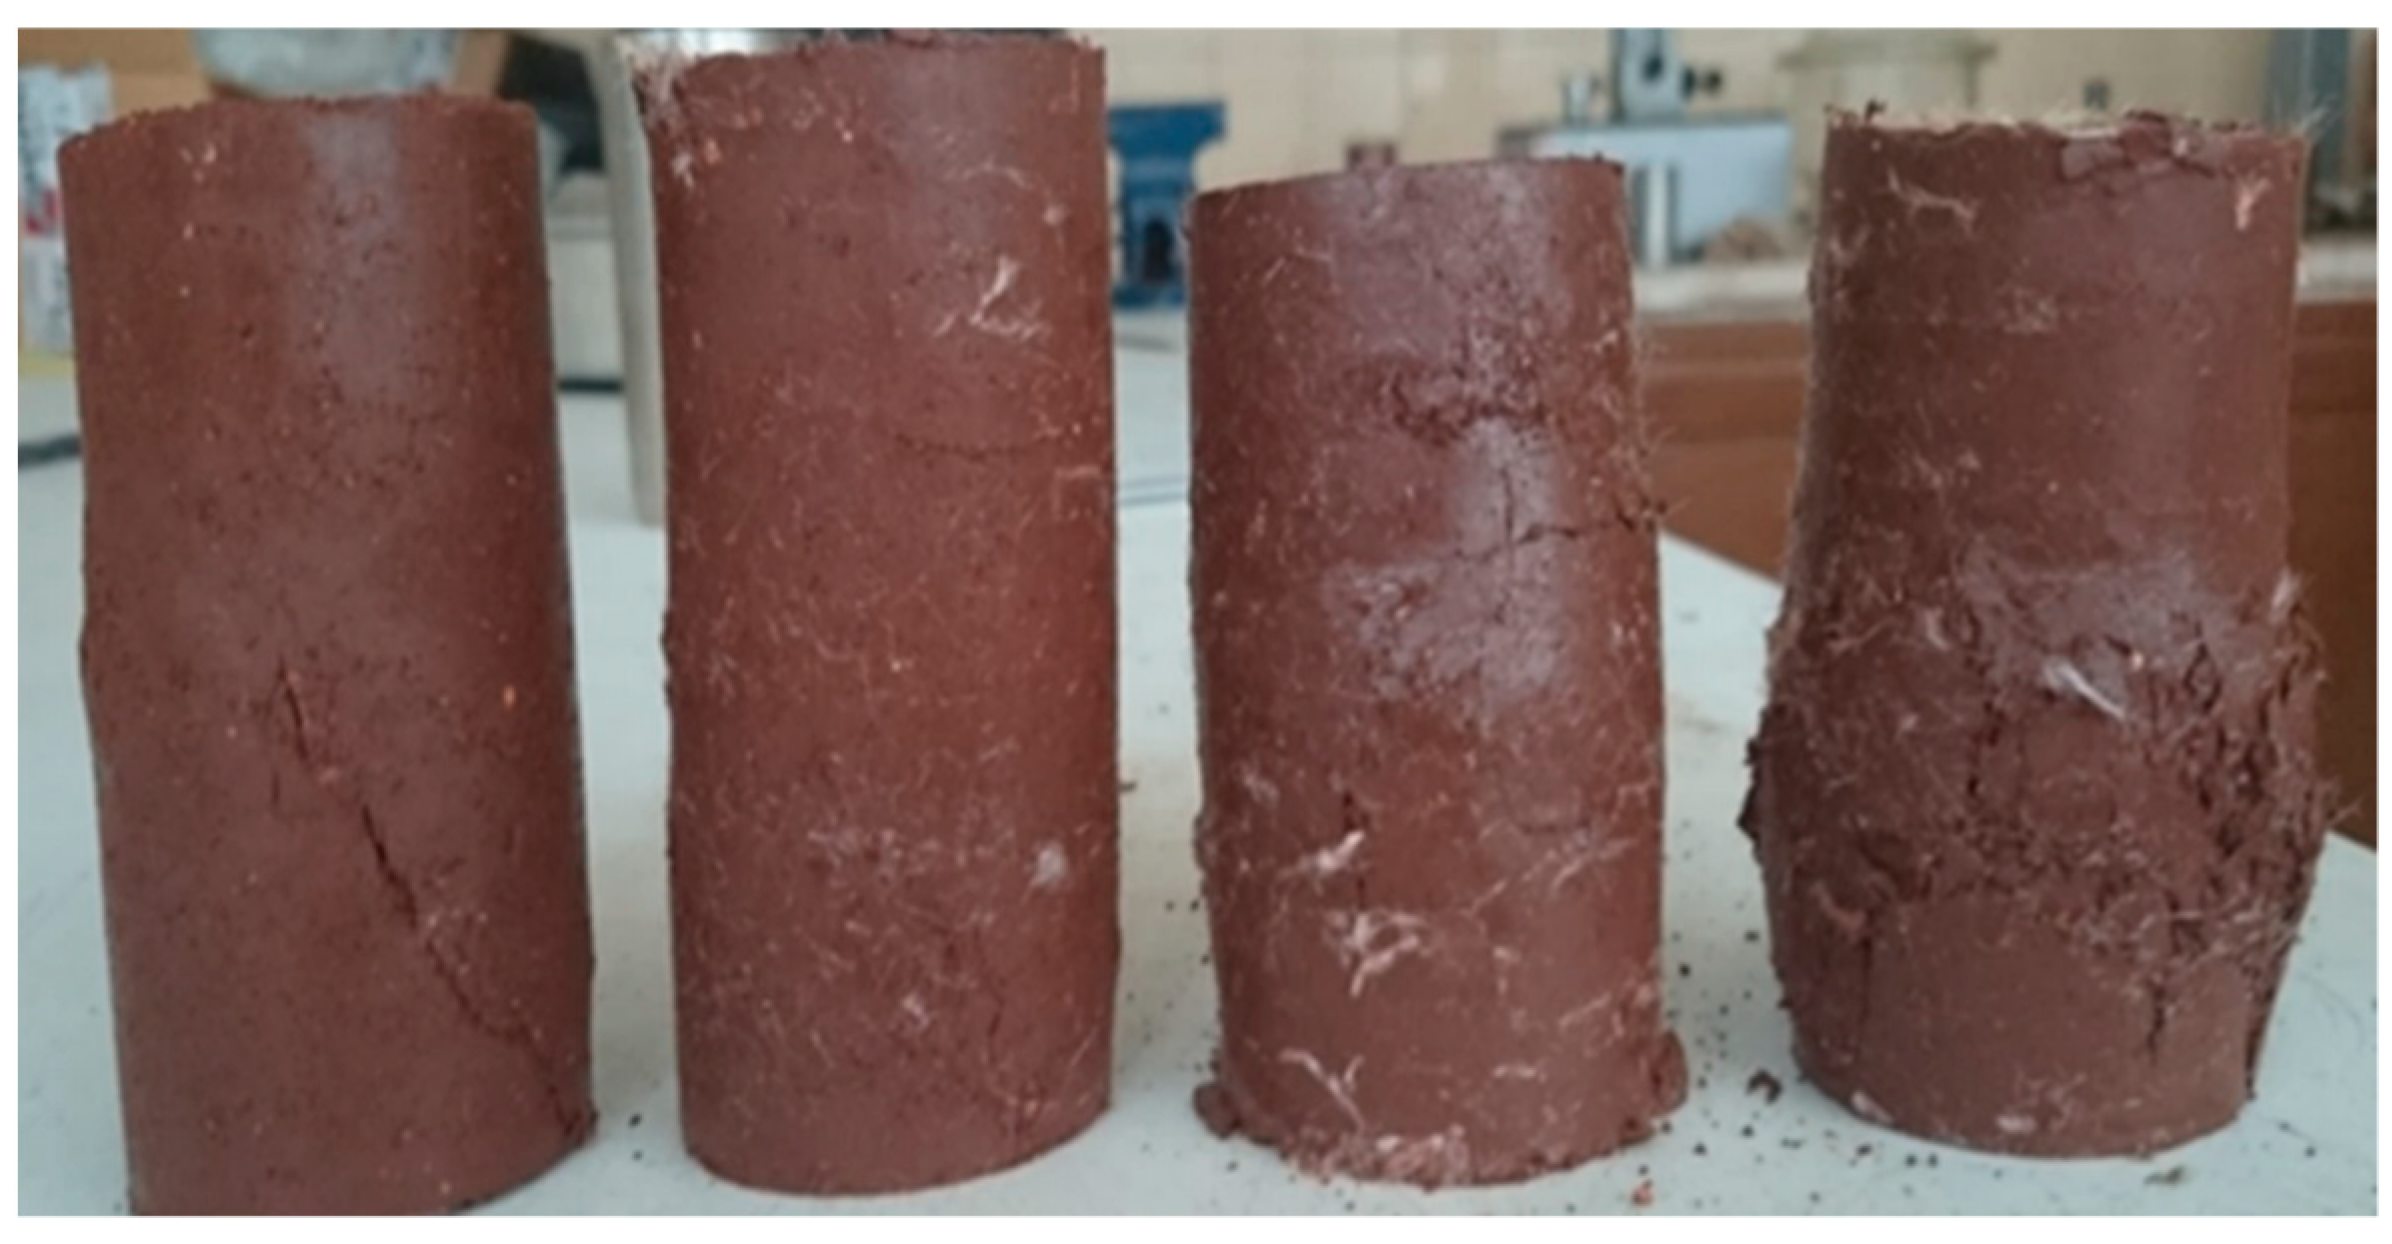
3.1. Sample Preparation

In this study, three various contents of polypropylene fiber (i.e., 0.5%, 1%, and 1.5% of soil dry weight) were selected. In the laboratory, the tests’ samples were extracted from the proctor apparatus (i.e., the sample’s dry density corresponds with maximum dry density (MDD) which is 1.57 g/cm3, and with the optimum moisture content (OMC) which is 22.5%) in accordance with the ASTM D 698 standards [26], and this was applied for each fiber content after mixing the calculated fiber very well. Proctor experiment’s results for each fiber content are summarized in Figure 2.

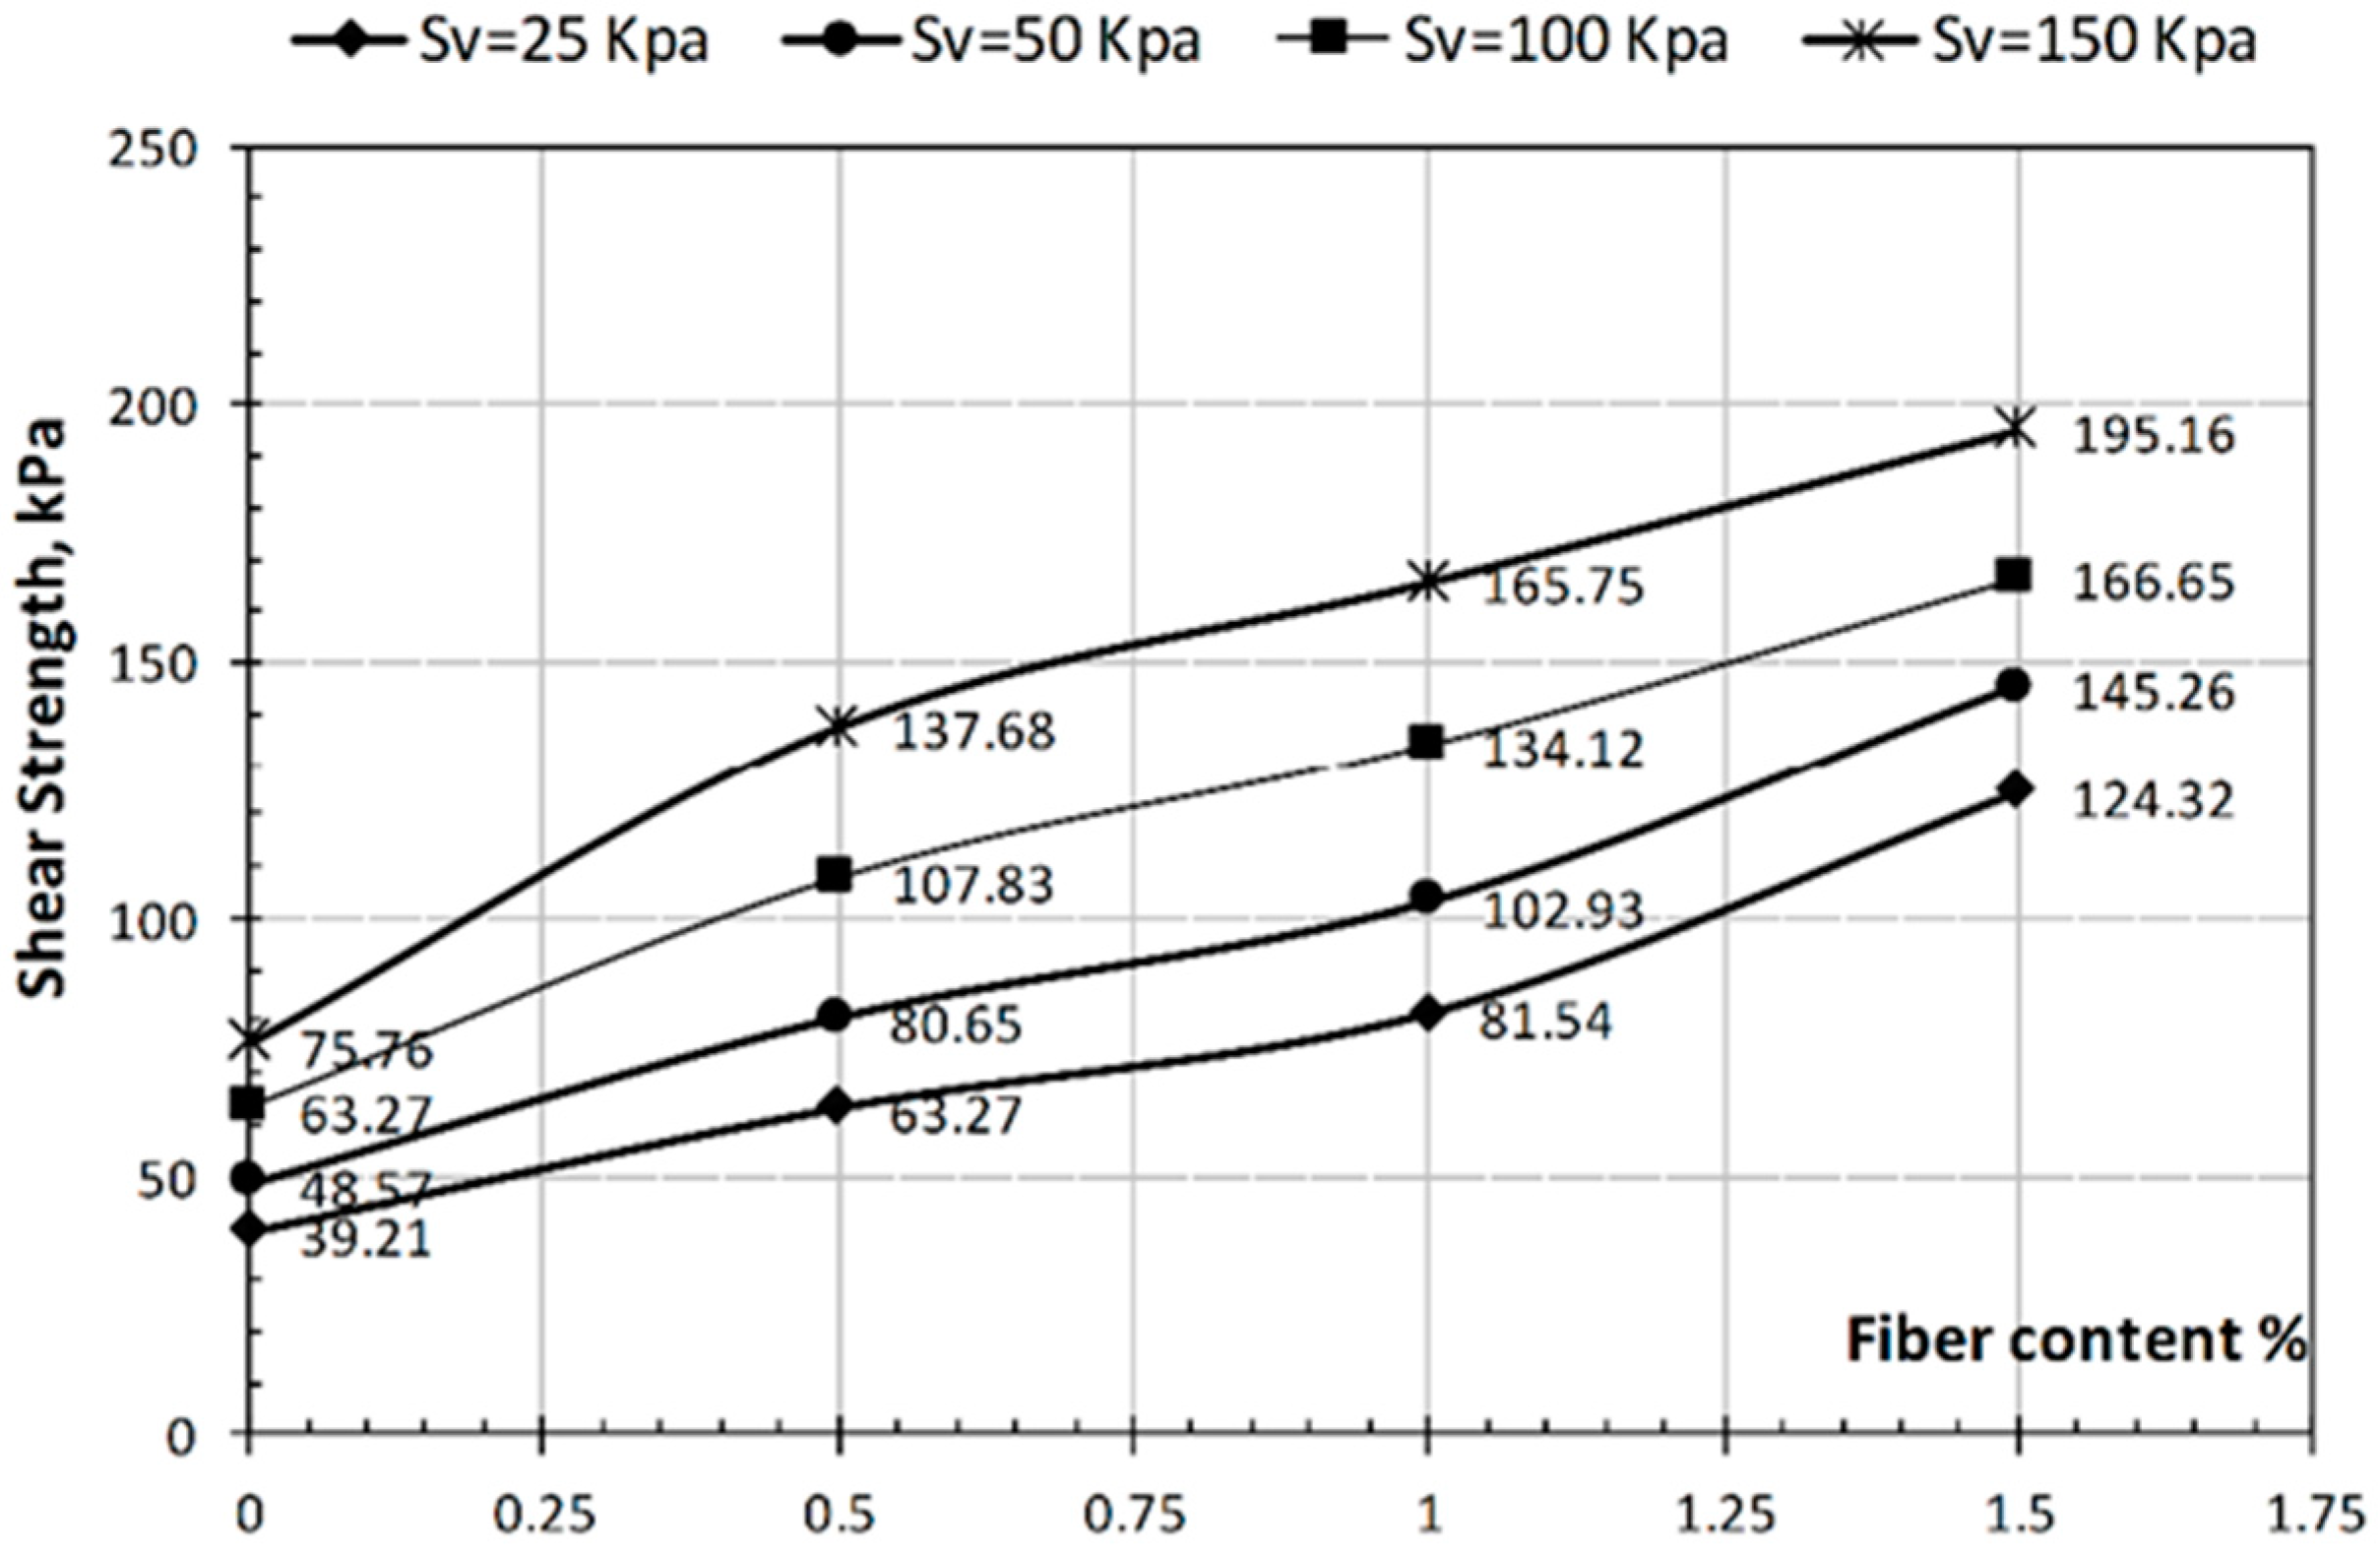
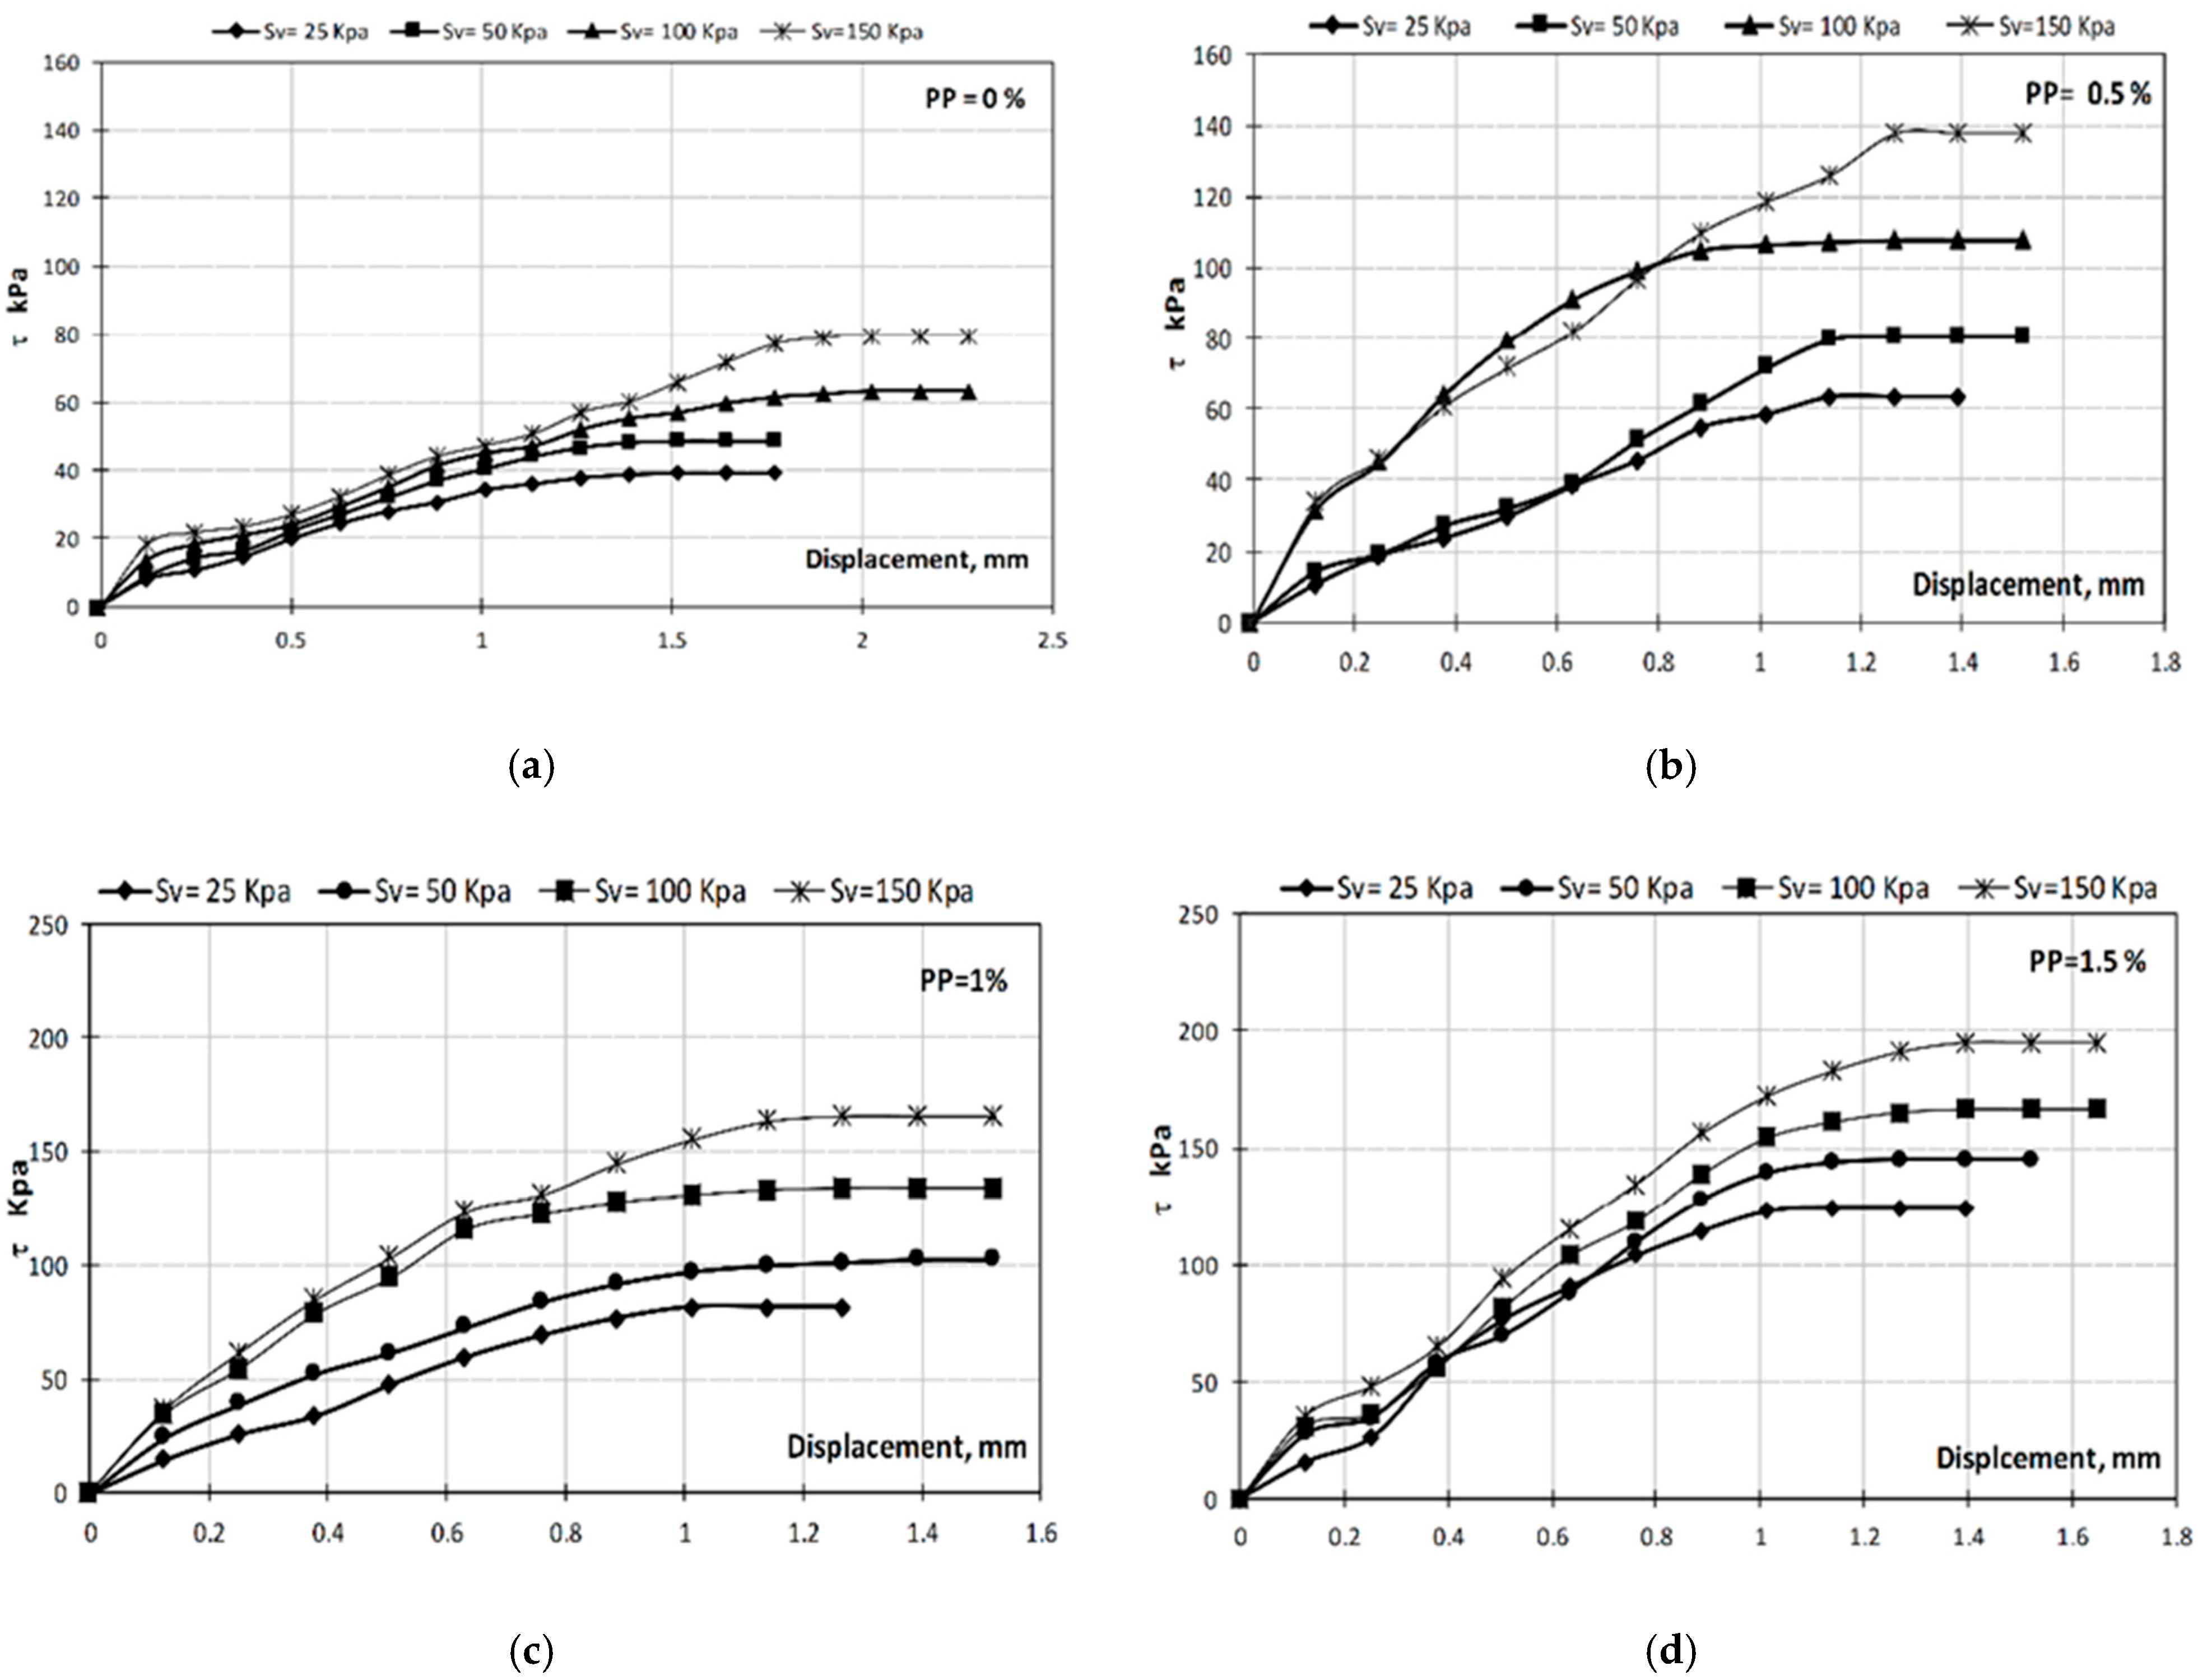
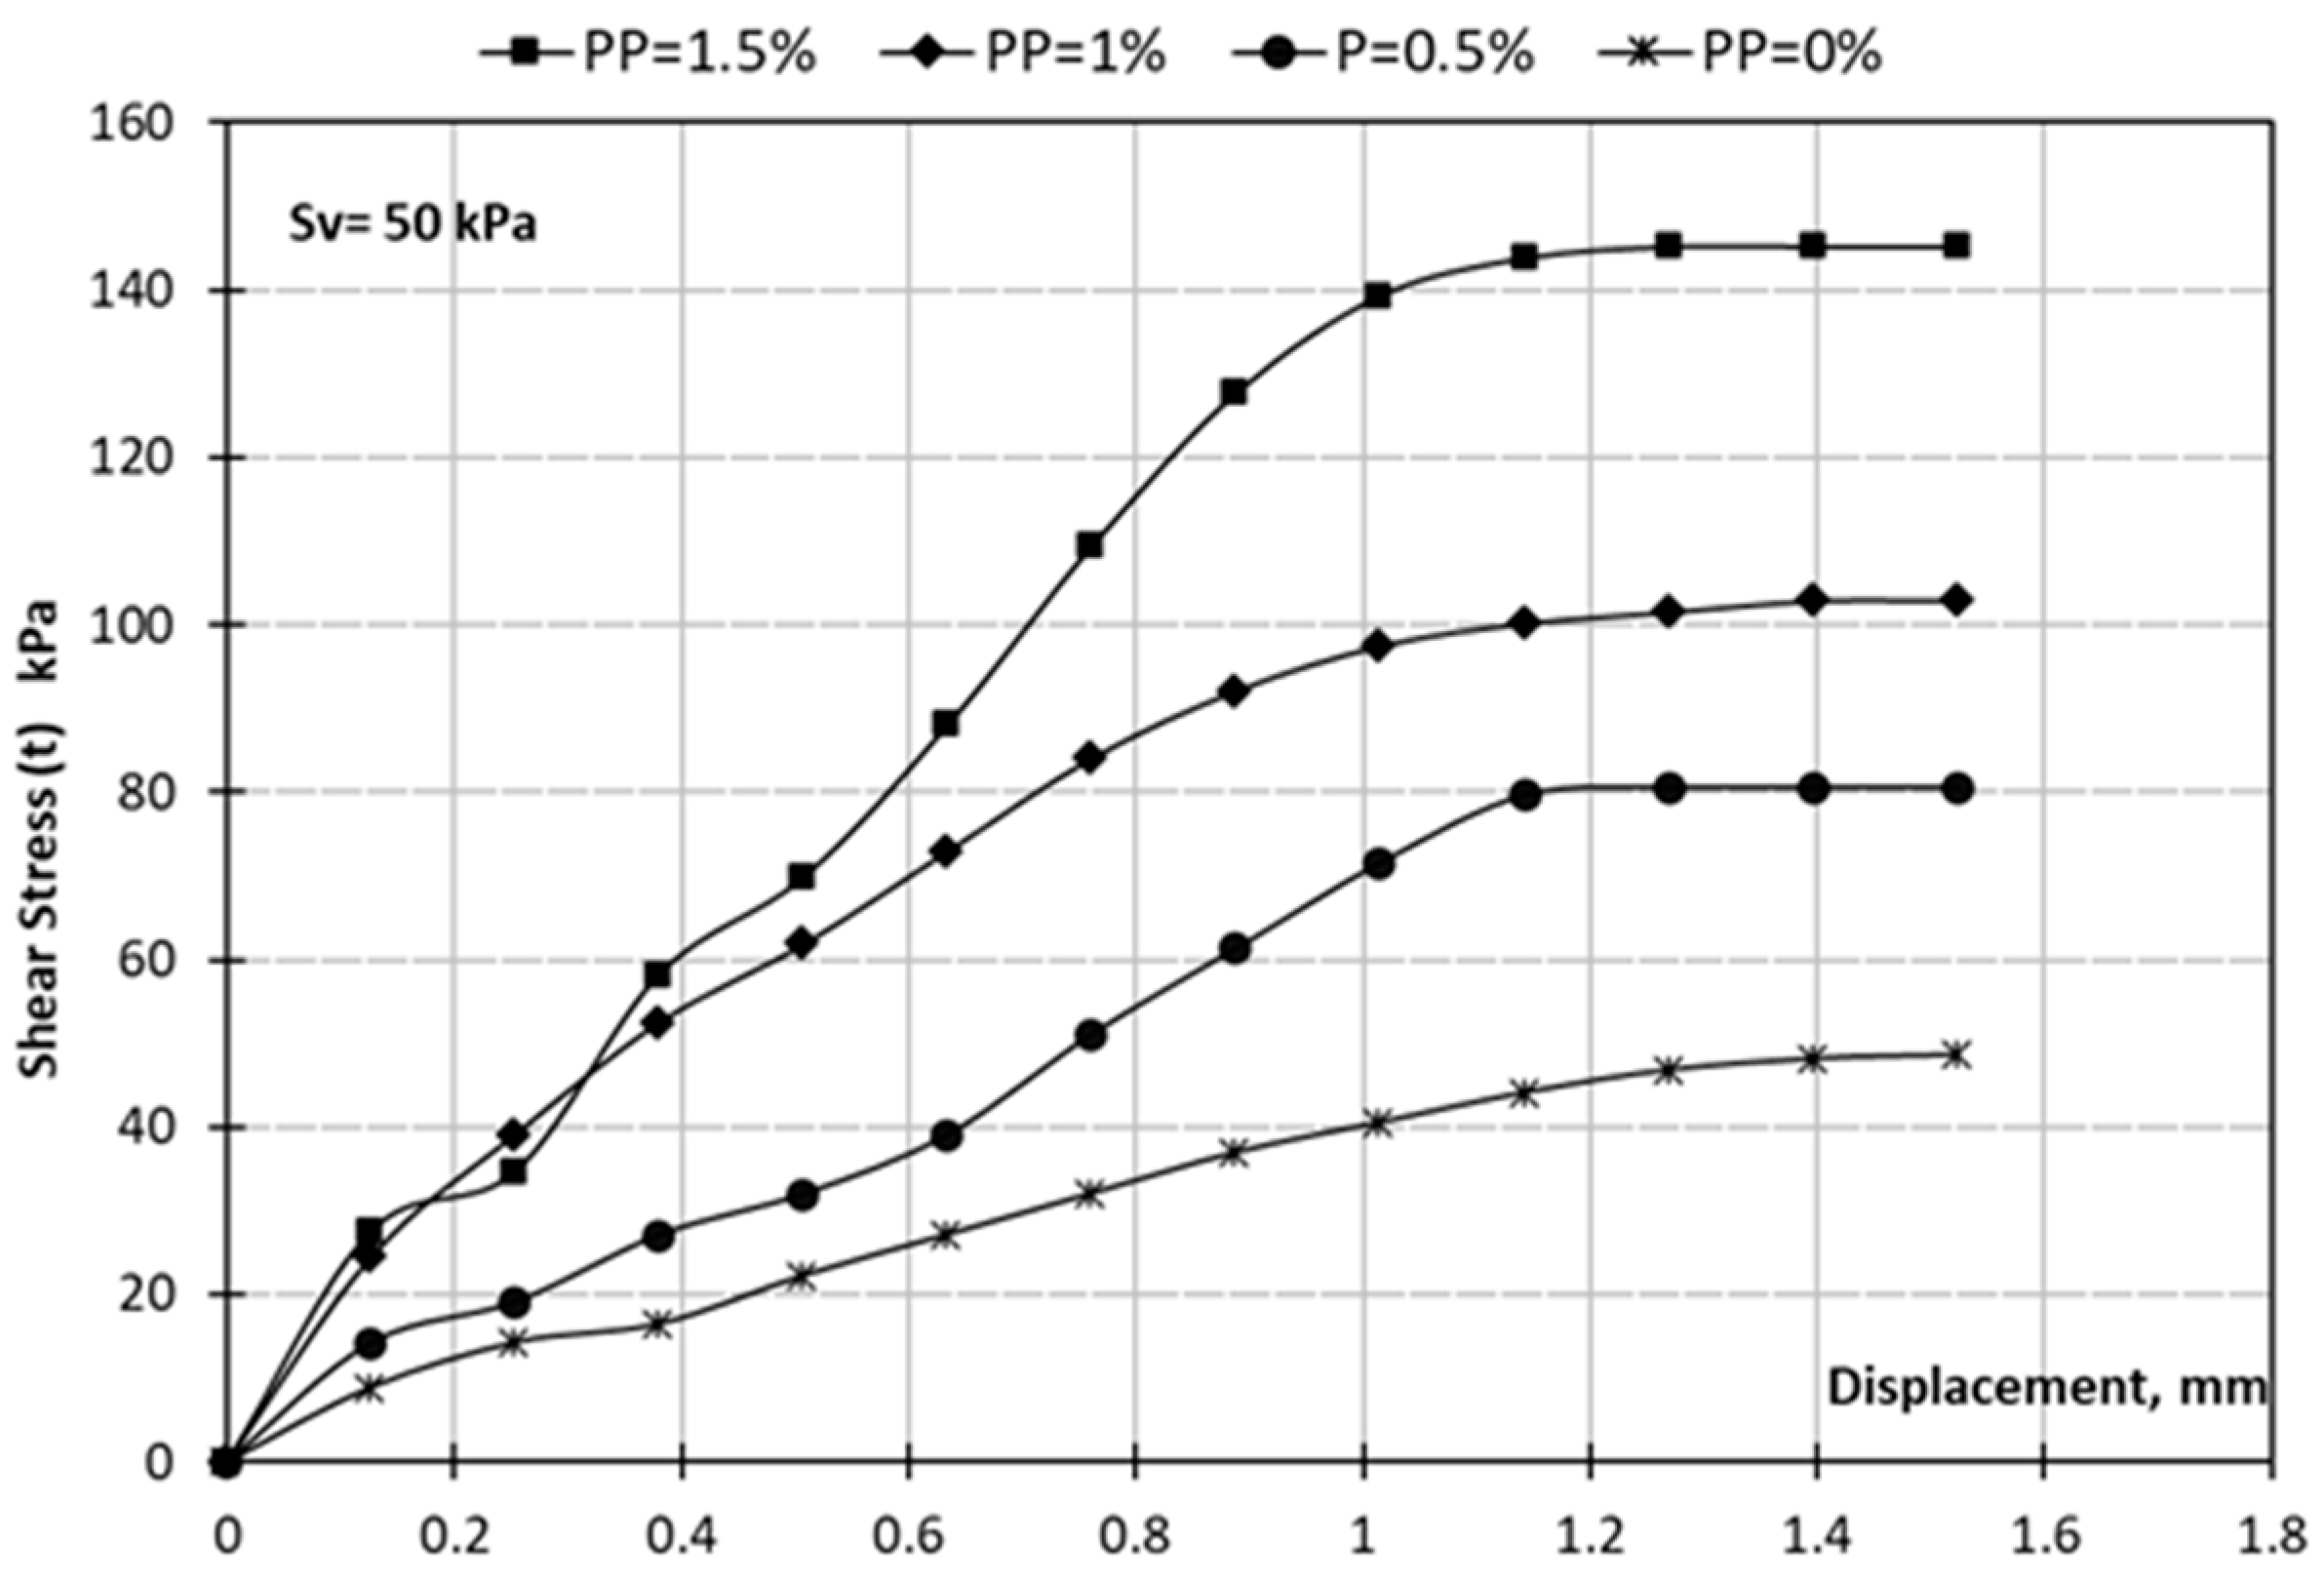
3.2. Shear Strength Tests

The samples were prepared by mixing the calculated dry weight of the soil (which corresponds with MDD) with the calculated water weight (which corresponds with OMC), and with the fiber weight which is equal to the value of the pre-identified ratio multiplied by the dry weight of the soil. Table 3 summarizes the needed quantities (with respect to the direct shear box ring’s properties, with an area of 32 cm2 and a volume of 80 cm3) for dry soil, water, and fiber to prepare six samples for each fiber content. After that, the soil samples were extracted from the Proctor apparatus. Then, the samples were placed in the direct shear box apparatus, and different vertical loads were applied (25; 50; 100; 150 kPa) for each fiber content. Next, the tests were conducted in accordance with ASTM D3080 standards [27]. Figure 3 shows the shear stress values ( τ kPa) with the corresponding horizontal displacement ( Δ L mm) for each reinforcing ratio (fiber content) and vertical load applied. The increase of shear strength by increasing the fiber content can be noticed in Figure 3. Thus, by depicting the experimental results and drawing the Coulomb failure envelope for each fiber content, the values of cohesion and friction angle can be obtained for each reinforcing ratio/fiber content, as summarized in Table 4.

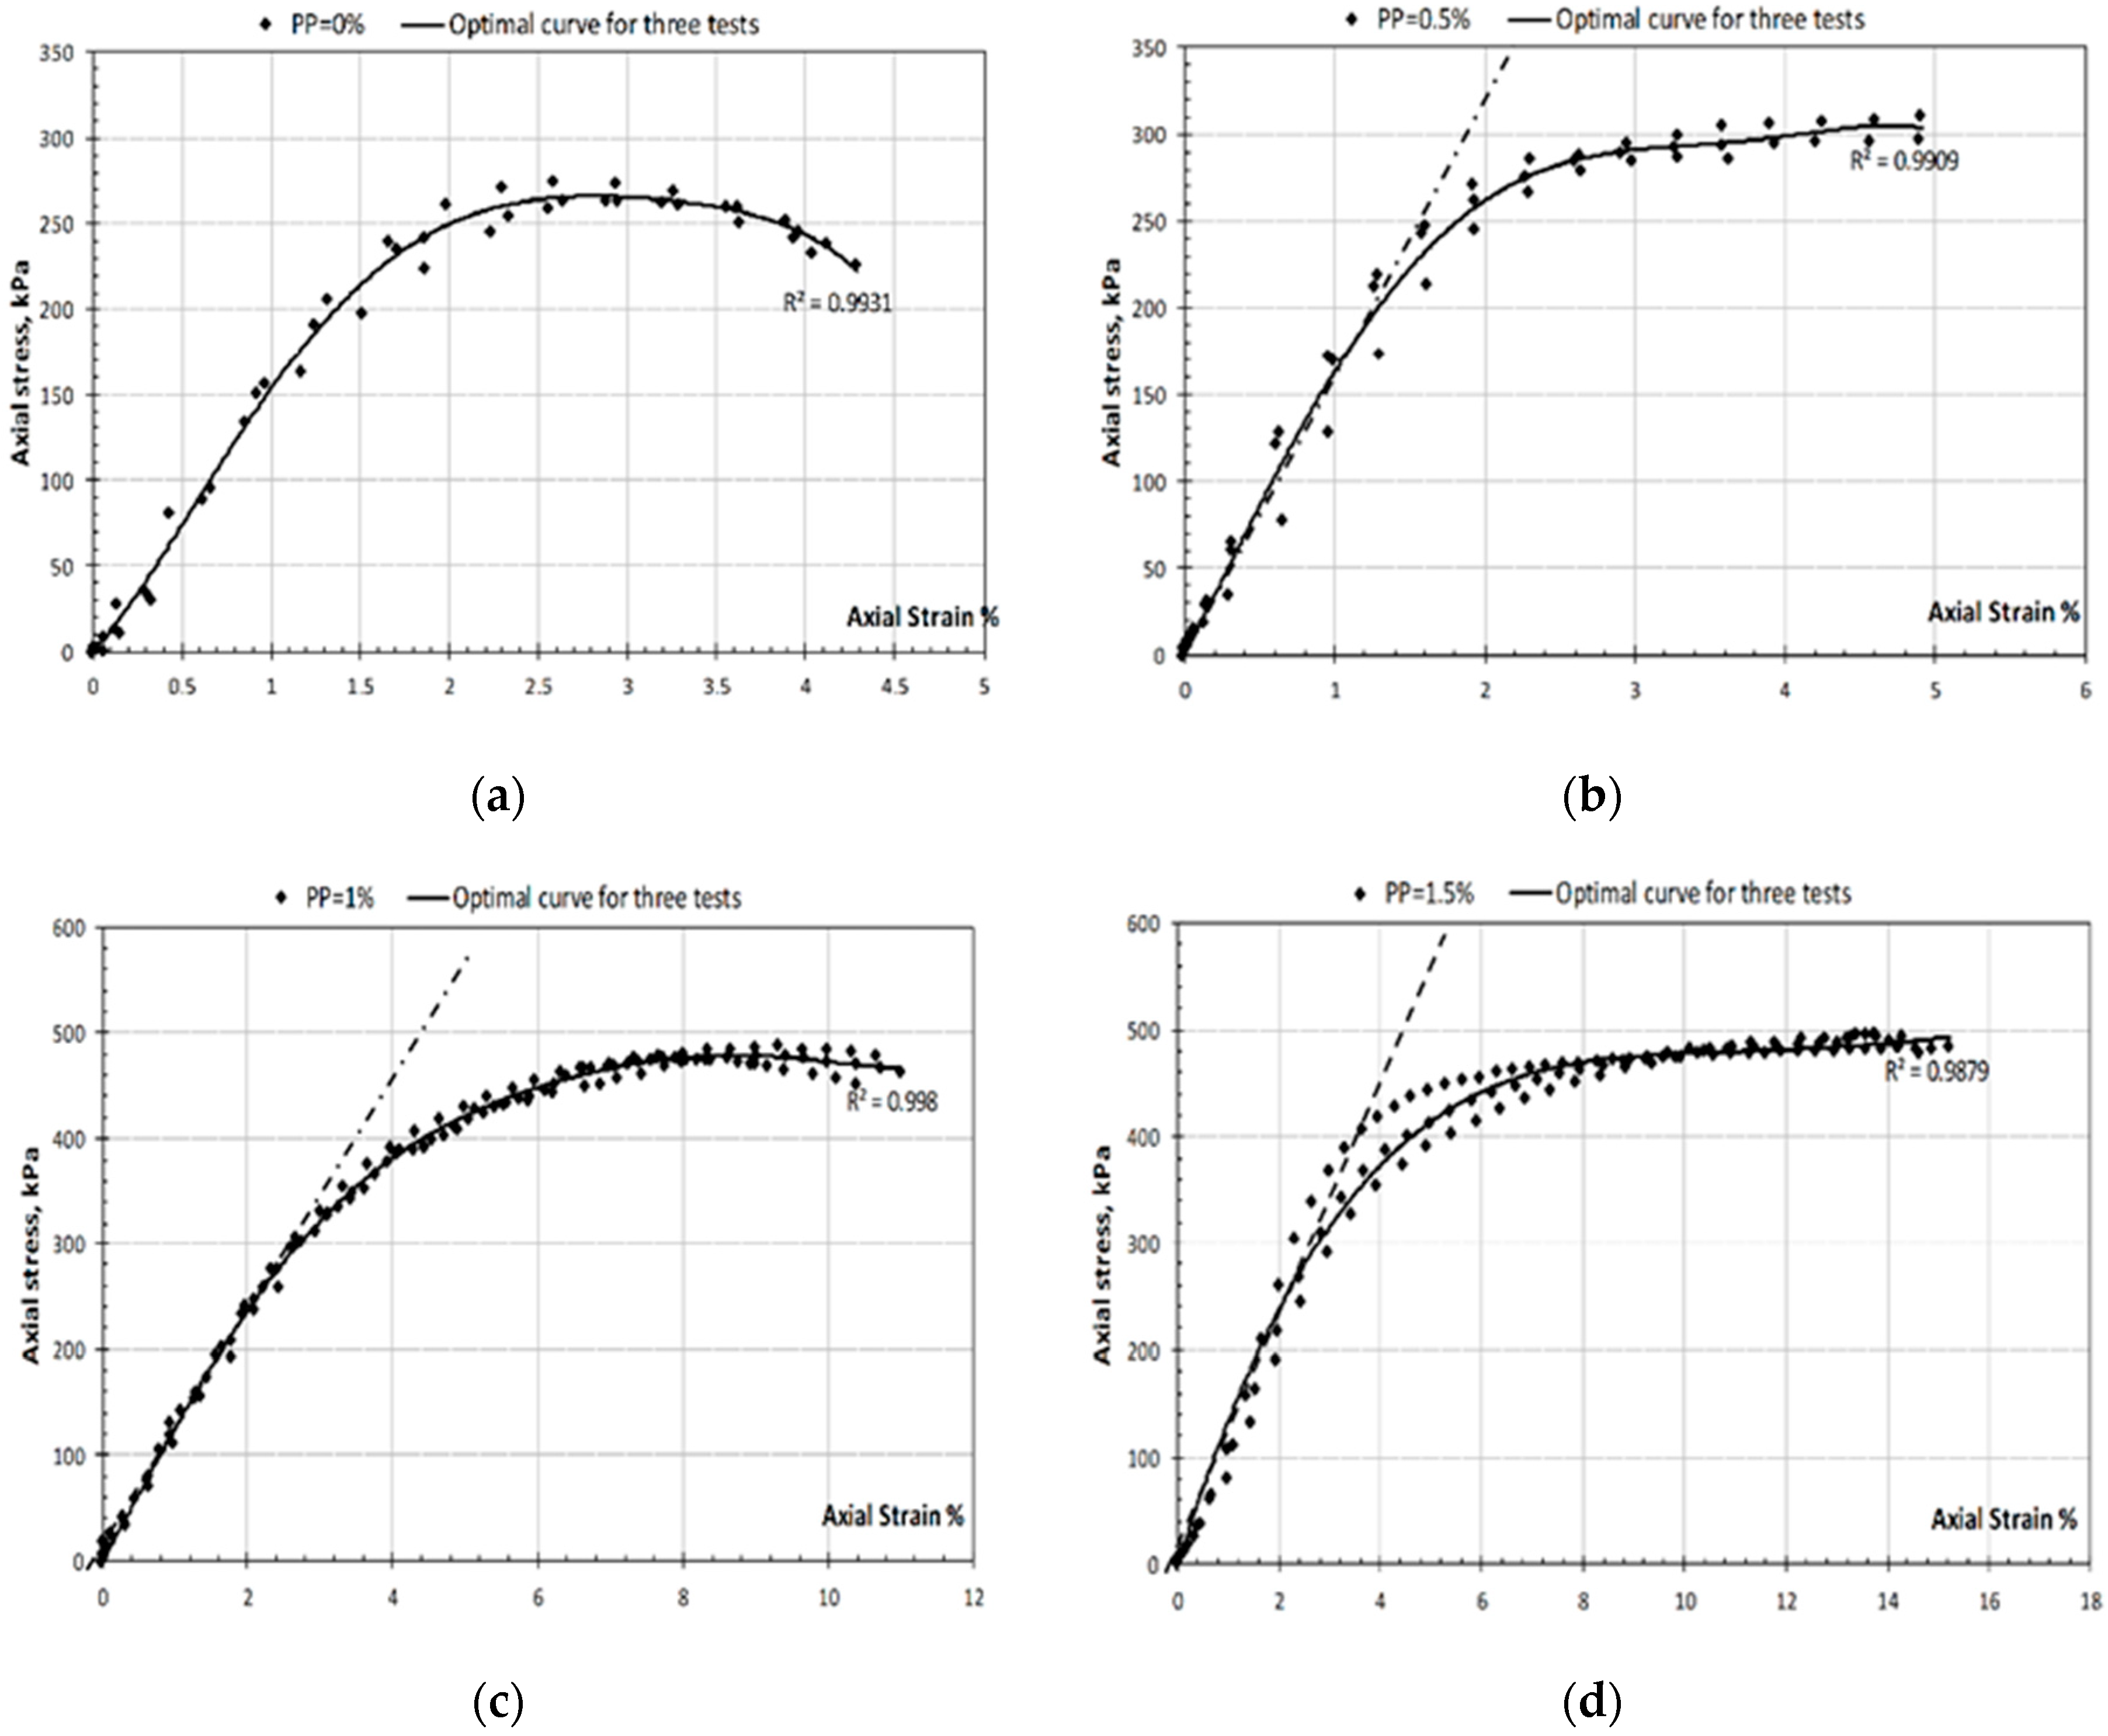
3.3. Unconfined Compressive Strength Tests (UCS)
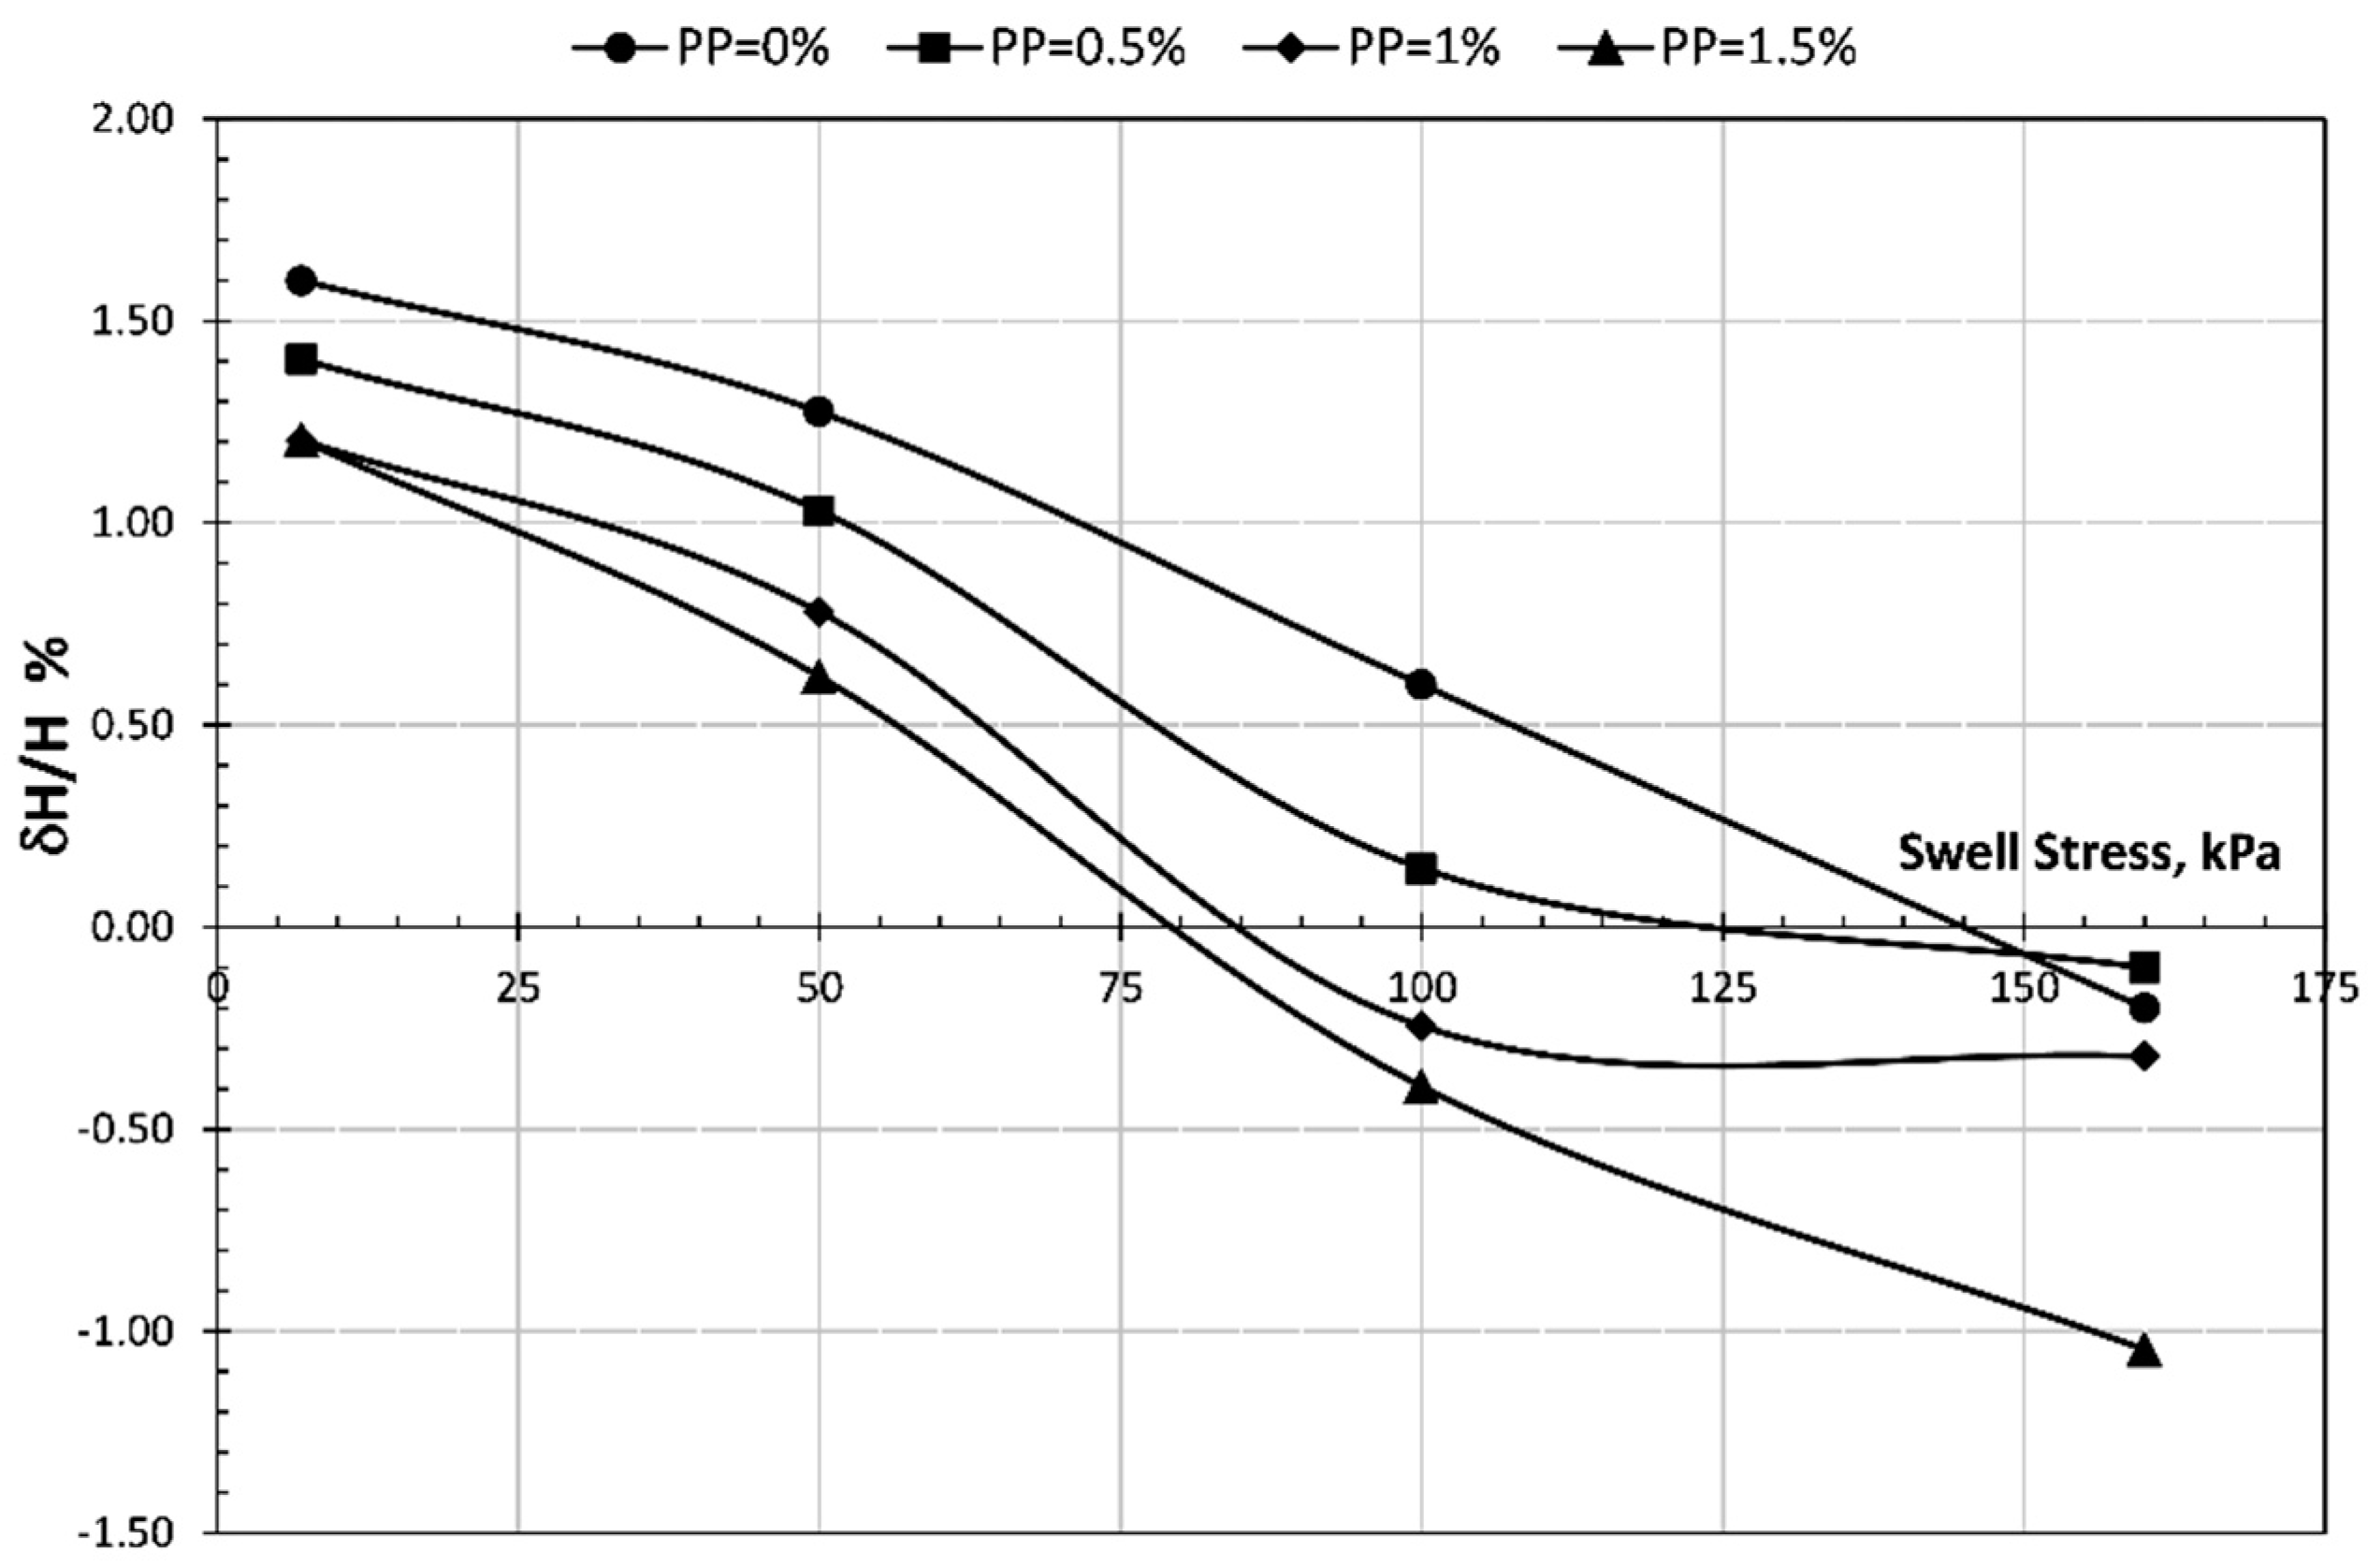
After extracting the soil samples from the proctor apparatus, the samples were placed in the electronic unconfined compressive strength apparatus, and then the tests were conducted in accordance with ASTM D2166 standards [28]. Please note that for each fiber content, three samples were tested to assuring the accuracy of the results. Figure 4 shows the values of the UCS for each fiber content.
By taking the slope (inclination) of the straight part of the curve (stress-strain), the elastic modulus for each reinforcement ratio used (PP = 0%, 0.5%, 1%, 1.5%) can be obtained. Table 5 shows the values of the elasticity modulus of the studied soil, as well as the values of the unconfined compressive strength at the collapse situation for each value of the fiber content.

3.4. Swelling Tests

The soil samples were extracted from the proctor apparatus. After that, the samples were placed in the odometer and loaded with a small vertical load of 7 kPa to achieve the leveling of the sample’s surface. Then, the samples were submerged, and swelling reads were measured and recorded (as per ASTM D4546 standards [29]). The free-swelling test was performed on three samples for each reinforcing ratio. Figure 5 shows the results of the free-swelling tests that represent the average of three sample results for each fiber content.
At the end of the free-swelling test (after getting the maximum free swelling values for all tested samples), and in order to determine the value of the swelling stress for each sample, gradual vertical loads (50, 100, 160 kPa) were applied on the samples, and then the total settlement value after 24 h of loading was read. By representing the remaining amount of swelling, during the loading process, the swelling stress could be identified (i.e., at zero swelling value). Table 6 shows the maximum swell stress for each reinforcing ratio (fiber content (PP)) and for each applied load.
The negative values in the table mean that the settlement at the corresponding load is greater than the final swelling value of each loading case. Therefore, the results of this table are represented to calculate the values of the swelling stress for each case of reinforcing ratio. Figure 6 shows the intersection of the curves with the stress axis, which represents the values of the swelling stress of the studied soil for each fiber content. From the figure below, the values of the swelling stress can be found for each reinforcing ratio that produces zero swelling values, which are summarized in Table 7.

4. Results and Discussion

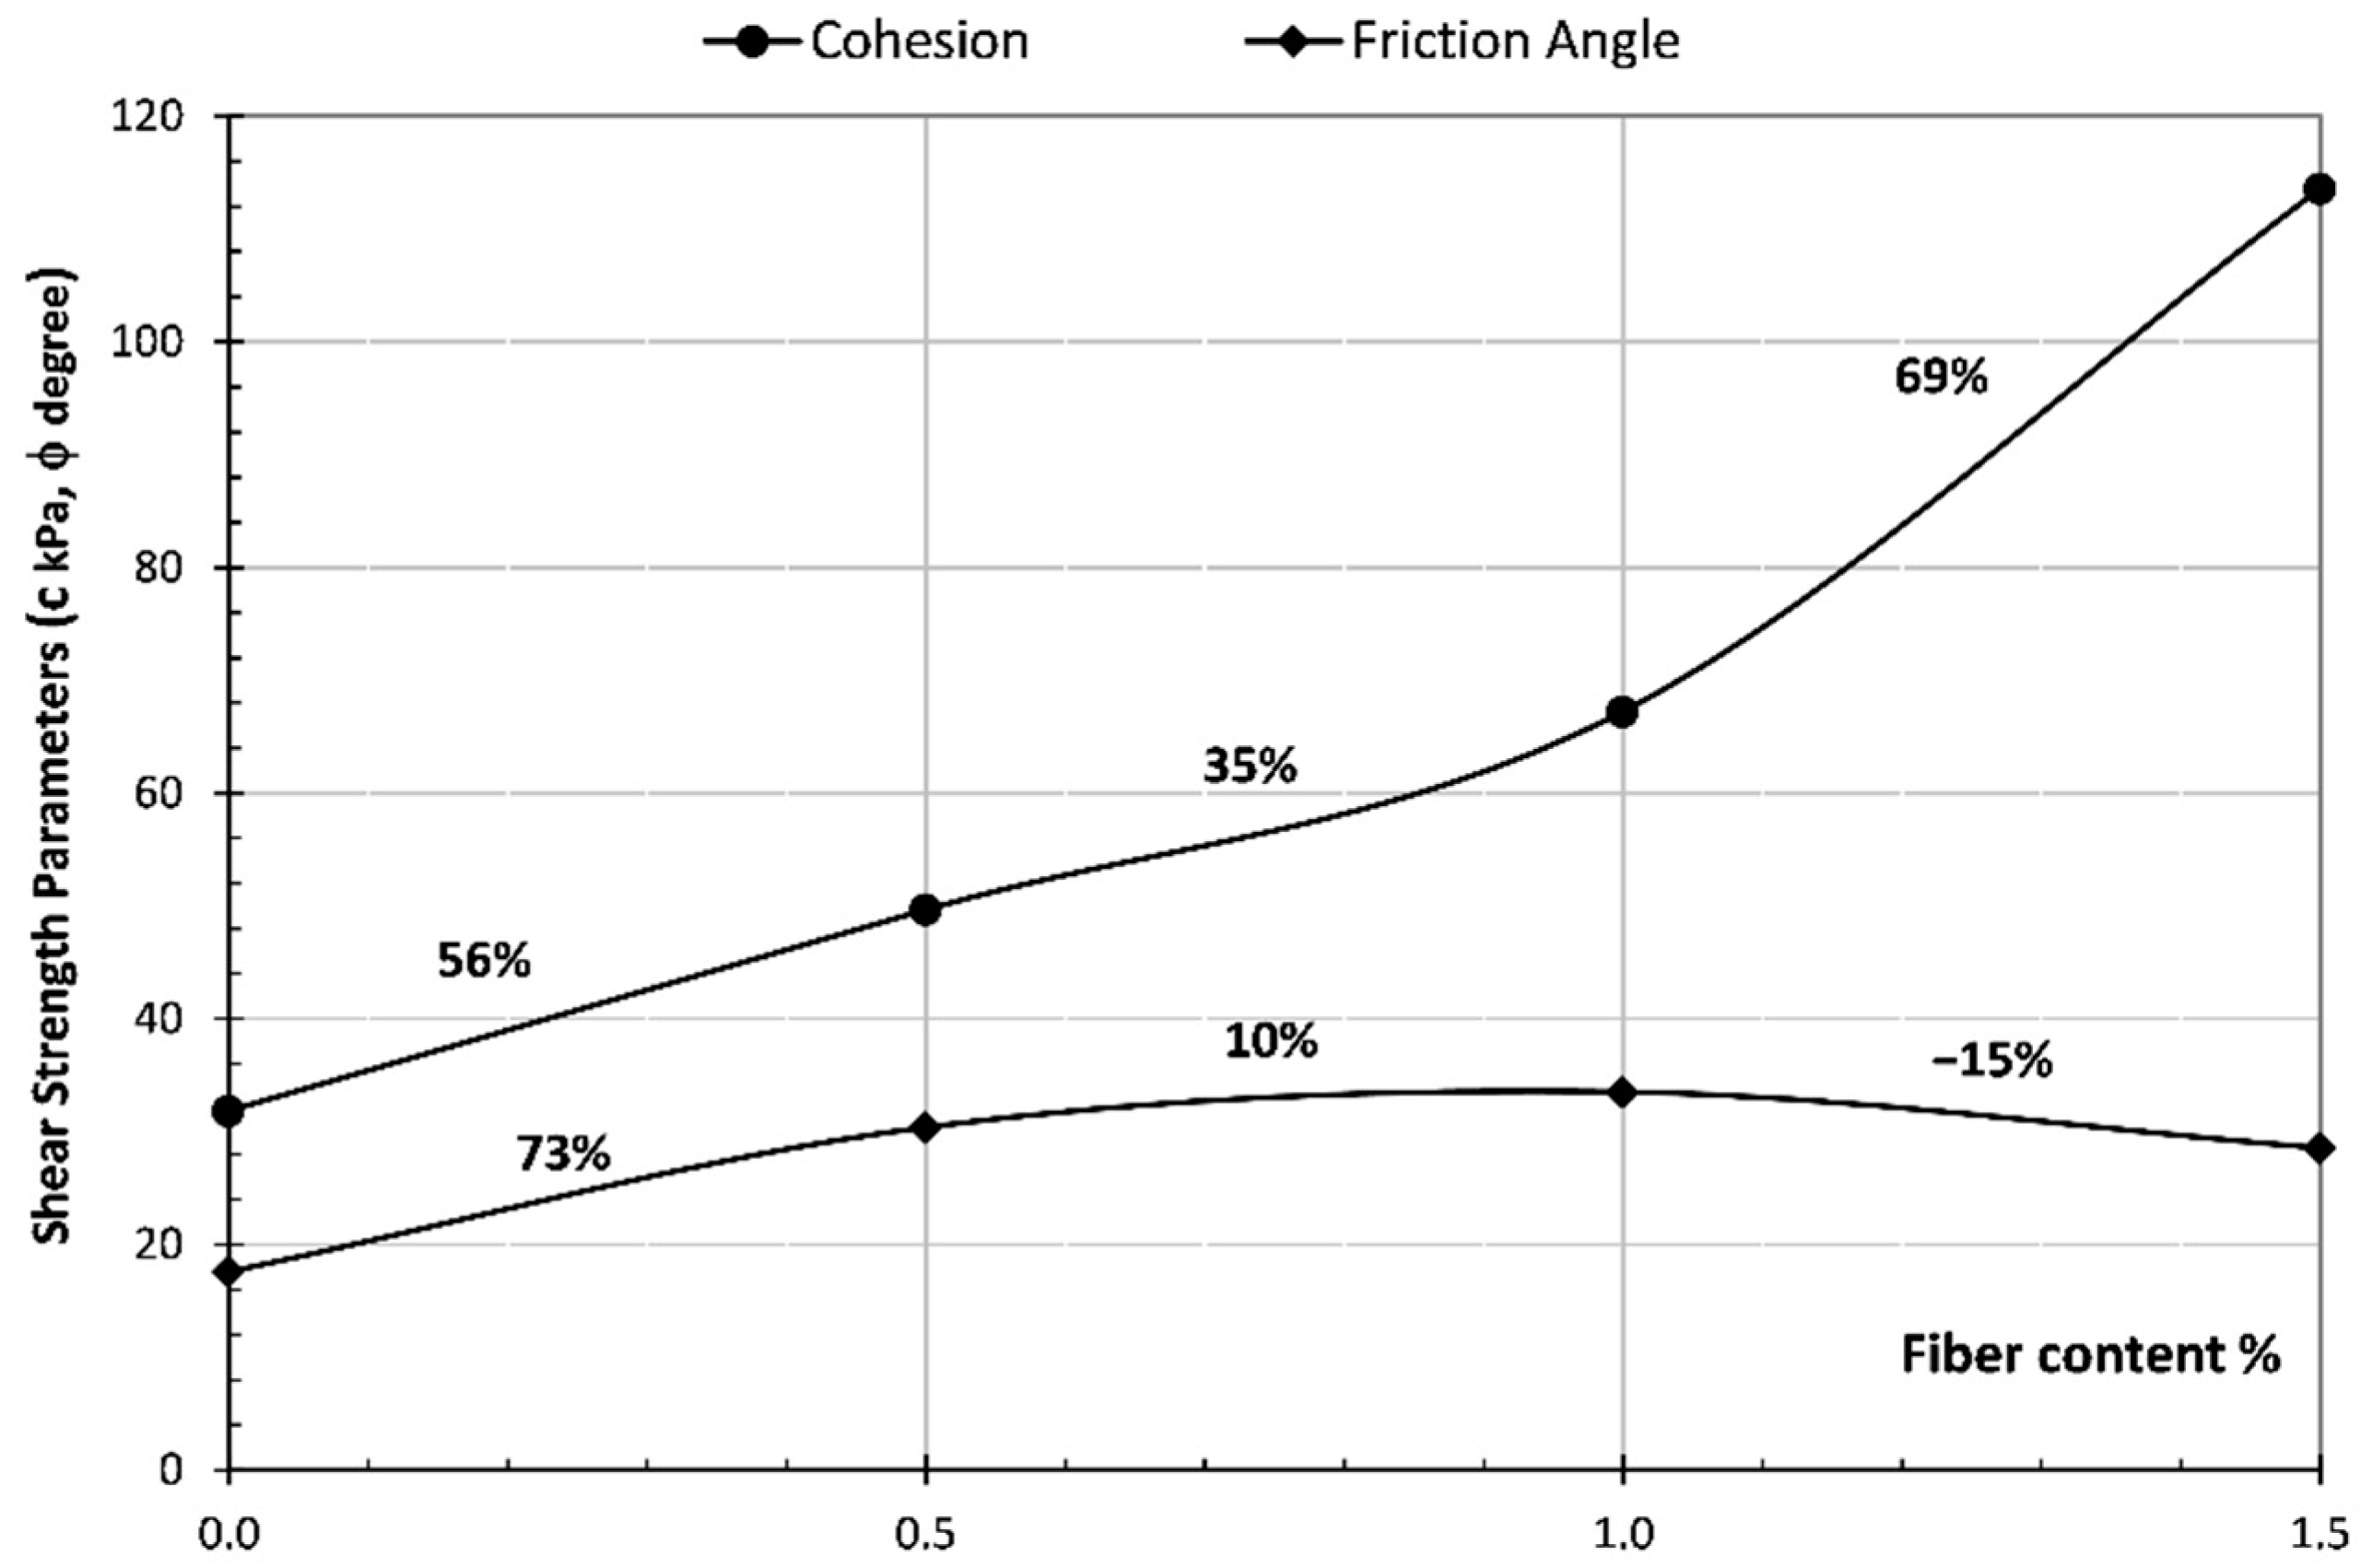
4.1. Effects of Fiber Content on the Shear Strength

To investigate the effect of polypropylene fiber content on the shear strength, a representation of shear stress–displacement under one of the vertically applied loads (for all fiber contents used) is shown in Figure 7. It can be easily noticed that the gradient of the stress–displacement curves increased with the increase in fiber content, and this means that increasing the fiber content leads to an increase in the soil stiffness, which can be mainly attributed to the bonding effect that increases the cohesion between the soil particles through the fibers, which play the role of creating an additional link or additional cohesion among the particles. The relationship between the shear strength and the resulting horizontal strain for all reinforcing ratios can be represented in Figure 8, which shows the values of shear stresses at the collapse situation (i.e., at the maximum shear stress values) and the corresponding applied load for each fiber content (PP). It can be easily noticed that shear strength is increased with the increase of fiber content and the average increase is 184% at 1.5% of fiber, regardless of the vertical applied load value.
Referring to Figure 3 and Figure 8, and by representing the relationship between both cohesion and friction angle with the fiber content as illustrated in Figure 9, a gradual increase in the cohesion with the increase of the fiber content can be noticed. In addition, there was an increase in the angle of friction for each value of the reinforcing ratio, while the increasing rate decreases with the increase of the fiber content (for a reinforcing ratio bigger than 0.5%). Nevertheless, the friction angle is still greater than the unreinforced situation. These results are consistent with the results of some of the previous studies that were conducted by other researchers for the same soil classification with minor differences (Mirzababaei et al. [30]; Mali and Singh [31]; Maheshwari et al. [32]), where their results confirmed the increase of shear properties by increasing the fiber content. Regarding Anagnostopoulos et al. [33], the reduction of the friction angle for a fiber content greater than 1% was observed. However, the friction angle for this situation was still greater than its initial value (unreinforced situation), and this was consistent with the experimental results. In addition an increase in the plasticity behavior of the reinforced samples in comparison with the unreinforced ones was observed, where it was noticed that the collapsing of reinforced samples took more time than the unreinforced ones, which means that the sample with fiber showed more ductile behavior.
Equations were developed to calculate both the cohesion and friction angles for any value of the reinforcing ratio under the assumption that the maximum ratio should not exceed 1.5% (Equations (1) and (2)). These equations give the values of the shear parameters for each fiber content that should not exceed 1.5%.
C f ( k P a ) = 38.69 × f 3 58.52 × f 2 + 55.22 × f + C f 0
ϕ f ( deg r e e ) = 2.133 × f 3 22.6 × f 2 + 36.4 × f + ϕ f 0
where f is the fiber content, and therefore f 0 represents the unreinforced situation.

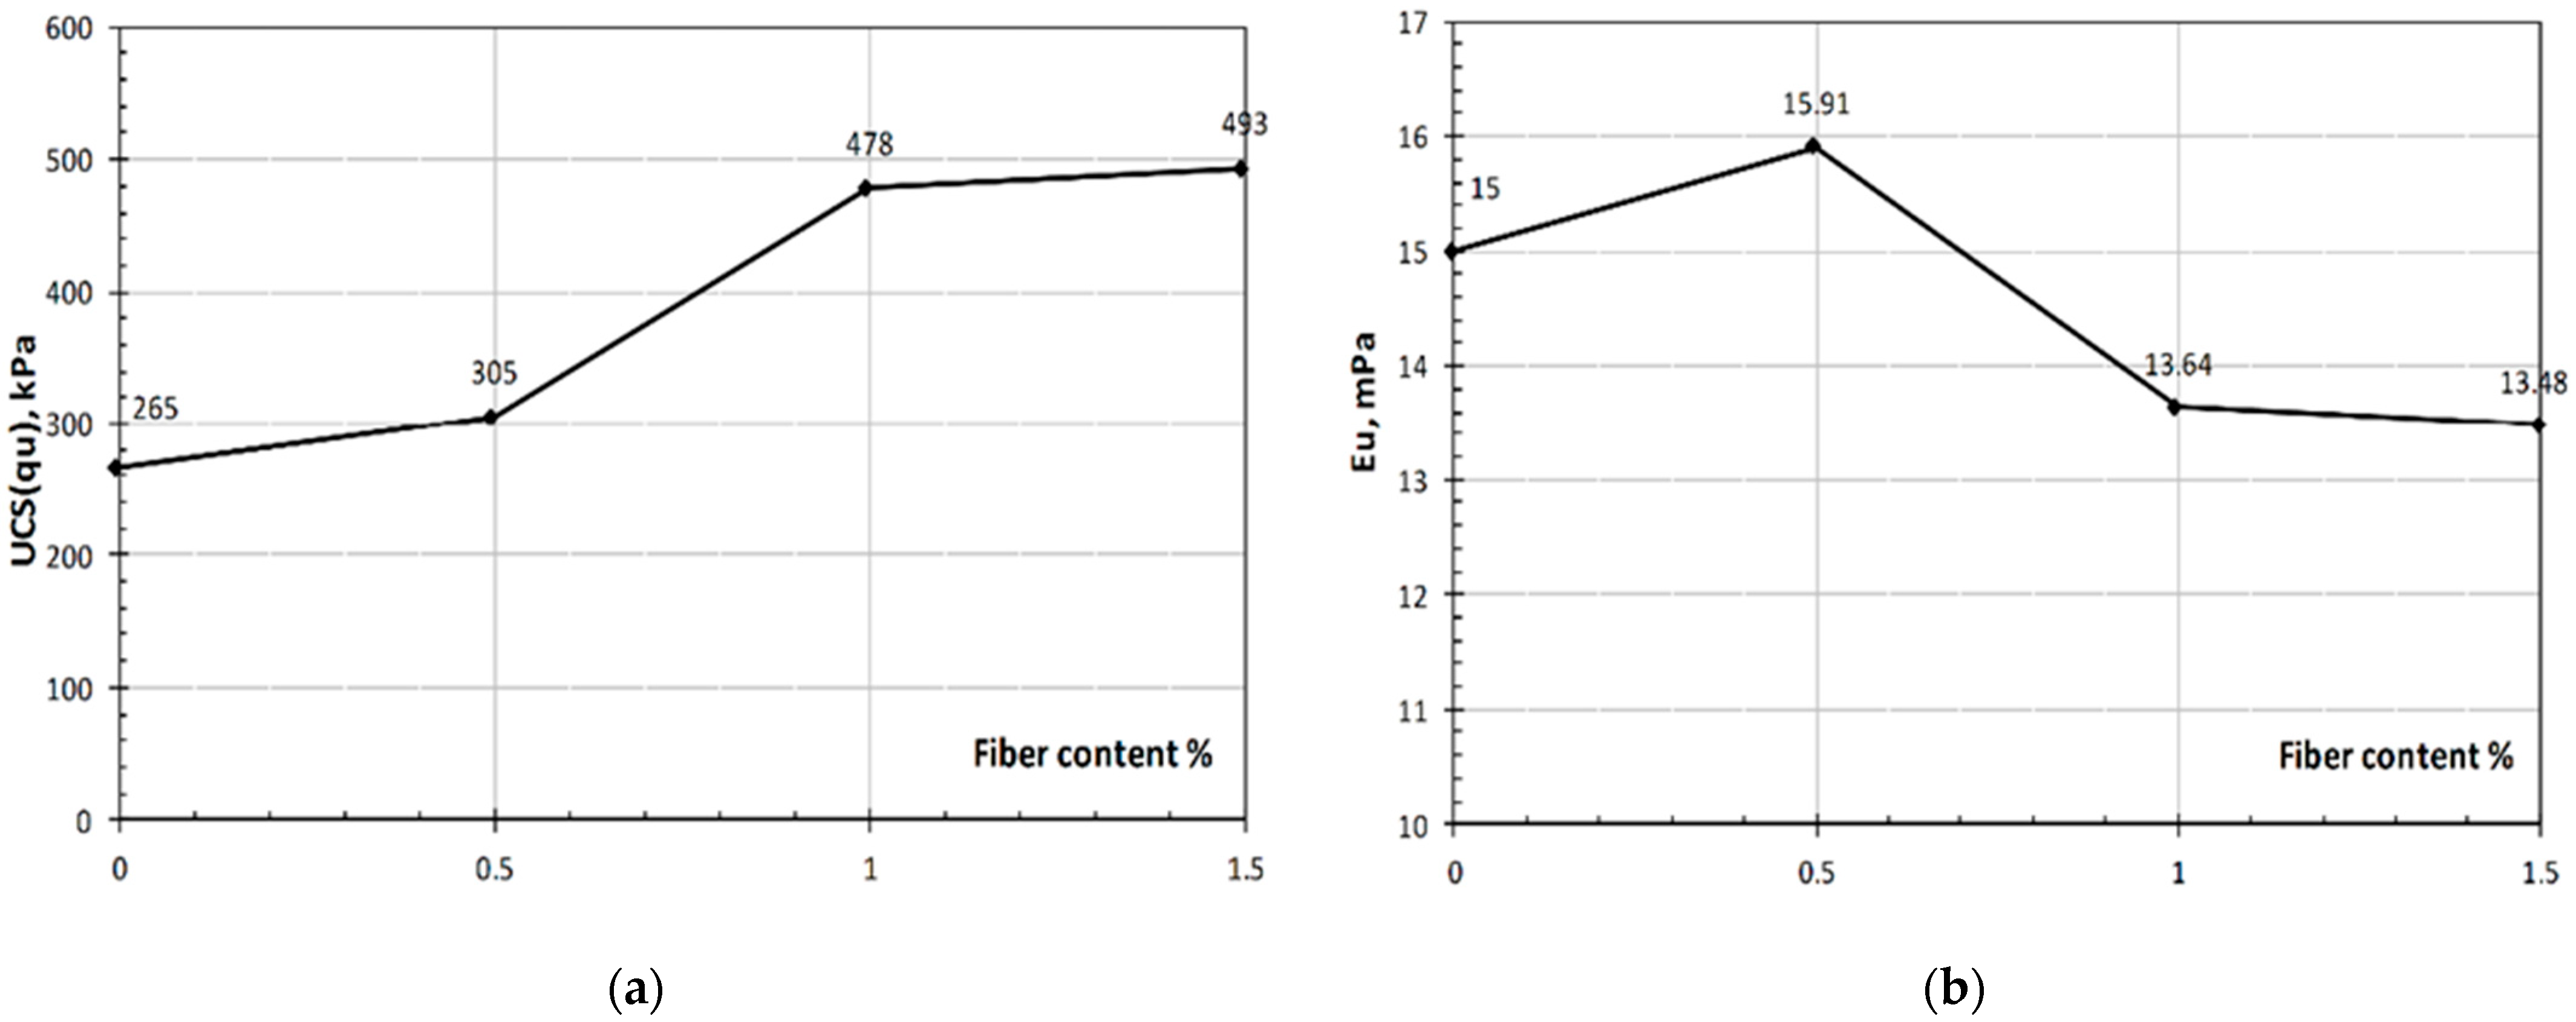
4.2. Effects of Fiber Content on Unconfined Compressive Strength and Elasticity Modulus

Based on the aforementioned tests’ outputs, and by representing the values of the unconfined compressive strength and elasticity modulus for all fiber contents used (as it is shown in Figure 10), the increase in the unconfined compressive strength by adding 0.5% and 1% of the fiber, respectively, was noticed, and after that, the rate of the increase was reduced by adding 1.5% of the fiber. In other words, the unconfined compressive strength increased more than 50% when the fiber content increased from 0.5% to 1%. Furthermore, there was an increase in the elasticity modulus by adding 0.5% of fiber, and then the elasticity modulus was decreased for the fiber content of 1% and 1.5%. However, the final value of the elasticity modulus was smaller than its initial value (unreinforced situation) for the fiber content of 1% and 1.5%. This could be attributed due to the fibers’ effect that plays a role in developing an additional bonding between the particles when the reinforcing ratio was less than 1%, whereas the bonding effect of the fiber has been decreased after adding more fibers (PP = bigger than 1%), and at this stage, the additional fibers have not had the same bonding effect between the soil particles. This may be due to the behavioral change of the soil samples when adding additional fiber, as when the fiber content increases, the fibers agglomerate in the soil, resulting in loose contact between soil particles and fibers. Consequently, a distinct difference in the stiffness of fiber–soil mixture resulted. Similar behavior was reported by Maheshwari et al. [32]; Yang et al. [34]; and Sharma and Kaushik [35].
From the experimental observations, in addition to the effect of fiber content on the failure shape, the required time for reaching the failure stage was increased by increasing the fiber content for each sample. Figure 11 shows the failure shapes for samples with fiber content (0%, 0.5%, 1%, and 1.5%) from left to right, respectively. The failure shape for the unreinforced sample resulted from a straight failure surface (straight fracture plane) spread across the height of the sample. On the other hand, for the reinforced samples (1% and 1.5%), the middle and lower parts of the specimens gradually extruded, and the specimen experienced a drum-shaped plastic failure. For reinforced samples with fiber content equaling 0.5%, there was no specific failure shape (obvious fracture plane), and it could be considered as a moderate situation (regarding its failure behavior) between the aforementioned failure behaviors.
By comparing the obtained results with other studies that have been conducted on the soil reinforced with fibers, it can be noticed that the results which were presented in (Maheshwari et al. [32]; Aykut et al. [36]; Sabat [37]) were compatible with the obtained results, even though the used fibers and/or the studied soil (low plasticity clay) in their studies were different.
Upon the experiments’ results, a fiber content-based function was developed to calculate the unconfined compressive strength at any value of the reinforcing ratio under the assumption that the maximum ratio should not exceed 1.5% (Equation (3)). The equation provides the values of the UCS for each fiber content that should not exceed 1.5%.
U C S f = q u f ( k P a ) = 383 × f 3 + 484 × f 2 + 247 × f + q u f 0
where f is the fiber content, and therefore f 0 represents the unreinforced situation.

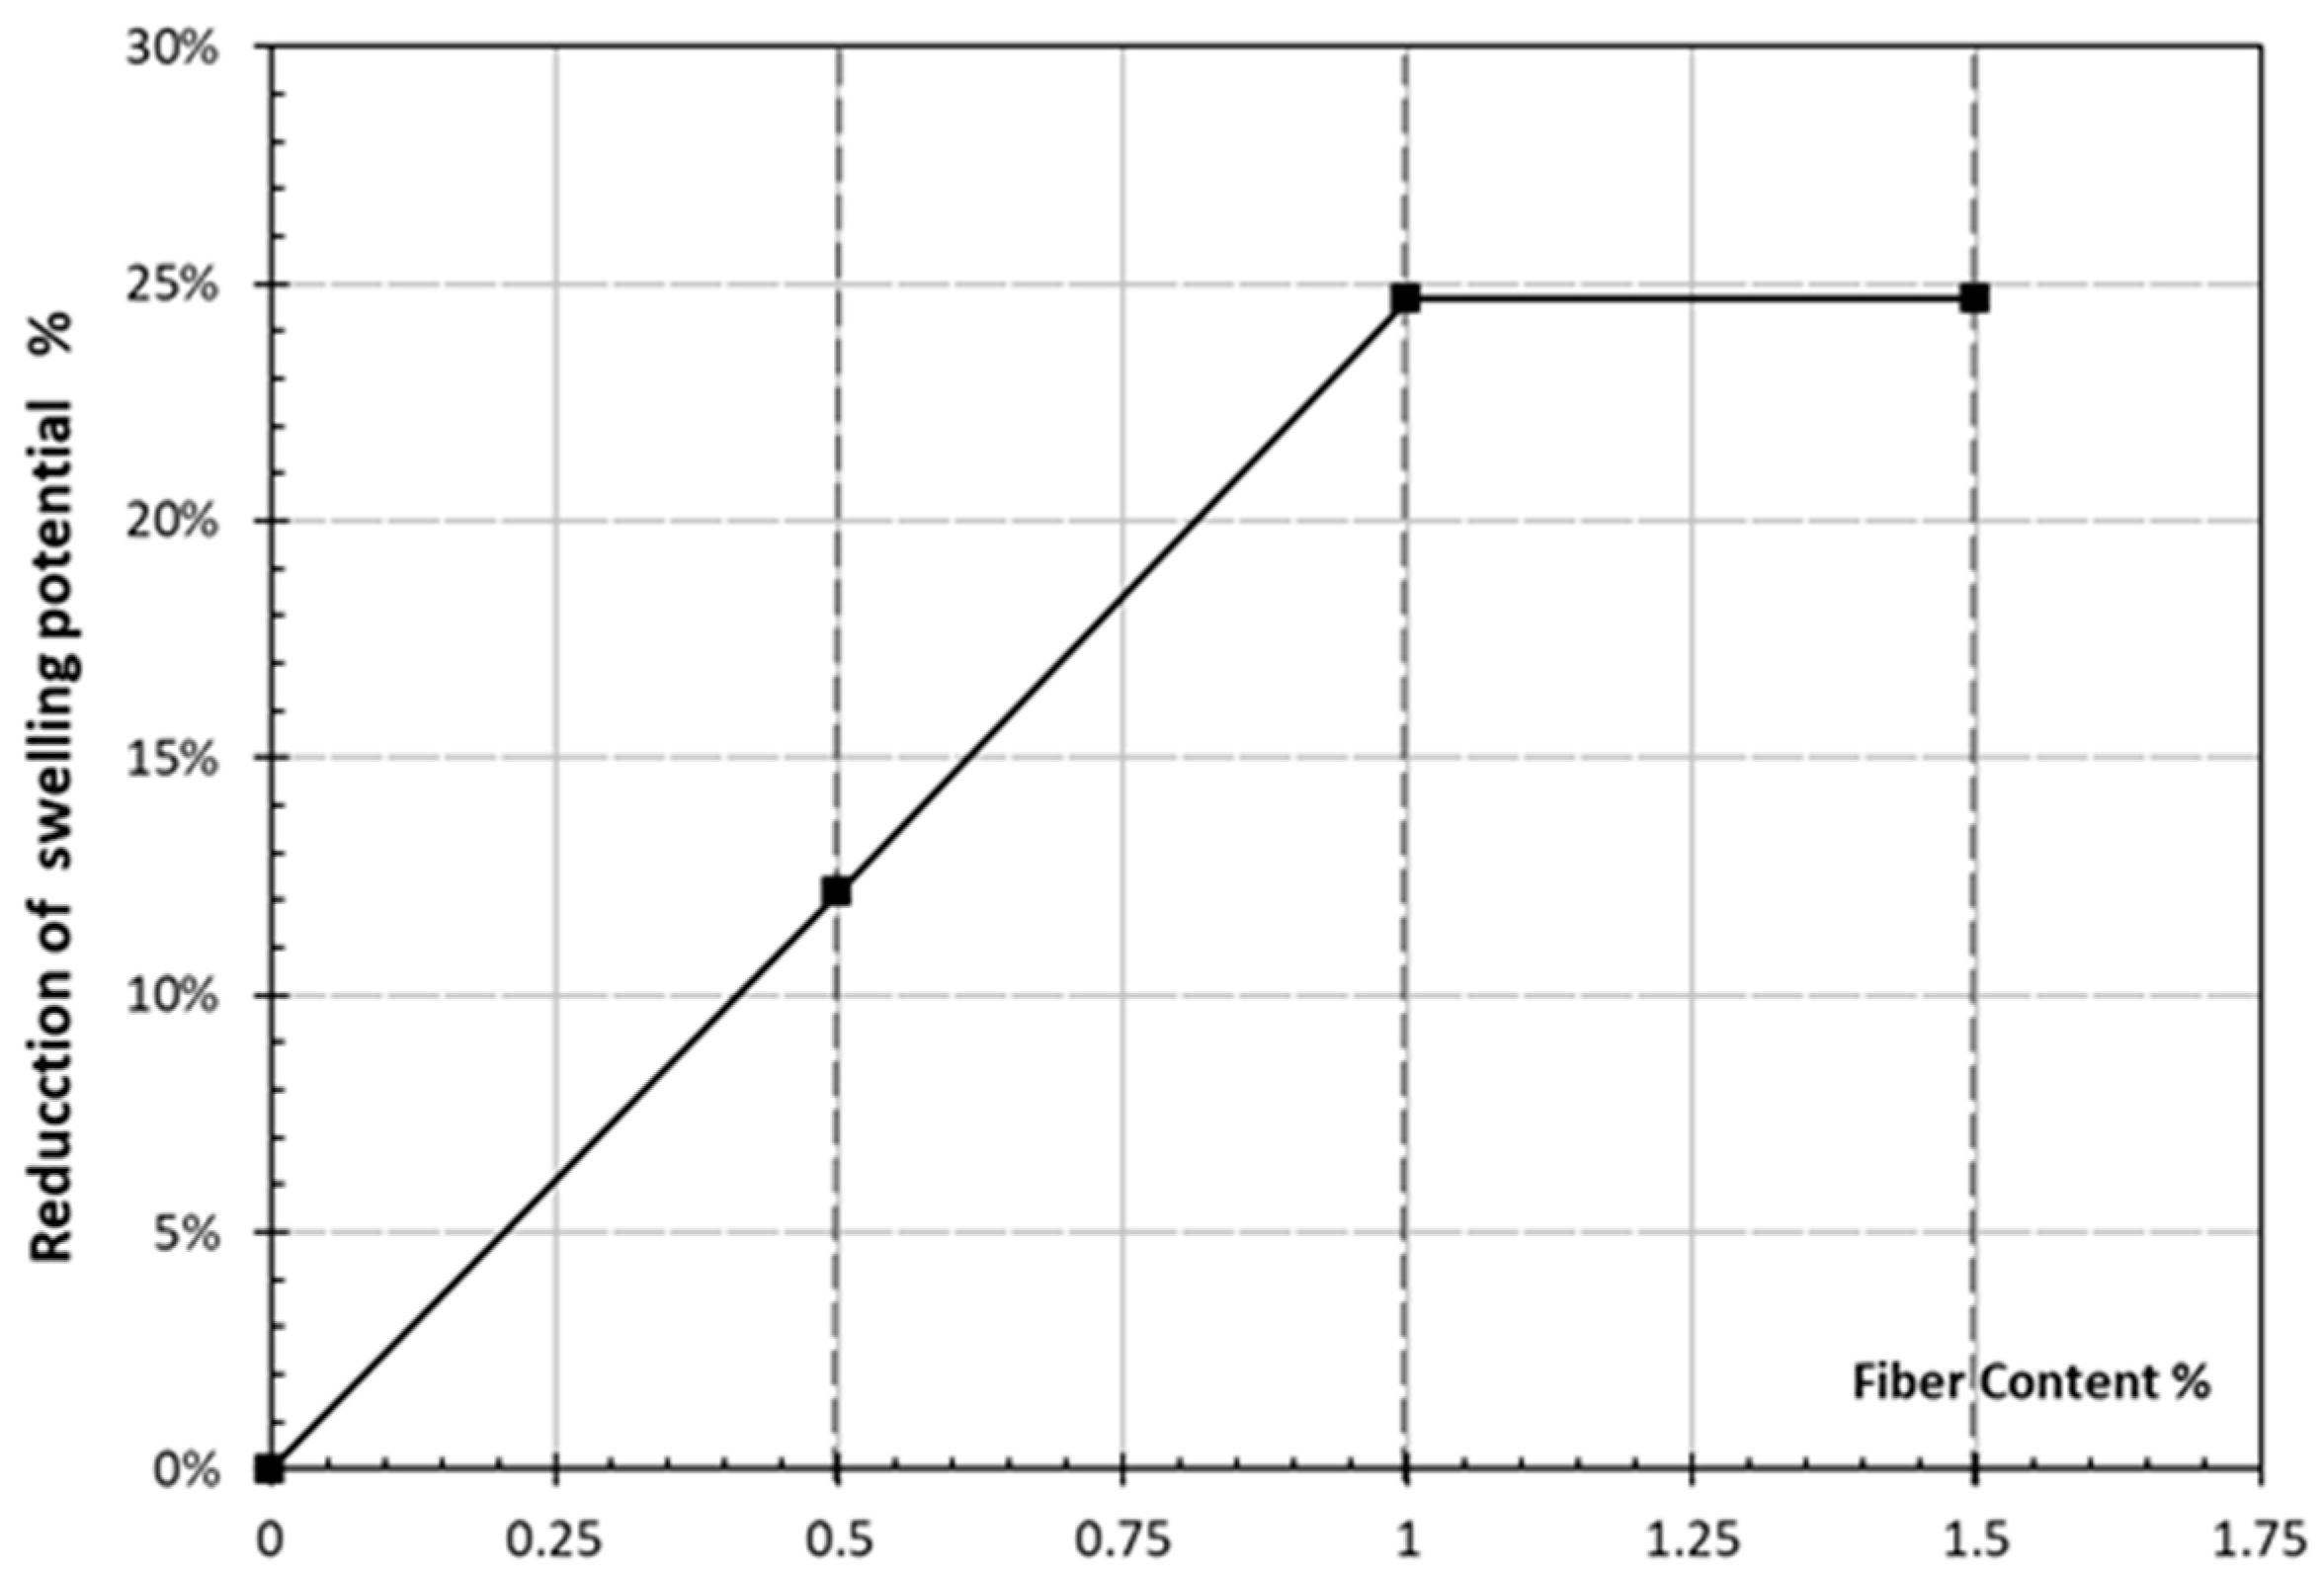
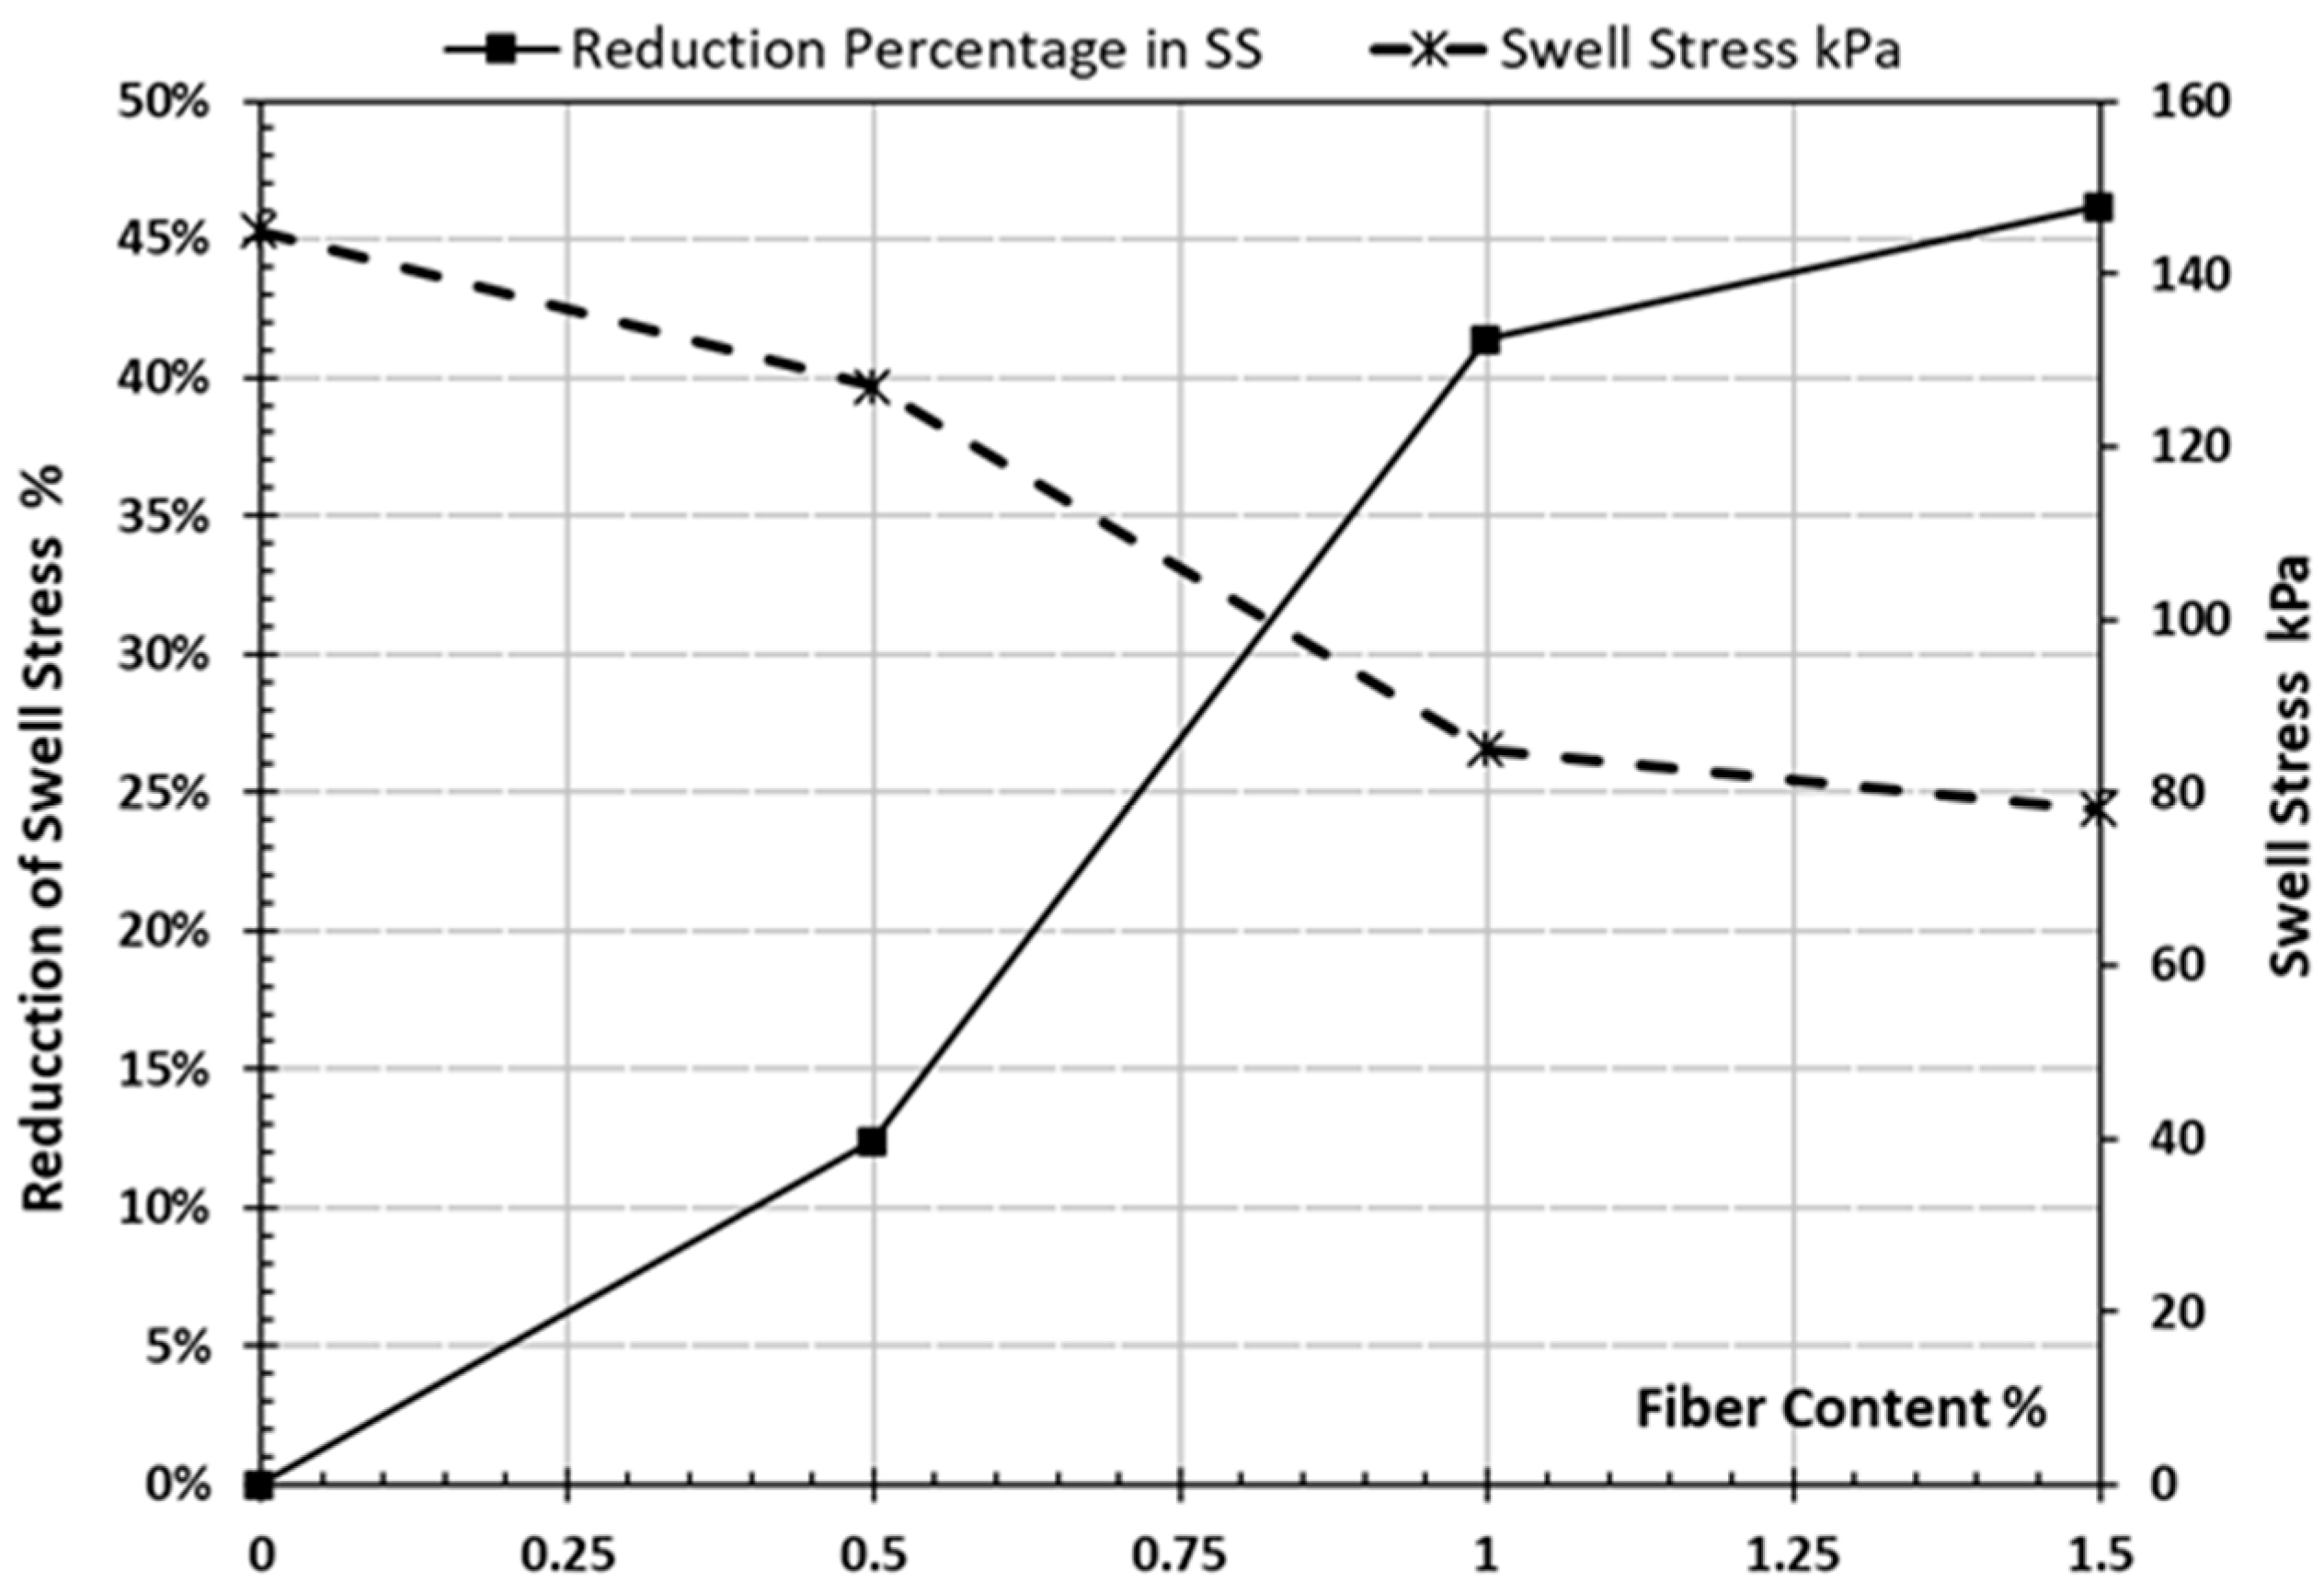
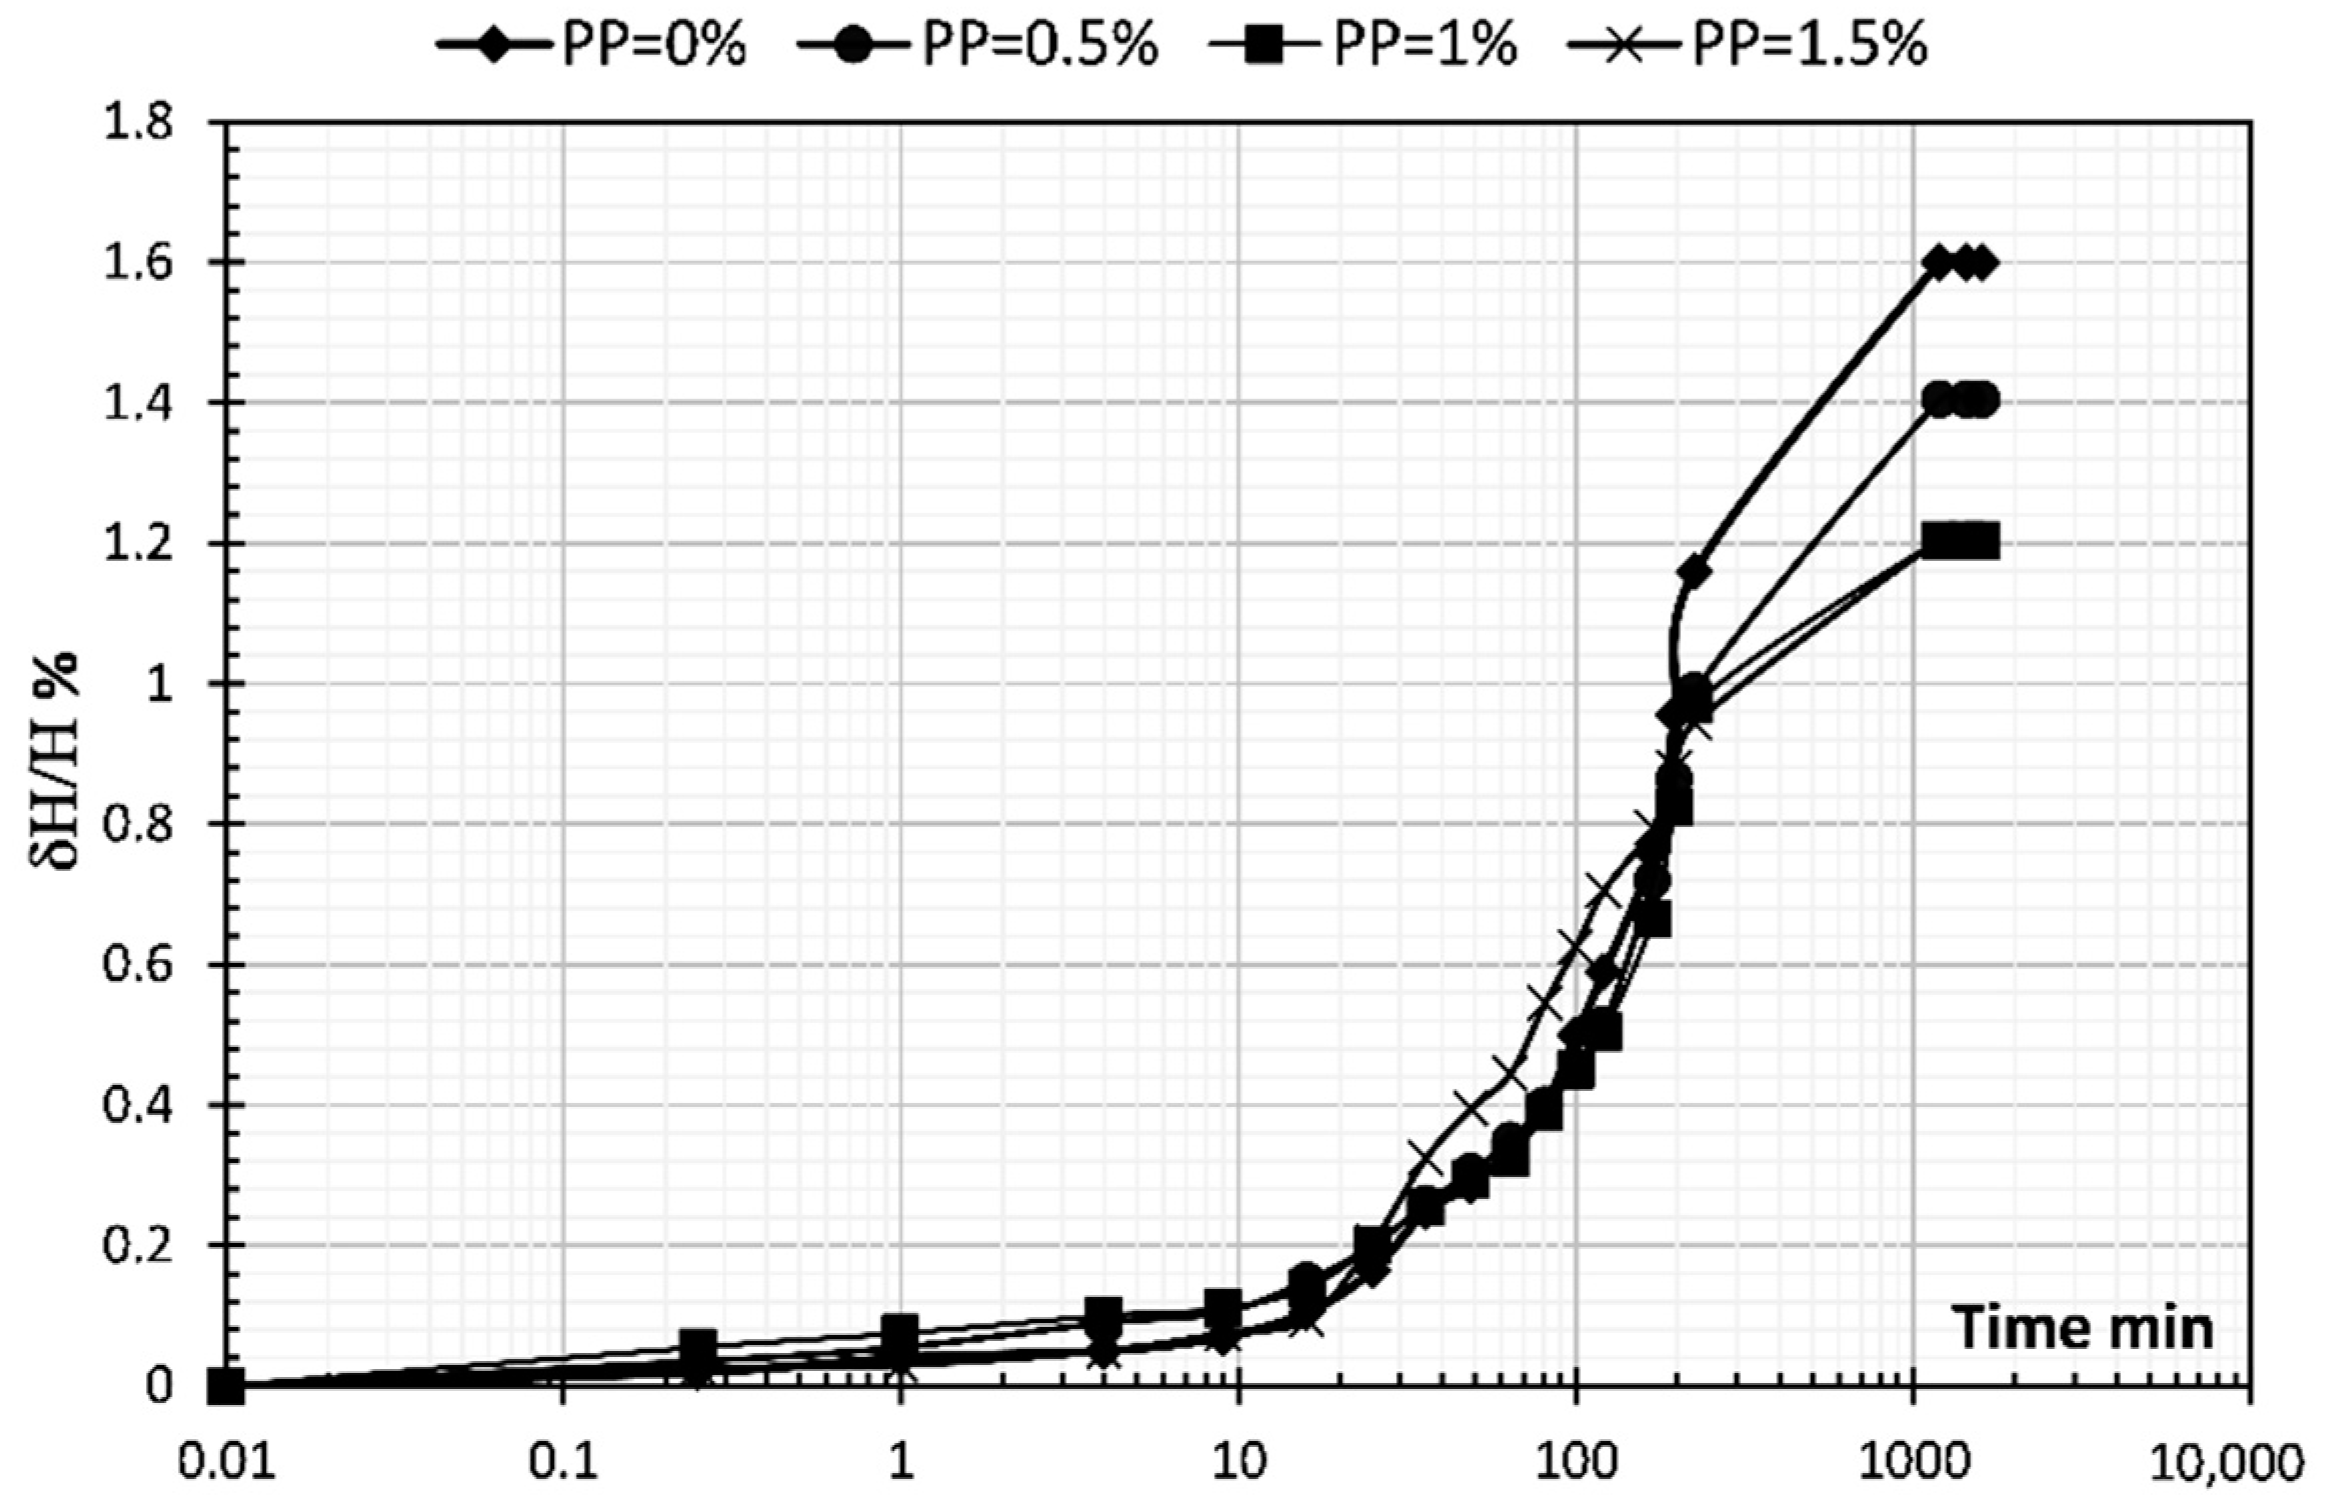
4.3. Effects of Fiber Content on Swell Stress and Swell Potential

Based on the aforementioned tests’ outputs, and to evaluate the effect of polypropylene fiber on both swell potential and swell stress, representations of swell stress, and swell potential against fiber contents are shown in Figure 12 and Figure 13.
Regarding swell potential, it decreased significantly with increasing fiber content to 1% and the maximum reduction in the swell potential was 24.6%, as shown in Figure 12, and this could be due to the same behavior that was observed during the conduction of UCS experiments, where it was observed that the bonding effect of the added fiber was decreased after adding 1% or more of the fiber.
Regarding swell stress, it was decreased substantially with increasing fiber content from 0.5% to 1.5%. The maximum reduction was 46.2%, as is shown in Figure 13.
Upon the experiments’ results, a fiber content-based function was developed to calculate the swelling stress at any value of the reinforcing ratio, under the assumption that the maximum ratio should not exceed 1.5% (Equation (4)). This equation gives the values of the swelling stress for each fiber content that should not exceed 1.5%.
S S f ( kPa ) = 102.6 × f 3 232 × f 2 + 76.33 × f + S S f 0
where S S f is the swelling stress with respect to f (f is the fiber content).

5. Conclusions

This study demonstrates the influence of polypropylene fiber on the strength and swelling properties of high plasticity clay, and provides fiber content-based functions to predict all strength and swelling properties. The results show significant improvement in the shear strength (an average increase of 184% at 1.5% fibers) and shear parameters (cohesion (an increase of 257% at 1.5% fibers) and friction angle (an increase of 62% at 1.5% fibers)) of the reinforced soil, with a possibility of decreasing the friction angle for a fiber content greater than 1.5%. The same behavior was observed in the unconfined compressive strength results (an increase of 86% at 1.5% fibers) after considering that the elasticity modulus is decreased for a fiber content greater than 0.5%. The swell tests show the decrease in swelling stress (a decrease of 46% at 1.5% fibers) and swelling potential (a decrease of 24% at 1.5% fibers) with the increase of fiber content, considering that 1% of fiber content is the optimum fiber content for improving the swelling behavior with respect to the properties of the studied soil. Therefore, it can be inferred that there is a great potential for the use of polypropylene fiber to reinforce high plasticity clayey soils in several areas of geotechnical engineering after applying proper mixing techniques to ensure the homogeneity of the soil-fiber matrix in the field. The fiber contents of 0.5% to 1% are considered suitable for the soil in this study to have a low amount of swell, and improve the shear strength and unconfined compressive strength effectively.

Author Contributions

Data curation, Y.S.U.; investigation, T.T.; resources, T.T. and Y.S.U.; validation, Y.S.U.; visualization, T.T.; writing—review & editing, T.T and Y.S.U. All authors have read and agreed to the published version of the manuscript.

Funding

This research received no external funding.

Informed Consent Statement

Informed consent was obtained from all subjects involved in the study.

Data Availability Statement

All data, models, and code generated or used during the study appear in the submitted article.

Conflicts of Interest

The authors declare that they have no known conflict of interest or personal relationship that could have appeared to influence the work reported in this paper.

References

  1. Dasog, G.S.; Mermut, A.R. Expansive Soils and Clays. In Encyclopedia of Natural Hazards; Bobrowsky, P.T., Ed.; Springer: Dordrecht, The Netherlands, 2013. [Google Scholar] [CrossRef]
  2. Nelson, J.D.; Miller, D.J. Expansive Soils: Problems and Practice in Foundation and Pavement Engineering; John Wiley & Sons Inc.: New York, NY, USA, 1992. [Google Scholar]
  3. Vessely, M.J.; Wu, J.T.H. Feasibility of geosynthetic inclusion for reducing swelling of expansive soils. Trans. Res. Rec. J. Trans. Res. Board 2002, 1787, 42–52. [Google Scholar] [CrossRef]
  4. Sridharan, A.; Gurtug, Y. Swelling behaviour of compacted fine-grained soils. Eng. Geol. 2004, 72, 9–18. [Google Scholar] [CrossRef]
  5. Akbulut, S.; Arasan, S.; Kalkan, E. Modification of clayey soils using scrap tire rubber and synthetic fibers. Appl. Clay Sci. 2007, 38, 23–32. [Google Scholar] [CrossRef]
  6. AlZubaidi, R.M.; AlRawi, K.H.; AlFalahi, A.J. Using cement dust to reduce swelling of expansive soil. Geomech. Eng. 2013, 5, 565–574. [Google Scholar] [CrossRef]
  7. Al-Mahbashi, A.M.; Elkady, T.Y.; Alrefeai, T.O. Soil water characteristic curve and improvement in lime treated expansive soil. Geomech. Eng. 2015, 8, 687–696. [Google Scholar] [CrossRef]
  8. Al-Bared, M.A.M.; Harahap, I.S.H.; Marto, A.; Abad, S.V.; Mustaffa, Z.; Al, M.O.A. Mechanical behaviour of waste powdered tiles and Portland cement treated soft clay. Geomech. Eng. 2019, 19, 37–47. [Google Scholar] [CrossRef]
  9. Panchal, J.P.; McNamara, A.M.; Stallebrass, S.E. Physical modelling of lime stabilisation in soft soils around deep excavations. J. Deep. Found. Inst. (DFI) 2018, 11, 137–147. [Google Scholar] [CrossRef]
  10. Rios, S.; Cristelo, N.; Viana da Fonseca, A.; Ferreira, C. Structural performance of alkali-activated soil ash versus soil cement. J. Mater. Civ. Eng. 2015, 28, 04015125. [Google Scholar] [CrossRef] [Green Version]
  11. Rios, S.; Cristelo, N.; Viana, A.; Ferreira, C. Stiffness behavior of soil stabilized with alkali-activated fly ash from small to large strains. Int. J. Geomech. 2016, 17, 04016087. [Google Scholar] [CrossRef] [Green Version]
  12. Zhang, Z.; Wang, H.; Provis, J.L. Quantitative study of the reactivity of fly ash in geopolymerization by ftir. J. Sustain. Cem. Mater. 2012, 1, 154–166. [Google Scholar] [CrossRef] [Green Version]
  13. Kua, T.A.; Arulrajah, A.; Mohammadinia, A.; Horpibulsuk, S.; Mirzababaei, M. Stiffness and deformation properties of spent coffee grounds based geopolymers. J. Constr. Build. Mater. 2017, 138, 79–87. [Google Scholar] [CrossRef]
  14. Hoy, M.; Rachan, R.; Horpibulsuk, S.; Arulrajah, A.; Mirzababaei, M. Effect of wetting–drying cycles on compressive strength and microstructure of recycled asphalt pavement—Fly ash geopolymer. Constr. Build. Mater. 2017, 144, 624–634. [Google Scholar] [CrossRef]
  15. Kumar, A.; Walia, B.S.; Bajaj, A. Influence of fly ash, lime, and polyester fibers on compaction and strength properties of expansive soil. J. Mater. Civ. Eng. 2007, 19, 242–248. [Google Scholar] [CrossRef]
  16. Sivakumar Babu, G.L.; Vasudevan, A.K. Strength and stiffness response of coir fiber-reinforced tropical soil. J. Mater. Civ. Eng. 2008, 20, 571–577. [Google Scholar] [CrossRef]
  17. Viswanadham, B.V.S.; Phanikumar, B.R.; Mukherjee, R.V. Swelling behaviour of a geofiber-reinforced expansive soil. Geotext. Geomembr. 2009, 27, 73–76. [Google Scholar] [CrossRef]
  18. Tang, C.; Wang, D.; Cui, Y.; Shi, B.; Li, J. Tensile strength of fiber-reinforced soil. J. Mater. Civ. Eng. 2016, 28, 04016031. [Google Scholar] [CrossRef]
  19. Yilmaz, Y. Compaction and strength characteristics of fly ash and fiber amended clayey soil. Eng. Geol. 2015, 188, 168–177. [Google Scholar] [CrossRef]
  20. Cai, Y.; Shi, B.; Ng, C.W.W.; Tang, C. Effect of polypropylene fiber and lime admixture on engineering properties of clayey soil. Eng. Geol. 2006, 87, 230–240. [Google Scholar] [CrossRef]
  21. Deng, Y.F.; Wu, Z.L.; Liu, S.Y.; Yue, X.B.; Zhu, L.L.; Chen, J.H.; Guan, Y.F. Influence of geopolymer on strength of cement-stabilized soils and its mechanism. Yantu Gongcheng Xuebao/Chinese J. Geotech. Eng. 2016, 38, 446–453. [Google Scholar] [CrossRef]
  22. Khan, I.; Umar, R. Environmental risk assessment of coal fly ash on soil and groundwater quality. Groundw. Sustain. Dev. 2018, 8, 346–357. [Google Scholar] [CrossRef]
  23. Brown, R.; Shukla, A.; Natarajan, K.R. Fiber Reinforcement of Concrete Structures; University of Rhode Island Trans Center: Kingston, RI, USA, 2002. [Google Scholar]
  24. Ramasamy, S.; Arumairaj, P.D. The effect of polypropylene fiber on index properties and compaction characteristics of clay soil. Turkish J. Eng. Sci. Technol. 2013, 2, 35–38. [Google Scholar]
  25. Hejazi, S.M.; Sheikhzadeh, M.; Abtahi, S.M.; Zadhoush, A. A simple review of soil reinforcement by using natural and synthetic fibers. Constr. Build. Mater. 2012, 30, 100–116. [Google Scholar] [CrossRef]
  26. ASTM D698; Standard Test Methods for Laboratory Compaction Characteristics of Soil. ASTM International: West Conshohocken, PA, USA, 2012. [CrossRef]
  27. ASTM D3080-04; Standard Test Method for Direct Shear Test of Soils Under Consolidated Drained Conditions. ASTM International: West Conshohocken, PA, USA, 2004. [CrossRef]
  28. ASTM D2166/D2166M-16; Standard Test Method for Unconfined Compressive Strength of Cohesive Soil. ASTM International: West Conshohocken, PA, USA, 2016. [CrossRef]
  29. ASTM D4546-21; Standard Test Methods for One-Dimensional Swell or Collapse of Soils. ASTM International: West Conshohocken, PA, USA, 2021. [CrossRef]
  30. Mirzababaei, M.; Arulrajah, A.; Haque, A.; Nimbalkar, S.; Mohajerani, A. Effect of fiber reinforcement on shear strength and void ratio of soft clay. Geosynth. Int. 2018, 25, 471–480. [Google Scholar] [CrossRef]
  31. Mali, S.; Singh, B. Strength behaviour of cohesive soils reinforced with fibers. Int. J. Civ. Eng. Res. 2014, 5, 353–360. [Google Scholar]
  32. Maheshwari, K.; Solanki, C.H.; Desai, A.K. Effect of polyester fibers on strength properties of clayey soil of high plasticity. Int. J. Sci. Eng. Res. 2013, 4, 486–490. [Google Scholar]
  33. Anagnostopoulos, C.A.; Dimitrios, T.; Berketis, K. Evaluation of the shear strength behaviour of polypropylene and carbon fiber reinforced cohesive soils. Res. J. Appl. Sci. Eng. Technol. 2014, 7, 4327–4342. [Google Scholar] [CrossRef]
  34. Yang, B.-H.; Weng, X.-Z.; Liu, J.-Z.; Kou, Y.-N.; Jiang, L.; Li, H.-L.; Yan, X.-C. Strength characteristics of modified polypropylene fiber and cement-reinforced loess. J. Cent. South Univ. 2017, 24, 560–568. [Google Scholar] [CrossRef]
  35. Sharma, T.; Kaushik, R. Effect of Polypropylene Fiber on Properties of Bagasse Ash-Cement Stabilized Clay Soil. Int. J. Emerg. Technol. 2019, 10, 255–266. [Google Scholar]
  36. Senol, A.; Ikizler, S.B.; Etminan, E.; Demir, G. Improvement of Low Plasticity Clayey Soils Using Polypropylene Fibers. In Proceedings of the Geo-Hubei International Conference on Sustainable Civil Infrastructure, Yichang, China, 20–22 July 2014. [Google Scholar] [CrossRef]
  37. Sabat, A.K. Effect of polypropylene fiber on engineering properties of rice husk ash—Lime stabilized expansive soil. Electron. J. Geotech. Eng. 2012, 17, 651–660. [Google Scholar]
Figure 1. Used polypropylene fiber.
Sustainability 14 06767 g001
Figure 2. Density/water content for four polypropylene fiber contents (PP).
Sustainability 14 06767 g002
Figure 3. Shear stresses against displacements for four polypropylene fiber contents (PP): (a) Shear stress/displacement for fiber content PP = 0%. (b) Shear stress/displacement for fiber content PP = 0.5%. (c) Shear stress/displacement for fiber content PP = 1%. (d) Shear stress/displacement for fiber content PP = 1.5%.
Sustainability 14 06767 g003
Figure 4. Axial stress/axial strain for four polypropylene fiber contents (PP): (a) Axial stress/axial strain for fiber content PP = 0%. (b) Axial stress/axial strain for fiber content PP = 0.5%. (c) Axial stress/axial strain for fiber content PP = 1%. (d) Axial stress/axial strain for fiber content PP = 1.5%.
Sustainability 14 06767 g004
Figure 5. Average swelling readings for four fiber contents (PP = 0% to 1.5%).
Sustainability 14 06767 g005
Figure 6. Swelling values against swelling stresses for different fiber contents (PP).
Sustainability 14 06767 g006
Figure 7. Stress–displacement curves under 50 kPa vertical load for different fiber contents.
Sustainability 14 06767 g007
Figure 8. Shear strength against fiber content for four vertical applied loads.
Sustainability 14 06767 g008
Figure 9. Shear strength parameters (C, ∅) versus fiber content.
Sustainability 14 06767 g009
Figure 10. Unconfined compressive strength parameters (UCS, Eu) with fiber content (PP). (a) Unconfined compressive strength with fiber content; (b) elasticity modulus with fiber content.
Sustainability 14 06767 g010
Figure 11. Unconfined compressive strength failure shapes with respect to the fiber content (0% to 1.5%, left to right, respectively).
Sustainability 14 06767 g011
Figure 12. Reduction of swelling potential against fiber content.
Sustainability 14 06767 g012
Figure 13. Swelling stress value and its reduction percentage against fiber content.
Sustainability 14 06767 g013
Table 1. Properties of the used polypropylene fibers (as provided by the manufacturer).
Behavior ParametersValues
Fiber typeSingle fiber
Unit weight0.91 g/cm3
Average diameter0.034 mm
Average length12 mm
Breaking tensile strength350 MPa
Modulus of elasticity3500 MPa
Fusion point165 °C
Burning point590 °C
Acid and alkali resistanceVery good
DispersibilityExcellent
Table 2. Characteristics of the studied soil.
Soil PropertiesValues
Specific gravity2.7
Liquid limit57%
Plastic limit22.67%
Plasticity index34.33%
Unified Soil Classification System (USCS)CH
Optimum moisture content22.5%
Maximum dry density1.57 g/cm3
Sand (4.75–0.075 mm)24%
Silt (0.075–0.002 mm)39%
Clay < 2 µm35%
Shrinkage limit12%
Table 3. Quantities calculations for shear test’s samples preparation.
Fiber Content
PP (%)
Dry Weight of Soil
(g)
PP Weight
(g)
Water Weight
(g)
No. of SamplesTotal Dry Soil Weight
(g)
Total Water Weight
(g)
Total PP Weight
(g)
Total Wet Weight of the Soil
(g)
0%125.6028.266753.6169.560923.16
0.5%125.60.6328.266753.6169.563.77926.93
1%125.61.2628.266753.6169.567.54930.67
1.5%125.61.8928.266753.6169.5611.30934.47
Table 4. Cohesion and friction angle (C and ∅) values with respect to fiber content.
Fiber Content
(%)
Cohesion
(C, kPa)
Friction Angle
(Degree, ∅)
0%31.8617.58
0.5%49.6830.40
1%67.2633.52
1.5%113.6228.54
Table 5. Unconfined compressive strength and elasticity modulus values with respect to fiber content.
Fiber Content
(%)
Unconfined Compressive Strength, (kPa)Elasticity Modulus
E, (kPa)
0%26515.00
0.5%30515.91
1%47813.64
1.5%49313.48
Table 6. Swell stress and swell strain values with respect to fiber content.
Fiber Content
(%)
Swell Stress
(kPa)
Maximum Swelling Strain ∆H/H%
0%71.6
0.5%1.405
1%1.205
1.5%1.205
0%501.275
0.5%1.03
1%0.78
1.5%0.62
0%1000.6
0.5%0.145
1%−0.245
1.5%−0.395
0%160−0.2
0.5%−0.1
1%−0.32
1.5%−1.045
Table 7. Swelling stress (zero swelling value) respecting fiber content.
Fiber Content
(%)
Swell Stress
SS (kPa)
0%145
0.5%124
1%85
1.5%78
Publisher’s Note: MDPI stays neutral with regard to jurisdictional claims in published maps and institutional affiliations.

