1. Introduction
The continuous increase in city populations has led to the introduction of new manners of transportation. Conventional forms of transportation, such as buses and taxis, are inadequate due to a lack of accessibility and high service costs. Citizens are looking for alternative forms of transportation that bring them closer to their destination and avoid overcrowding. However, the benefits of electric vehicles are often ignored due to the appropriate information regarding these vehicles not being provided through courses or lectures [
1]. In this direction, cities suggest light transport vehicles for short distance travel in the context of micro-mobility. The most popular light transport vehicles are bicycles (bicycles, e-bikes, shared bicycles and electric bicycles with electric assistance from pedals), e-scooters and e-skateboards.
E-scooters are the most modern form of transportation that is becoming increasingly popular for travel within the city. In recent years, many companies have invested in e-scooters, promoting them in various locations that are easily accessible. The companies claim that they offer convenient and flexible services for the citizen. The e-scooter ride is a simple process that requires finding and acquiring the e-scooter through use of the respective application of the company. The rider should follow the appropriate driving legislation and ensure a safe parking location. E-scooters combine an economical option with a friendly impact on the environment. The positive contribution to the environment arises from the electric motor in the context of energy efficiency from renewable energy sources, which results in zero CO
2 emissions during use. On the other hand, the main construction materials of e-scooters are aluminium parts and batteries, which have a negative impact on the environment during construction [
2,
3].
The e-scooter operation is a new form of transportation that should be developed over the coming years. The state is called to understand the use of e-scooters and make the necessary actions to enhance their sustainability. Development of the city infrastructure can create a favorable environment for e-scooter use. The construction of e-scooter stations is a substantial upgrade that can provide safety to the stopped e-scooter and battery charging. However, it is difficult to capture e-scooter use patterns due to random use, and consequently, it is difficult to decide the proper location for the stations in order to serve most citizens with the lowest cost.
In this study, we aim to reveal e-scooter user patterns, which leads to finding the appropriate station locations. User patterns arise from the combination of e-scooter stigma, timestamps and travel times. The main pattern division is between occasional and consistent users and investigation into whether consistent riders use the e-scooters for entertainment or commuting to work. Knowledge of user patterns is combined with e-scooter demand to conclude the optimal number and location of stations that can serve the needs of the city.
2. The Literature
Electric scooters first appeared in the USA as an upgrade to the bicycle. In 2018, e-scooters recorded about 34 million trips in the USA, while in 2019, the number of trips reached 86 million [
4]. In Europe, it is estimated that the number of scooters is close to 360,000, although the exact number of trips is not possible to determine due to the structure of European countries [
5]. According to the Lime company, in Madrid and Prague, there are 1,000,000 trips made in a year. Additionally, the trips that take place in Greece reach 1 million per year among the cities of Athens, Thessaloniki and Chania [
6]. The use of e-scooters enhances society on multiple levels. The most important effects are environmental, social, economic and spatial. In particular, it is observed that 24% of the CO
2 produced in cities comes from transport, which makes up 29% of global energy demand. The use of e-scooters significantly reduces energy consumption by up to 50% [
7]. Socially, the size of the e-scooter makes it approachable for both sexes. In fact, women prefer electric e-scooters to bicycles for long distances because they are more convenient. Electric scooters are also a reliable travel solution, combining low transportation costs with a comfortable trip. The use of e-scooters is more economical, compared to cars, for short-distance traveling [
8]. The concentration of populations in large urban centers contributes to the expansion of cities. E-scooters have an installed detection system to track trips and find the locations with high demand. City centers suffer from traffic congestion due to the large influx of citizens, with parking being a major problem for vehicles. The parking space of five e-scooters corresponds to that of one car.
Cities are trying to create an e-scooter network by constructing scooter stations in critical spots. The stations should cover the e-scooter demand quantitatively and spatially. Cities should have a sufficient number of stations to satisfy citizens from different regions and stations should contain scooters for every potential user. The construction of the stations is determined by the users’ behavior. There are two basic usage patterns: entertainment and the commute to work. Regions for entertainment consist of parks or bicycle paths. In contrast, users that commute to work use areas in the city center where there are many offices and businesses.
The field of transportation consists of various levels that require different approaches to analyze modes of operation, which is influenced by many factors. The continuing operation of transport regularly creates repetitive patterns that should be recognized in order to improve the whole process. Researchers have applied and upgraded methods to identify and capture patterns. Overcrowded cities should manage a traffic system; Support Vector Machines (SVM) have demonstrated great results in urban road traffic condition pattern recognition [
9]. Clustering methods are able to effectively identify patterns:
K-means clustering is applied to recognize delay patterns on a high traffic railway [
10] and a variant of this is enhanced with the Principal Component Analysis (PCA) [
11] to recognize traffic patterns [
12]. Additionally, the Density-based Spatial Clustering of Applications with Noise (DBSCAN) algorithm created clusters about individual transit riders in a wide repository [
13,
14]. Recently, convolutional neural network (CNN) algorithms have been applied to identify travel patterns. The CNN receives timetables and manages them as images to capture the fluctuation of transport [
15,
16,
17,
18].
Many studies have examined shared bicycle usage patterns, but the e-scooter usage pattern remains questionable. The accuracy of detecting usage is limited by two main reasons: firstly, there is not enough volume of data for processing because the usage is recorded for short time, and secondly, companies do not easily disclose data on the use of e-scooters.
Most studies refer to the usage pattern of e-scooters in the USA. According to the NACTO (National Association of City Transportation Officials, NY, USA), the areas with the most intense use of e-scooters are Atlanta, Austin, Dallas, Los Angeles, San Diego and Washington, in which there is also the largest number of e-scooters [
4]. E-scooters and bicycles were introduced to replace the use of cars for short distances. McKenzie tries to interpret the movement of e-scooters in Washington by comparing it with the movement of bicycles. Their interpretation reveals that e-scooters are used for entertainment, but the study fails to connect e-scooter usage with commuting from or to the workplace. The study claims that e-scooters are used for entertainment and tourism rather than as a means of transportation [
19]. Additionally, citizens in the city of Thessaloniki prefer to use e-scooters instead of walking and public transport for their leisure time [
20]. On the contrary, a survey carried out in Palermo showed that 77.5% of the participants used e-scooters to commute to work during the pandemic [
21]. Austin, Texas, a city with a large number of e-scooters, has proven that users move mainly in the city center, especially at the university [
22]. Another study suggested that the main e-scooter users in Austin are middle-income and well-educated men, while the users under the age of 25 do not affect the number of trips [
23]. The e-scooter service should upgrade its operation and adapt to every user’s need, and deal with community problems such as the gender gap [
24]. However, micro-mobility electric vehicles are a new form of transport and have many aspects that should be discovered and integrated into city transport [
25].
The establishment and usage of e-scooters was delayed in Europe and tracing usage patterns is even more difficult. For the first few years, each e-scooter company operated independently in every country. MMfE (micro-mobility Transforming Urban Mobility for Europe) was founded in Brussels (2 February 2021) and owns the eight largest e-scooter companies (Bird, Bolt, Dott, FreeNow, Lime, TIER, Voi and Wind) [
26]. The main purpose for the collaboration is to develop a reliable e-scooter network in Europe. MMfE members are active in more than 20 European countries and more than 100 European cities. A survey on e-PMV (Personal Mobility Vehicles), including e-bikes, e-scooters and self-balancing vehicles, indicated e-scooter usage patterns: users preferred to ride the e-scooters on weekend afternoons for entertainment, while on a daily basis, they were used to travel to and from work, or reach the nearest bus station [
27].
The construction of charging stations is a necessary procedure for the sustainability of e-scooters as they are not fully autonomous. The decision of the station location should serve the users, in addition to normal mobility in the city. A key factor affecting the establishment of stations is the demand points and the usage patterns (e.g., entertainment, commute from/to work, tourism etc.). However, the construction of many stations is limited due to the cost of construction and maintenance, which is expensive.
In order to present micro-mobility vehicles as a sustainable solution, it is important to determine the appropriate definition of the measurements in order to develop a suitable methodology [
28]. The demand coverage is characterized by two main factors: easy accessibility for users to the e-scooters (minimizing the time it takes to find them) and the width of the area that can be served from the stop (maximization of spatial distance from the stop) [
8,
19]. A survey by Church, Stoms and ReVelle approached the problem as a Maximal Coverage Location Problem in order to cover the maximum possible area with a certain number of stations [
29]. Another method is the Location Set Covering, which finds the smallest number of stops and locations for station installations. This method ensures that every e-scooter is a reasonable distance away from the station [
30]. One improvement to the above approaches that is more efficient concerning demand problems includes the Improved Set Covering Location Model (ISCLM), which limits the construction of stations according to demand [
31,
32]. The Multi-Objective Particle Swarm Optimization (MOPSO) algorithm also achieves efficient results. The main variables it uses to detect stops are generational distance, maximum spread, spacing and diversity metric [
33]. However, the construction of the stations should take into account the safety of the user and the efficiency of the trips for a friendlier e-scooter context [
34].
E-scooters are intended to replace cars as the primary mode of transportation in cities; however, one drawback is that e-scooters are unable to sustain their power over long distances. Hanabusa and Horiguchi addressed this problem by minimizing the time and costs associated with refueling or replacement for covering longer distances and reducing the charging time at the station [
35]. Moreover, stations should be prepared to respond to user requirements in a minimum timeframe. The average or maximum waiting time for recharging is an indicator of the effectiveness of the stops [
36].
It is important to present the factors that affect the total cost for the construction of the necessary stations. According to Cui and Weng, three main reasons influence the construction of charging stations. The first factor is the demand that directly affects the number of stations. The second is the cost of the area that should be acquired. The third is the cost of the voltage provided by the station to the e-scooters that are parked [
37].
3. Materials and Methods
In the city of Thessaloniki, various companies have been active in the field of the e-scooter network, but the restrictive pandemic measures forced the suspension of their distribution. RISE is the only company that provides shared e-scooters in Thessaloniki; after 2020, many countries changed the composition of their e-scooter network [
8]. The data of the previous companies are unknown, but RISE provides two different period datasets for three months. Though having a larger dataset would provide further insight into users’ behavior, the three-month period is a reliable interval to interpret user behavior for a network that operates less than a year in normal terms. The features of the first dataset are e-scooter ID, user ID, e-scooter model, start and end trip time, coordinates of departure and arrival locations, trip distance and trip duration. From the second dataset, the user ID and vehicle model are missing. The first set of data refer to the time period between August and September of 2020, while the second set to May 2021.
The dataset contains 26,374 observations, the first dataset comprises 65% and the second the remaining 35%. The trip distance refers to the Euclidean distance between the departure and arrival point. The total distance is greater than the trip distance, which represents the minimum travel distance. In the second set, the departure and arrival coordinates are the same in all observations; after research, both coordinates refer to the departure. Moreover, we removed trips with difficult or impossible starting or ending points, for example: trips that start from the sea.
The analysis of usage pattern recognition is based on the first dataset, as the user ID feature depicts the behavior of the rider. E-scooters develop their maximum speed, which is close to 25, under the right conditions. The presence of the bicycle path provides suitable soil morphology for the ideal e-scooter experience.
Table 1 shows the basic features for the trips taken in August, September and May. September has a total 10,113 of trips, which is 44% higher than August; in May there is a slight decrease. The Euclidean distance essentially depicts the minimum distance that the e-scooter made. In August and September, the minimum average distance traveled was more than 2 km, about 1 km fewer travel distance than May. In contrast to the distance, the two months of 2020 have a 9% and 20% lower average time than May.
These months describe the periods when the restrictive measures implemented due to the pandemic were de-escalated.
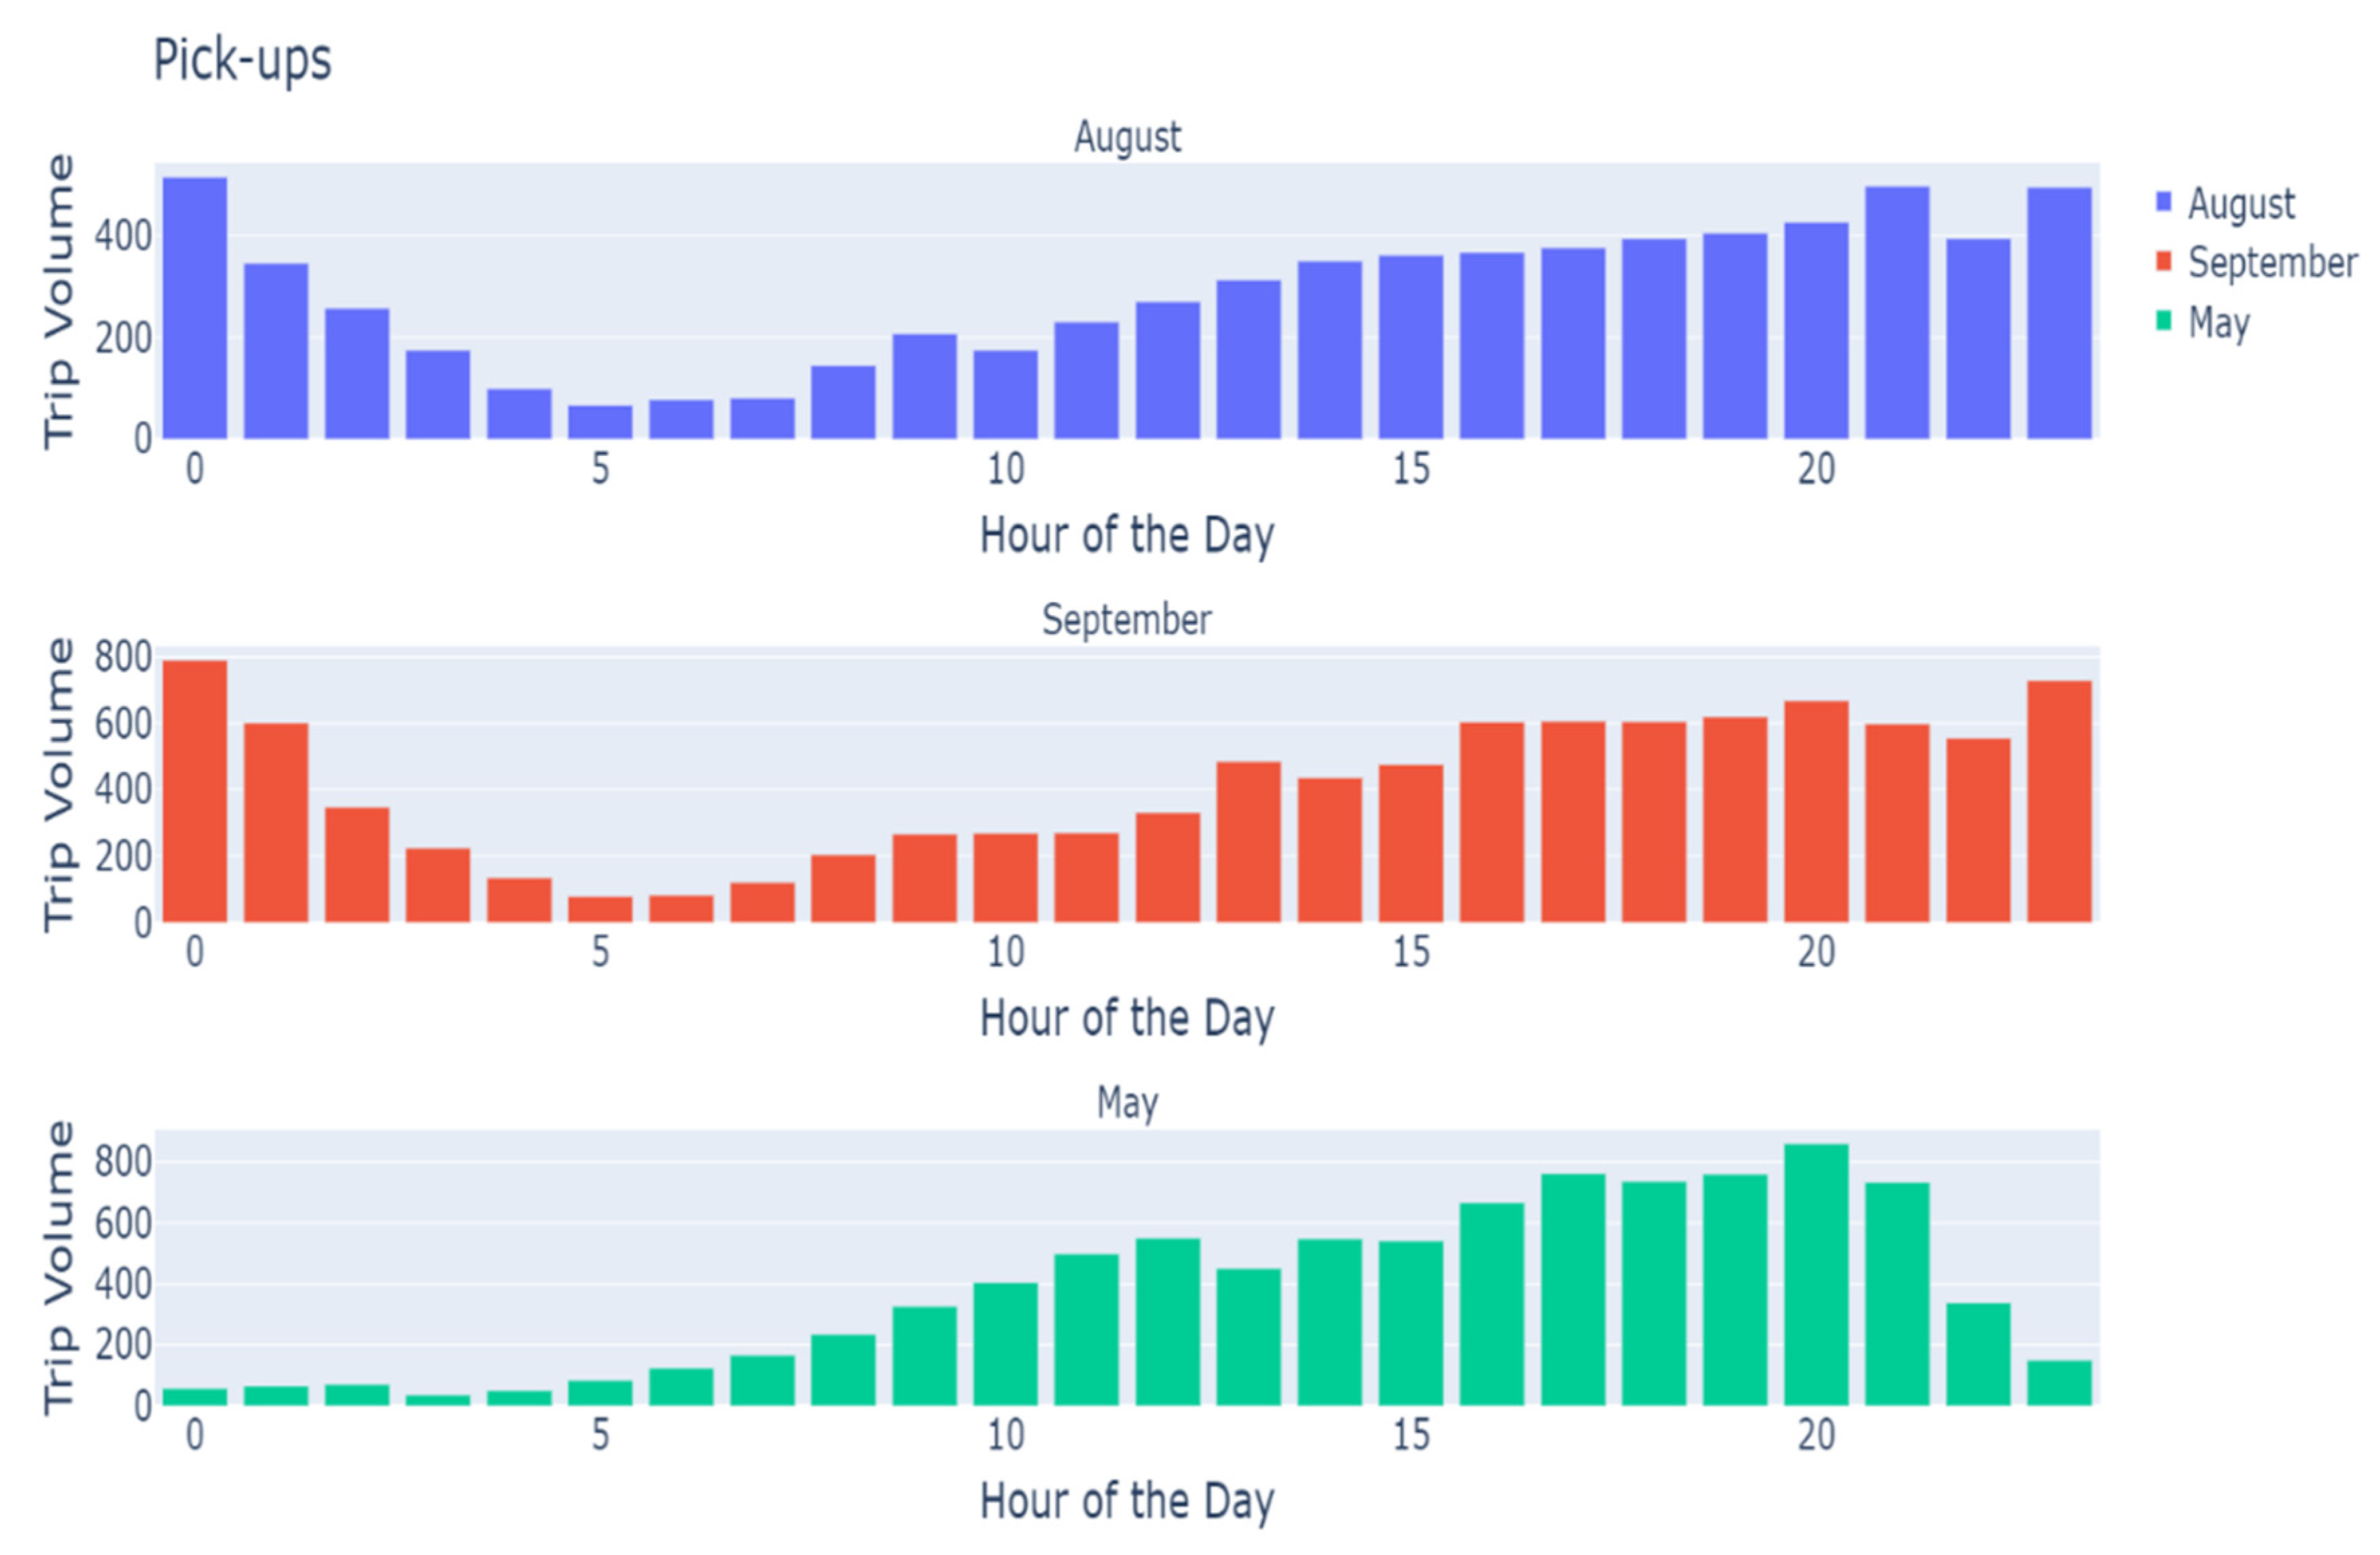
Figure 1 shows the demand for e-scooter per month. The two months of 2020 have a similar distribution, while in May the demand behavior is different, taking into account that the company RISE had a problem in recording the trips around 00:00. The inability to record data between 23:00 and 04:00 in May led to low activity results. Generally, for the three months, there is a gradual increase in trips from 08:00 to 20:00, with high mobility in the afternoon. For August and September, there are a large number of trips from 23:00 to 01:00, with the maximum indication recorded at 00:00.
Figure 2 shows the demand of e-scooters per hour throughout the week. Τhe number of trips is evenly distributed among the first four days of the week; during afternoons, the demand of e-scooters is 40% higher compared to mornings, with the peak noted at over 250 trips per hour. Friday and Saturday record the highest number of trips in the week, especially Saturday, recording 17% of the total trips. In the afternoons of Friday and Saturday, the number of trips increases rapidly because citizens have more leisure time for activities; at 19 p.m. on Saturday, a peak value of approximately 370 trips was detected. On weekdays, most trips are detected around 09:00 during the morning hours. On Sunday, there is the smallest difference between the morning and the afternoon trips; the rate approaches 25%.
Bicycle networks have been constructed for many years and many studies have explained the usage patterns of the riders. It is difficult to study the use of e-scooters due to the inadequate data collection and the unpredictability of user behavior. The dataset used for this study takes into account a period of two months: August and September of 2020. There are 3185 different registered users that take part in the sample. Users are considered reliable and are determined to ride the e-scooter consistently when they have completed at least 10 trips. Many users ride the e-scooters less than 11 times for about 5 different days, which indicates 1 use in 2 weeks, which does not make them regular users.
Table 2 below shows the number of users depending on the number of trips they travel. About 88% of total users used the e-scooters less than 10 times, while the remaining 12% are active users. Moreover, the 60% of users that made less than 11 trips rode the e-scooters for only one day and the others between 2 and 10 days.
A total of 397 users stigmatized the usage patterns of the e-scooters. The data revealed three different patterns of use: the frequency of use, the service used and the most popular locations. The three different patterns are characterized by five metrics. As mentioned above, the number of trips and days of use depict the frequency of e-scooter use. Moreover, the time interval between uses in the same day and consistency in the time of use indicate the purpose of use. The coordinates from the starting and ending point illustrate the locations where most e-scooters meet.
Figure 3 illustrates the Euclidean distance in proportion to the travel time for the time interval between 17:00 and 21:00. Over the red line, the time that the scooter needs to cover the respective distance is disproportionate, including estimated latency time. The observations that correspond to a travel time of less than 4 min is near 17%. Observations with a travel time of between 4 and 10 min constitute 41% of the total users. Finally, the use of the e-scooters for periods longer than 15 min records approximately 21% of the total observations. It was revealed that 90% of users prefer to use the e-scooters less than 15 min and for less than 6 km. During this time, e-scooters are used for both entertainment and transportation. The use of e-scooters for entertainment is reflected by the large number of observations which show a distance of less than 2 km and long travel time. The riders over the red line use the e-scooter for pleasure in their leisure time because the analogy of the time and distance indicates slow movement or the identification of starting and ending points. The users under the line with a distance greater than 6 km use the e-scooter as a means of transport for long distances. The remaining users cover between 2–6 km in a reasonable time but we can not determine the type of the movement.
Methodology
The aim of the mathematical facility location model is to make use of the spatial distribution that free flow scooter sharing data form and to design a network of stations for a dock-based system. This process considers both the operational efficiency of the system, ensuring that it is manageable and profitable, and user-friendliness, ensuring that the same convenience features as before are retained as much as possible. The first stage of the process uses the K-Means algorithm to detect and create station candidates. The algorithm aggregates coordinates of the origin and destination of the trips to form the potential location of the stations. Namely, as the number of clusters increases (the set of station candidates) the walking distance for a user from the nearest station decreases. A distance of 300 m is considered a reasonable distance that makes the service attractive for the users. Based on these requirements, a collection of 180 stations is defined for the set of station candidates. Those stations are used as an input on a p-median mixed-integer formulation to extract the optimal subset, which forms the final location of the facilities. The objective function includes the minimization of walking distance, the maximization of density and homogeneity of the network, the proximity of stations to the bike lane network, and the coverage of the whole study area of the Municipality of Thessaloniki. The set constraints that are used ensure that the final station’s configuration requires, at most, a 500 m walking distance and that each station is near the bike lanes to accommodate the expected demand. Lastly, the queueing features for each station are extracted according to the real demand of trips. The final size and inventory of each station are defined based on the arrival and departure rate (pickup/drop-off) of each station. The location, inventory, and capacity of the stations are also designed to reduce the costs of rebalancing operations. Computations took place both during the facility location problem and in station size optimization adjustment.
5. Discussion and Conclusions
This study examined the usage patterns of an e-scooter network in Thessaloniki. The rapid spread of e-scooters surprised the local authorities, who could not examine the situation extensively. It is obvious that the project of shared scooters is in a period of adjustment, with citizens trying their use. However, in the previous chapters, it was revealed that riders are beginning to form different behaviors in relation to the use of the e-scooters. Separating riders into active and test users sheds light on habits that are developing. In this direction, we gathered data concerning e-scooter use to evaluate the results and contribute to determining other behaviors.
The study demonstrates a correlation between e-scooter demand with the users’ behavior and the selection of the optimal number and locations of the stations. Previous studies detect the use of e-scooter for entertainment, but fail to capture different uses during the day. The combination of e-scooter demand, consistency of the user and the time of the trip lead to the detection of other uses. More specifically, there are citizens who commute to and from their work or arrive to their homes during the night. Additionally, e-scooters seem to be more convenient for trips with a travel time of less than 15 min at the most, and a distance between 1 and 6 km.
Selecting the optimal number of stations and their location is a complex operation, as it should cover the city’s needs with minimum cost. We chose to gradually construct stations in three stages; every stage was an enhancement of the network. Most e-scooters stations are located in coastal areas where the demand is high with respect to pedestrians and vehicles. Additionally, many stations are constructed along the bike path where users choose to ride for safety. In areas outside the center, the demand is at a lower level, but the network ensures that stations are constructed in those areas to support users who live there.
The results indicate that citizens are testing whether this new way of travelling suits their needs; many users ride the e-scooters only for one day. Moreover, the largest percentage of active users consists of casual riders who use the e-scooter 1–2 times a week. E-scooters do not appear to act as a substitute for cars, but other forms of light transport vehicles instead. The main usage pattern is for entertainment, such as leisure and tourism activities. However, there are indications that consistent users use e-scooters for commuting to and from work or to return home in the evening. Descriptive data showed that citizens choose to travel in the afternoon on Fridays and Saturdays. During the morning on weekdays, peak movement was displayed at 09:00, but the afternoon continues to see increased mobility. Citizens prefer to ride e-scooters in the city center, predominantly in the beach area. The choice of using the e-scooters is associated with the existence of a bicycle path, especially the coastal bike path which is safer and is not affected by cars.
The final stations were selected to cover the demand of the entire city and serve citizens from different locations. The estimation of the active electrical scooters led to the construction of 63 stations with total capacity near 748 seats. The construction process consists of three stages and each stage adds approximately 20 stations. The final network enhances the use of the bicycle path, which is gradually expanding throughout the city.
A shared e-scooter network can only have a positive effect on the normalization of city traffic, but the appropriate infrastructure should be built to thrive. The construction of e-scooter paths and stations should be the first infrastructure to enhance the use of e-scooters. The indications are encouraging that e-scooters can contribute to car reduction and space allocation.


