Abstract
Crystal violet (CV), a triphenylmethane dye, is widely used in the textile, printing, paper, leather, and cosmetics industries. However, due to its higher chemical stability and lower biodegradability, CV has teratogenic and carcinogenic toxic effects on animals and humans. Therefore, the objective of the present study was to investigate whether or not the as-prepared nZVI supported on an ordered mesoporous Zr-Ce-SBA-15 composite (nZVI/Zr-Ce-SBA-15) had more potential for CV removal from simulated wastewater in comparison with Zr-Ce-SBA-15. Meanwhile, the parameters of CV adsorption onto nZVI/Zr-Ce-SBA-15 composites were optimized by a response surface methodology (RSM) and an artificial neural network combined with particle swarm optimization (ANN–PSO). According to XRD, FTIR, SEM, and TEM, N2 adsorption, and thermogravimetric analyses, nZVI was supported successfully on Zr-Ce-SBA-15 composites, becoming an ordered mesoporous material. The results of RSM indicated that the order of the effects of the four parameters on CV removal was, successively, initial pH, contact time, temperature, and initial CV concentration. ANN–PSO was more suitable, in comparison to RSM, to optimize the experimental parameters for CV removal from simulated wastewater using ordered mesoporous nZVI/Zr-Ce-SBA-15 composites. The optimized removal rate of CV was 93.87% under an initial pH of 3.00, a contact time of 20.00 min, an initial CV concentration of 261.00 mg/L, and a temperature of 45. Pseudo-second-order kinetics can better describe the behavior of CV adsorption onto nZVI/Zr-Ce-SBA-15 composites. The process of CV adsorption onto Zr-Ce-SBA-15 composites was followed by the Langmuir model, and its maximum adsorption capacity was 105 mg/g in 213 K. It was indirectly confirmed that the maximum adsorption capacity of nZVI/Zr-Ce-SBA-15 exceeded this value because the removal efficiency of CV using nZVI/Zr-Ce-SBA-15 was obviously higher than that of using Zr-Ce-SBA-15. The thermodynamics results indicated that CV adsorption onto nZVI/Zr-Ce-SBA-15 was a spontaneous, endothermic, and entropy-driven process. The dissolution of Fe ions and light/dark experiments confirmed nZVI/Zr-Ce-SBA-15 was simultaneously of adsorption and catalysis in the process of CV removal. The effect of removal CV was still maintained in the first four experiments (removal rate > 78%), and our suggestion is that nZVI/Zr-Ce-SBA-15 is a potential adsorbent for CV remediation from wastewater compared to Zr-Ce-SBA-15 and other adsorbents.
1. Introduction
As a triphenylmethane dye, crystal violet (CV) is widely used in the textile, printing, paper, leather, and cosmetics industries [1,2], and it has strong antibacterial activity [3]. In the human body, it can inhibit the entry of intracellular enzymes into DNA, and it can also limit the interaction between intracellular enzymes and cell membranes [4]. Therefore, it is also commonly used to control human fungi and parasites in the intestine. The strong antibacterial activity of CV has also been widely used in aquaculture [5], where CV is often used as a bactericide and disinfectant. In the process of fish transportation, CV is also employed as a disinfectant to disinfect the transportation water body in order to prevent death and to prolong the survival of fish during long-distances [5]. Because of its excellent performance, low price, simple operation, and convenient purchase process, it has been highly favored by aquaculture farmers for a long time. However, CV is of high chemical stability and low biodegradability, and it has teratogenic and carcinogenic toxic effects on animals [6]. Therefore, printing and dyeing wastewater containing higher concentrations of CV leads to serious water pollution. Several researchers have shown that CV can be reduced and metabolized into fat-soluble recessive CV through biotransformation after entering the human or animal body. Such recessive CV can endanger human health through the food chain, and it can seriously affect the edible safety of aquatic products due to its high toxicity, residue, carcinogenicity, and mutagenicity [7]. Therefore, many countries and areas, including Europe, the Americas, China, and Japan, have strictly prohibited the application of CV in aquaculture.
Hereto, the remediation of wastewater containing CV dyes mainly includes adsorption [8], membrane separation, coagulation [9], electrochemical [10], photocatalytic degradation [11], and biological and combined treatment methods [12]. Among them, the adsorption method has been widely used in the treatment of printing and dyeing wastewater because of the low initial investment, simple equipment, and convenient operation [13]. As an excellent adsorbent, SBA-15 has a large pore size (up to 30 nm), a thick pore wall (up to 6.4 nm), and excellent thermal stability. It has been employed in the fields of catalysis, separation, biology, and nanomaterials [14]. Kumaravel et al. [15] fabricated mesoporous WO3-SBA-15 catalysts used for the degradation of harmful dyes such as rhodamine B, methylene blue, and crystal violet under UV, visible, and solar light irradiations. The fabrication of mesoporous WO3-SBA-15 catalysts enhanced the photocatalytic degradation of harmful dyes. The traditional SBA-15 is rod-shaped or fibrous [16]. The long channel may inhibit the diffusion of macromolecular substances in said channel, resulting in particles becoming dispersed outside the channel and being unable to enter it [17]. It also affects the mass transfer speed in water. In contrast, short-pore ordered mesoporous materials are more favorable for the diffusion and the transport of substances in pores, which have attracted extensive attention. Short-channel ordered mesoporous materials with regular morphology have potential applications in many fields, such as catalysis, enzyme immobilization, and adsorption [18]. However, the disadvantages of pure SBA-15 mesoporous materials, such as their lower chemical reaction activity, selectivity for pollutant adsorption, ion exchange capacity, acid content and strength, and lack of catalytic oxidation reaction, greatly limit their practical application [19]. Therefore, relying on chemical modification to improve their hydrothermal stability and chemical reaction activity, and thus change their properties to remove pollutants from the environment, has become the focus of current research.
Zero valent nano-iron (nZVI) is often used to remove pollutants from wastewater due to its small particle size, large specific surface area, and high reaction activity [20]. However, nZVI is easy to agglomerate, and it is easily oxidized in a normal environment, limiting its practical application [20]. When nZVI is combined with Zr-Ce-SBA-15 composites, the larger specific surface areas and mesoporous structures of the latter can provide a reaction site and simultaneously avoid agglomeration of nZVI for the process of pollutant removal. Meanwhile, nZVI can enhance the chemical reaction activity and the removal efficiency for the removal of pollutants using Zr-Ce-SBA-15, and significantly improve the magnetism of them to achieve the fast separation from the solid liquid system after the reaction. Unfortunately, to the best of our knowledge, there are few studies on the use of nZVI combined with Zr-Ce-SBA-15 to remove organic pollutants form wastewater, though several researchers have tried to combine nZVI and Zr-Ce-SBA-15 to remove pollutants from the environment. For example, Zhang et al. [17] used nZVI/Zr-Ce-SBA-15, a short-channel ordered mesoporous silica, to explore the reduction properties of cyclic nitro compounds. To supplement the application of nZVI/Zr-Ce-SBA-15 and to judge whether nZVI/Zr-Ce-SBA-15 has practical potential in the removal of environmental pollutants, the objective of the present study was to: (1) fabricate the ordered mesoporous Zr-Ce-SBA-15 and nZVI/Zr-Ce-SBA-15 materials to remove CV from simulated wastewater, and to compare their removal capabilities; (2) optimize the parameters of CV removal from simulated wastewater using response surface methodology (RSM) and an artificial neuron network combined with particle swarm optimization (ANN–PSO); (3) reveal directly or indirectly the mechanism of CV adsorption onto ordered mesoporous nZVI/Zr-Ce-SBA-15 materials by kinetics, adsorption isotherms, and thermodynamics; and (4) investigate their catalytic effect and regeneration ability using light and dark environments via the adsorption/desorption experiment.
2. Materials and Methods
2.1. Materials and Chemicals
The reagents involved in this experiment included triblock copolymer P123 (ChengDu Chron Chemicals Co, Ltd., Chengdu, China), tetraethyl orthosilicate (TEOS), ZrOCl8H2O (Sinopharm Chemical Reagent Co., Ltd., Shanghai, China), Ce(NO3)3·6H2O (Shanghai Qingxi Chemical Technology Co., Ltd., Shanghai, China), CH3(CH2)4CH3 (Nanjing Chemical Reagent Co., Ltd., Nanjing, China), and high-purity nitrogen N2 (Shanghai Bio Gas Co., Ltd., Shanghai, China). High-purity water (18.25 M/cm) from a Milli-Q water purification system was used throughout the whole experiment, and the above reagents were analytically pure.
2.2. Preparation of nZVI and nZVI/Zr-Ce-SBA-15
First, 3.0 g of triblock copolymer P123 (template) was weighed and dissolved in 96 mL of HCl (2 M) at 50 °C. Then, 7.4 mL of TEOS (source of Si,) was placed into the above P123 solution and continuously stirred for 15 min. Afterward, 0.1477 g of ZrOCl8H2O (source of Zr) and 0.3601 g of Ce(NO3)3·6H2O (source of Ce) were added into the above mixtures under unremitting stirring for 10 min. The obtained mixtures were maintained at a constant temperature of 50 °C for 24 h and then at 80 °C for 72 h. To remove the template, the obtained composites were dipped in a solution of ethanol 50% v/v for 24 h and then filtered, washed, and air dried at 50 °C. To remove the absolute redundant template, the samples were heated to 470 °C under N2 (20 mL/min flow) for 5 h and then calcined at 500 °C in air for 5 h. Finally, a white powder sample of Zr-Ce-SBA-15 was obtained.
By referring to the work of Tang et al., nZVI/Zr-Ce-SBA-15 composites were prepared [21]. Briefly, with continuous stirring, 1.0 g of the above Zr-Ce-SBA-15 was added into 30 mL of n-pentane. Then, 1.112 g of FeSO4·7H2O was placed dropwise into the above suspensions. Following this, the suspensions were dried at 60 °C for 12 h, and then 8 mL of NaBH4 solution (2 M) was introduced into the suspensions under continuous stirring and an N2 atmosphere. The obtained materials were separated from the mixtures using a magnet, washed with methanol three times, and then dried in a vacuum at 50 °C for 20 h. Meanwhile, 4.0 g of FeSO4·7H2O was dissolved in 200 mL of methanol and deoxygenated water to fabricate nZVI. Immediately, with continuous N2 protection and stirring, 10 mL of NaBH4 solution (2.1 M) was added gradually to the above solution, maintaining the procedure for 30 min. The black solid was successively washed with ethanol and deionized water, and the nZVI was dried in a vacuum at 50 °C for 20 h.
2.3. Characterizations
A field emission scanning electron microscope (FESEM) combined with an energy dispersive X-ray detector was used to analyze the surface topography of the nZVI/Zr-Ce-SBA-15 composites (S4800, Hitachi, Japan) under the set condition of 10 kV and 10 µA. Its functional group information was investigated using a Fourier-transform infrared spectrometer (IR-843, PerkinElmer, Waltham, MA, USA), while its crystal structure was studied using a wide-angle X-ray diffractometer (Dx2700, Dandong Haoyuan Instrument Co., Ltd., Liaoning, China; Cu Ka radiation, λ = 1.54 Å, 40 kV, 40 mA, 2θ = 10–80°). The pH values of the solutions were adjusted using a pH meter (PHS-3C, Shanghai Yidian Scientific Instrument Co., Ltd., Shanghai, China). The microstructure of the samples was observed using a transmission electron microscope (TEM, Jeoljem 2010, Akishima, Tokyo, Japan) at 200 kV, while the thermal stability of the samples was measured using a thermogravimetric analyzer (TGA, sta6000 synchronous thermal analyzer, PerkinElmer, Waltham, MA, USA) from 40 to 900 °C with an N2 atmosphere at a rate of 5 °C min−1. The BET-specific surface area and the pore size distribution of the nZVI/Zr-Ce-SBA-15 composites were tested by N2 adsorption/desorption at −196 °C, using a NOVA-2000E surface area analyzer (Quantachrome Corp., Boynton Beach, FL, USA; relative pressure: 10−6–0.99). The concentrations of CV were determined using a UV-visible spectrophotometer (Model 722, Tianjin Guanze Technology Co., Ltd., Tianjin, China) at λmax of 583 nm. The Fe ion concentrations in the nZVI/Zr-Ce-SBA-15 and CV systems were determined using an atomic absorption spectrophotometer (AAS) (Shimadzu, AA-7000, Kyoto, Japan), furnished with a single-element hollow-cathode lamp as a light source at the wavelength of 248.5 nm, a lamp current of 20 mA, and air–acetylene fame.
2.4. Batch Experiments
CV solutions of different concentrations (10, 20, 40, 80, 100, 200, 300, 400, and 500 mg/L) were prepared, and the pH value of the solution was adjusted by mixing HCl solution with pH = 2 and NaOH solution with pH = 8. Next, 0.15 g of the nZVI/Zr-Ce-SBA-15 composites was added into the beaker containing 50 mL of the CV solution, and static adsorption was carried out at room temperature. After the end of the adsorption, 1 mL of the supernatant was collected, and then its absorbance was measured after appropriate dilution, calculating the adsorption amount (qe, mg/g) and adsorption rate (%) using the standard curve method and Equations (1) and (2).
where qe is the equilibrium adsorption capacity of CV, mg/g; C0 and Ce refer to the concentration of CV solution before and after adsorption, respectively, mg/L; v is the volume of the CV solution, mL; m is the mass of nZVI/Zr-Ce-SBA-15; P is the adsorption rate of CV, %.
2.5. RSM and an Artificial Neural Network Combined with Particle Swarm Optimization (ANN–PSO)
2.5.1. RSM Used for Optimizing the Parameters in CV Removal
Four factors, namely, temperature (x1), contact time (x2), initial pH (x3), and initial CV concentration (x4), were selected and optimized to obtain the maximum CV removal efficiency (y) (Table 1). The level of each factor was determined according to the single-factor experiments, and the value range of the single factor is based on the adsorption conditions corresponding to the maximum adsorption value (Figure S1). Based on the Box–Behnken design (BBD) of RSM, the second-order model is given as per Equation (3):
where β0, βi, βii, and βij are the intercept, primary term coefficient, secondary term coefficient, and interaction coefficient, respectively, and ε is the test residual.

Table 1.
Parameter level of BBD experimental design.
2.5.2. ANN–PSO Used for Optimizing the Parameters in CV Removal
PSO is initialized as a group of random particles (random solutions) (Figure 1). Then, the optimal solution is found through iteration. In each iteration, the particle updates itself by tracking two “extreme values,” i.e., pbest and gbest. After finding these two optimal values, the particle updates its speed and position through the following equation [22]:
where i represents 1, 2, …, N, and N is the total number of particles in this group; vi is the velocity of particles; rand () is a random number between (0, 1); xi is the current position of the particle; c1 and c2 are learning factors, usually c1 = c2 = 2. The maximum value of vi is vmax (greater than 0), if vi is greater than vmax, then vi = vmax. The first part of Equation (4) represents the influence of the last speed and direction. The second part of Equation (5) is a vector from the current point to the best point of the particle itself, indicating that the action of the particle comes from its own experience. The third part of Equation (6) is a vector from the current point to the best point of the population, which reflects the cooperation and knowledge sharing among particles.
where w is the inertia factor and its value is positive; when its value is large, the global optimization ability is strong and the local optimization ability is weak. In contrast, if its value is small, the global optimization ability is weak and the local optimization ability is strong. The dynamic w can obtain better optimization results than a fixed value. The dynamic w can change linearly in the PSO search process or dynamically according to the measurement function of the PSO performance (https://blog.csdn.net/daaikuaichuan/article/details/81382794, accessed on 26 May 2022).
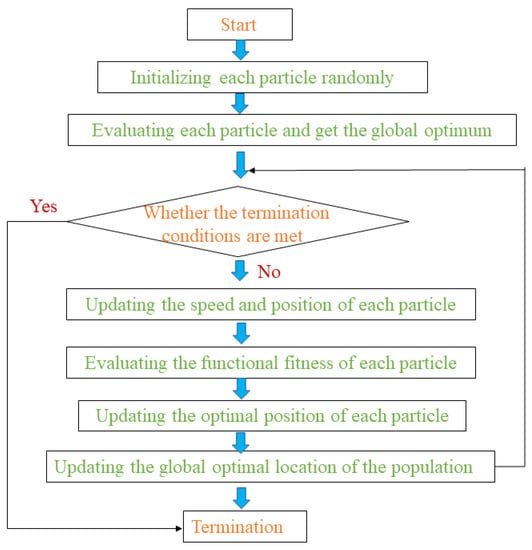
Figure 1.
The operational route map of PSO.
3. Results and Discussion
3.1. Characterization of the nZVI and the nZVI/Zr-Ce-SBA-15 Composites
Figure 2 indicates the diffraction peak of the nZVI and the nZVI/Zr-Ce-SBA-15 composites at 44.7° (100) and 82.3° (200), which is assignable to body-centered cubic α-Fe (JCPDS 06-0696), implying that nZVI was successfully supported on Zr-Ce-SBA-15. A strong and broad-band satellite peak of the nZVI/Zr-Ce-SBA composites was found in the range of 2θ = 20–30° due to the amorphous silica walls of mesoporous material [23]. Maghemite/magnetite crystalline peaks were observed at 18.37°, 22.6°, 35.7°, 38.63°, 51.07°, 53.64°, and 66.39° assigned to the (111), (012), (220), (311), (110), (024), (116), and (440) planes, respectively. These main peaks can be indexed as both maghemite (γ-Fe2O3) and cubic Fe3O4 (JCPDS 25-1402). This phenomenon indicated that part of Fe0 on the prepared nZVI surface was oxidized, which may have been caused by brief exposure to air [24]. During the synthesis of the two materials, the reaction conditions were not completely consistent, leading to different degrees of oxidation of Fe0 in the two materials. The nZVI/Zr-Ce-SBA-15 samples did not experience the oxide phenomenon, showing that Zr-Ce-SBA-15 can enhance the purity of Fe0 in comparison to bare nZVI materials.
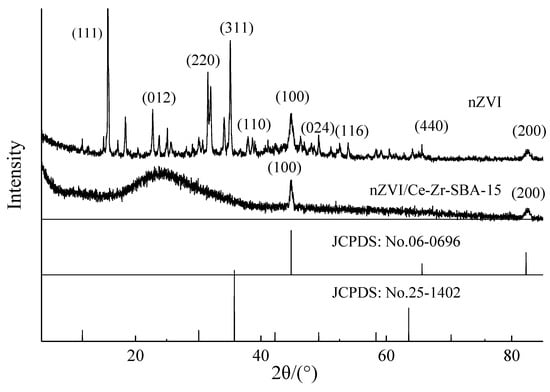
Figure 2.
XRD characterization of nZVI and nZVI/Zr-Ce-SBA-15 composites.
The SEM image of nZVI/Zr-Ce-SBA-15 showed that the sample was composed of several rods and particles with relatively uniform sizes, which are typical morphological characteristics of SBA-15 molecular sieves (Figure 3) [23]. There was C, O, Si, Fe, Zr, and Ce in the tested sample according to EDX analysis. Among them, the particles in Figure 3 agglomerated, which may have been caused by the surface tension or the chemical or hydrogen bonds between the particles. The TEM image shows that a highly regular and orderly mesoporous material was synthesized (Figure 4). The morphology of the synthesized nZVI/Zr-Ce-SBA-15 was hexagonal, and the pore length (i.e., the thickness of the flake particles) was between 300 and 400 nm. The pores were arranged regularly and the direction was parallel to the short axis, which is conducive for organic molecules approaching the active sites on the surface of the adsorbent.
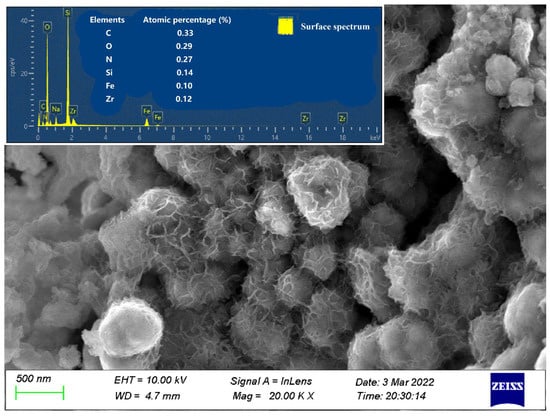
Figure 3.
SEM characterization of nZVI/Zr-Ce-SBA-15 composites; Si and Zr distribution in nZVI/Zr-Ce-SBA-15 composites.
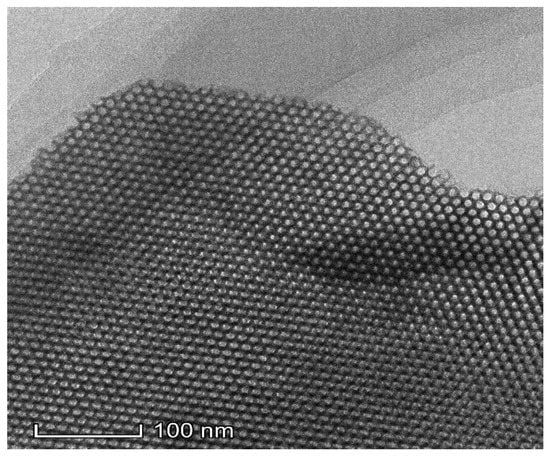
Figure 4.
HRTEM characterization of nZVI/Zr-Ce-SBA-15 composites.
Figure 5 demonstrates that the bands at 539.9 and 671.6 cm−1 in the nZVI spectrum could be attributable to Fe–O, while the band at 834.5 cm−1 could be regarded as the Fe–O–H bending vibration of a-FeOOH particles. The strong band at 3448.5 cm−l was related to the O–H stretching vibrations caused by iron oxyhydroxide, confirming that nZVI was being oxidized. However, nZVI/Zr-Ce-SBA-15 had no absorption peak, indicating that it contained no—or only a small amount of—iron oxide, which is consistent with the above XRD results. In this study, nZVI was easily oxidized, mainly by different mechanisms in aqueous and gaseous media. In particular, nZVI corroded and released electrons in an oxygenated aqueous medium, while in an anaerobic environment, it formed effective redox pairs with water molecules, generated Fe2+ and OH−, and released H2 [25].
Fe0 + 2H2O → Fe2+ + H2 + 2OH−
2Fe0 + O2 + 2H2O → 2Fe2+ + 4OH−
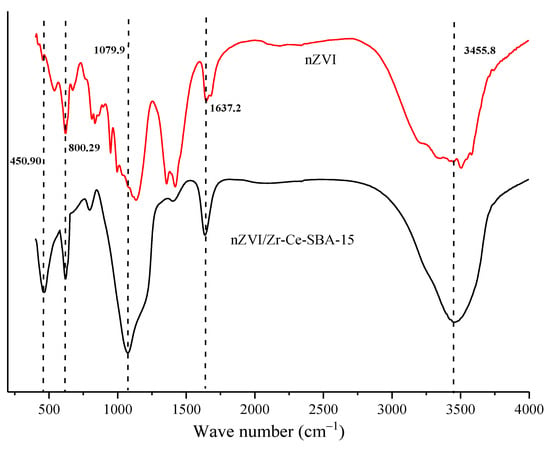
Figure 5.
FTIR characterization of nZVI/Zr-Ce-SBA-15 composites.
In addition, when dried nZVI was in contact with air, its surface oxidized rapidly and formed an iron oxide covering layer with a thickness of 5 nm. With an increase in exposure time, the oxidation rate of nZVI slowed down, while the thickness of the oxide layer remained unchanged after 60 days, and nZVI stopped oxidating [26]. The oxide layer formed in this process prevented the inner layer of Fe0 from providing electrons for further reduction. Many references have reported that partial oxidization on the surface of nZVI is ineluctable in most processes of modifying zero valent iron [27,28]. Although nZVI began being oxidized, Fe0 was still predominant and far greater than the other valence state of Fe, and the above two obvious diffraction peaks of Fe0 in XRD also confirm this. The adsorption peaks at approximately 1646.4 cm−1 were owing to C=O stretching vibration because of CO2 adsorption [29]. In addition, Figure 5 also shows that the peaks at 805.2 cm−1 and 1082.8 cm−1 could be attributed to Si–O–Si symmetric and asymmetric stretching vibration peaks, respectively. The peak intensity at 3450 cm−1 obviously became sharp, indicating that there were massive hydroxyl groups on nZVI /Zr-Ce-SBA-15. The peaks at 1064.9 cm−1 and 3450.0 cm−1 can be attributed to the Si–OH vibration peak, while the peak at 1636.8 cm−1 is the absorption peak of free water [30].
According to IUPAC, the curve of the Zr-Ce-SBA-15 and the nZVI/Zr-Ce-SBA-15 composites belongs to the type IV isotherm, and it had obvious pore condensation, indicating that the synthesized materials were of mesoporous structure (Figure 6a,b). The existence of H1-type adsorption shows that the sample had a columnar pore structure, and these characteristics are unique to mesoporous nZVI /Zr-Ce-SBA-15 materials [30]. With an increase in nZVI, the relative pressure range in the hysteresis loop shifted slightly to a higher pressure, indicating that the pore size of the sample increased, which can be verified from the pore size distribution. nZVI may increase the degree of crosslinking and polycondensation of silicon species to a certain extent. In addition, compared to nZVI and Zr-Ce-SBA-15, the adsorption capacity of N2 increased significantly. The specific surface areas of nZVI, Zr-Ce-SBA-15, and nZVI/Zr-Ce-SBA-15 were 283, 415, and 757 cm2/g, respectively, and generally the larger the specific surface areas of mesoporous materials, the higher the adsorption capabilities for pollutants. The adsorption desorption process can be roughly divided into three processes: (1) In the region with a relatively low equilibrium partial pressure, the adsorption capacity increased with partial pressure, which was mainly due to the monolayer adsorption of N2 on the surface of nZVI/Zr-Ce-SBA-15; (2) In the medium-pressure region (p/p0 > 0.4), N2 adsorption increased rapidly and capillary condensation occurred in the mesoporous channels. The isotherm slope in the sudden jump stage can judge the mesoporous uniformity. The smaller the absolute value of the curve slope, the wider the pore size distribution; (3) In the region of medium- and high-pressure (p/p0 = 0.4–0.9), the amount of N2 adsorption increased slowly, which was caused by multi-layer adsorption. Meanwhile, an obvious H1-type hysteresis loop appeared in the adsorption isotherm. At a high pressure (p/p0 > 0.9), the N2 adsorption capacity of nZVI/Zr-Ce-SBA-15 retained an upward trend, which may have been caused by agglomeration between particles [30].
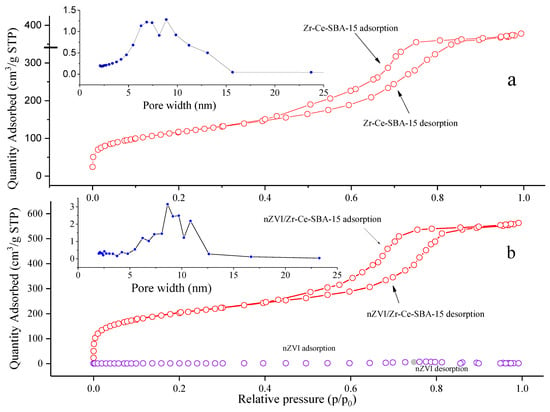
Figure 6.
The pore width (a) and characteristics of N2 adsorption (b) of nZVI/Zr-Ce-SBA-15 composites.
Figure 7 demonstrates that the weight loss curve of nZVI/Zr-Ce-SBA-15 decreased sharply after reaching 100 °C, indicating the loss of a large amount of water in this process. When the temperature rose above 100 °C, the decline of the curve slowed down, indicating that the template contained in the sample decomposed. This process continued until approximately 500 °C, where the curve tended to be flat again, and the decomposition process basically ended. The TGA curve of nZVI/Zr-Ce-SBA-15 was almost a horizontal straight line after 500 °C, which indicates that there was only a small amount of water loss during the heating process. Specifically, there were almost no organic functional groups on nZVI/Zr-Ce-SBA-15, only an SiO2 inorganic skeleton. The thermal weight loss of the sample can be divided into three stages: the loss of water, the decomposition of the template, and the degradation of the inorganic skeleton connecting the bond [31].
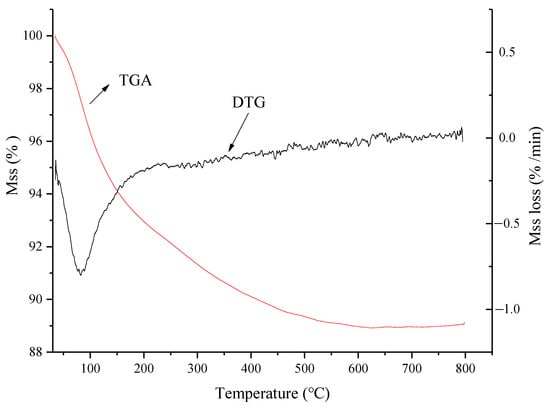
Figure 7.
The characteristics of thermogravimetric analysis of nZVI/Zr-Ce-SBA-15 composites.
3.2. Optimization of the CV Removal from Simulated Wastewater by RSM
The experimental data were analyzed through the BBD model in Design Expert 12.0.6. The quadratic polynomial regression model expressed by the actual value is shown in Formula (7). A positive value in this equation indicates that the influencing factor can improve the CV removal efficiency, while a negative value can reduce it.
y = 90.97 − 0.26x1 − 17.32x2 + 5.84x3 + 0.59x4 + 0.003x1x2 − 0.008x1x3 + 0.001x1x4 − 1.005x2x3 + 0.1375x2x4 − 0.0215x3x4 + 0.0005x12 + 2.650x22 + 0.0725x32 − 0.0133x42
Based on the developed quadratic polynomial regression model, the order of the effects of the four parameters on CV removal is, successively, the initial pH, contact time, temperature, and initial CV concentration. A variance analysis was conducted for the above models, and the results are shown in Table 2. The analysis of variance exhibited a p-value for the model of <0.0001, which is regarded as significant, while the p-value for the lack of fit was 0.1025 > 0.05, which indicates that the lack of fit for the model was not significant, but the regression model was significant. This can well explain the removal of CV by nZVI/Zr-Ce-SBA-15, showing that the regression model is reasonable. In addition, the CV of the model was 0.78% < 10%, indicating that the accuracy and the reliability of the experiment were good. The precision is 65.25 > 4, which shows that the model is reliable. The correlation coefficient (R2) of the model was 0.9957 and the adjusted determination coefficient (Adj. R2) was 0.9913, showing that the regression equation can better explain the relationship between various parameters and the change of the 99.17% response value (Figure 8). The predicted R2 of 0.9767 is in reasonable agreement with the adjusted R2 of 0.9913, i.e., the difference was less than 0.2 (Table 3). Figure 9 demonstrates that the 3D response surface analysis concerning the interaction between the four factors affected the CV removal efficiency. The steeper the 3D surface, the greater the interaction between the two factors.

Table 2.
BBD test scheme and results.
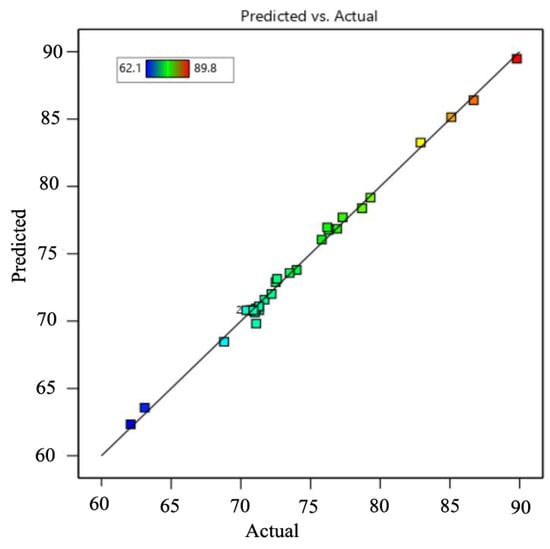
Figure 8.
Comparison with the predicted and actual values.

Table 3.
Response surface variance analysis results.
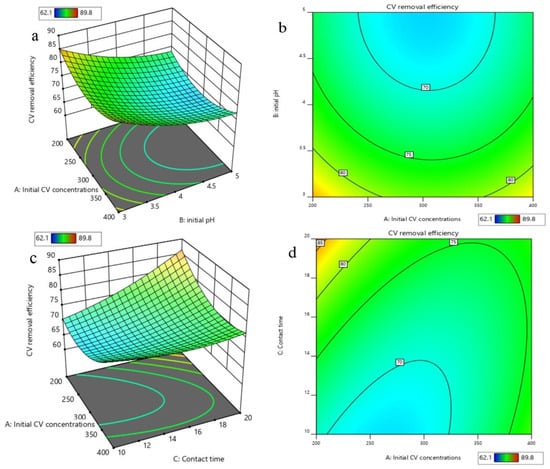
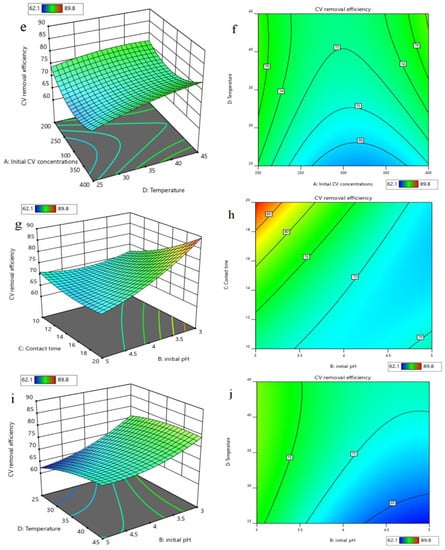
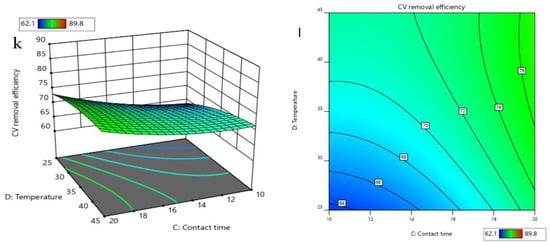
Figure 9.
3D response surface (a) and contour (b) of the effects of initial CV concentration and initial pH on removal efficiencies; 3D response surface (c) and contour (d) of the effects of initial CV concentration and contact time on removal efficiencies; 3D response surface (e) and contour (f) of the effects of initial CV concentration and temperature on removal efficiencies; 3D response surface (g) and contour (h) of the effects of contact time and initial pH on removal efficiencies; 3D response surface (i) and contour (j) of the effects of temperature and initial pH on removal efficiencies; 3D response surface (k) and contour (l) of the effects of temperature and contact time on removal efficiencies.
Based on the analysis of the quadratic fitting model, the optimized experimental conditions within the experimental range of this study were 39.6 °C (temperature), 18.9 min (contact time), 3.00 (initial pH), and 219.6 mg/L (initial CV concentration). Under these optimized parameters, the predicated and the validated CV removal efficiency were 90.24% and 88.11%, respectively, and the absolute error between them was 2.13%. Ebrahim et al. [32] demonstrated that zinc oxide nanorods supported on activate carbon can be used to remove CV from an aqueous solution with the aid of ultrasound. The optimum removal rate of CV on the adsorbent was determined as 99.82% at a pH of 7.0, an adsorbent dosage of 0.025 g, an initial CV concentration of 24 mg/L, and a sonication time of 5.0 min. Satapathy et al. [33] utilized RSM to study the effect of varied environmental parameters on the removal of CV using plant-mediated synthesized AgNPs. Multiple-response optimization was used to the experimental parameters (initial solution pH of 4.0–9.0, time requirement of 30–90 min, and agitation speed of 80–180 rpm), and the optimum removal efficiency of the Ag nanocomposite adsorbent for CV adsorption was 99.995%. Zhang et al. [34] reported that simulated crystal violet dye wastewater was adsorbed and removed by dry poplar leaf powder, and the adsorption conditions were optimized by the Box–Behnken of RSM. The experimental results showed that the pH value, adsorbent dosage, temperature, and initial dye concentration all had obvious effects on the adsorption of crystal violet on the surface of poplar leaves. The maximum removal rate of CV can reach 99.9% with optimal environmental conditions (pH of 8.42, dosage of adsorbent of 0.1 g, temperature of 25 °C, and initial CV concentration of 100 mg/L).
3.3. Optimization the CV Removal from Simulated Wastewater by ANN–PSO and RBF
The experimental data in Table 2 were selected as the training sample of a BP neural network. The 25 and the 4 data were randomly regarded as the training and testing sets in the developed ANN models, respectively. To prevent overfitting, the number in the hidden layer nodes should be selected to be as low as possible under the condition of meeting the training accuracy. The number of hidden layer nodes selected in this experiment was six (Figure 10). The transfer functions of the hidden and output layers were the Tansig and purelin functions, respectively. Meanwhile, the trainbr algorithm was used to train the network, and the training network was terminated after the mean square error reached 1 × 10⁻⁵. Based on the work of Wang et al. [35], the parameters of the developed ANN model were as the follows: Epoch (2000), learning rate (0.1), goal (1 × 10⁻⁵), and momentum factor (0.9). The experimental results show that the sample training achieved convergence quickly (Figure 10). The degree of fitting between the model simulation results and the experimental values was good (Figure 11a,b), and the relative error between them was less than 5%, indicating that the established neural network achieved excellent performance.
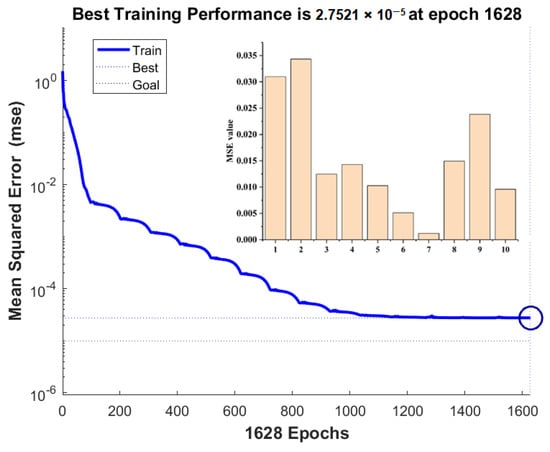
Figure 10.
The training performance of ANN and its MSE value.
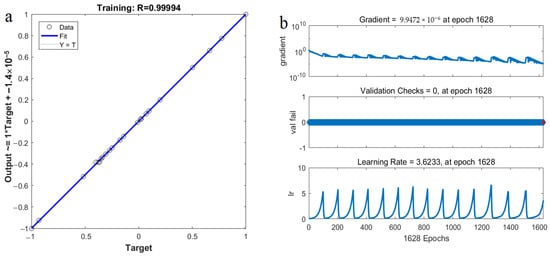
Figure 11.
The correlation coefficient between target and output values and the training parameters in ANN model.
PSO is a random search algorithm based on the mechanism of natural selection and population evolution. It has been applied in many fields with its advantages of high efficiency, adaptability, and global search. It is of a wide search area and fast optimization speed, and the results can be close to the global optimal solution with a high probability. Therefore, an ANN model can be trained globally through the genetic algorithm, and finally the best scheme can be obtained. The basic parameters of PSO, referring to the work of Wang et al. [35], are as follows: a minimum inertia weight of 0.3, a maximum inertia weight of 0.9, C1 and C2 of 2, a group length of 20, and a maximum number of iterations of 500. In this experiment, the optimization process of PSO is shown in Figure 12. After 61 optimization calculations (Figure 12), the optimized results show that the CV removal rate was 93.87% under an initial pH of 3.00, a contact time of 20.00 min, an initial CV concentration of 261.00 mg/L, and a temperature of 45. Based on the above parameters, the experimental removal rate of CV was 93.64%, and the absolute error of the removal efficiencies between the predicted and actual values was merely 0.23%. Ma et al. [36] studied the extraction process of Buyang Huanwu Decoction, and the experimental results showed that the fitting coefficients of the RSM and ANN models were 0.9358 and 0.9889, respectively. The optimal value predicted by the ANN model was closer to the real value, indicating that the fitting effect of ANN is better than that of RSM. Zhou et al. [37] investigated the modeling of the selenium enrichment process of Bacillus subtilis. They also evaluated the advantages and the disadvantages of the model through the mean square error, mean absolute error, and fitting coefficient, and they found that the fitting effect of the ANN model is better. The results also showed that the ANN model is better than the RSM model in terms of fitting effect and reliability. Overall, it can be found that ANN models have a better fitting effect and more reliable fitting results than RSM models. The reason may be that an ANN does not need a standard fitting function or infinite approximation ability for model fitting. Although an ANN has many advantages over RSM, it cannot explain the specific reasoning process. It is easy to fall into the local maximum when calculating extreme values, and overfitting occurs easily in the fitting process. Therefore, to avoid ANN falling into the local maximum and overfitting, it is necessary to consider coupling other analytical methods when using ANNs for modeling [37].
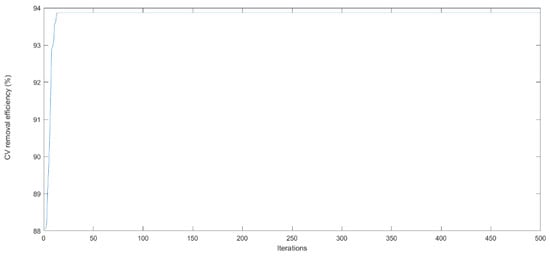
Figure 12.
The predicted optimal CV removal efficiency by ANN-PSO model.
3.4. Kinetic Model, Isothermal Adsorption, and Thermodynamic Parameters for CV Removal
Figure 13 demonstrates that the removal efficiency of CV using nZVI/Zr-Ce-SBA-15 was obviously higher than that of using Zr-Ce-SBA-15, authenticating that the adsorption capacity of Zr-Ce-SBA-15 can be enhanced with the addition of nZVI. This may be due to the two removal mechanisms, prompting adsorption of CV to the nZVI/Zr-Ce-SBA-15 phase and the reduction of CV by Fe0 on nZVI/Zr-Ce-SBA-15. Meanwhile, the removal efficiency of CV in a light environment is slightly higher than that in a dark environment. Under aerobic conditions, the active intermediates produced by the nZVI and O2 systems in the photocatalytic process, including hydrogen peroxide, superoxide radical, and hydroxyl radical, can directly catalyze the oxidation of organic pollutants into inorganic small molecules. It has been reported that the photogenerated electrons produced by nZVI can be transferred to oxygen molecules to form active intermediates, and it can be used for the photocatalytic oxidation of organic pollutants, thus resulting in a higher removal efficiency of CV in light environments in comparison to dark environments [38].
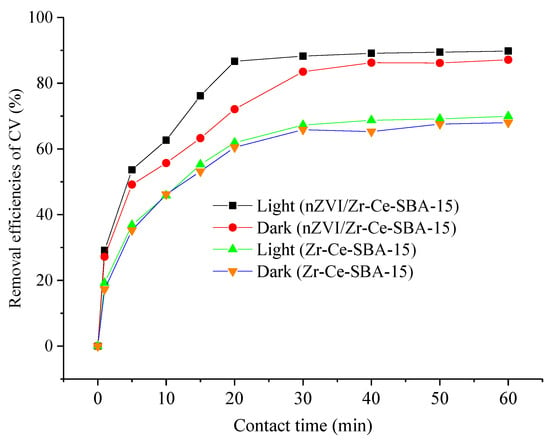
Figure 13.
The adsorption efficiencies of CV adsorption onto Zr-Ce-SBA-15 and nZVI/Zr-Ce--SBA-15 in light and in dark (Zr-Ce-SBA-15 or nZVI/Zr-Ce-SBA-15 = 0.15 g; contact time = 0–60 min, temperature = 298 K, initial CV concentration = 200 mg/L and initial pH = 4).
The kinetics process is mainly used to describe the rate of solute adsorption by an adsorbent. The adsorption mechanism can be inferred by fitting the data with the kinetic model. The experimental data were fitted by two kinetic models [39].
where qe and qt are the adsorption capacity (mg/g) at equilibrium and time t, respectively; k1 (1/min) is the rate constant of the pseudo-first-order adsorption reaction; k2 is the rate constant for the pseudo-second-order adsorption reaction (g/mg·min−1).
For both Zr-Ce-SBA-15 and nZVI/Zr-Ce-SBA-15, the adsorption of CV was very rapid in the first 5 min, and the adsorption equilibrium was basically reached in approximately 20 min. The maximum removal rate of CV by nZVI/Zr-Ce-SBA-15 was 89.73% and 74.25%, respectively. In the early stage of adsorption, CV was quickly adsorbed onto the adsorbent surface. With the progress of the reaction, the content of CV in the solution decreased sharply and the adsorption power decreased. Therefore, the adsorption speed gradually became slow, until the reaction reached equilibrium. In order to fully saturate the adsorption, the test time was 80 min. The correlation coefficients (R2) of the pseudo-second-order kinetic equation fitted by the origin curve were higher than 0.90 (Figure 14a). Moreover, the qe calculated from the pseudo-second-order equation was very close to the experimental qe. The above results show that pseudo-second-order kinetics can better describe the behavior of CV adsorption onto Zr-Ce-SBA-15 and nZVI/Zr-Ce-SBA-15. For both the pseudo-first-order and the pseudo-second-order equations, the qe and the R2 values of Zr-Ce-SBA-15 were obviously lower than those of nZVI/Zr-Ce-SBA-15 (Figure 14b), confirming that the adsorption capacity of Zr-Ce-SBA-15 can be enhanced with the addition of nZVI. The correlation coefficient fitted by the pseudo-first-order kinetics was relatively low, and its corresponding adsorption capabilities calculated from the pseudo-first-order equation were quite different in comparison to the experimental value. This is because the pseudo-first-order equation has limitations. It is usually only suitable for the kinetic description of the initial stage of adsorption but cannot accurately describe the whole process of adsorption. The pseudo-second-order model includes all adsorption processes, such as external liquid film diffusion, surface adsorption, and particle diffusion, which more truly and comprehensively reflects the process of CV adsorption onto Zr-Ce-SBA-15 and nZVI/Zr-Ce-SBA-15. Saeed et al. [40] also found a high correlation (R2 = 0.992), as gained from the linear plot of t/qt, which was close to 1.
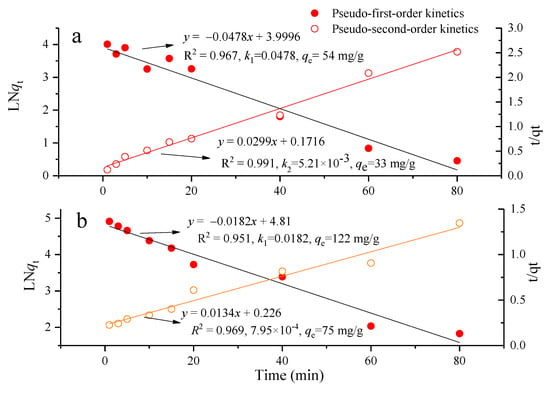
Figure 14.
Comparison of pseudo first and second order kinetic models for Zr-Ce-SBA-15 (a) (Zr-Ce-SBA-15 = 0.15 g; contact time = 1–180 min; initial CV concentration = 60 mg/L and initial pH = 4; temperature = 25 °C) and nZVI/Zr-Ce-SBA-15 (b) (nZVI/Zr-Ce-SBA-15 = 0.15 g; contact time = 1–180 min; initial CV concentration = 60 mg/L and initial pH = 4; temperature = 25 °C).
Because nZVI/Zr-Ce-SBA-15 was simultaneously of adsorption and catalysis in the process of CV removal, isothermal adsorption models were not suitable to describe this adsorption behavior. Therefore, Freundlich and Langmuir models [41] were used to fit the process of CV adsorption onto Zr-Ce-SBA-15. The two models can describe the relationship between the equilibrium concentration of CV and the adsorption capacity of Zr-Ce-SBA-15, and thus indirectly reflect the adsorption capabilities for CV removal by nZVI/Zr-Ce-SBA-15.
where Ce is the equilibrium concentration of CV in the solution (mg/L), qe is the amount of CV adsorbed (mg/g), qmax is qe for a complete monolayer (maximum adsorption capacity) (mg/g), and KL is the adsorption equilibrium constant (L/mg).
Figure 15 shows the adsorption isotherms of CV by Zr-Ce-SBA-15 at three different temperatures (298, 308, and 318 K). With an increase in the initial concentration of CV, the adsorption capacity of Zr-Ce-SBA-15 to CV first increased rapidly, and then increased slowly. This is because the effective contact probability between the adsorbent and CV became higher as the CV concentration increased. In addition, there were a large number of adsorption sites on the surface of the adsorbent that were able to bind to CV; therefore, the early adsorption capacity increased with the increase in the initial concentration of CV. As the initial mass concentration increased, the adsorption sites on the adsorbent surface combined with more CV and gradually saturated. Therefore, the equilibrium concentration of the solution increased and the adsorption capacity increased slowly. Figure 15 demonstrates that the equilibrium adsorption capacity of Zr-Ce-SBA-15 to CV increased with the enhancement of solution temperature, indicating that the adsorption process is an endothermic reaction. Table 4 shows that the Langmuir equation can better describe the behavior of CV adsorption onto Zr-Ce-SBA-15 at different temperatures. The constant n obtained by fitting Freundlich was greater than 1, indicating that the adsorption of CV by Zr-Ce-SBA-15 is preferential. The maximum Langmuir adsorption capacity of Zr-Ce-SBA-15 for CV was 105 mg/g in 218 K. Compared to other adsorbents (Table 5), Zr-Ce-SBA-15 has a higher adsorption quality for CV removal. Combined with Figure 13, we can infer that the adsorption capacity of Zr-Ce-SBA-15 can be significantly enhanced after the addition of nZVI, confirming that nZVI/Zr-Ce-SBA-15 is a potential good adsorbent for CV treatment.
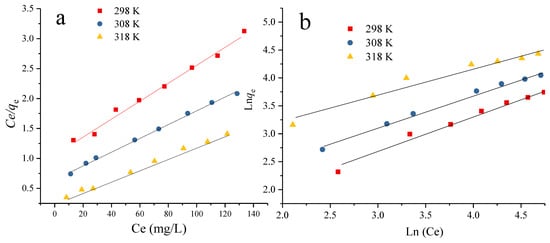
Figure 15.
The fitting processes the Langmuir (a) and Freundlich (b) models for Zr-Ce-SBA-15 (a) (Zr-Ce-SBA-15 = 0.15 g; contact time = 60 min, temperature = 298, 308 or 318 K and initial pH = 4).

Table 4.
Comparing the parameters of Langmuir and Freundlich isothermal adsorption models.

Table 5.
The maximum adsorption capabilities for CV in comparison with other adsorbents.
Adsorption thermodynamics are important for the adsorption mechanism. The parameters, Gibbs free energy change (ΔG0), enthalpy change (ΔH0), and entropy change (ΔS0) are used to describe the effect of temperature on the adsorption equilibrium. ΔG0 (J/mol) can judge the spontaneity of the adsorption reaction. ΔH0 (kJ/mol) is the standard to judge whether the adsorption reaction is an endothermic or an exothermic process. ΔS0 (J/mol·K) represents the change of the degree of freedom of the system. Their equations are as follows [53]:
where ΔH0 is the standard enthalpy change (kJ/mol) and ΔS0 is the standard entropy change (kJ·mol−1·K−1). The values of ΔH0 and ΔS0 can be obtained from the slope and intercept of a plot of lnK0 against 1/T. ΔG0 is the standard free energy change (kJ/mol), T is the temperature (K), and R is the gas constant (8.314 J·mol−1·K−1).
ΔG0 < 0 and ΔH0 > 0 confirm that the adsorption of CV onto nZVI/Zr-Ce-SBA-15 is a spontaneous endothermic process (Table 6). ΔS0 > 0 indicates that the degree of disorder between ions increased in the adsorption process, and it also reveals that more useful CV ligand complexes were formed in the aqueous solution (Figure 16). The higher the temperature, the greater the negative value of ΔG0, indicating that with a higher temperature, CV was adsorbed more easily onto nZVI/Zr-Ce-SBA-15. This is because nZVI/Zr-Ce-SBA-15 has a large number of oxygen-containing functional groups and a flexible structure. With the increase in temperature, more affinity adsorption sites are exposed to CV. On the contrary, when cations are adsorbed in an aqueous solution, they need a dehydration layer to a certain extent, which requires energy, and the isothermal adsorption curve shows that CV adsorption is an endothermic process, which is conducive to the development of adsorption at a high temperature. Generally, when ΔH0 is less than 40 kJ/mol, the force is a van der Waals force, and it belongs to physical adsorption. When 50 kJ/mol < ΔH0 < 200 kJ/mol, the force is a chemical bond, and it belongs to physical adsorption. The adsorption of CV onto nZVI/Zr-Ce-SBA-15 was mainly chemical adsorption, which is also in good agreement with the results of pseudo-second-order kinetic fitting.

Table 6.
The thermodynamics parameters of CV adsorption onto n nZVI/Zr-Ce-SBA-15 composites.
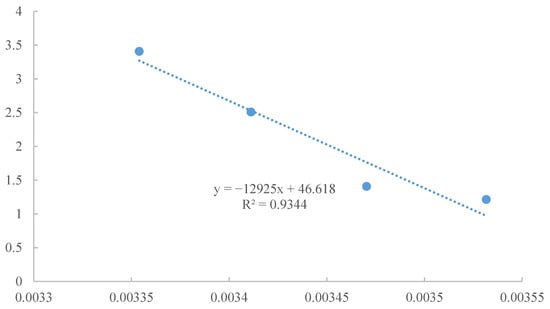
Figure 16.
The fitting process and parameters of thermodynamics.
3.5. Stability and Regeneration of the nZVI/Zr-Ce-SBA-15 Composites
Figure 17a indicates that the dissolution of Fe ions under acidic conditions was far higher than that under neutral and alkaline conditions. In particular, under pH = 3.0, the concentration of Fe ions in the system reached the maximum value (10.1 mg/L) after 6 h of reaction, and then the dissolution of Fe ions gradually decreased. The decrease in the Fe ion concentration may be due to the formation of a covering layer on the Fe0 surface to prevent the generation of Fe ions with the progress of the reaction, and the reaction process constantly consumed Fe ions. When the concentration of consumed Fe ions was greater than the concentration of generated Fe ions, the Fe ion concentration in the whole system was reduced. At pH = 6.5, the Fe ions in the solution decreased gradually after reaching the maximum. At pH = 10.0, the detected Fe ion concentration in the system was less than 0.1 mg/L, which may be completely consumed due to the reaction between iron ions and CV and hydroxyl in the solution. Several research works have reported that Fenton reagent (Fe2+ and H2O) can be produced in aerobic Fe0–H2O systems to oxidize and degrade pollutants.
O2 + Fe0 + 2H+ → Fe2+ + H2O
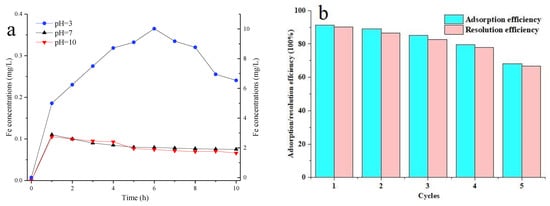
Figure 17.
Fe resolution nZVI/Zr-Ce-SBA-15 under pH = 3, 7 and 10 (a) (nZVI/Zr-Ce-SBA-15 = 3 g/L; contact time = 0–10 h, temperature = 298 K and initial CV concentration = 200 mg/L). The adsorption and desorption efficiencies of CV adsorption onto nZVI/Zr-Ce-SBA-15 (b) (nZVI/Zr-Ce-SBA-15 = 0.15 g; contact time = 20 min, temperature = 298 K, initial CV concentration = 200 mg/L and initial pH = 4)).
The production of H2O2 mainly occurred on the Fe0 surface, and its production was closely related to the pH value in the reaction system. In addition to the direct oxidation of CV by Fe0, the hydroxyl radical produced by Fenton reagent promoted the oxidative degradation of CV [54].
The desorption rate is an important index reflecting the economy of the adsorbent. Therefore, five adsorption desorption cycle tests were conducted to study the reusability of nZVI/Zr-Ce-SBA-15 (Figure 17b). The adsorption rate of CV on nZVI/Zr-Ce-SBA-15 decreased while desorbing with 0.5 mol/L of HCI, while the effective removal of CV was still maintained in the first four experiments (removal rate > 78%). After repeatedly desorbing five times, the adsorption rate decreased significantly, it tended to be stable, and the removal rate of CV was merely 65%. This may be because some H+ occupied the surface binding sites during acid desorption. Although the treated adsorbent was washed many times to reach a neutral state and then reused, the effect of acid treatment was irreversible, resulting in a decrease in the removal rate. Another possible reason is that, due to incomplete acid desorption, some CV still occupied the adsorption sites, resulting in a reduction of adsorption sites. Five adsorption/desorption tests showed that nZVI/Zr-Ce-SBA-15 composites had a strong renewable ability in the short term, and repeated recycling reduced its adsorption capacity.
4. Conclusions
The present study demonstrated the fabrication of nZVI/Zr-Ce-SBA-15 composites and their application in CV removal from simulated wastewater. According to XRD, FTIR, SEM, TEM, N2 adsorption, and thermogravimetric analyses, nZVI was supported successfully onto Zr-Ce-SBA-15 composites, and it ordered mesoporous materials. The thermal weight loss of the sample can be divided into three stages: the loss of water (100 °C), the decomposition of the template (500 °C), and the degradation of the inorganic skeleton connecting the bond (>500 °C). Based on the developed quadratic polynomial regression model, the order of the effects of the four parameters on CV removal was, successively, initial pH, contact time, temperature, and initial CV concentration. ANN-PSO was more suitable for optimizing the experimental parameters for CV removal from simulated wastewater, using the ordered mesoporous nZVI/Zr-Ce-SBA-15 composites. Specially, after 61 optimization calculations, the optimized results showed that the CV removal rate was 93.87% under an initial pH of 3.00, contact time of 20.00 min, initial CV concentration of 261.00 mg/L, and temperature of 45. The experimental removal rate of CV was 93.64%, and the absolute error of the removal efficiency between the predicted and the actual values was merely 0.23%. Pseudo-second-order kinetics can better describe the behavior of CV adsorption onto nZVI/Zr-Ce-SBA-15 composites. The process of CV adsorption onto Zr-Ce-SBA-15 composites followed the Langmuir model, and its maximum adsorption capacity was 105 mg/g in 213 K. It was indirectly confirmed that the maximum adsorption capacity of nZVI/Zr-Ce-SBA-15 exceeded this value because the removal efficiency of CV using nZVI/Zr-Ce-SBA-15 was obviously higher than that of using Zr-Ce-SBA-15. The results of the thermodynamic analysis indicated that the CV adsorption onto nZVI/Zr-Ce-SBA-15 was a spontaneous, endothermic, and entropy-driven process. The dissolution of Fe ions and light/dark experiments confirmed nZVI/Zr-Ce-SBA-15 was simultaneously of adsorption and of catalysis in the process of CV removal. The effective removal of CV was still maintained in the first four experiments (removal rate > 78%), and compared to other adsorbents, our suggestion is that nZVI/Zr-Ce-SBA-15 is a potential adsorbent for CV remediation from wastewater.
Supplementary Materials
The following supporting information can be downloaded at: https://www.mdpi.com/article/10.3390/su14116566/s1, Figure S1: The effect of parameters on CV removal efficiency using nZVI/Zr-Ce-SBA-15 composites.
Author Contributions
Writing—original draft preparation, G.X.; writing—review, G.X., S.L. and A.D. All authors have read and agreed to the published version of the manuscript.
Funding
This work was supported by the National Science and technology infrastructure platform project of the Ministry of science and technology (Plant sub platform of “national specimen resource sharing platform”) (2005DKA21401).
Institutional Review Board Statement
Not applicable.
Informed Consent Statement
Not applicable.
Data Availability Statement
Data from this paper are available from Google Scholar, Web of Science, China National Knowledge Infrastructure, China Wan Fang Literature Database, and China WeiPu Literature Database.
Conflicts of Interest
The authors declare no conflict of interest.
References
- Wathukarage, A.; Herath, I.; Iqbal, M.; Vithanage, M. Mechanistic understanding of crystal violet dye sorption by woody biochar: Implications for wastewater treatment. Environ. Geochem. Health 2017, 41, 1647–1661. [Google Scholar] [CrossRef] [PubMed]
- Sabna, V.; Thampi, S.G.; Chandrakaran, S. Adsorption of crystal violet onto functionalised multi-walled carbon nanotubes: Equilibrium and kinetic studies. Ecotox. Environ. Saf. 2016, 134, 390–397. [Google Scholar] [CrossRef] [PubMed]
- Eldad, S.; Revital, S.; Adi, E.; Asher, Z.; Gilad, B.G.; Esi, S.; Yoav, P.; Yael, H.H.; Nurit, B. Antibacterial Activity of Orthodontic Cement Containing Quaternary Ammonium Polyethylenimine Nanoparticles Adjacent to Orthodontic Brackets. Int. J. Environ. Res. Public Health 2018, 15, 606–611. [Google Scholar]
- Ma, D.L.; Kwan, M.H.T.; Chan, D.S.H.; Lee, P.; Yang, H.; Ma, V.P.Y.; Bai, L.P.; Jiang, Z.H.; Leung, C.H. Crystal violet as a fluorescent switch-on probe for i-motif: Label-free DNA-based logic gate. Analyst 2011, 136, 2692–2696. [Google Scholar] [CrossRef]
- Li, C.; Huang, Y.; Pei, L. Analyses of Trace Crystal Violet and Leucocrystal Violet with Gold Nanospheres and Commercial Gold Nanosubstrates for Surface-Enhanced Raman Spectroscopy. Food Anal. Method 2014, 7, 2107–2112. [Google Scholar] [CrossRef]
- Oplatowska, M.; Donnelly, R.F.; Majithiya, R.J.; Kennedy, D.G.; Elliott, C.T. The potential for human exposure, direct and indirect, to the suspected carcinogenic triphenylmethane dye Brilliant Green from green paper towels. Food Chem. Toxicol. 2011, 49, 1870–1876. [Google Scholar] [CrossRef]
- Xiao, H.P.; Han, S.; He, Z.Y. Research Progress on Detection of Crystal Violet in Aquatic Products. Adv. Mater. Res. 2011, 396–398, 2452–2458. [Google Scholar] [CrossRef]
- Ghosh, K.; Bar, N.; Biswas, A.B. Elimination of crystal violet from synthetic medium by adsorption using unmodified and acid-modified eucalyptus leaves with MPR and GA application. Sustain. Chem. Pharm. 2021, 1, 100370. [Google Scholar] [CrossRef]
- Upama, B.; Avijit, D.; Manna, U. Synthesis of Dual-Functional and Robust Underwater Superoleophobic Interfaces. ACS Appl. Mater. Interfaces 2019, 11, 28571–28581. [Google Scholar]
- Wei, S.; Wang, Y.; Lu, Y.; Hu, A.; Fan, S.; Sun, Z. High sensitive simultaneously electrochemical detection of hydroquinone and catechol with a poly(crystal violet) functionalized graphene modified carbon ionic liquid electrode. Sens. Actuators B Chem. 2013, 188, 564–570. [Google Scholar]
- Rani, U.A.; Ng, L.Y.; Ng, C.Y.; Mahmoudi, E.; Hairom, N.H.H. Photocatalytic degradation of crystal violet dye using sulphur-doped carbon quantum dots. Mater. Today Proc. 2021, 46, 1934–1939. [Google Scholar] [CrossRef]
- Njiki, A.; Youbi, G.K.; Laminsi, S. Gliding arc discharge-assisted biodegradation of crystal violet in solution with Aeromonas hydrophila strain. Int. J. Environ. Sci. Technol. 2015, 13, 263–274. [Google Scholar] [CrossRef] [Green Version]
- Mittal, A.; Mittal, J.; Malviya, A. Adsorption of hazardous dye crystal violet from wastewater by waste materials. J. Colloid Interfaces Sci. 2010, 343, 463–473. [Google Scholar] [CrossRef] [PubMed]
- Ryu, S.C.; Naidu, G.; Moon, H.; Vigneswaran, S. Continuous and selective copper recovery by multi-modified and granulated SBA-15. Chemosphere 2021, 271, 129820. [Google Scholar] [CrossRef] [PubMed]
- Kumaravel, S.; Thiripuranthagan, S.; Vembuli, T. Fabrication of mesoporous WO3-SBA-15 catalysts and enhanced photocatalytic degradation of harmful dyes. Optik 2021, 235, 166599. [Google Scholar] [CrossRef]
- Chong, C.C.; Cheng, Y.W.; Bukhari, S.N. Methane dry reforming over Ni/fibrous SBA-15 catalysts: Effects of support morphology (rod-liked F-SBA-15 and dendritic DFSBA-15). Catal. Today 2020, 375, 245–257. [Google Scholar] [CrossRef]
- Zhang, R.M.; Han, C.H.; Qi, L. Reduction of nitrobenzene by supported nano zero valent iron and changes of iron morphology. Hubei Agric. Sci. 2017, 56, 5–12. (In Chinese) [Google Scholar]
- Zhang, R.M.; Li, J.S.; Guan, Y. Reduction of Trinitrotoluene by Nanoscale Zero-Valent Iron Confined in Mesoporous Channels. Technol. Water Treat. 2017, 43, 5–11. (In Chinese) [Google Scholar]
- Yuan, J.F.; Li, J.S.; Shen, Z.H. Synthesis and Morphological Control of ’Zr-Ce-SBA-15 Mesoporous Materials. Rare Met. Mater. Eng. 2011, 40, 6–10. (In Chinese) [Google Scholar]
- Zhou, J.; Zhou, Y.; You, X. Potential promotion of activated carbon supported nano zero-valent iron on anaerobic digestion of waste activated sludge. Environ. Technol. 2021, 11, 1–34. [Google Scholar] [CrossRef]
- Tang, L.; Tang, J.; Zeng, G. Rapid reductive degradation of aqueous p-nitrophenol using nanoscale zero-valent iron particles immobilized on mesoporous silica with enhanced antioxidation effect. Appl. Surf. Sci. 2015, 333, 220–228. [Google Scholar] [CrossRef]
- Arjomand, M.A.; Mostafaei, Y.; Kutanaei, S.S. Modeling and sensitivity analysis of bearing capacity in driven piles using hybrid ANN–PSO algorithm. Arab. J. Geosci. 2022, 15, 309. [Google Scholar] [CrossRef]
- Li, G.; Wang, B.; Sun, B.; Xu, W.; Han, Y. Adsorption of lead ion on amino-functionalized fly-ash-based SBA-15 mesoporous molecular sieves prepared via two-step hydrothermal method. Micropor. Mesopor. Mat. 2017, 252, 105–115. [Google Scholar] [CrossRef]
- Zhang, C.A.; Jin, L.; Huang, Y.P. Anti-oxidation ability of nanoscale zero valent iron viaacetone flushing method. Environ. Chem. 2021, 40, 790–798. (In Chinese) [Google Scholar]
- Chen, Q.; Li, J.; Wu, Y. Biological responses of Gram-positive and Gram-negative bacteria to nZVI (Fe0), Fe2+ and Fe3+. RSC Adv. 2013, 3, 13835–13842. [Google Scholar] [CrossRef]
- Semerád, J.; Filip, J.; Evc, A. Environmental fate of sulfidated nZVI particles: The interplay of nanoparticle corrosion and toxicity during aging. Environ. Sci. Nano 2020, 7, 1794–1806. [Google Scholar] [CrossRef]
- Chao, X.; Peng, Y.M.; Chen, A.W. Drastically inhibited nZVI-Fenton oxidation of organic pollutants by cysteine: Multiple roles in the nZVI/O2/hv system. J. Colloid Interfaces Sci. 2021, 582, 22–29. [Google Scholar]
- Shan, A.; Idrees, A.; Zaman, W.Q. Synthesis of nZVI-Ni@BC composite as a stable catalyst to activate persulfate: Trichloroethylene degradation and insight mechanism. J. Environ. Chem. Eng. 2021, 9, 104808. [Google Scholar] [CrossRef]
- Yang, D.; Wang, L.; Li, Z. Simultaneous adsorption of Cd(II) and As(III) by a novel biochar-supported nanoscale zero-valent iron in aqueous systems. Sci. Total Environ. 2019, 708, 134823. [Google Scholar] [CrossRef]
- Guo, Y.; Jiang, X.Q.; Wu, H.M. Preparation of 2-hydroxy-1-naphthalene Functionalized SBA-15 Adsorbent for the Adsorption of Chromium(III) Ions from Aqueous Solution. J. Inorg. Mater. 2021, 36, 1163–1170. (In Chinese) [Google Scholar] [CrossRef]
- Anbarasu, G.; Malathy, M.; Karthikeyan, P.; Rajavel, R. Silica functionalized Cu(II) acetylacetonate Schiff base complex: An efficient catalyst for the oxidative condensation reaction of benzyl alcohol with amines. J. Solid State Chem. 2017, 253, 305–312. [Google Scholar] [CrossRef]
- Ebrahim, A.D.; Mehrorang, G.; Abdolmohammad, G. Application of artificial neural network and response surface methodology for the removal of crystal violet by zinc oxide nanorods loaded on activate carbon: Kinetics and equilibrium study. J. Taiwan Inst. Chem. Eng. 2016, 59, 210–220. [Google Scholar]
- Satapathy, M.K.; Das, P. Optimization of crystal violet dye removal using novel soil-silver nanocomposite as nanoadsorbent using response surface methodology. J. Environ. Chem. Eng. 2014, 2, 708–714. [Google Scholar] [CrossRef]
- Zhang, Q.L.; Wang, L.P.; Li, Y.Y.; Xu, Y.N.; Zhang, L.Q. Study on adsorption of crystal violet dye by poplar leaf dry powder by Response Surface Methodology. New Chem. Mater. 2016, 44, 4–10. (In Chinese) [Google Scholar]
- Wang, W.Y.; Wu, X.L.; Long, S.X. Optimizing the Methylene Blue Removal from Aqueous Solution Using Pomelo Peel Based Biochar Assisted by RSM and ANN-PSO. Pol. J. Environ. Stud. 2022, 31, 329–346. [Google Scholar] [CrossRef]
- Ma, J.C.; Ma, D.L.; Zhang, H.L. Extraction Process Optimization for Buyanghuanwu Decoction by Response Surface Methodology and Back Propagation Artificial Neural Network. Lishizhen Med. Mater. Med. Res. 2019, 2, 4–10. [Google Scholar]
- Zhou, M.Z.; Wu, S.; Liu, N. Modelling Research of the Selenium Enrichment by Bacillus subtilis Base on Artificial Neural Network. J. Chin. Inst. Food Sci. Technol. 2016, 16, 9–18. (In Chinese) [Google Scholar]
- Kang, S.H.; Choi, W. Oxidative degradation of organic compounds using zero-valent iron in the presence of natural organic matter serving as an electrorshuttle. Environ. Sci. Technol. 2008, 43, 878–883. [Google Scholar] [CrossRef]
- Zhou, D.; Brusseau, M.L.; Zhang, Y. Simulating PFAS adsorption kinetics, adsorption isotherms, and nonideal transport in saturated soil with tempered one-sided stable density (TOSD) based models. J. Hazard. Mater. 2021, 411, 125169. [Google Scholar] [CrossRef]
- Saeed, A.; Sharif, M.; Iqbal, M. Application potential of grapefruit peel as dye sorbent: Kinetics, equilibrium and mechanism of crystal violet adsorption. J. Hazard. Mater. 2010, 179, 564–572. [Google Scholar] [CrossRef]
- Wang, C.; Zou, C.; Cao, Y. Electrochemical and isothermal adsorption studies on corrosion inhibition performance of β-cyclodextrin grafted polyacrylamide for X80 steel in oil and gas production. J. Mol. Struct. 2020, 1228, 129737. [Google Scholar] [CrossRef]
- Madhavakrishnan, S.; Manickavasagam, K.; Vasanthakumar, R. Adsorption of Crystal Violet Dye from Aqueous Solution Using Ricinus Communis Pericarp Carbon as an Adsorbent. J. Chem. 2009, 6, 1109–1116. [Google Scholar]
- Zhang, Y.; Li, J.; Cheng, X.; Bian, W.; Chen, G. Fabrication of a polymer electrolyte membrane with uneven side chains for enhancing proton conductivity. RSC Adv. 2016, 6, 51337–51346. [Google Scholar] [CrossRef]
- Gopi, S.; Pius, A.; Thomas, S. Enhanced adsorption of crystal violet by synthesized and characterized chitin nano whiskers from shrimp shell. J. Water Process Eng. 2016, 14, 1–8. [Google Scholar] [CrossRef]
- Chen, X.; Chin, C.J.M. Adsorption and desorption of crystal violet and basic red 9 by multi-walled carbon nanotubes. Water Sci. Technol. 2019, 79, 1541–1549. [Google Scholar] [CrossRef]
- Qin, J.; Qiu, F.; Rong, X.; Yan, J.; Zhao, H.; Yang, D. Adsorption behavior of crystal violet from aqueous solutions with chitosan–graphite oxide modified polyurethane as an adsorbent. J. Appl. Polym. Sci. 2015, 132, 41828. [Google Scholar] [CrossRef]
- Malarvizhi, R.; Ho, Y.S. The influence of pH and the structure of the dye molecules on adsorption isotherm modeling using activated carbon. Desalin 2010, 264, 97–101. [Google Scholar] [CrossRef]
- Kannan, C.; Buvaneswari, N.; Palvannan, T. Removal of plant poisoning dyes by adsorption on Tomato Plant Root and green carbon from aqueous solution and its recovery. Desalination 2009, 249, 1132–1138. [Google Scholar] [CrossRef]
- Karagöz, S.; Tay, T.; Ucar, S.; Erdem, M. Activated carbons from waste biomass by sulfuric acid activation and their use on methylene blue adsorption. Bioresour. Technol. 2008, 99, 6214–6222. [Google Scholar] [CrossRef]
- Aygün, A.; Yenisoy-Karaka, S.; Duman, I. Production of granular activated carbon from fruit stones and nutshells and evaluation of their physical, chemical and adsorption properties. Micropor. Mesopor. Mater. 2003, 66, 189–195. [Google Scholar] [CrossRef]
- Kavitha, D.; Namasivayam, C. Experimental and kinetic studies on methylene blue adsorption by coir pith carbon. Bioresour. Technol. 2007, 98, 14–21. [Google Scholar] [CrossRef]
- El-Sayed, G.O. Removal of methylene blue and crystal violet from aqueous solutions by palm kernel fiber. Desalination 2011, 272, 225–232. [Google Scholar] [CrossRef]
- Altameemi, I.A.; Thuraya, M.A. Removal of manganese (Mn+2) from aqueous solution by low-cost adsorbents and study the adsorption thermodynamics and kinetics. J. Phys. Conf. Ser. 2021, 1773, 012038. [Google Scholar] [CrossRef]
- Wan, Y.C.; Qiao, X.L.; Huang, L.P. Study on removal of molybdenum from water by zero valent iron. Environ. Sci. Technol. 2007, 30, 69–71. (In Chinese) [Google Scholar]
Publisher’s Note: MDPI stays neutral with regard to jurisdictional claims in published maps and institutional affiliations. |
© 2022 by the authors. Licensee MDPI, Basel, Switzerland. This article is an open access article distributed under the terms and conditions of the Creative Commons Attribution (CC BY) license (https://creativecommons.org/licenses/by/4.0/).