
Characterization and Analysis of Acetaldehyde Wastewater by Molecular Weight Distribution, Hydrophilicity, and Chemical Composition

 ,
,
Abstract
:1. Introduction
2. Materials and Methods
2.1. Wastewater Collection and Storage
2.2. Conventional Characterizations
2.3. Organic Carbon Analysis
2.4. 3D EEM Fluorescence Spectroscopy Analysis
2.5. Ultrafiltration Membrane Filtration
2.6. Resin Fractionation
2.7. Liquid–Liquid Extraction/GC-MS (LLE-GC-MS)
2.8. Purge and Trap-GC/MS
3. Results and Discussions
3.1. The MW Size Distribution of Acetaldehyde Wastewater
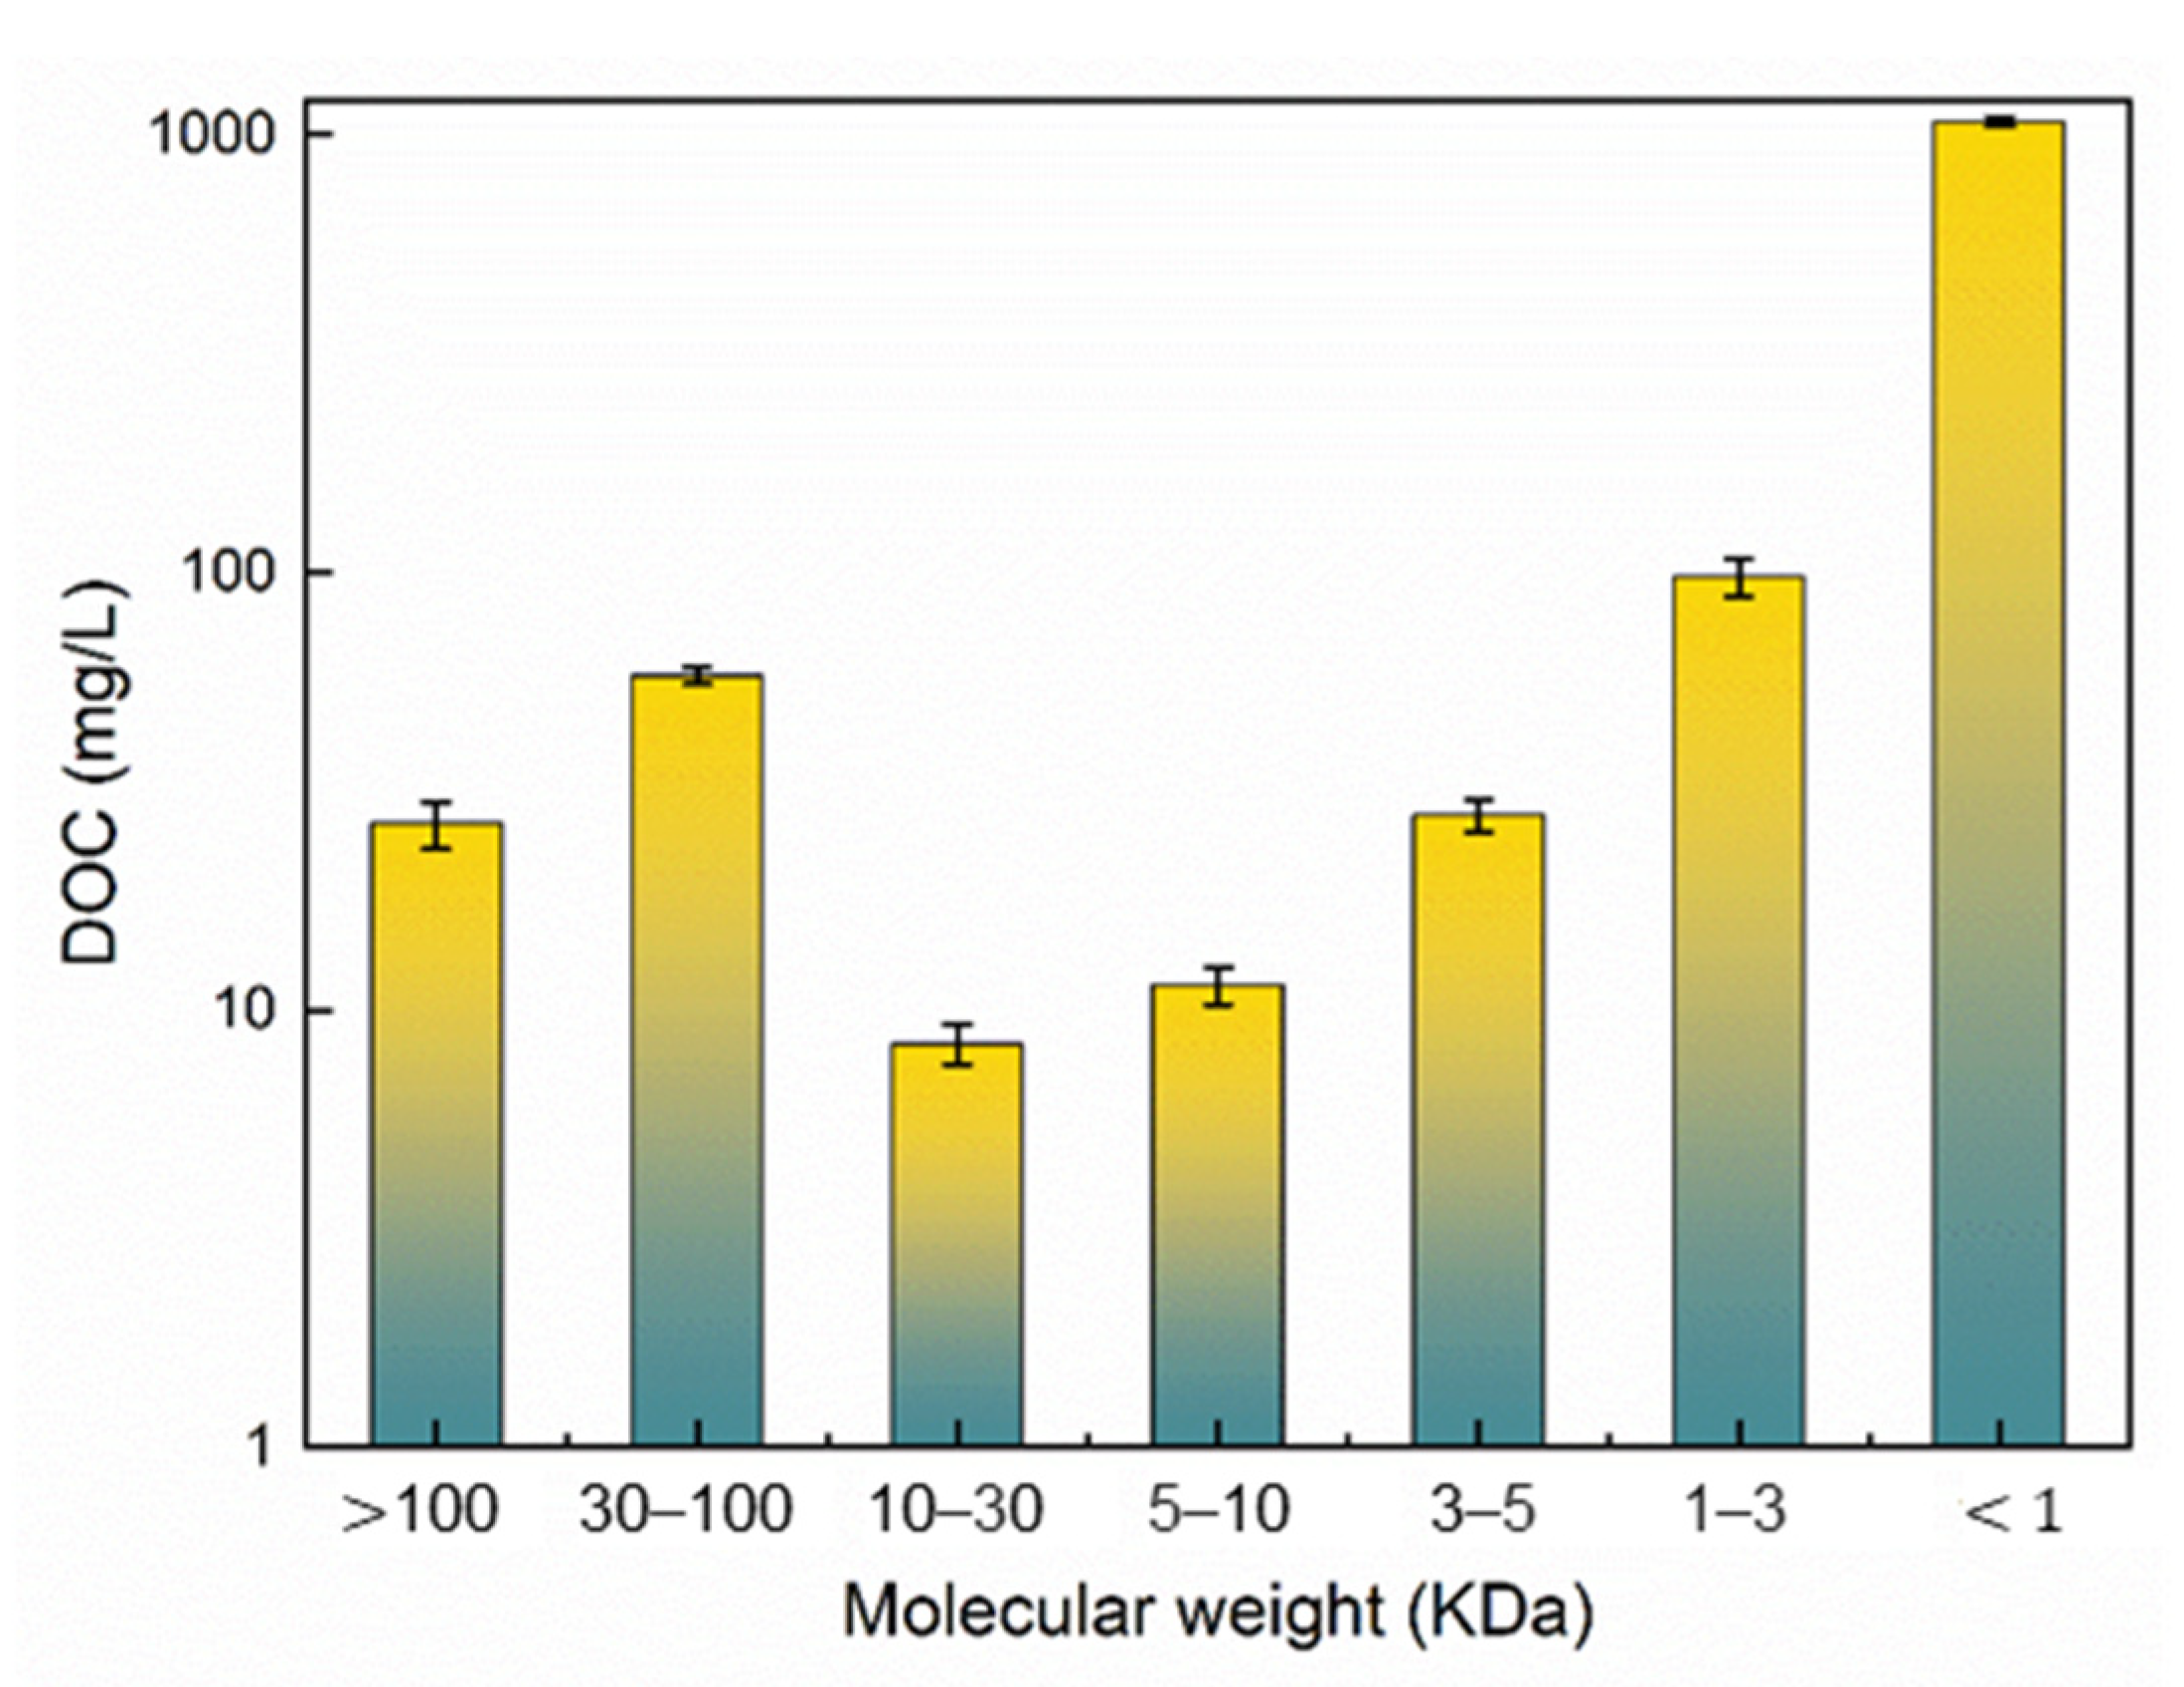
3.1.1. DOC Distributions Based on MW
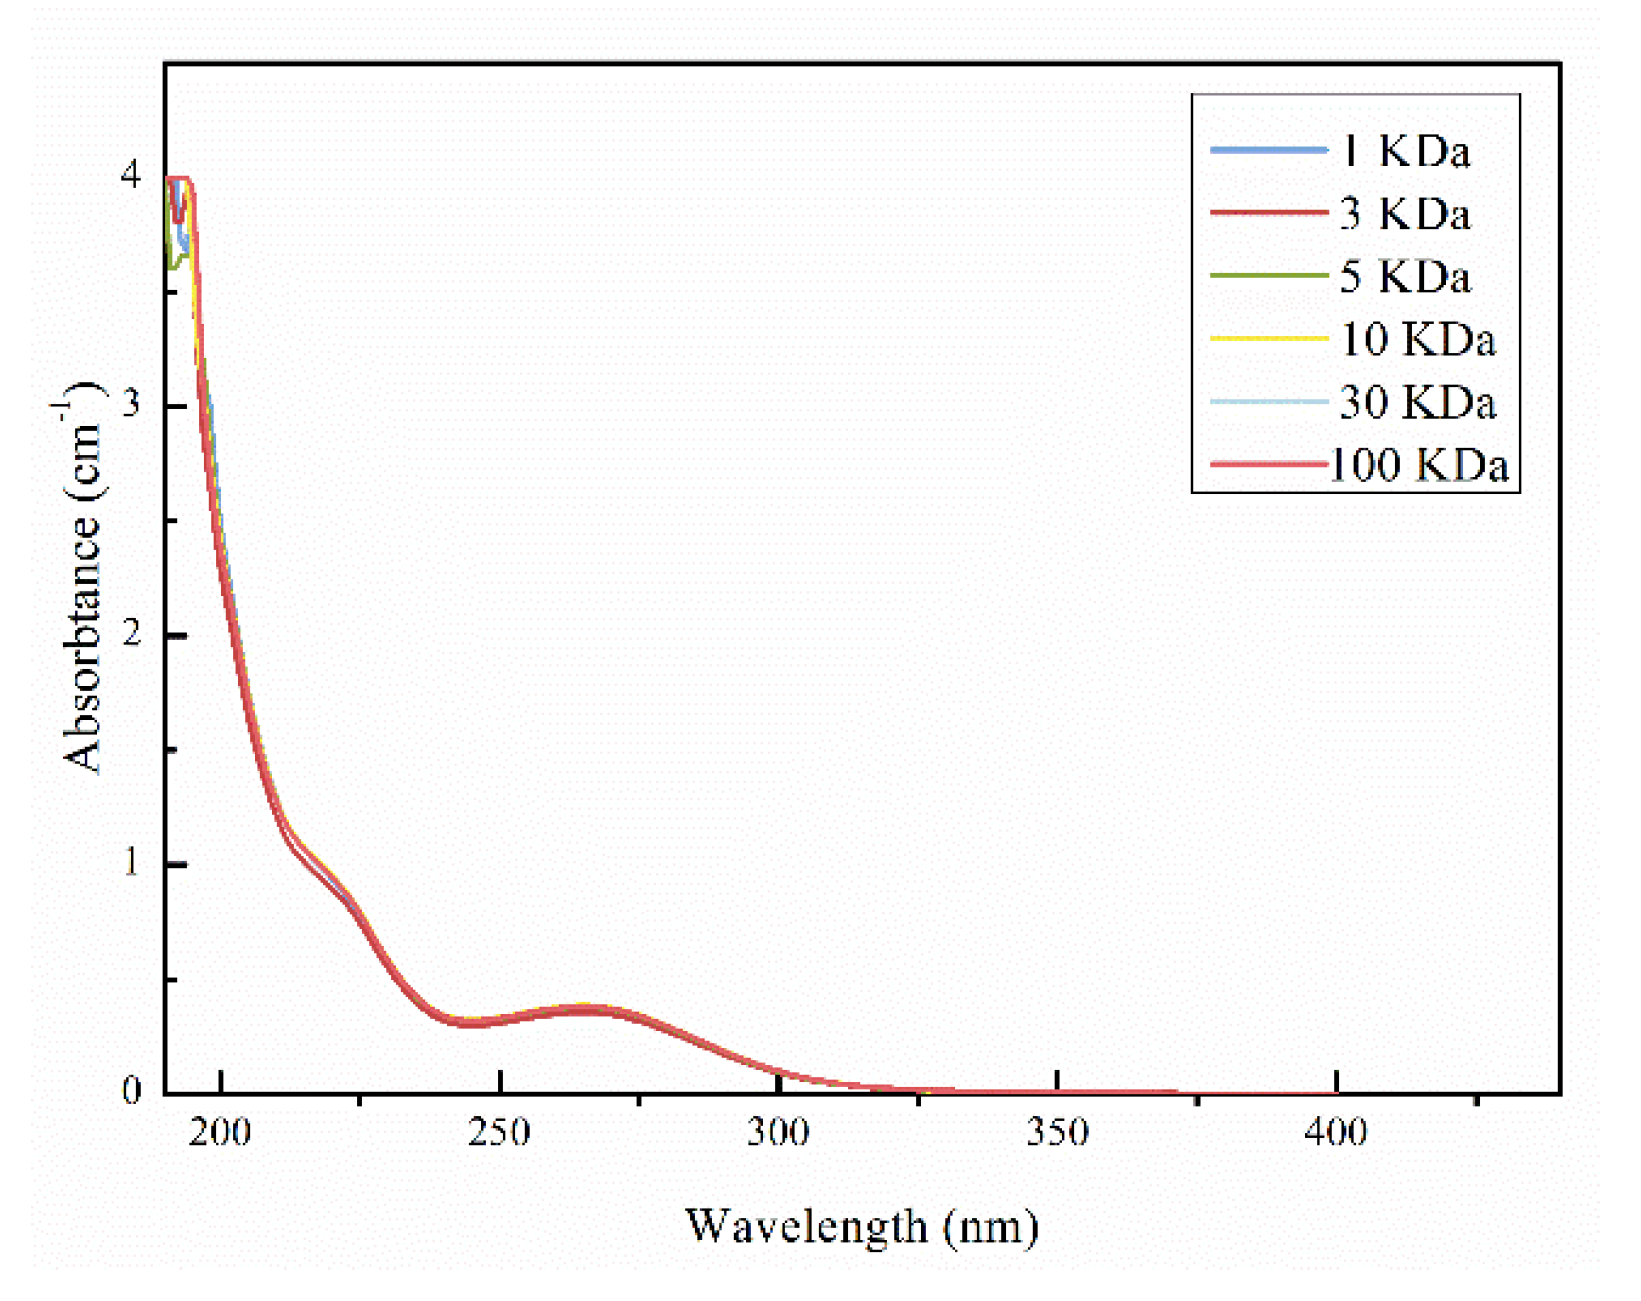
3.1.2. UV Distributions Based on MW
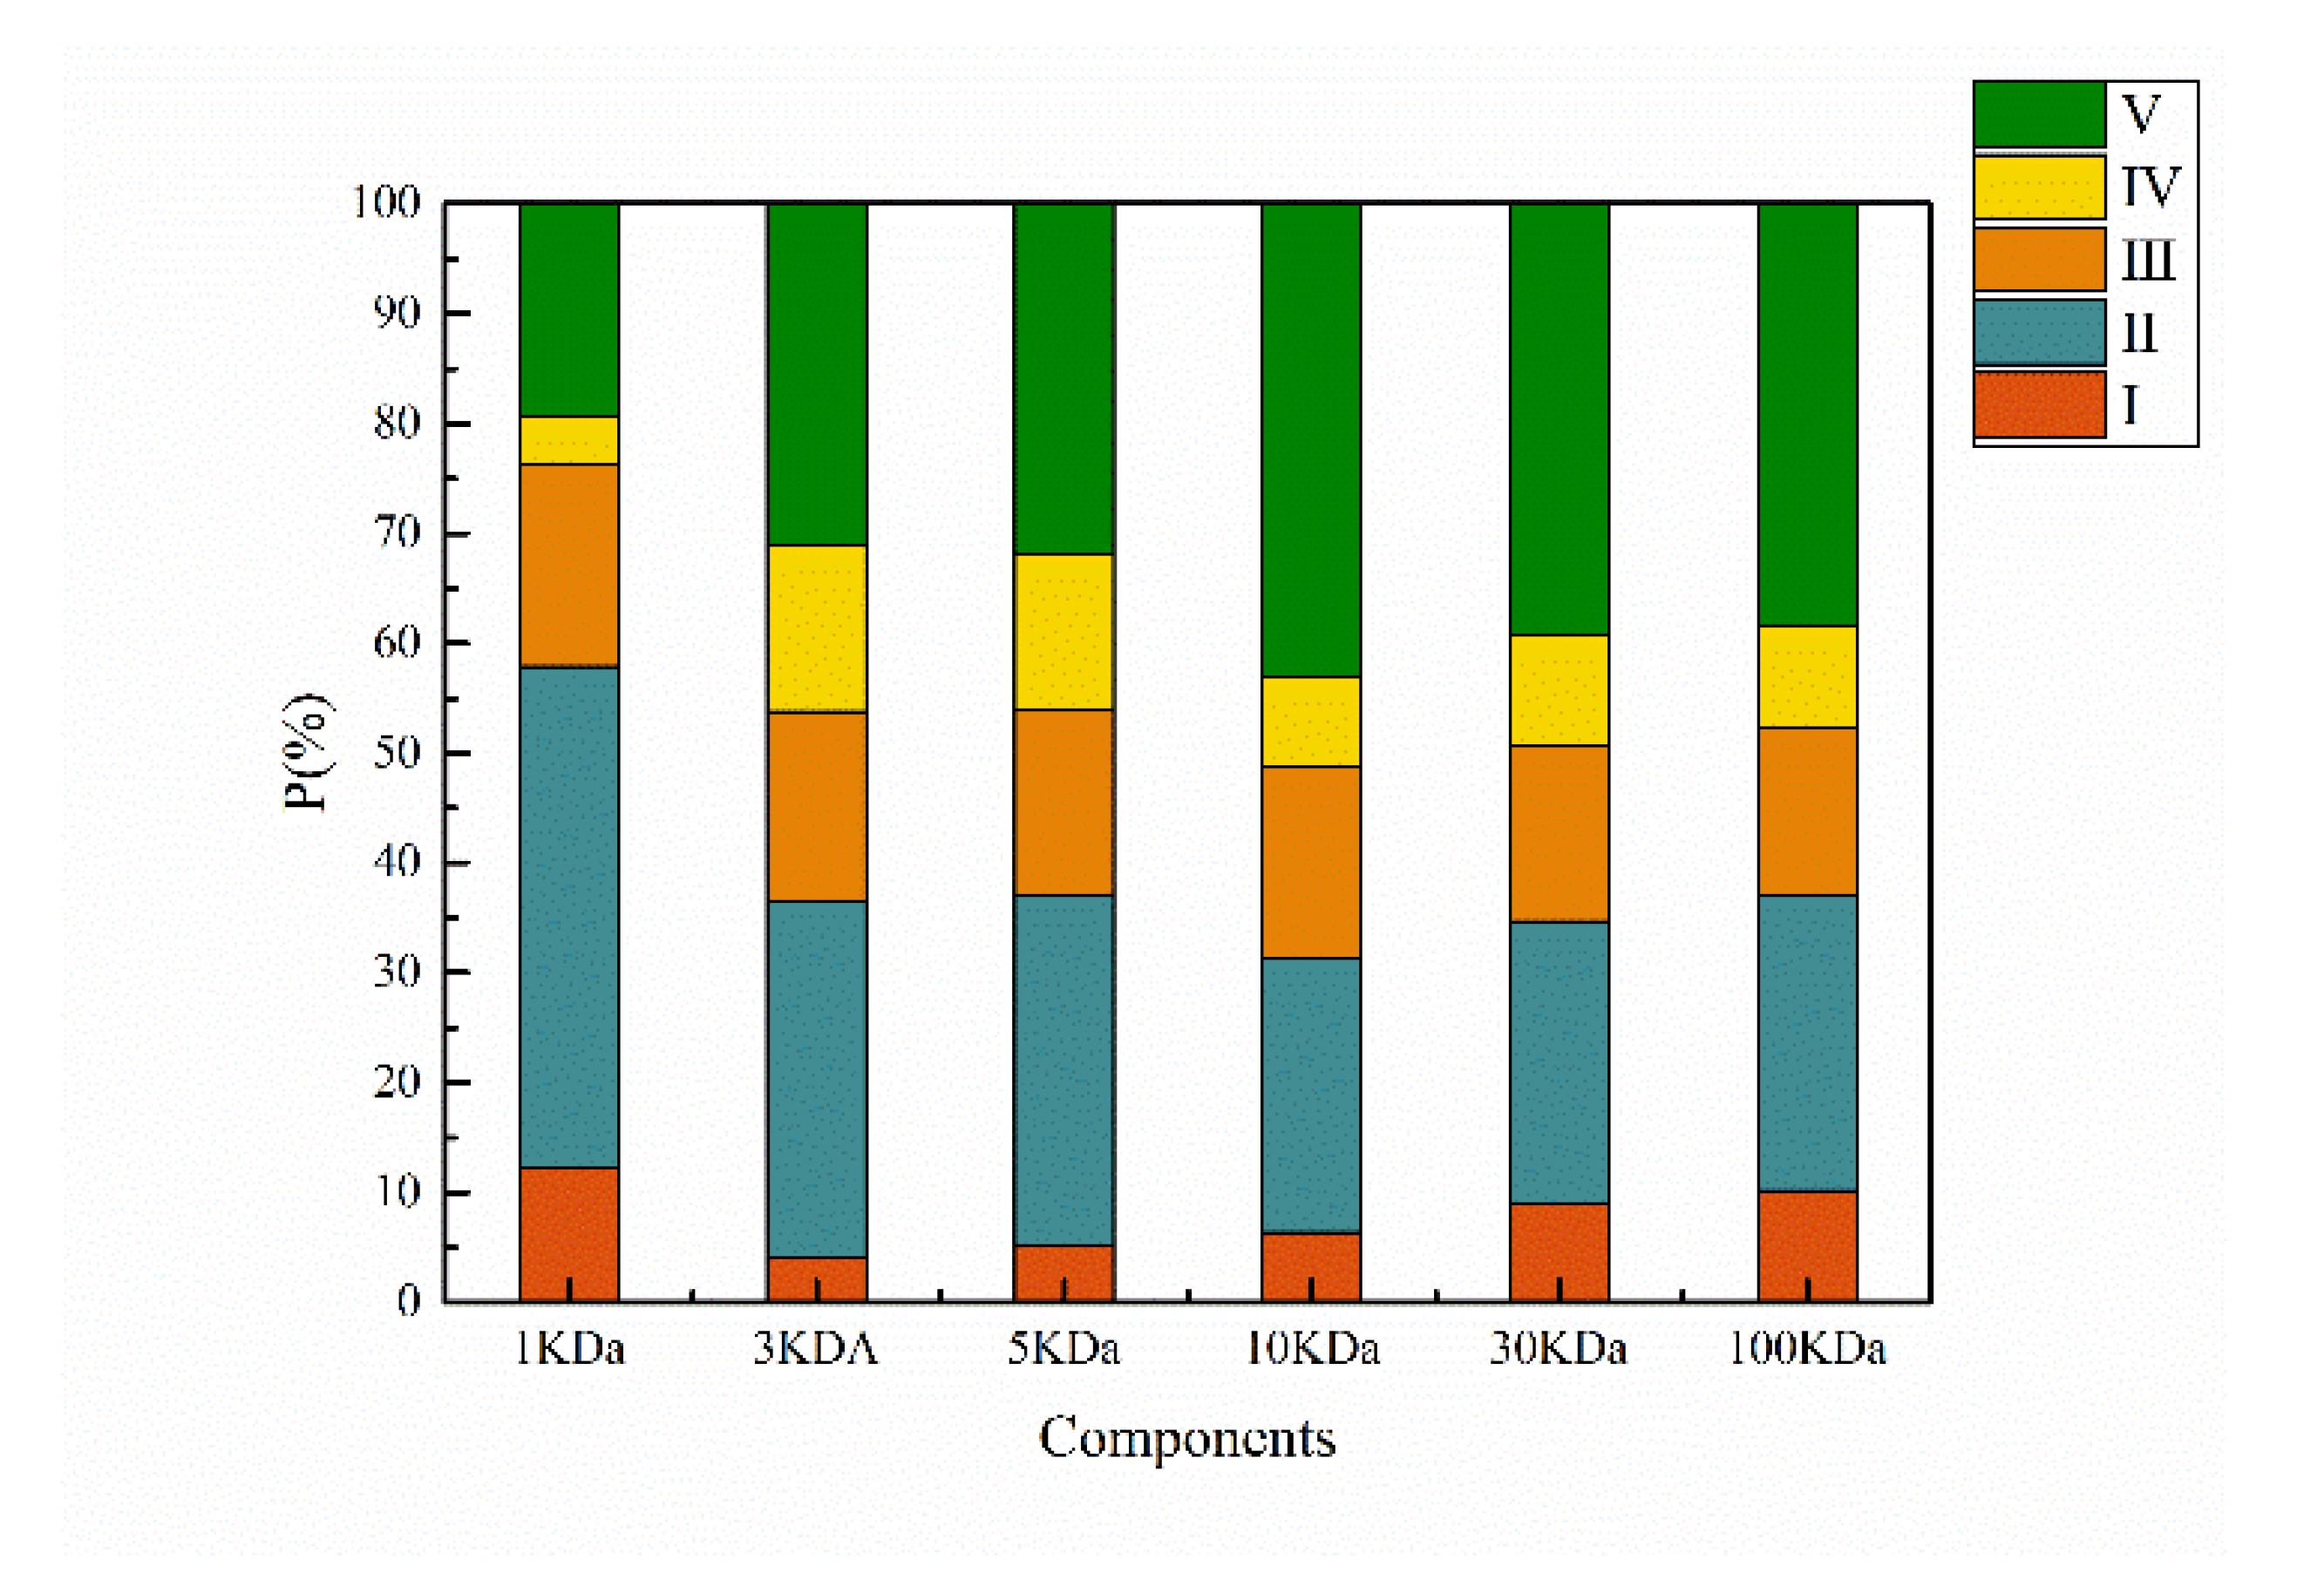
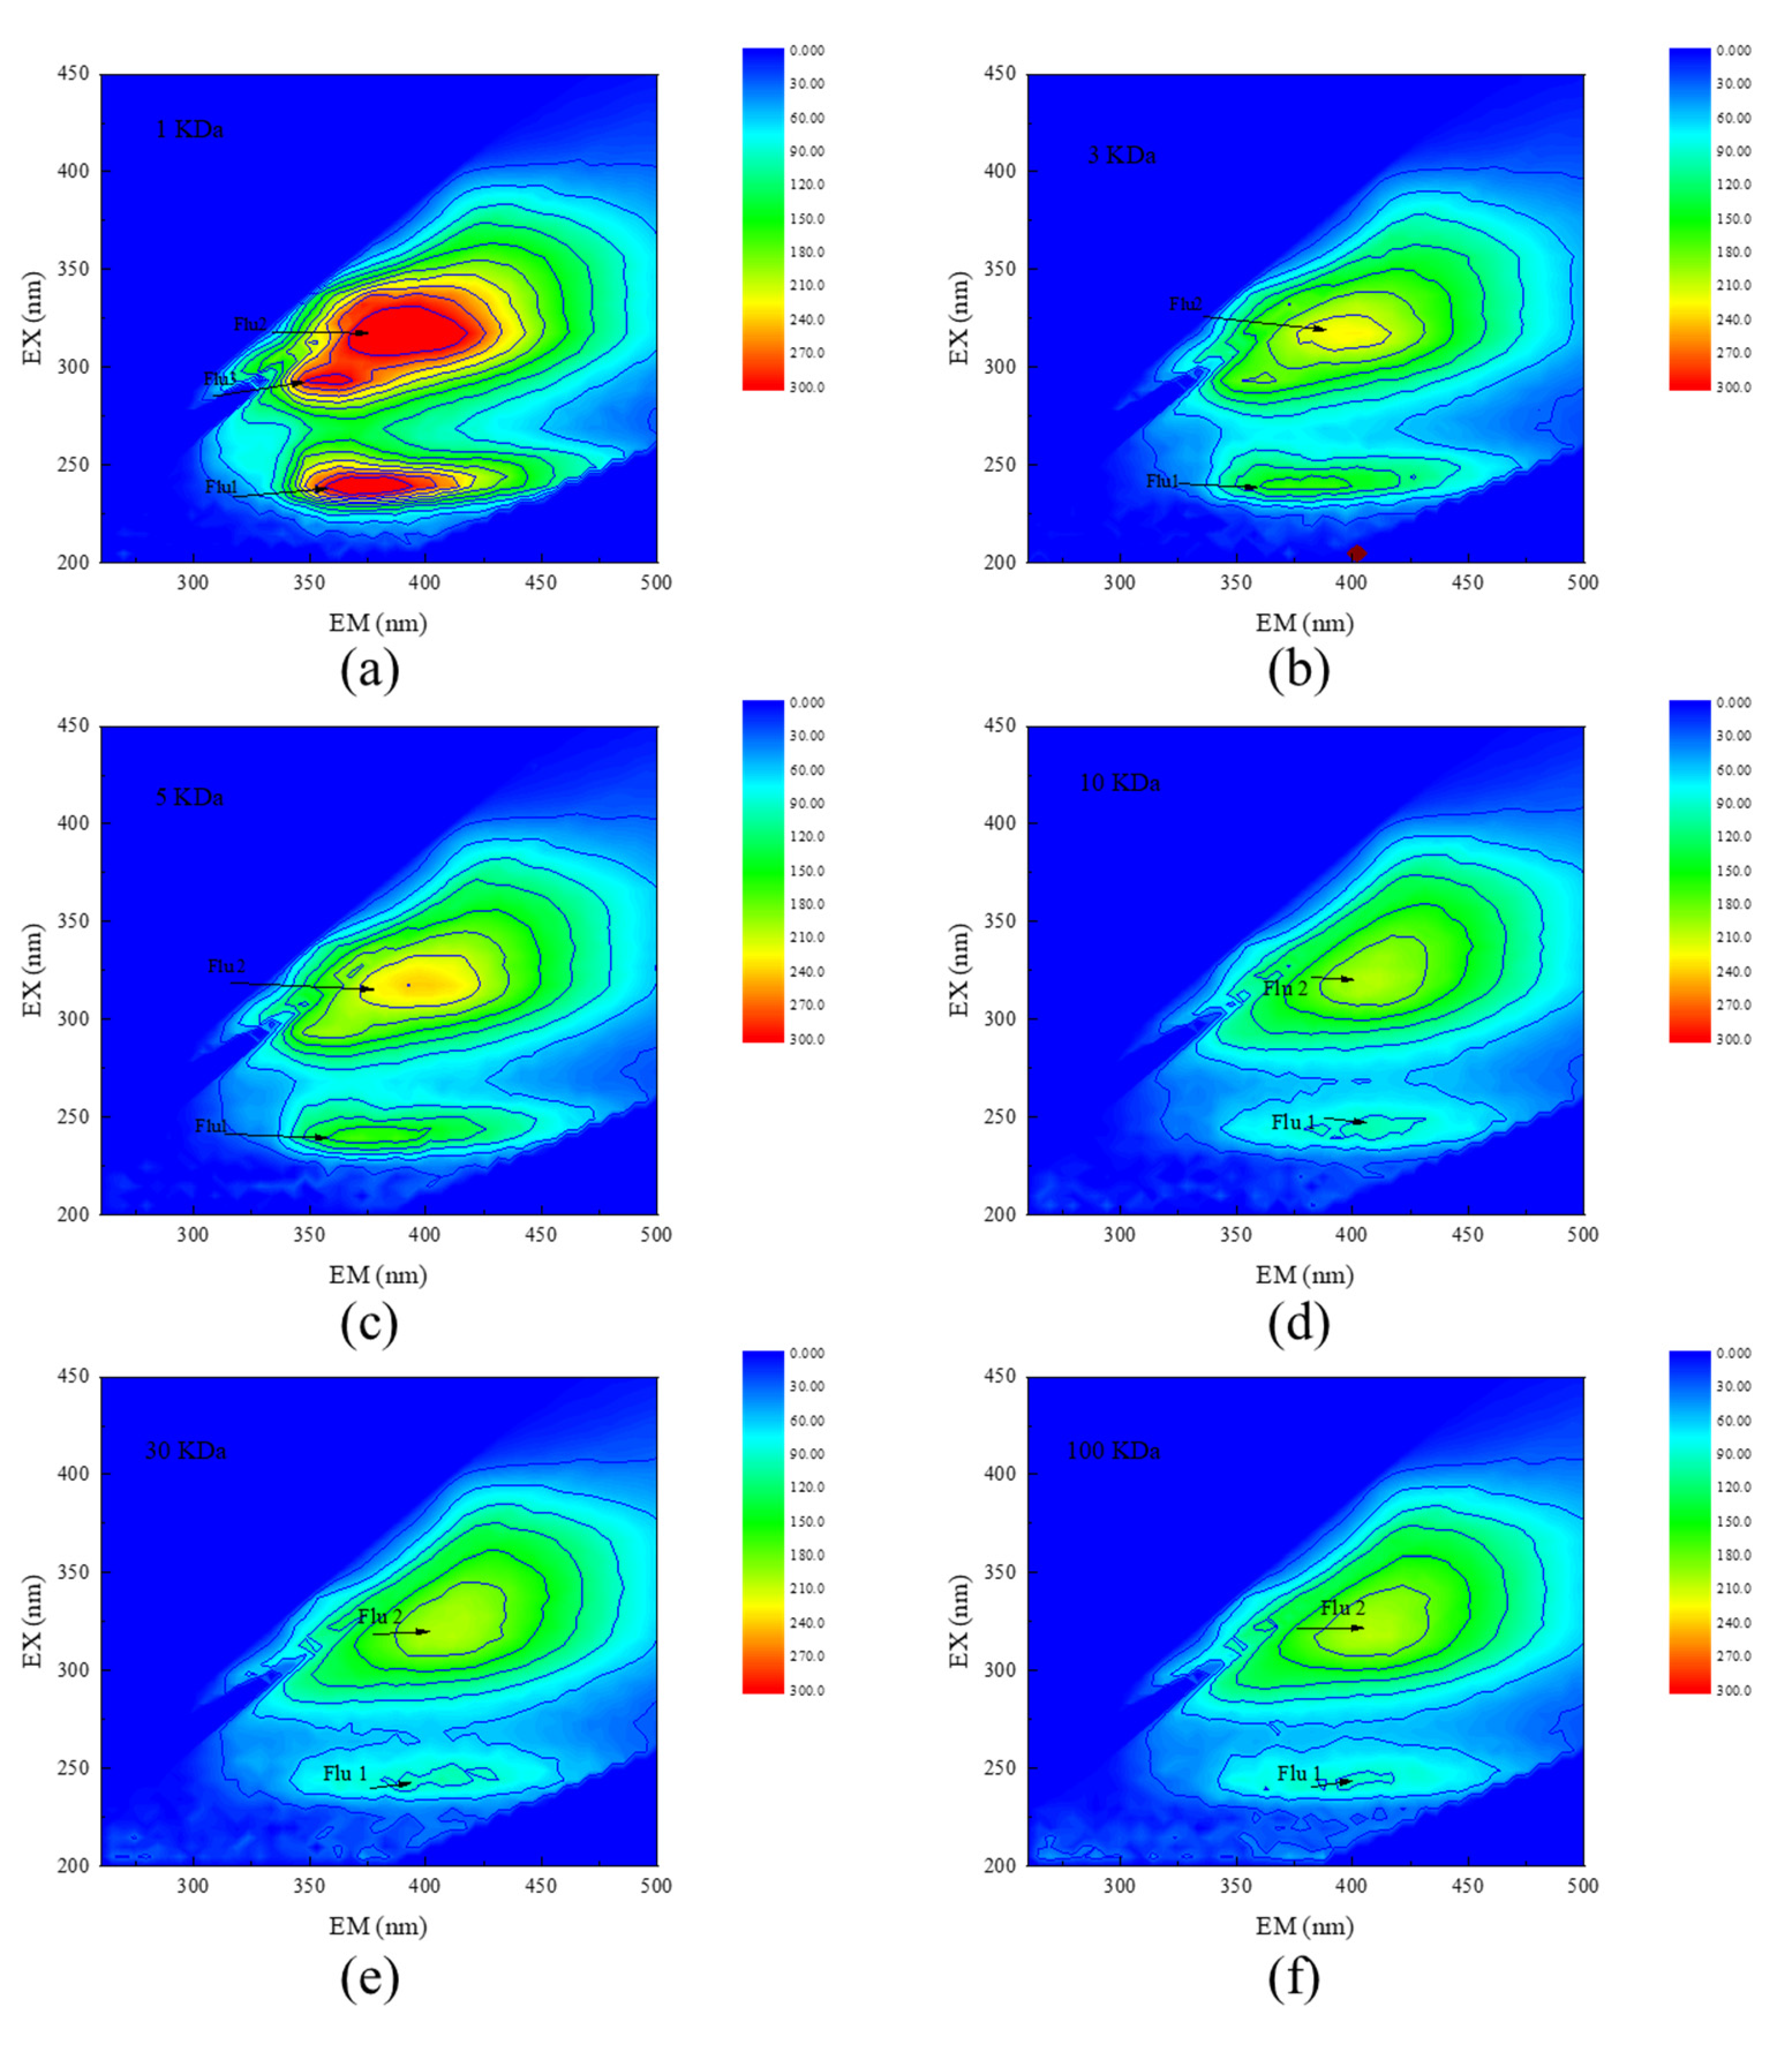
3.1.3. 3D Fluorescence Distributions Based on MW
3.2. The Hydrophobicity Distribution of Acetaldehyde Wastewater
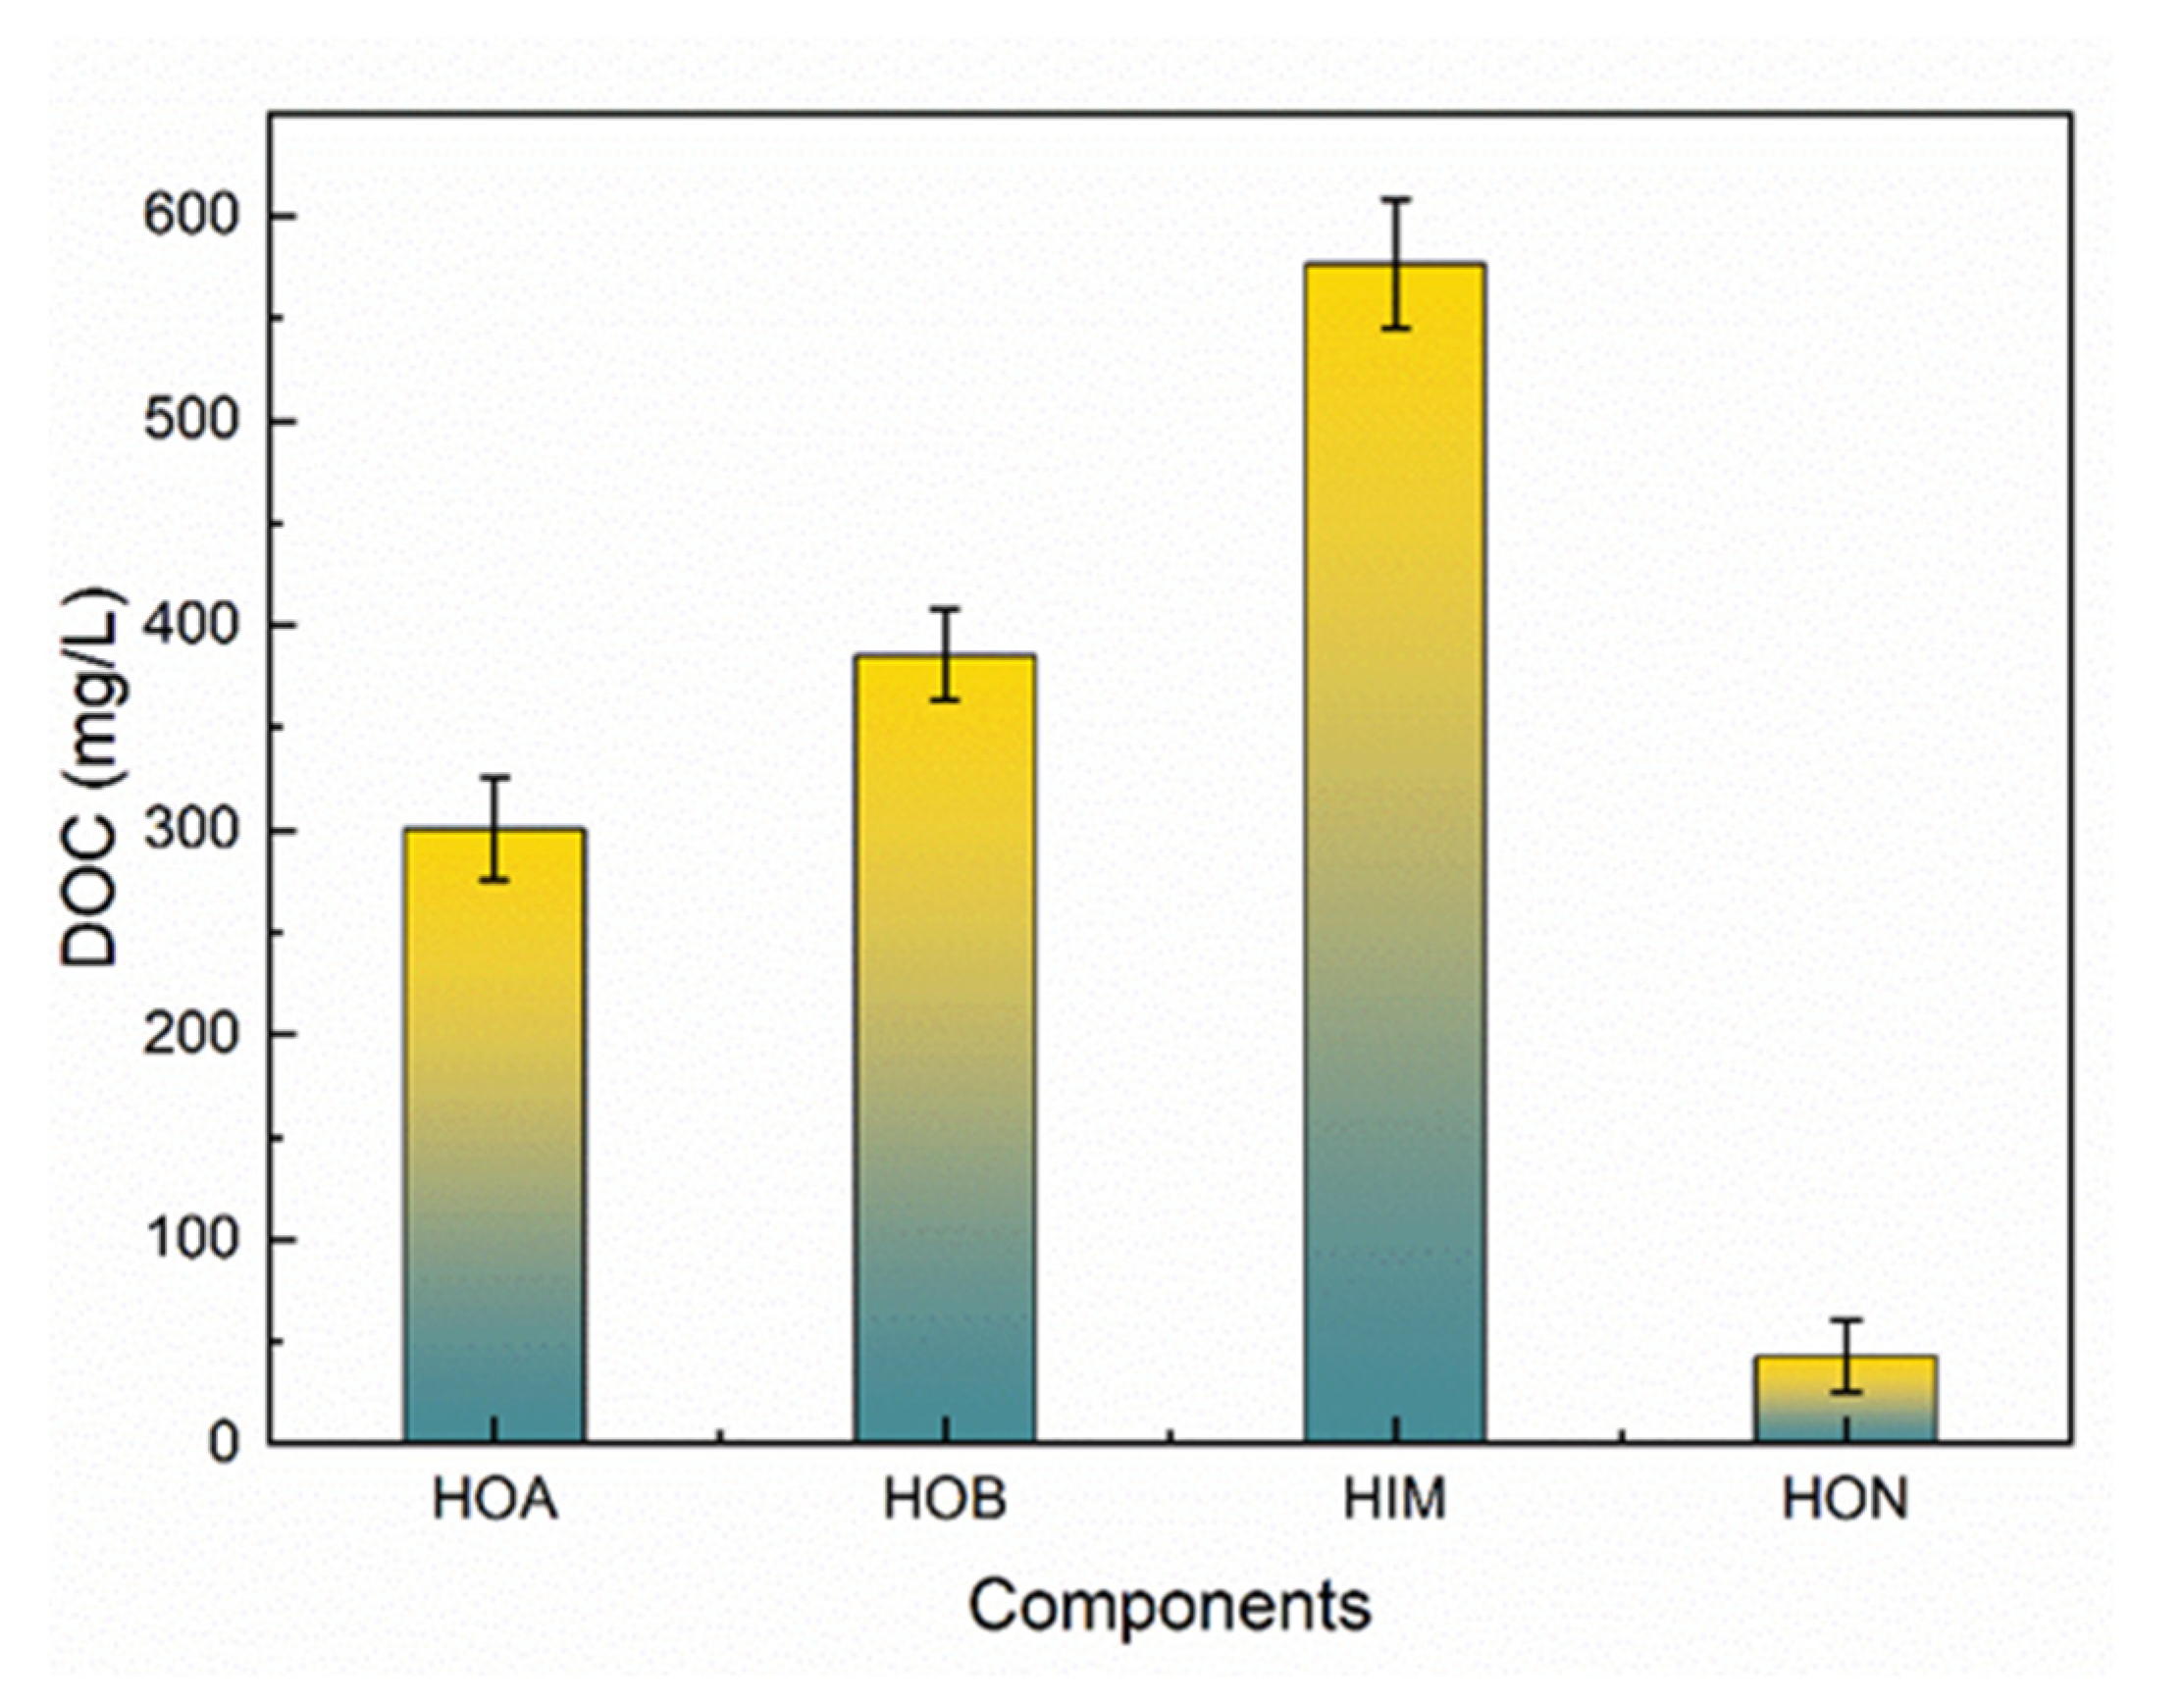
3.2.1. DOC Distributions Based on Hydrophobicity
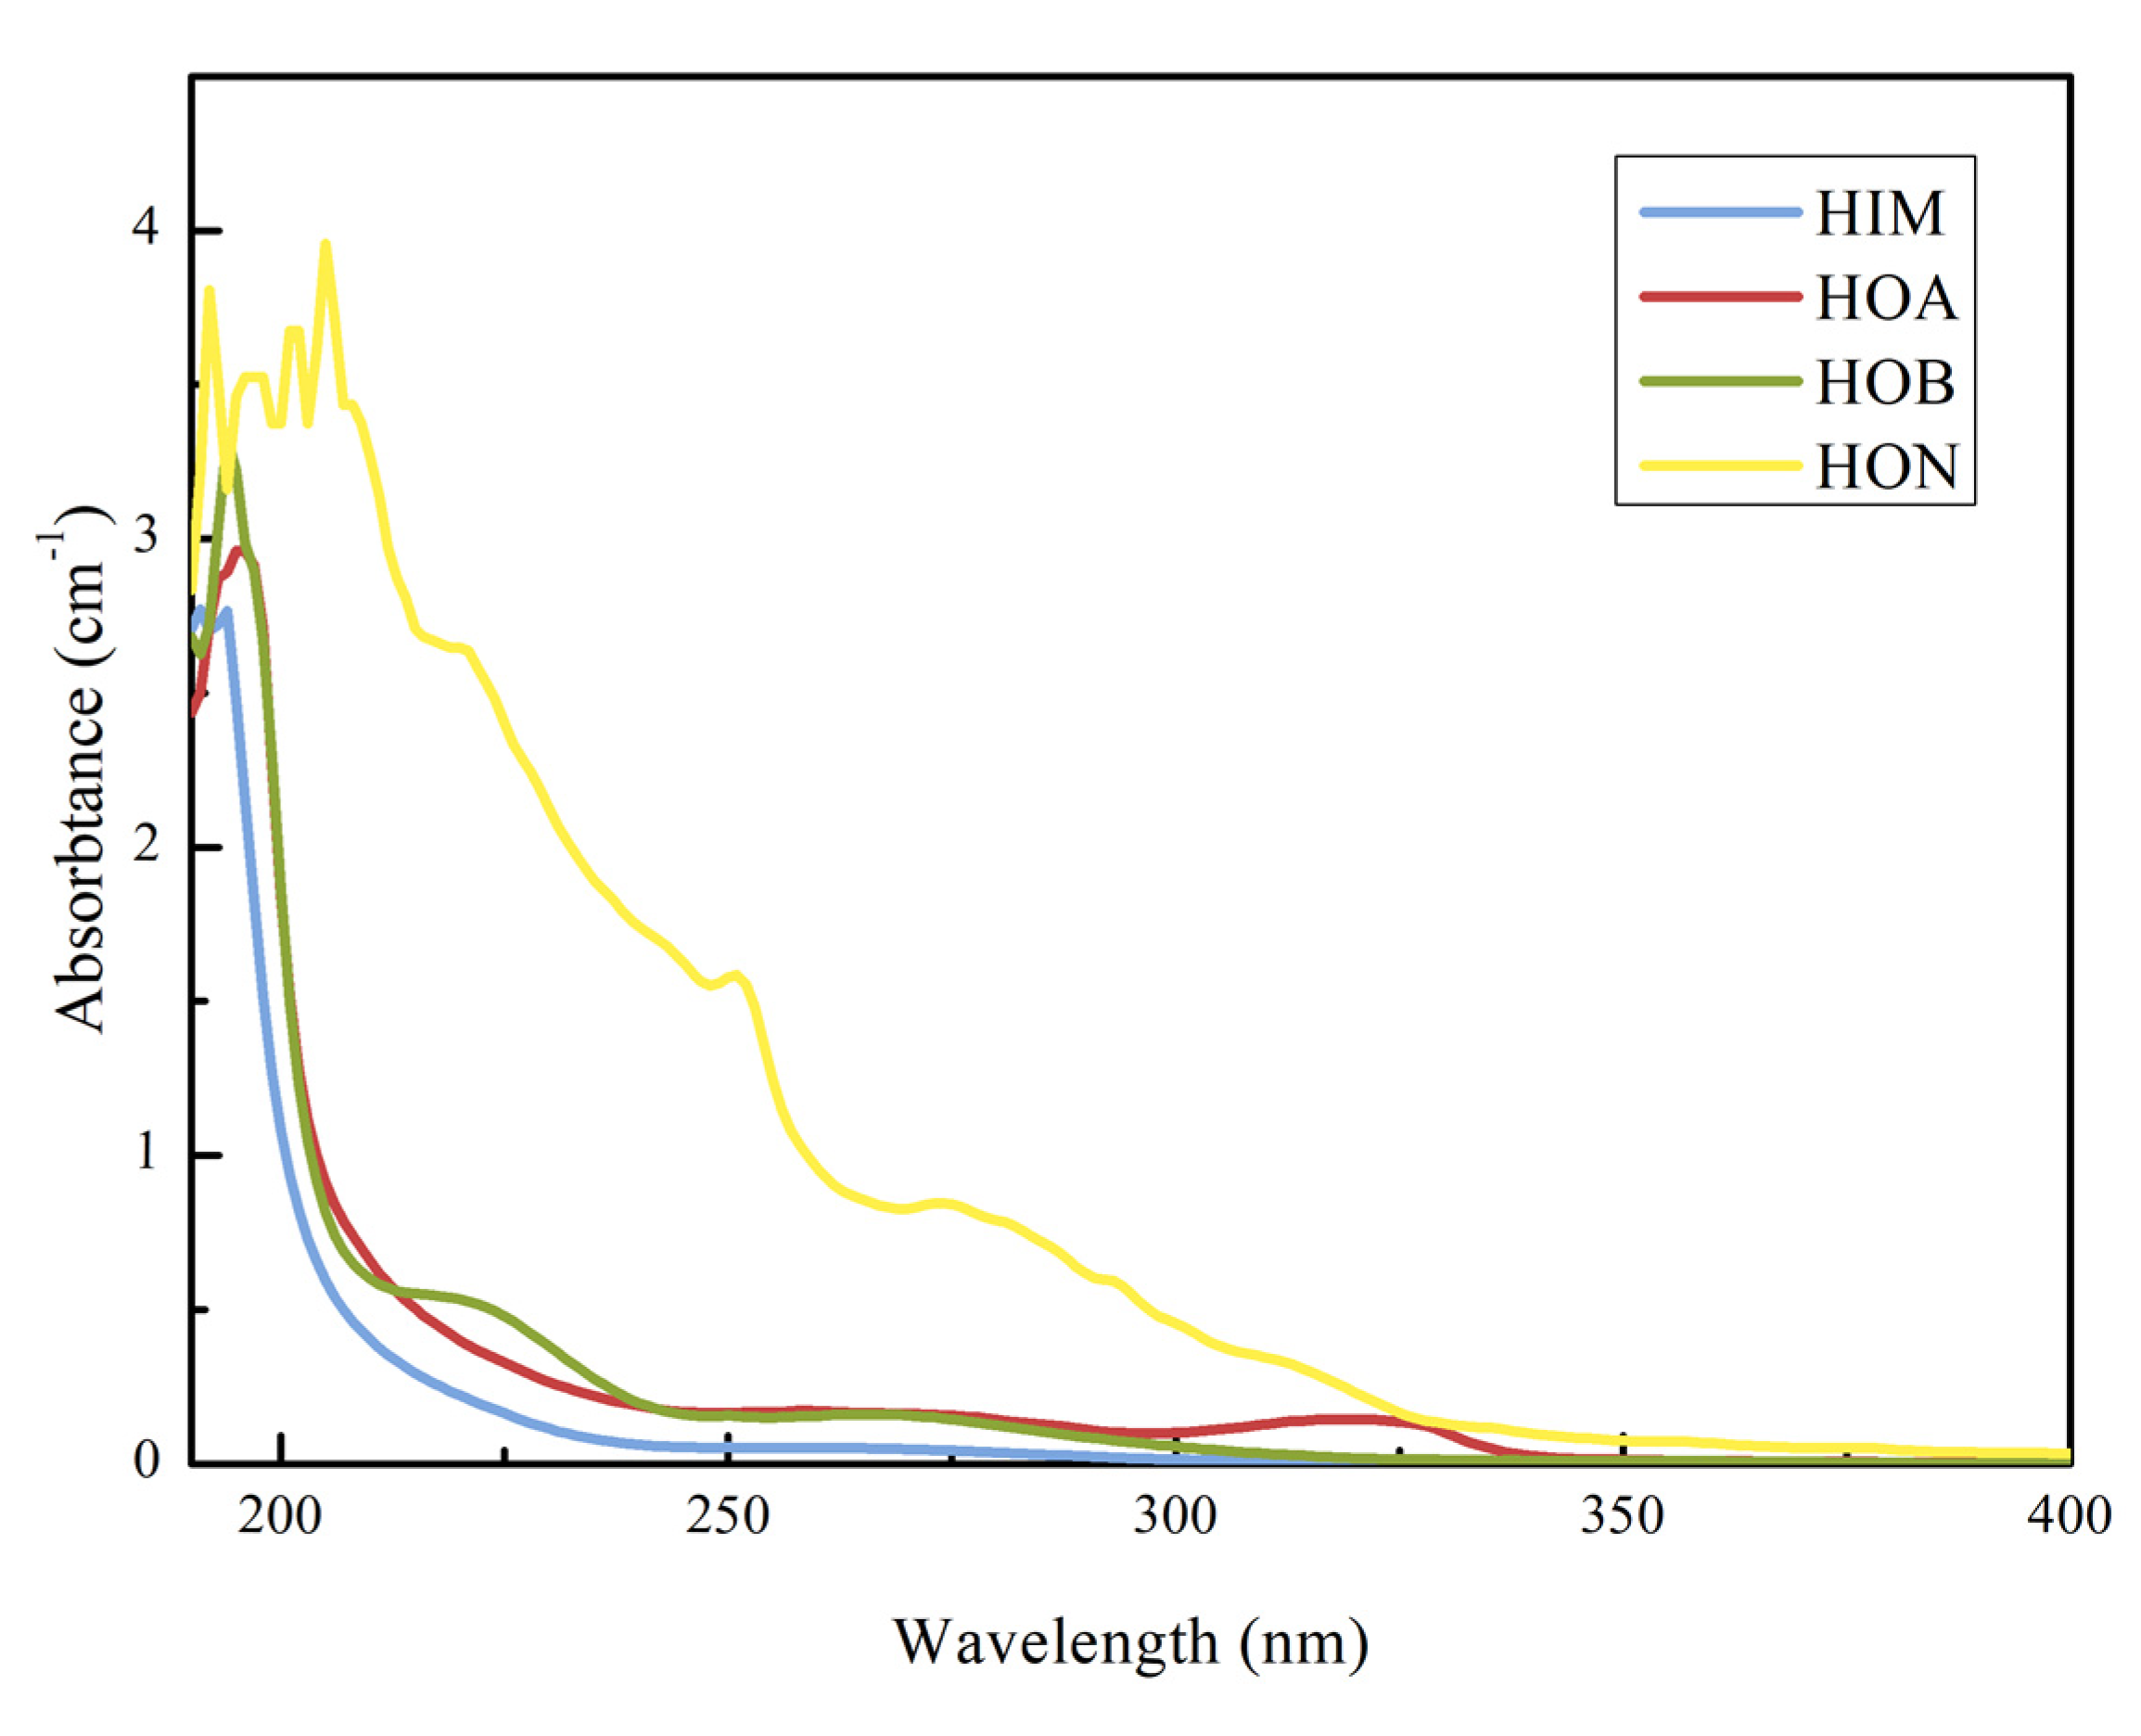
3.2.2. UV254 Distributions Based on Hydrophobicity
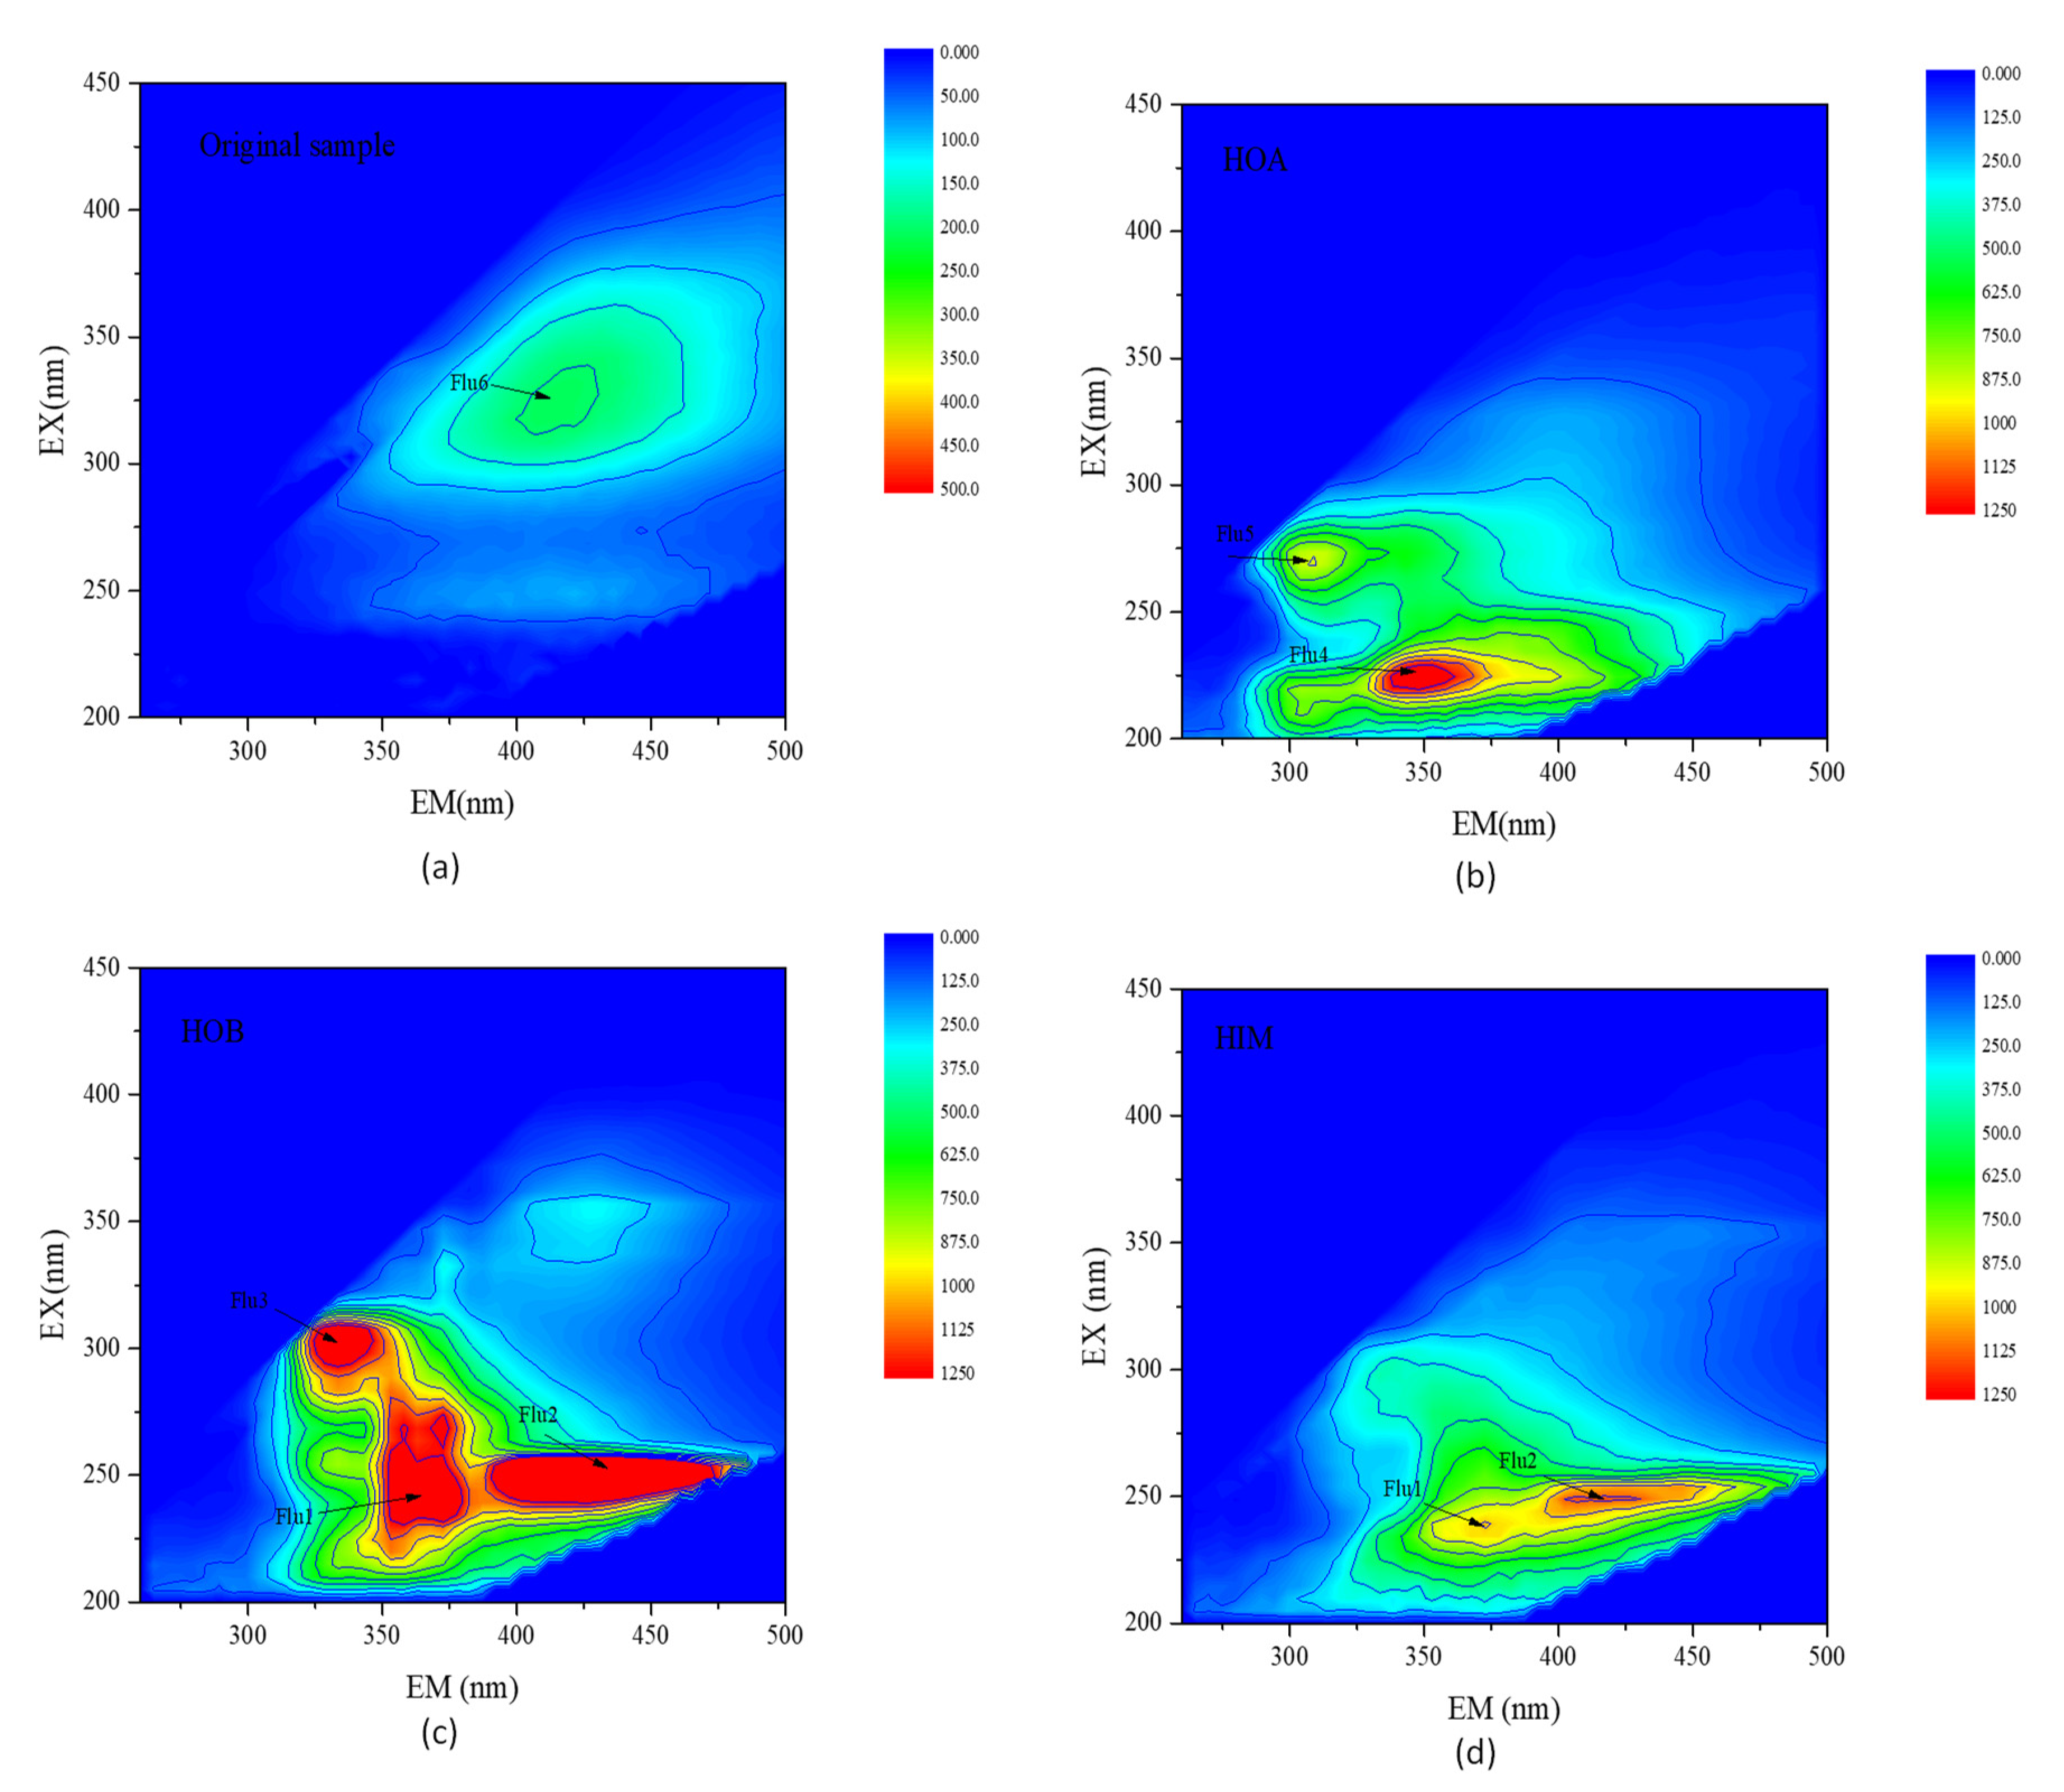
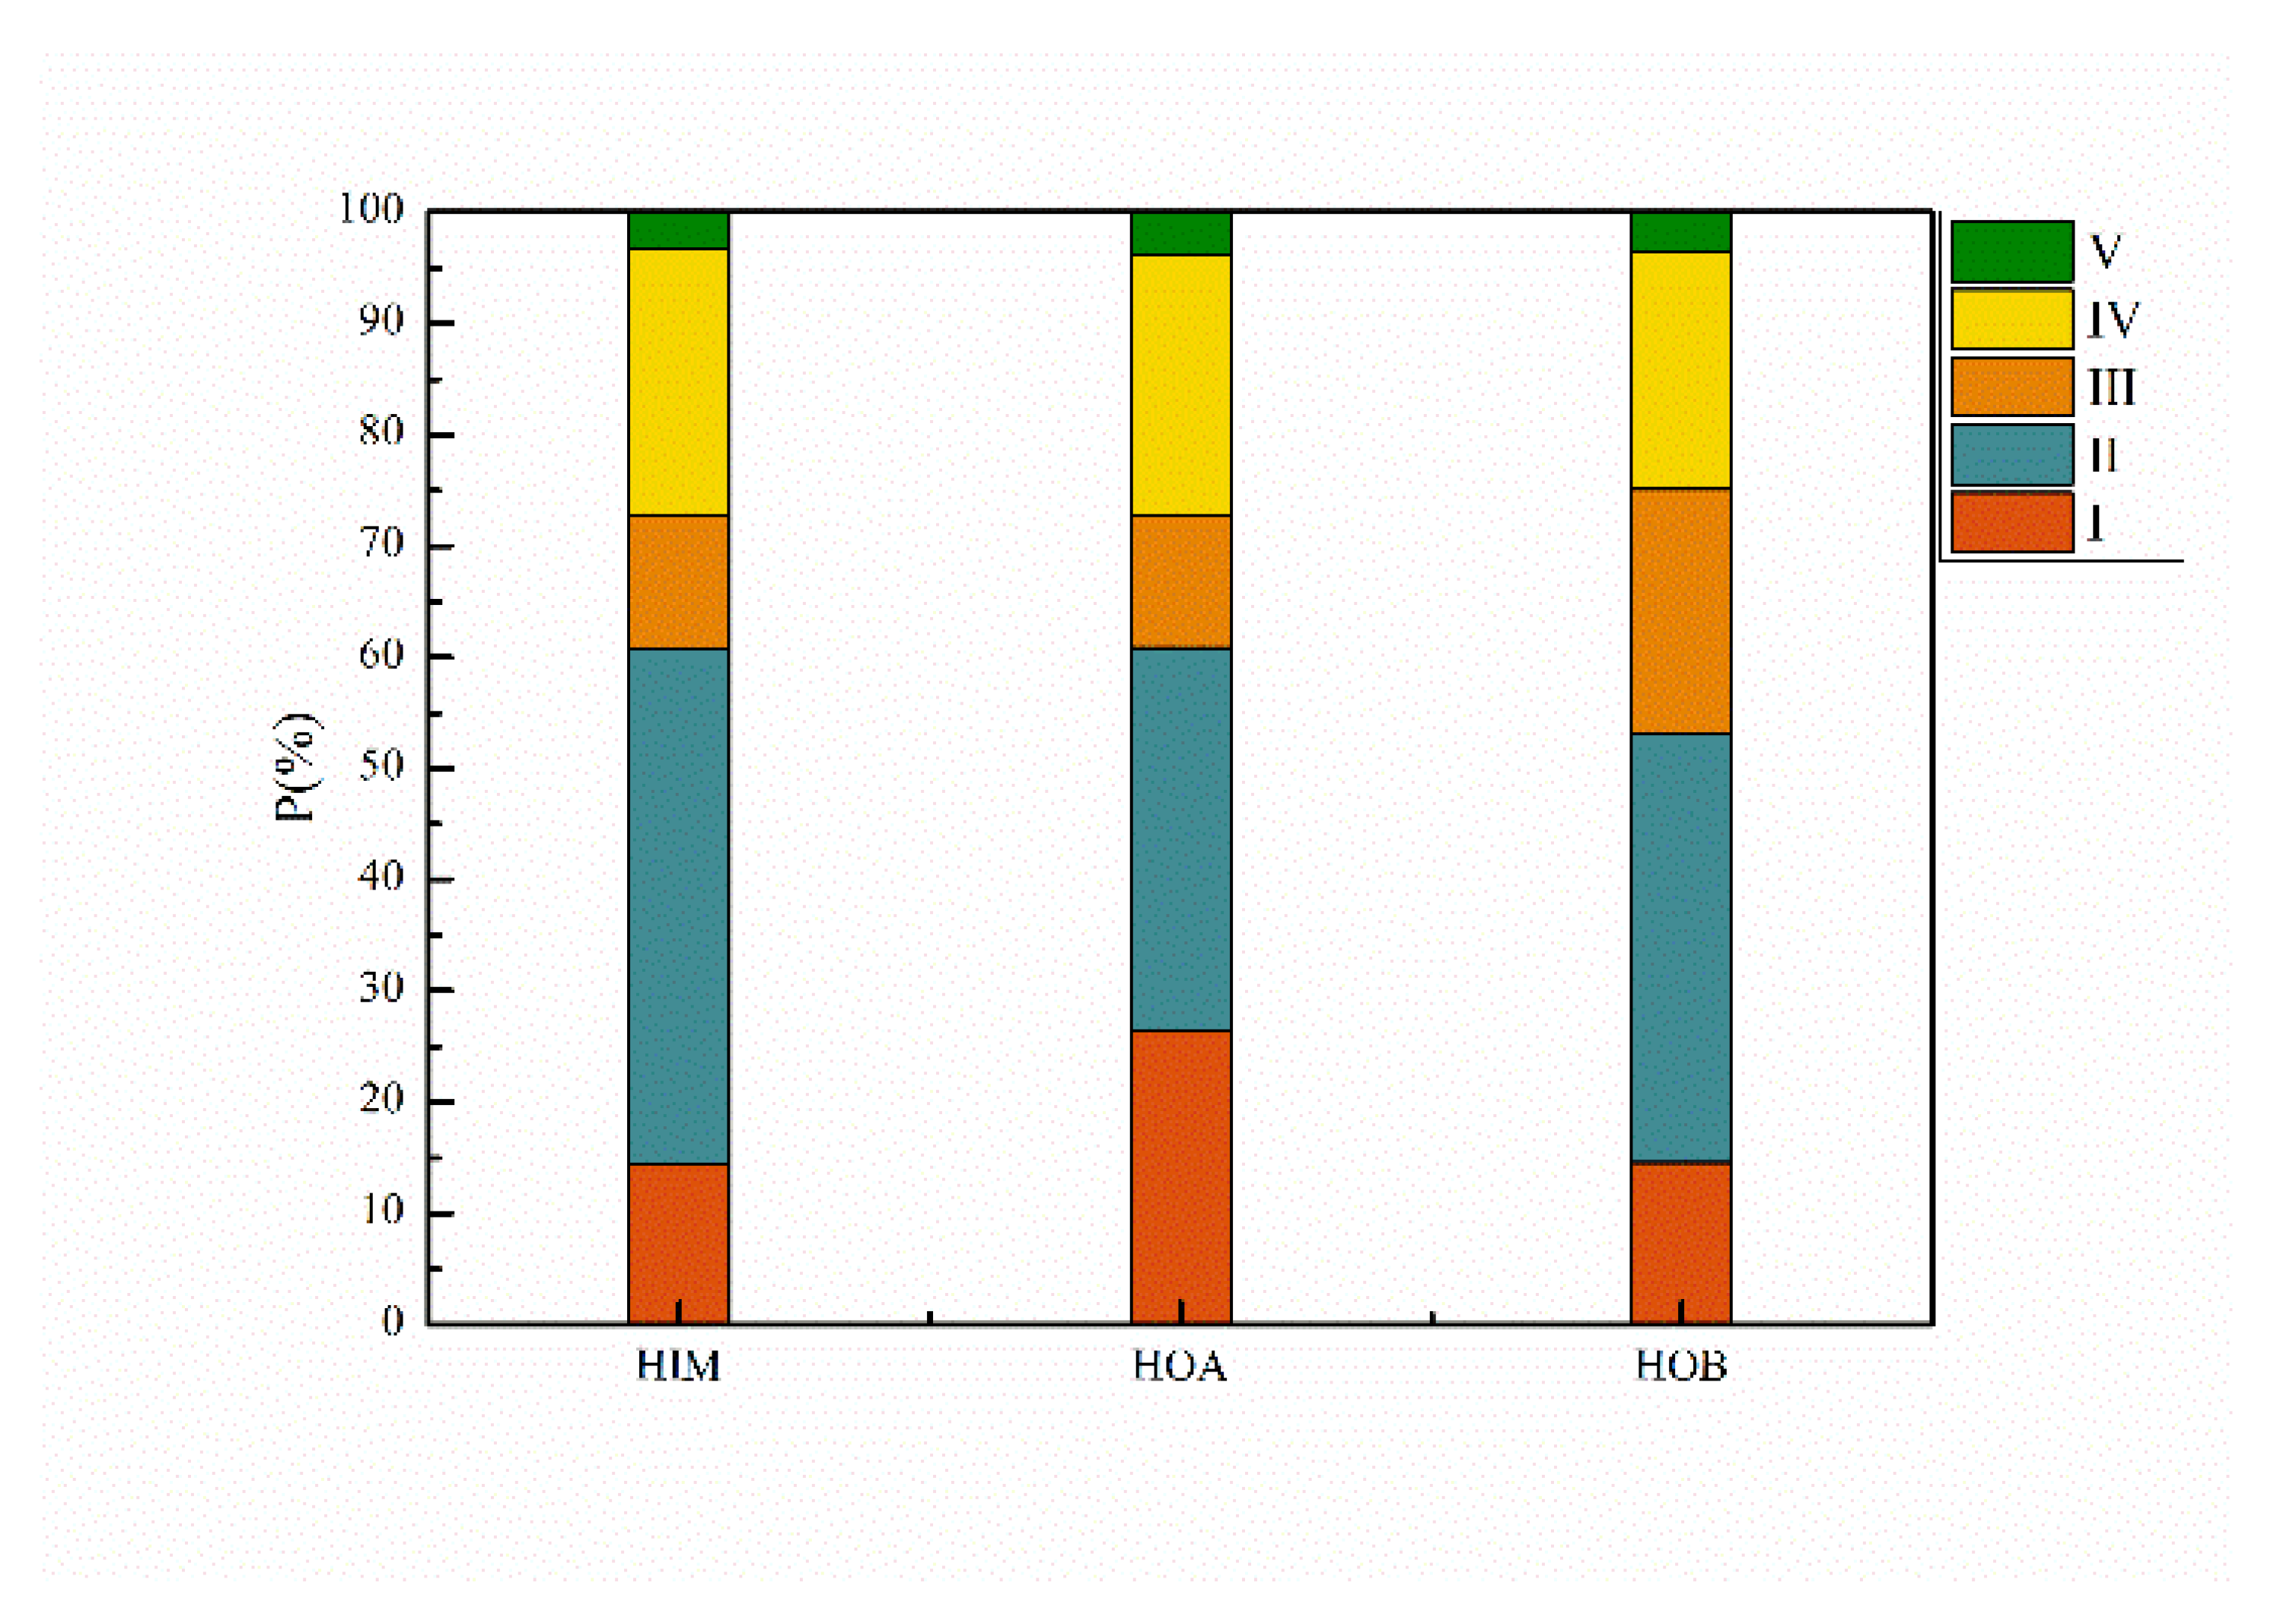
3.2.3. 3D Fluorescence Distributions Based on Hydrophobicity
3.3. Analysis of Organic Pollutants
4. Conclusions
- (i)
- Acetaldehyde wastewater is enriched with fractions of MW < 1kDa. It is therefore recommended to use a biological method to treat acetaldehyde wastewater, but if membrane-related technology is applied, to reuse it, protein-like substances should be removed in pretreatment.
- (ii)
- The treatment of acetaldehyde wastewater should focus on HIM and HOB, given their potential for membrane fouling and resistance to biodegradation of HOB.
- (iii)
- In acetaldehyde wastewater, 30 compounds were determined by GC-MS; 5-methyl furfural, 3-furaldehyde, chloroacetaldehyde, acetic acid, and acetaldehyde were dominant pollutants. Due to their high content and relatively strong toxicity, the process of acetaldehyde wastewater treatment should focus on their fates.
Author Contributions
Funding
Institutional Review Board Statement
Informed Consent Statement
Data Availability Statement
Conflicts of Interest
References
- Shimizu, S.; Abe, N.; Iguchi, A.; Dohba, M.; Sato, H.; Hirose, K. Synthesis of pyridine bases on zeolite catalyst. Microporous Mesoporous Mater. 1998, 21, 447–451. [Google Scholar] [CrossRef]
- Zhou, S.; Liu, Z.; Yan, X.; Di, Q.; Liu, M.; Lu, C.; Jin, G. Optimal reaction conditions for pyridine synthesis in riser reactor. Chin. J. Chem. Eng. 2018, 26, 1499–1507. [Google Scholar] [CrossRef]
- Matsuda, T.; Kawanishi, M.; Yagi, T.; Matsui, S.; Takebe, H. Specific tandem GG to TT base substitutions induced by acetaldehyde are due to intra-strand crosslinks between adjacent guanine bases. Nucleic Acids Res. 1998, 26, 1769–1774. [Google Scholar] [CrossRef] [PubMed] [Green Version]
- Morris, J.B.; Kerry, T.B. Upper respiratory tract deposition of inspired acetaldehyde. Toxicol. Appl. Pharmacol. 1992, 114, 140–146. [Google Scholar] [CrossRef]
- Vaca, C.E.; Nilsson, J.A.; Fang, J.L.; Grafström, R.C. Formation of DNA adducts in human buccal epithelial cells exposed to acetaldehyde and methylglyoxal In Vitro. Chem.-Biol. Interact. 1998, 108, 197–208. [Google Scholar] [CrossRef]
- Wu, Y.; Tan, H.; Li, D.; Jin, Y. Pervaporation of Aqueous Solution of Acetaldehyde Through ZSM-5 Filled PDMS Composite Membrane. Chin. J. Chem. Eng. 2012, 20, 625–632. [Google Scholar] [CrossRef]
- Tian, X.; Shen, Z.; Zhou, Y.; Wang, K. Inhibition on biological acidification and microbial community by high-strength acetaldehyde. Process Saf. Environ. Prot. 2020, 143, 231–238. [Google Scholar] [CrossRef]
- Tian, X.; Zhou, Y.; Wang, K. Chloroacetaldehyde removal by zero valent iron enhanced hydrolytic acidification pretreatment. Sustain. Chem. Pharm. 2020, 15, 100215. [Google Scholar] [CrossRef]
- Song, G.; Yu, Y.; Liu, T.; Xi, H.; Zhou, Y. Performance of microaeration hydrolytic acidification process in the pretreatment of 2-butenal manufacture wastewater. J. Hazard. Mater. 2019, 369, 465–473. [Google Scholar] [CrossRef]
- Shi, X.; Xu, C.; Hu, H.; Tang, F.; Sun, L. Characterization of dissolved organic matter in the secondary effluent of pulp and paper mill wastewater before and after coagulation treatment. Water Sci. Technol. 2016, 74, 1346–1353. [Google Scholar] [CrossRef]
- Xiao, K.; Sun, J.-Y.; Shen, Y.-X.; Liang, S.; Liang, P.; Wang, X.-M.; Huang, X. Fluorescence properties of dissolved organic matter as a function of hydrophobicity and molecular weight: Case studies from two membrane bioreactors and an oxidation ditch. RSC Adv. 2016, 6, 24050–24059. [Google Scholar] [CrossRef]
- Karahan, O.; Dogruel, S.; Dulekgurgen, E.; Orhon, D. COD fractionation of tannery wastewaters—Particle size distribution, biodegradability and modeling. Water Res. 2008, 42, 1083–1092. [Google Scholar] [CrossRef] [PubMed]
- Tran, N.H.; Ngo, H.H.; Urase, T.; Gin, K.Y.-H. A critical review on characterization strategies of organic matter for wastewater and water treatment processes. Bioresour. Technol. 2015, 193, 523–533. [Google Scholar] [CrossRef] [PubMed]
- Wei, Z.M.; Zhang, X.; Wei, Y.Q.; Wen, X.; Shi, J.H.; Wu, J.Q.; Zhao, Y.; Xi, B.D. Fractions and biodegradability of dissolved organic matter derived from different composts. Bioresour. Technol. 2014, 161, 179–185. [Google Scholar] [CrossRef] [PubMed]
- Fan, L.H.; Harris, J.L.; Roddick, F.A.; Booker, N.A. Influence of the characteristics of natural organic matter on the fouling of microfiltration membranes. Water Res. 2001, 35, 4455–4463. [Google Scholar] [CrossRef]
- Park, M.H.; Lee, T.H.; Lee, B.M.; Hur, J.; Park, D.H. Spectroscopic and chromatographic characterization of wastewater organic matter from a biological treatment plant. Sensors 2010, 10, 254–265. [Google Scholar] [CrossRef]
- Edzwald, J.J.W.S. Coagulation in, drinking water treatment: Particles, organcs and coagulants. Water Sci. Technol. 1993, 27, 21–35. [Google Scholar] [CrossRef]
- Maizel, A.C.; Remucal, C.K. The effect of advanced secondary municipal wastewater treatment on the molecular composition of dissolved organic matter. Water Res. 2017, 122, 42–52. [Google Scholar] [CrossRef]
- Ma, D.; Gao, B.; Sun, S.; Wang, Y.; Yue, Q.; Li, Q. Effects of dissolved organic matter size fractions on trihalomethanes formation in MBR effluents during chlorine disinfection. Bioresour. Technol. 2013, 136, 535–541. [Google Scholar] [CrossRef]
- Fan, J.; Li, H.; Shuang, C.; Li, W.; Li, A. Dissolved organic matter removal using magnetic anion exchange resin treatment on biological effluent of textile dyeing wastewater. J. Environ. Sci. 2014, 26, 1567–1574. [Google Scholar] [CrossRef]
- Du, X.; Xu, Z.; Li, J.; Zheng, L. Characterization and removal of dissolved organic matter in a vertical flow constructed wetland. Ecol. Eng. 2014, 73, 610–615. [Google Scholar] [CrossRef]
- Jin, P.; Jin, X.; Bjerkelund, V.A.; Østerhus, S.W.; Wang, X.C.; Yang, L. A study on the reactivity characteristics of dissolved effluent organic matter (EfOM) from municipal wastewater treatment plant during ozonation. Water Res. 2016, 88, 643–652. [Google Scholar] [CrossRef] [PubMed]
- Ma, D.; Peng, B.; Zhang, Y.; Gao, B.; Wang, Y.; Yue, Q.; Li, Q. Influences of dissolved organic matter characteristics on trihalomethanes formation during chlorine disinfection of membrane bioreactor effluents. Bioresour. Technol. 2014, 165, 81–87. [Google Scholar] [CrossRef]
- Liu, C.; Tang, X.; Kim, J.; Korshin, G.V. Formation of aldehydes and carboxylic acids in ozonated surface water and wastewater: A clear relationship with fluorescence changes. Chemosphere 2015, 125, 182–190. [Google Scholar] [CrossRef] [PubMed]
- Greenwood, P.F.; Berwick, L.J.; Croué, J.P. Molecular characterisation of the dissolved organic matter of wastewater effluents by MSSV pyrolysis GC–MS and search for source markers. Chemosphere 2012, 87, 504–512. [Google Scholar] [CrossRef]
- Wang, M.; Chen, Y. Generation and characterization of DOM in wastewater treatment processes. Chemosphere 2018, 201, 96–109. [Google Scholar] [CrossRef]
- Jia, X.; Jin, D.; Li, C.; Lu, W. Characterization and analysis of petrochemical wastewater through particle size distribution, biodegradability, and chemical composition. Chin. J. Chem. Eng. 2019, 27, 444–451. [Google Scholar] [CrossRef]
- Ravndal, K.T.; Opsahl, E.; Bagi, A.; Kommedal, R. Wastewater characterisation by combining size fractionation, chemical composition and biodegradability. Water Res. 2018, 131, 151–160. [Google Scholar] [CrossRef] [Green Version]
- Chen, W.; Westerhoff, P.; Leenheer, J.A.; Booksh, K. Fluorescence Excitation−Emission Matrix Regional Integration to Quantify Spectra for Dissolved Organic Matter. Environ. Sci. Technol. 2003, 37, 5701–5710. [Google Scholar] [CrossRef]
- Świetlik, J.; Dąbrowska, A.; Raczyk-Stanisławiak, U.; Nawrocki, J. Reactivity of natural organic matter fractions with chlorine dioxide and ozone. Water Res. 2004, 38, 547–558. [Google Scholar] [CrossRef]
- Wang, L.; Li, Y.-J.; Xiong, Y.; Tan, W.-B.; Zhang, L.-Y.; Li, X.; Wang, X.-S.; Xu, J.-F.; Li, T.-T.; Wang, J.-S.J.P.O. Spectroscopic characterization of DOM and the nitrogen removal mechanism during wastewater reclamation plant. PLoS ONE 2017, 12, e0187355. [Google Scholar] [CrossRef] [PubMed] [Green Version]
- Hudson, N.; Baker, A.; Ward, D.; Reynolds, D.M.; Brunsdon, C.; Carliell-Marquet, C.; Browning, S. Can fluorescence spectrometry be used as a surrogate for the Biochemical Oxygen Demand (BOD) test in water quality assessment? An example from South West England. Sci. Total Environ. 2008, 391, 149–158. [Google Scholar] [CrossRef] [PubMed]
- Cohen, E.; Levy, G.J.; Borisover, M. Fluorescent components of organic matter in wastewater: Efficacy and selectivity of the water treatment. Water Res. 2014, 55, 323–334. [Google Scholar] [CrossRef] [PubMed]
- Yu, H.; Song, Y.; Tu, X.; Du, E.; Liu, R.; Peng, J. Assessing removal efficiency of dissolved organic matter in wastewater treatment using fluorescence excitation emission matrices with parallel factor analysis and second derivative synchronous fluorescence. Bioresour. Technol. 2013, 144, 595–601. [Google Scholar] [CrossRef]
- Min, K.; Ergas, S.J. Volatilization and Biodegradation of VOCs in Membrane Bioreactors (MBR). Water Air Soil Pollut. Focus 2006, 6, 83–96. [Google Scholar] [CrossRef]
- Bayat, M.; Mehrnia, M.R.; Hosseinzadeh, M.; Sheikh-Sofla, R. Petrochemical wastewater treatment and reuse by MBR A pilot study for ethylene oxide/ethylene glycol and olefin units. J. Ind. Eng. Chem. 2015, 25, 265–271. [Google Scholar] [CrossRef]
- Min, K.N. Volatile Organic Compound Control in Chemical Industry Wastewater Using a Membrane Bioreactor: Emission Reduction and Microbial Characterization; University of Massachusetts Amherst: Hampshire County, MA, USA, 2006. [Google Scholar]
- Liang, S.; Zhao, Y.; Liu, C.; Song, L. Effect of solution chemistry on the fouling potential of dissolved organic matter in membrane bioreactor systems. J. Membr. Sci. 2008, 310, 503–511. [Google Scholar] [CrossRef]
- Helms, J.R.; Stubbins, A.; Ritchie, J.D.; Minor, E.C.; Kieber, D.J.; Mopper, K. Absorption spectral slopes and slope ratios as indicators of molecular weight, source, and photobleaching of chromophoric dissolved organic matter. Limnol. Oceanogr. 2008, 53, 955–969. [Google Scholar] [CrossRef] [Green Version]
- Yan, H.; Nian, Y.; Zhou, Y.; Yin, Q.; Zhong, Z.; Guo, X. A detailed dissolved organic matter characterization of starch processing wastewater treated by a sedimentation and biological hybrid system. Microchem. J. 2017, 130, 295–300. [Google Scholar] [CrossRef]
- Xiao, K.; Shen, Y.-x.; Liang, S.; Liang, P.; Wang, X.-m.; Huang, X. A systematic analysis of fouling evolution and irreversibility behaviors of MBR supernatant hydrophilic/hydrophobic fractions during microfiltration. J. Membr. Sci. 2014, 467, 206–216. [Google Scholar] [CrossRef]


| NO. | Rt (min) | Name | Possibility % | Molecular Weight | CAS | Structural Formula | Percentage % | Toxicity Grade a | Methods |
|---|---|---|---|---|---|---|---|---|---|
| 1 | 5.785 | Chloroacetald-ehyde | 96 | 77.987 | 000107-20-0 |  | 4.91 | 3 | LLE-GC-MS |
| 2 | 6.177 | Acetic acid | 86 | 60.021 | 000064-19-7 |  | 3.56 | 3 | LLE-GC-MS |
| 3 | 6.504 | Trichloromethane | 91 | 117.914 | 000067-66-3 |  | 0.235 | 2 | LLE-GC-MS |
| 4 | 6.782 | Dichloroacetaldehyde | 97 | 111.948 | 000079-02-7 | 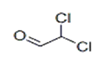 | 1.63 | 3 | LLE-GC-MS |
| 5 | 7.109 | Crotonaldehyde | 91 | 70.042 | 000123-73-9 |  | 4.97 | 3 | LLE-GC-MS |
| 6 | 7.219 | 2-Butenal | 74 | 70.040 | 004170-30-3 |  | 0.318 | 3 | LLE-GC-MS |
| 7 | 7.335 | 2-Chloroethanol | 78 | 80.003 | 000107-07-3 |  | 1.94 | 3 | LLE-GC-MS |
| 8 | 7.808 | Chloroacetone | 80 | 92.003 | 000078-95-5 |  | 0.640 | 3 | LLE-GC-MS |
| 9 | 9.391 | 3-Penten-2-one | 72 | 84.058 | 003102-33-8 |  | 0.253 | U | LLE-GC-MS |
| 10 | 9.556 | Aldol | 78 | 88.052 | 000107-89-1 |  | 0.834 | 2 | LLE-GC-MS |
| 11 | 10.676 | 2,4-Pentanedione | 64 | 100.052 | 000123-54-6 |  | 0.355 | U | LLE-GC-MS |
| 12 | 11.711 | 3-Furaldehyde | 95 | 96.021 | 000498-60-2 | 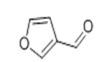 | 10.2 | 3 | LLE-GC-MS |
| 13 | 12.090 | 3-Chloropropyne | 53 | 73.992 | 000624-65-7 |  | 4.56 | 3 | LLE-GC-MS |
| 14 | 12.430 | Furfural | 91 | 96.021 | 000098-01-1 |  | 0.276 | 3 | LLE-GC-MS |
| 15 | 14.699 | 2-Chloromethyl-1,3-dioxolane | 72 | 122.013 | 002568-30-1 |  | 0.405 | U | LLE-GC-MS |
| 16 | 14. 841 | Ethanone, 1-(2-furanyl)- | 86 | 110.037 | 001192-62-7 | 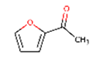 | 0.223 | 3 | LLE-GC-MS |
| 17 | 15.171 | 2-Acetylfuran | 91 | 110.037 | 001192-62-7 |  | 0.193 | 4 | LLE-GC-MS |
| 18 | 15.311 | 5-Methyl furfural | 91 | 110.037 | 000620-02-0 |  | 36.8 | 2 | LLE-GC-MS |
| 19 | 16.036 | 3,3-Dimethyl-2,4-pentanedione | 72 | 128.084 | 003142-58-3 |  | 0.474 | U | LLE-GC-MS |
| 20 | 17.285 | 2-Acetyl-5-methylfuran | 86 | 124.052 | 001193-79-9 |  | 1.85 | 3 | LLE-GC-MS |
| 21 | 18.372 | CIS-1,3-Dichloropropene | 72 | 109.969 | 010061-01-5 |  | 0.299 | 3 | LLE-GC-MS |
| 22 | 19.476 | 2-Dichloromethyl-1,3-dioxolane | 42 | 155.974 | 002612-35-3 |  | 0.152 | U | LLE-GC-MS |
| 23 | 20.405 | 1-Octanol | 42 | 130.14 | 000111-87-5 | 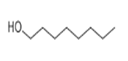 | 0.0737 | 2 | LLE-GC-MS |
| 24 | 21.276 | 3-Methyl-2-cyclohexen-1-one | 47 | 110.073 | 001193-18-6 |  | 0.258 | 2 | LLE-GC-MS |
| 25 | 21.506 | 1-Chloromethyl-4-methylenecyclohexane | 50 | 144.071 | 000823-83-6 | 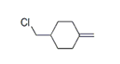 | 0.663 | U | LLE-GC-MS |
| 26 | 23.299 | 5-chloro-2-methoxy-phenol | 50 | 158.013 | 003743-23-5 |  | 0.368 | U | LLE-GC-MS |
| 27 | 25.231 | 5-chlorobenzene-1,3-diol | 72 | 143.998 | 005278-23-1 | 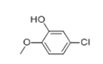 | 0.249 | U | LLE-GC-MS |
| 28 | 26.386 | 4-Chlorophenetole | 38 | 156.034 | 000622-61-7 |  | 0.166 | U | LLE-GC-MS |
| 29 | 5. 072 | Acetaldehyde | 59 | 44.026 | 000075-07-0 |  | 2.46 | 3 | Purge and trap-GC/MS |
| 30 | 5.276 | Ethyl alcohol | 80 | 46.042 | 000064-17-5 | 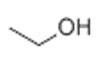 | 3.33 | 2 | Purge and trap-GC/MS |
Publisher’s Note: MDPI stays neutral with regard to jurisdictional claims in published maps and institutional affiliations. |
© 2022 by the authors. Licensee MDPI, Basel, Switzerland. This article is an open access article distributed under the terms and conditions of the Creative Commons Attribution (CC BY) license (https://creativecommons.org/licenses/by/4.0/).
Share and Cite
Yang, Y.; Yu, Y.; Zhou, J.; Xi, H.; Wang, C.; Zhou, Y.; Fu, L.; Qi, Y.; Yuan, Y. Characterization and Analysis of Acetaldehyde Wastewater by Molecular Weight Distribution, Hydrophilicity, and Chemical Composition. Sustainability 2022, 14, 6540. https://doi.org/10.3390/su14116540
Yang Y, Yu Y, Zhou J, Xi H, Wang C, Zhou Y, Fu L, Qi Y, Yuan Y. Characterization and Analysis of Acetaldehyde Wastewater by Molecular Weight Distribution, Hydrophilicity, and Chemical Composition. Sustainability. 2022; 14(11):6540. https://doi.org/10.3390/su14116540
Chicago/Turabian StyleYang, Yang, Yin Yu, Jingling Zhou, Hongbo Xi, Chunrong Wang, Yuexi Zhou, Liya Fu, Yue Qi, and Yue Yuan. 2022. "Characterization and Analysis of Acetaldehyde Wastewater by Molecular Weight Distribution, Hydrophilicity, and Chemical Composition" Sustainability 14, no. 11: 6540. https://doi.org/10.3390/su14116540
APA StyleYang, Y., Yu, Y., Zhou, J., Xi, H., Wang, C., Zhou, Y., Fu, L., Qi, Y., & Yuan, Y. (2022). Characterization and Analysis of Acetaldehyde Wastewater by Molecular Weight Distribution, Hydrophilicity, and Chemical Composition. Sustainability, 14(11), 6540. https://doi.org/10.3390/su14116540