Article

Does the Environmental Information Disclosure Promote the High-Quality Development of China’s Resource-Based Cities?

School of Management, China University of Mining and Technology (Beijing), Beijing 100083, China
*
Author to whom correspondence should be addressed.
Sustainability 2022, 14(11), 6518; https://doi.org/10.3390/su14116518
Submission received: 6 May 2022 / Revised: 21 May 2022 / Accepted: 23 May 2022 / Published: 26 May 2022
(This article belongs to the Special Issue Economic Policies for the Sustainability Transition)

Abstract

:
The high-quality development (HQD) of resource-based cities (RBCs) is the premise on which to ensure the healthy, stable, and sustainable development of China’s economy. In this study, we use the global Malmquist–Luenberger index based on the slacks-based measure of directional distance function (SBM-DDF-GML index), which is an improved data envelopment analysis (DEA) model of the non-radial and non-oriented, to calculate the HQD level of 102 RBCs in China from 2003 to 2019. Then, we empirically evaluate the effect of environmental information disclosure (EID) on HQD improvement in RBCs by adopting the method of time-varying difference-in-difference with propensity score matching (PSM-DID) and investigate the heterogeneous effects of EID. Additionally, the mediating effect model is employed to explore the impact mechanisms of EID on the HQD. The results show that: (1) EID has a significant and positive effect on the HQD of RBCs, and this conclusion is still valid after a series of robustness tests. (2) EID plays a more effective role in the promotion of HQD in central RBCs, resource strong-dependent RBCs, growth RBCs, and regenerative RBCs than in other types of cities. (3) EID promotes the HQD of RBCs through the environmental pollution reduction effect and the industrial structure upgrading effect. These findings enrich the content of the relationship between EID and the HQD and present a feasible path for RBCs in China to achieve the HQD through environmental governance.

1. Introduction

Chinese resource-based cities (RBCs) have made extraordinary contributions to China’s industrialization process, as well as to national economic and social development [1]. However, due to the excessive exploitation and dependence on natural resources and the traditional extensive development model of high energy consumption, high emissions, and low benefits, a series of contradictions, such as resource depletion, imbalance of economic structure, and ecological environment destruction, has inevitably accumulated [2,3,4]. It has seriously constrained the sustainable development of RBCs and even hindered the improvement of the quality of China’s overall national economic growth, to a certain extent [5]. Moreover, globalization and increased competition have had a violent impact on such cities [6]. Accordingly, the importance of accelerating the transformation and sustainable development of China’s RBCs cannot be overemphasized. The Chinese government always attached great importance to RBCs and has promulgated a variety of guiding policies for the transformation and sustainable development of RBCs since 2001, such as The Plan for the Sustainable Development of Resource-based Cities in China (The Plan) (2013) [7], Guiding Opinions on Classification and Cultivation of Resource-based Cities to Transform and Develop New Momentum (2017) [8], and so on. In particular, under the background of China’s transition from high-speed development to high-quality development (HQD), the National Development and Reform Commission (NDRC) released the Implementation Plan for Promoting the High-quality Development of Resource-based Areas in the 14th Five-Year Plan Period (2021) [9], which mentioned the HQD of RBCs for the first time and put forward further expectations for the development of Chinese RBCs from 2021 to 2025. Consequently, it is necessary and of great importance to explore a sustainable way for the HQD of RBCs.
The HQD of RBCs in China refers to the development status, with strong resource security, economic dynamism, a beautiful ecological environment, and people’s good well-being [9]. It emphasizes the coordination and harmonization of quantity expansion and quality enhancement, and the transformation from “total expansion” to “structural upgrading and system optimization” [10]. Some scholars have adopted the multi-indicator measurement method to evaluate the level of HQD based on the multidimensional characteristics of HQD [2,11]. Meanwhile, because the development results of HQD include the welfare of residents, brought about by economic growth, as well as the use of resources and the cost of the ecological environment [12], the productive efficiency evaluation method, which takes into account both multiple inputs and multiple outputs containing environmental factors, could avoid the serious underestimation of the environmental costs of economic growth [13], and is therefore highly employed by a wide range of scholars in the calculation of HQD [14,15]. Moreover, the resource and environment regime, economic development level, industrial structure, and resource abundance are considered to be the possible factors affecting HQD [15,16,17,18,19].
At the same time, with the continuous improvement of material and cultural living standards, the quality of the ecological environment has become an essential indicator affecting people’s health and happiness. In order to accommodate for the people’s growing demand for a beautiful ecological environment, the Chinese central government has promulgated and implemented a range of laws on environmental governance, such as the Environment Protection Law, the Atmospheric Pollution Prevention and Control Law, and the Cleaner Production Promotion Law. Although these laws have been partially effective in pollution reduction and environmental protection, it is still hard to avoid the dilemma of “regulatory failure” caused by information asymmetry [20], which may lead to environmental management issues, such as high cost and low efficiency [21]. Fortunately, the rapid evolution of modern information technologies provides a breakthrough and critical opportunity for the introduction of new environmental governance measures based on the Internet platform [22,23]. In 2008, the Pollution Information Transparency Index (PITI Index) was jointly released by the Institute of Public and Environmental Affairs (IPE) and the US Natural Resources Defense Council (NRDC). It has systematically evaluated the level of regulatory information disclosure on urban pollution sources in China’s key environmental protection cities since 2008; it guarantees the people’s right to know and strengthens the monitoring of the government on environmental pollution data [24].
As an essential environmental governance policy, the implementation effects of the environmental information disclosure (EID) have attracted the close attention of researchers. Most scholars believe that EID can effectively promote environmental quality [25,26,27,28]. The reduction of scale effects, the optimization of industrial structure, and the enhancement of technological innovation are considered to be the key to reducing greenhouse gas emissions [26]. EID can also indirectly contribute to the reduction of total and per capita urban industrial pollution emissions by generating a positive interaction between government environmental enforcement and public environmental participation [27]. Moreover, EID could mitigate the negative externalities of air pollution by increasing government environmental spending, environmental employment, and infrastructure development [28]. However, some scholars have queried the effectiveness of EID. The main argument is that the environmental pollution behavior of private enterprises with political connections could not be significantly affected by EID, owing to the shelter effect of the Chinese local governments [29]. In addition, a large number of studies have demonstrated the beneficial role of EID in the development of regions [30,31] and enterprises [32,33,34]. Nevertheless, some scholars hold the opposite view, considering the mandatory EID to be an obstacle to the improvement of economic performance because of its consumption of limited resources in increasing environmental management activities [35]. As for the economic and social development of RBCs, most existing research has concentrated on the development or transformation performance assessment [36,37,38], influencing factors [39,40], and sustainable development paths [41,42,43]. Scholars have sought to evaluate the sustainable development level by using the index system [36,37] and the efficiency measurement model [38,42]. Social harmony, economic development, and environmental improvement are regarded as the most critical aspects in the construction of the indicator system [37]. Economic level, industrial structure, resource endowment, energy price, government intervention, and degree of openness are identified to have a significant impact on RBCs’ transformation efficiency [39], along with other factors [38,40,41]. Some studies have also recognized the role of policy factors in the transformation of RBCs [44,45], such as the implementation of the National Sustainable Development Plan for RBCs [44], and the new energy demonstration city policy [45], which has remarkably facilitated the industrial structure upgrading and the green total factor productivity (GTFP) of RBCs, respectively. Furthermore, the structural effect, innovation effect, and financial support effect are considered to be impact paths of promoting GTFP [45].
Despite the growing literature, few studies have taken RBCs as the research object and attempted to figure out the relationship between EID and its HQD. That is, does the implementation of EID have a positive impact on the HQD of RBCs? If there is an impact, does the EID influence HQD the same across the different types of RBCs? Additionally, the specific mechanism path by which EID affects HQD is unclear. Therefore, to shed light on these issues, we take the disclosure of the PITI index as a quasi-natural experiment, using the sample of China’s RBCs from 2003 to 2019 to perform an empirical study, by adopting the multiple regression model, the time-varying difference-in-difference with propensity score matching (PSM-DID) method, and the mediating effect model.
The main contributions of this study are reflected in the following aspects: (1) The implementation of EID may involve multiple stakeholders, including local governments, enterprises, and the public, whose behavior patterns would be influenced by the enforcement of this policy to a certain extent. Therefore, based on the stakeholder theory and the information asymmetry theory, this study builds a potential theoretical analysis framework of which EID affects the HQD of RBCs from the multi-governance perspective of the “government–enterprise–public”, which could enrich the theoretical research of environmental governance policy and the urban HQD field. (2) Compared with the economic growth quality, HQD pursues the synergistic development of the economy, society, and environment, and has a wider scope and higher requirements. To this end, the measurement of HQD should not only reflect the economic benefits but also needs to capture the cost of the resources and the state of the ecological environment. In this study, the global Malmquist–Luenberger index based on the slacks-based measure of directional distance function (SBM-DDF-GML index), considering resource and environmental constraints, is adopted to evaluate the HQD level of RBCs, reflecting the degree of coordination between ecological environment protection and social-economic development. It is helpful to gain an overall picture of the HQD of RBCs, and the model provides reliable data for empirical analysis. (3) In the empirical research section, we employ the PSM-DID method to effectively overcome the sample selectivity bias issue and take the air ventilation coefficient as an instrumental variable to further address the endogenous problem, which is conducive to accurately identifying the causal relationship between EID and the HQD of RBCs. In addition, we investigate a more comprehensive range of heterogeneity factors, including urban geographic location, degree of resource dependency, and urban development stage. In addition, the impact mechanism by which EID influences the HQD is further explored through the mediating effect model.
The remainder of this study is structured as follows: Section 2 introduces the theoretical analysis framework and research hypotheses. Section 3 presents the methods, research scope, and data sources. Section 4 reports the empirical results and corresponding analysis. Section 5 further conducts the heterogeneous analysis and the mechanism analysis. Section 6 draws the conclusions and discusses the policy implications.

2. Theoretical Analysis Framework

As a key policy instrument in environmental governance, EID can focus the public’s attention on the supervision of local government’s information disclosure and enterprise’s environmental behavior, as well as their own interests through the reputation mechanism [46], which facilitates the formation of a polycentric governance system, consisting of three stakeholders: government, enterprises, and the public [47]. Therefore, the implementation of EID may indirectly affect the HQD of RBCs by influencing the behavior of the government, enterprises, and the public. To this end, we integrate the government, enterprises, and the public into the theoretical analysis framework of EID affecting the HQD of RBCs and attempt to elaborate the mechanism from the perspective of each subject.
The government plays a leading role in the Chinese environmental governance system. On the one hand, environmental information proposes a critical reference for the government to make various social and economic development policies. EID enables local governments to monitor the state of the urban ecology and environment, and accurately grasp the crucial issues of environmental governance through access to environmental information. As a result, local governments can formulate and promote the relevant laws and policies accordingly, to achieve the effective governance over all aspects of the sustainable economic and social operation. On the other hand, EID strengthens the supervision of the community to the local government. The monopoly profit generated by the exploitation of environmental resources tends to bring about the power rent-seeking of the government and government failure in environmental regulation [48]. EID makes it mandatory for local governments to report environmental-related information according to relevant regulations, instead of making trade-offs depending on the regulatory difficulties and the “reputation effect” [46]. It provides an external incentive for local governments to abandon the “worship GDP” performance assessment system and contribute to a win-win situation for ecological protection and economic development in RBCs.
Enterprises are the main body participating in market activities, which creates substantial economic value but causes severe ecological environment problems at the same time. EID is a prerequisite for the government and the public to monitor and supervise enterprises to fulfill their environmental responsibilities. Meanwhile, it is also an inevitable requirement for enterprises to comply with sustainable economic and social development. On the one hand, the disclosure of environmental information increases the exposure of enterprises’ environmental pollution behavior. Consequently, polluting enterprises will face severe pressure from the government. The internalization of external environmental costs forces enterprises to improve their production processes and business models through in-depth introspection regarding their shortcomings rather than “ecological opportunistic” behavior [49]. It could optimize resource allocation efficiency and reduce the environmental pollutants emission, in order for enterprises to meet regulatory requirements. On the other hand, within the context of the global green and low-carbon development, enterprises will focus on green innovation in technology and equipment to adapt, guide, and even create consumer demand through cleaner products and services production. As a result, enterprises will occupy the “first competitive advantage” while taking the responsibility for environmental protection [50]. It provides an internal impetus for locals to build a modern industrial system by promoting the optimization and upgrading of industrial structures on the supply side and boosting the quality and efficiency of economic development in RBCs.
The ecological environment is closely related to the personal interests of the public. According to the theory of environmental rights, the public enjoys the right to know, participate, and supervise the environment [51]. Environment information is an essential source for the public to safeguard their legitimate rights and interests, and is the fundamental starting point for the public to participate in environmental protection. First, the public supervises the government’s environmental governance and the enterprises’ environmental performance by paying attention to environmental information, which resolves the “government failure” and the “ecological opportunism” behavior to some extent. In addition, it would thus improve the efficiency of its environment governance [52]. Second, EID will motivate the public to participate in environmental protection actively. It helps to form a green and low-carbon consumption concept and an energy-saving and environmentally friendly lifestyle throughout the society. Thereby, environmentally friendly products and services will obtain more trust and approval from stakeholders [53], which could encourage the optimization and upgrading of industrial structures from the demand side and then promotes the HQD of the city.
In a comprehensive view, EID could enhance the openness and transparency of urban environmental governance, facilitate the sharing and interaction of information among the government, enterprises, and the public, and alleviate a series of issues caused by information asymmetry. It is helpful to formulate and promote the environmental governance system with a “government lead, enterprise as the main body, and public participation”, enhance the efficiency of urban resource allocation, reduce the environmental pollution, accelerate the green and low-carbon transformation of the industrial structure, and thus promote the HQD of RBCs.
According to the above theoretical analysis, we have formulated the following hypotheses:
Hypothesis 1 (H1).
EID can positively promote the HQD of China’s RBCs in general.
Hypothesis 2 (H2).
EID promotes the HQD of China’s RBCs by the environmental pollution reduction effect and industrial structure upgrading effect.
The specific impact mechanism of EID on the HQD of China’s RBCs can be summarized in Figure 1.

3. Materials and Methods

3.1. Model Design

3.1.1. SBM-DDF-GML Index

The data envelopment analysis (DEA) model is widely applied in academia because of its characteristics that do not require a specific production function form and because it can be applied to deal with systems with multiple inputs and outputs [47,54]. However, DEA typically ignores the bad outputs that are produced along with the desirable outputs [55]. Moreover, the radial and oriented problems can inevitably cause overestimated technical efficiency when there are nonzero slacks [13]. To this end, researchers have progressively extended and optimized the traditional DEA model. The slacks-based measure (SBM) maximizes input and output slacks [56], the directional distance function (DDF) and Malmquist–Luenberger (ML) index were proposed to take the undesirable output and environmental concept into account [55], and the slacks-based measure of directional distance function (SBM-DDF) allows for a non-radial scaling of outputs and inputs [57]. Even so, it fails to achieve the comparability of the inter-temporal production frontier [58]. In contrast, the global Malmquist–Luenberger index based on directional distance function (SBM-DDF-GML index) can effectively address the radial and oriented problems of the absolute GML index, and deals with the inconsistency and incomparability of the production frontier in SBM-DDF.
(1)
The Global Production Possibility Set
The global production possibility set P G has been constructed by Oh [59] to effectively achieve the consistency and comparability in the production frontier. Assuming that there are J decision-making units (DMUS), then each RBC is a DMU that transforms N kinds of inputs x i n = ( x i 1 , x i 2 ,…, x i n ) R N + into M kinds of desirable outputs y i m = ( y i 1 , y i 2 ,…, y i n ) R M + and K kinds of undesirable outputs b i k = ( b i 1 , b i 2 ,…, b i K ) R K + . The specific expressions of P G are as follows:
P G = { ( x t , y t , b t ) : t = 1 T i = 1 I z i t x i n t x i n t , n ; t = 1 T i = 1 I z i t y i m t y i m t , m ; t = 1 T i = 1 I z i t b i k t = b i k t , k ; t = 1 T i = 1 I z i t = 1 , z i t 0 , i }
where i represents different RBCs, t represents different periods, z i t is the weight variable, i = 1 I z i t = 1 , z i t 0 represents variable return to scale (VRS).
(2)
SBM-DDF
According to the research of Fukuyama et al. [57], this study takes into consideration the resource and environmental factors, which include input indicators of labor input, capital investment, and energy consumption, desirable outputs of economic growth and ecological efficiency, and undesirable outputs indicators of wastewater discharge, exhaust emission, and particulate emission. Then, we define the global SBM-DDF, covering undesirable outputs as follows:
S V G ( x t , i , y t , i , b t , i , g x , g y , g b ) = max s x , s y , s b 1 N n = 1 N S n x g n x + 1 M + K ( m = 1 M S m y g m y + k = 1 K S k b g k b ) 2   s . t .   t = 1 T i = 1 I z i t x i n t + s n x = x i n t , n ; t = 1 T i = 1 I z i t y i m t s m y = y i m t , m ; t = 1 T i = 1 I z i t b i k t + s k b = b i k t , k ; i = 1 I z i t = 1 , z i t 0 , i ; s m y 0 , m ; s k b 0 , k
where ( x t , i , y t , i , b t , i ) represents input, desirable output, and undesirable output vector, respectively, the definitions and calculations of which are detailed in the next section. ( g x , g y , g b ) is the direction vector that indicates contracting input, expanding desirable output, and reducing undesirable output, respectively, and ( s n x , s m y , s k b ) is the slack vector that indicates the redundant input, insufficient desirable output, and excessive undesirable output, respectively.
(3)
GML Index
With reference to the existing research [59], we construct the SBM-DDF-GML index as follows:
G M L t t + 1 = 1 + S V G ( x t , y t , b t , g x , g y , g b ) 1 + S V G ( x t + 1 , y t + 1 , b t + 1 , g x , g y , g b )
where S V G ( x t , y t , b t , g x , g y , g b ) is the global SBM-DDF based on non-radial and non-oriented measurements. G M L t t + 1 indicates the growth of the GML index from t to t + 1 period, G M L t t + 1 < 1 indicates the decline of the GML from t to t + 1 period, and G M L t t + 1 = 1 indicates that the GML index is stable from t to t + 1 period.

3.1.2. Time-varying Difference-in-Differences (DID) Method

The implementation of EID causes regional differences between environmental information disclosing RBCs (EID RBCs) and non-environmental information disclosing RBCs (non-EID RBCs) during the sample period, as well as temporal differences between disclosing cities before and after disclosure. Those two differences provide an excellent opportunity to conduct a quasi-natural experiment for capturing the net effects of EID on the HQD of RBCs by adopting the DID method. Moreover, the cities disclosing PITI index expanded from 113 in 2008 to 120 in 2013. Therefore, this study employs the time-varying DID method, which could control the two differences simultaneously and identify the net effect more accurately.
The benchmark regression model is constructed as follows:
H Q D i t = α 0 + α 1 E I D i t + α 2 X i t + λ i + μ t + ε i t
where subscript i and t represent different cities and years, respectively. The dependent variable H D Q i t is measured by the value of the GML index. The explanatory variable E I D i t is a policy dummy variable, indicating whether city i discloses environmental information in year t. α 0 is the constant term. The coefficient α 1 denotes the net and total effect of EID on the HQD. X i t represents a series of control variables affecting the HQD. λ i and μ t indicate city-fixed effects and year-fixed effects, respectively. ε i t is the error term.

3.1.3. Propensity Score Matching (PSM) Method

The implementation of EID in China may not be completely random but may instead be related to the individual heterogeneous characteristics of cities. To eliminate the sample selectivity bias caused by failing to meet the assumption of the random assignment of groups, this study uses the propensity score matching (PSM) method to match the control group to the treatment group with similar characteristics through an appropriate matching method [60,61]. Therefore, the method of time-varying difference-indifference with the propensity score matching (PSM-DID) method is adopted to more accurately identify the net effect of EID on HQD.
According to the application logic of the PSM method [62], the specific matching steps are as follows. First, the sample is divided into the treatment group and the group to be matched. Second, the propensity matching score is calculated by constructing a logit model, including six covariates that may affect the probability of a city being selected as a disclosing city, including economic development level (Econ), urban greening level (Green), infrastructure level (Infra), informatization level (Infor), financial development level (Fina), and resource endowment (Resou). Third, the K near neighbor matching method is applied. Then, each city in the treatment group could be matched with one city or multiple cities of extremely similar characteristics in the control group.

3.1.4. Mediating Effect Model

Based on the existing literature and the illustration in the theoretical analysis section, this study proposes two channels through which EID could promote the HQD of RBCs: reducing environmental pollution and boosting industrial structure upgrading. To verify these mechanisms, a stepwise regression approach is adopted to construct a mediating effect model by following the designs of Baron et al. [63] and Li et al. [64]. The specific form presents in formulas (5)–(7).
H Q D i t = β 0 + β 1 M i t + β 2 X i t + λ i + μ t + ε i t
M i t = η 0 + η 1 E I D i t + η 2 X i t + λ i + μ t + ε i t
H Q D i t = φ 0 + φ 1 E I D i t + φ 2 M i t + φ 3 X i t + λ i + μ t + ε i t
where M i t denotes the intermediary variable. The coefficient β 1 measures the impact of M on the HQD, η 1 measures the impact of EID on M, and the coefficient φ 1 indicates the direct effect of EID on the HQD. The indirect effect of EID on the HQD is calculated by the product of η 1 and φ 2 . Other variables are set in accordance with the formula (4).
According to the test procedure of the mediating effect [65], if the signs of β 1 × η 1 are consistent with that of α 1 mentioned in formula (4), then the mediating effect of M is β 1 × η 1 . Otherwise, the effect of EID on the HQD through M is manifested as a masking effect. In addition, if φ 1 and φ 2 are all significant, and φ 1 is less than α 1 , the partial mediating effect of M between EID and the HQD is proved. If φ 2 is significant but φ 1 is not, it means that the total effect of EID on the HQD is completely realized by the mediating variable.

3.2. Variables and Measurements

3.2.1. Dependent Variable

High-quality development (HQD). In order to better reflect the HQD level of RBC, this study considers the dual constraints of energy consumption and environmental pollution, in addition to the traditional production factors of labor and capital. The specific input and output indicators are shown in Table 1.
Input indicators include labor input, capital investment, and energy consumption, which are measured by the number of employees, capital stock, and total energy consumption in each city at the end of the year, respectively. In particular, the perpetual inventory method is employed to estimate the capital stock with the formula K i t = K i t 1 ( 1 δ i t ) + I i t [66], where, K i t ,   I i t ,   δ i t denote the capital stock, the total investment in fixed assets, and the depreciation rate (set at 9.6%) [15] of the city i during t period, respectively. In addition, we take the product of the proportion of urban industrial output value in that of the province it belongs to and the total energy consumption of the province to measure the energy consumption of each city by referring to Cui et al. [2].
Output indicators include desirable output and undesirable output. Desirable output indicators include economic growth and ecological efficiency, measured by the real GDP deflated into the 2003 constant price and greening coverage rate of built-up areas of each city, respectively. Undesirable output indicators include wastewater discharge, exhaust emission, and particulate emission, measured by industrial wastewater discharge, industrial SO2 emission, and PM2.5 concentration of each city, respectively.

3.2.2. Independent Variable

Environmental information disclosure (EID). EID is the interaction term between T r e a t i and T i m e i t dummy variables. T r e a t i represents whether a city discloses environmental information during the sample period. For RBCs that disclose environmental information, T r e a t i equals 1, otherwise, it equals 0. Namely, the corresponding variables of 35 RBCs in the treatment group are set as 1, while that of the other 68 RBCs in the control group are set as 0. T i m e i t indicates whether year t is the EID implementation point of city i. T i m e i t equals 1 for every year after city i discloses environmental information, otherwise, it equals 0.

3.2.3. Mediating Variables

(1) Environmental Pollution Reduction.
To comprehensively examine the impact mechanism of EID promoting HQD through environmental pollution reduction, we choose the urban industrial wastewater discharge intensity (Wastewater), industrial exhaust emission intensity (SO2), and particulate emission intensity (PM2.5) as mediating variables to represent the environmental pollution effect.
(2) Industrial Structure Upgrading.
To verify whether industrial structure upgrading plays an intermediary role between EID and HQD, the following two variables are selected as mediating variables. To be specific, the proportion of the added value of the secondary industry to GDP is applied to measure the changes in the secondary industry (CSI), and the ratio of the added value of the third industry to that of the secondary is adopted to represent the industrial structure upgrading (ISU) [67].

3.2.4. Control Variables

According to the practice of previous research [19,25,32,68,69,70], we introduce a vector of control variables to decrease the influence of other potential factors, as follows:
(1)
Economic development level (Econ), calculated by GDP per capita, deflated into the constant price of 2003 in logarithmic form.
(2)
Urban greening level (Green), calculated by the greening coverage rate of urban built-up areas.
(3)
Infrastructure level (Infra), calculated by the urban road area per capita.
(4)
Informatization level (Infor), calculated by the ratio of the number of Internet users to the total population.
(5)
Financial development level (Fina), calculated by the ratio of the deposit and loan balances of financial institutions at the end of the year to GDP.
(6)
Resource endowment (Resou), calculated by the number of employees in the extractive industry in logarithmic form.

3.3. Sample Selection and Data Sources

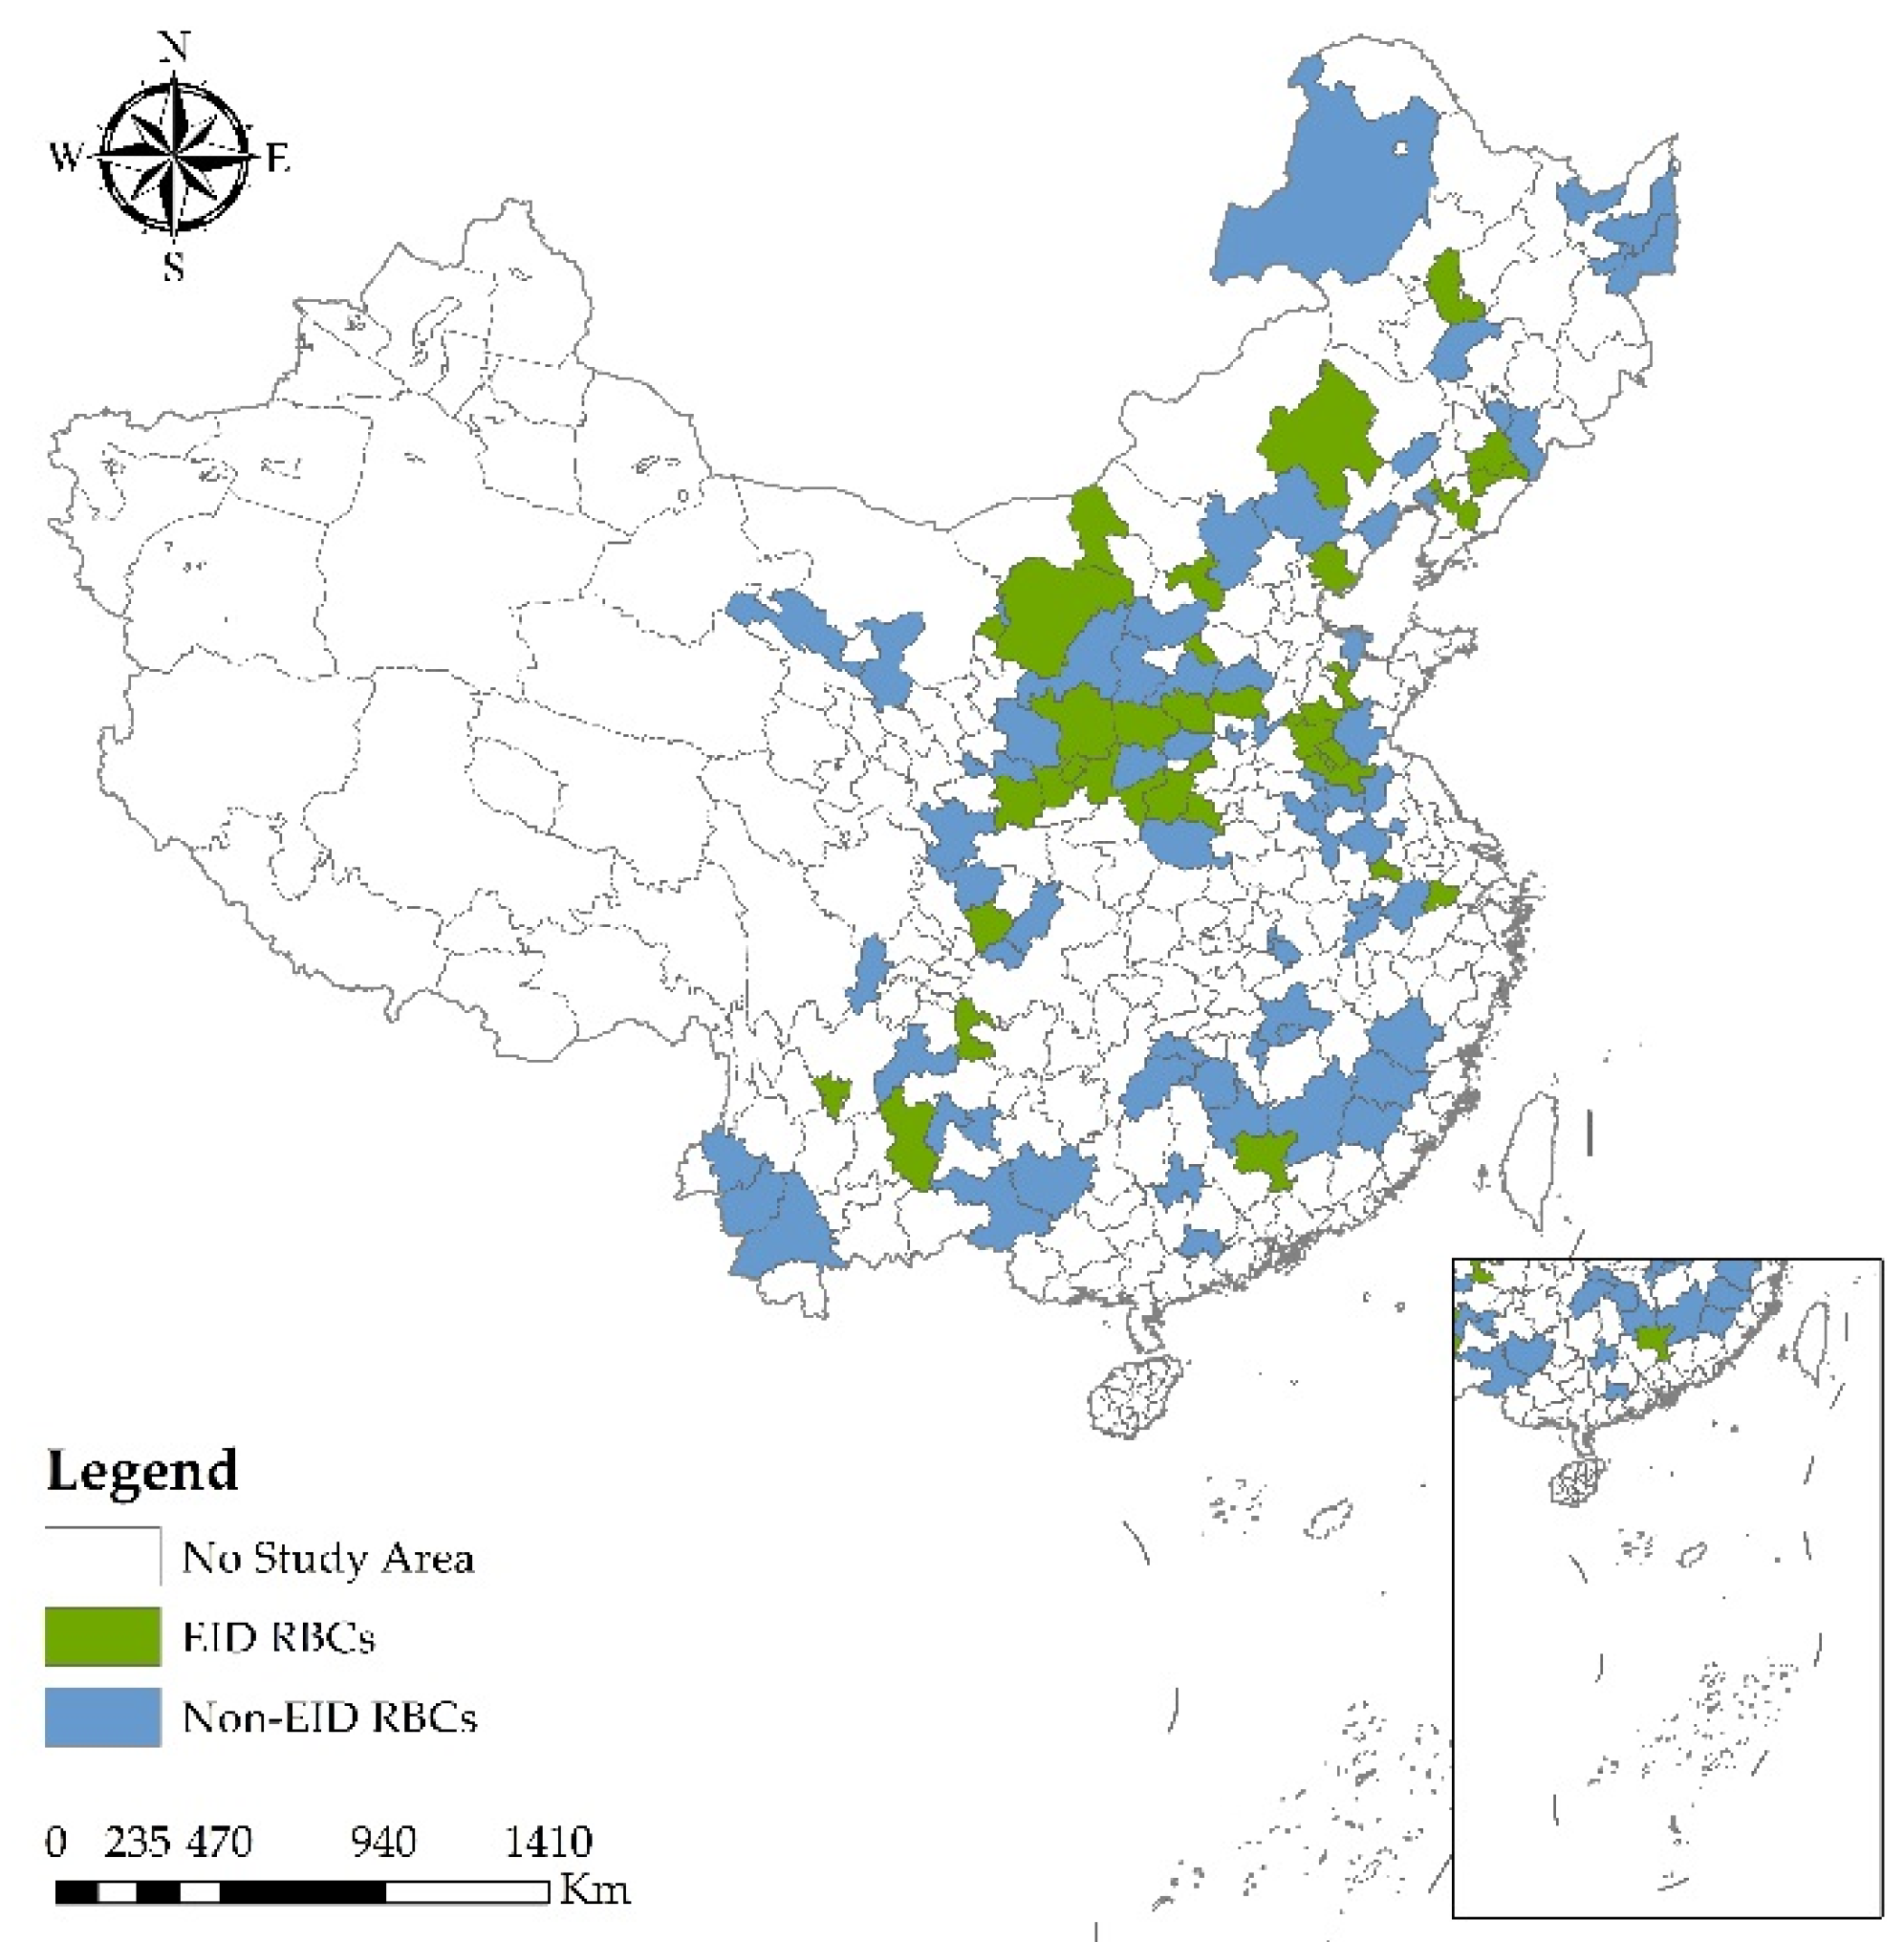
The sample period is from 2003 to 2019. This study begins with all prefectures and above RBCs covered in The Plan and the PITI index report. The relevant data are mainly derived from China City Statistical Yearbook (2004–2020), China Regional Economic Statistical Yearbook (2004–2020), China Statistical Yearbook (2004–2020), China Energy Statistical Yearbook (2004–2020), and the National Economic and Social Development Statistical Bulletin (2003–2019). In addition, the PM2.5 concentration data are obtained from the Socioeconomic Data and Applications Center (SEDAC) of Columbia University. To ensure data availability, continuity, and comparability, we clean the data according to the following procedures. First, we exclude seven forestry cities (Jilin, Baishan, Heihe, Yichun, Mudanjiang, Daxinganling, and Lijiang), nine autonomous prefectures (Yanbian Korean, Tibetan Qiang of Ngawa, Liangshan Yi, Qiannan Buyi and Miao, Southwest Guizhou, Chuxiong Yi, Haixi Mongolian and Tibetan, Bayingol Mongolian, and Altay), and two special resource-type cities (Zigong and Jingdezhen). Second, we exclude five cities (Shuozhou, Bijie, Jinchang, Baiyin, and Karamay) with serious data deficiencies. Third, to avoid the influence of outliers, all continuous variables are winsorized at the top and bottom 1%. Fourth, missing data in some years are interpolated and supplemented. Thereby, the final city–year observations are 1734 for 102 RBCs, including the treatment group and control group consisting of 35 EID RBCs and 67 non-EID RBCs, respectively (see Figure 2). In terms of data analysis and processing, we mainly use the Stata 16.0 software.
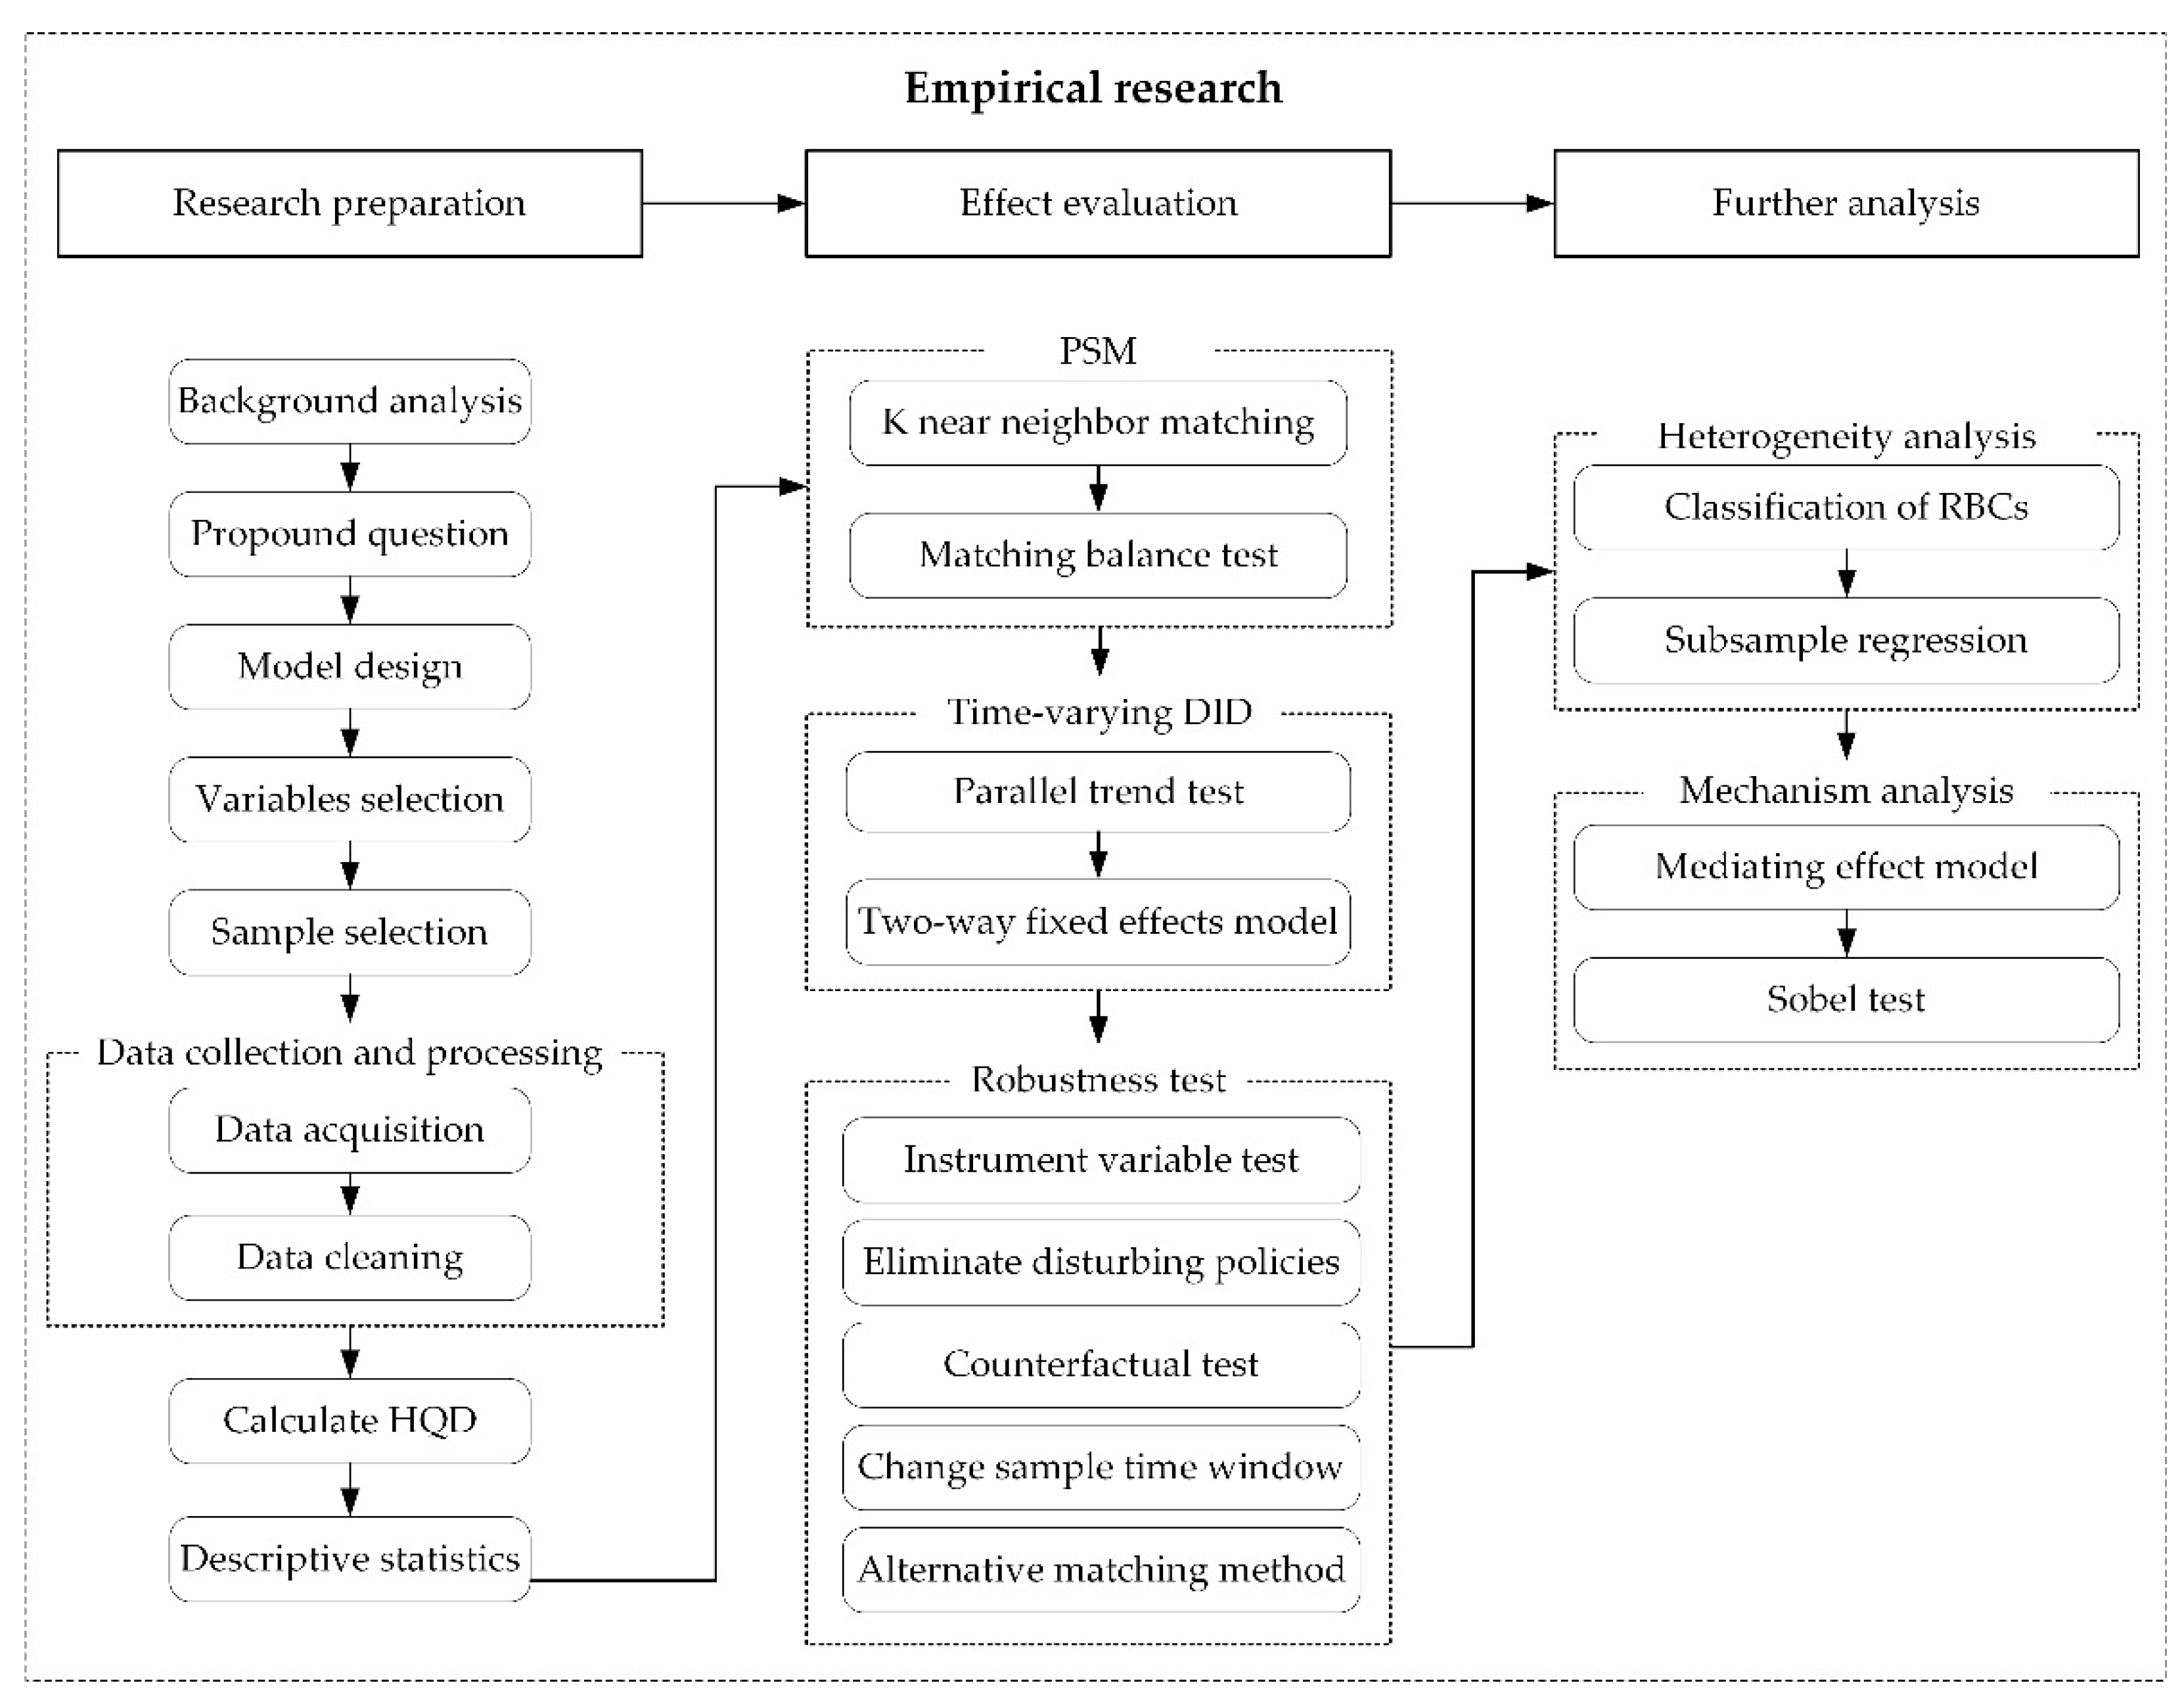
Based on the above model and data, this study assesses the effect of EID on HQD in China’s RBCs and then further explores the heterogeneous impact of EID as well as the impact mechanisms of EID on the HQD. All the key links and specific practices of the empirical research part of this study are shown in the flow scheme in Figure 3.

4. Empirical Results and Discussion

4.1. Calculation of HQD

In this study, taking the labor input, capital investment, and energy consumption as production input indicators, economic growth and ecological efficiency as desirable indicators, and environmental pollutant emissions covering wastewater discharge, exhaust emission, and particulate emission as undesirable indicators (see Table 1), Max-DEA 8.0 software and the SBM-DDF-GML index are employed to measure the HQD in 102 of China’s RBCs from 2003 to 2019. The GML index is a change rate value, which needs a regression treatment [71]. Suppose that all HQDs in 2003 are 1, then the HQD in 2004 would be the HQD in 2003 multiplied by the GML index: H Q D 2004 = H Q D 2003 × G M L 2003 2004 . The HQD of other years can be calculated similarly. The spatial and temporal patterns of HQD in China’s RBCs are illustrated in Figure 4, showing a general upward trend from 2004 to 2019. From the perspective of temporal distribution, there are 23 RBCs with an HQD great than 1 in 2004, and by 2009, the number has increased to 44. In addition, the spatial distribution of the HQD in RBCs is unbalanced.

4.2. Descriptive Statistics

The descriptive statistics of the main variables are shown in Table 2. Panel A reports the descriptive statistics for the full sample. Panel B reports comparisons between the treatment group and the control group. As can be seen, almost variables are significantly different across the treatment group and the control group, which confirms the discrepancy between EID RBCs and non-EID RBCs.

4.3. Variable Multicollinearity Test

The results of the Pearson and Spearman correlation coefficient matrix are presented in Table 3. As we can see, the correlation coefficients among the variables are all less than 0.5, which indicates that there is no strong correlation between the variables in this study. Then we perform the variance inflation factor (VIF) test (see Table 4), which shows that the VIF value varied from 1.16 to 2.14 and far less than the cut-off of 10. Therefore, the variables pass the multicollinearity test.

4.4. PSM Results

Figure 5a reports the common range of propensity score distribution of the treatment group and the control group after PSM, in which the x-axis represents the probability of a city being selected as a treatment city. It shows that the great majority of the observed values are in the common support region, which demonstrates that the data processed by PSM are applicable for the further DID estimation. Figure 5b is the result of the covariates standardized bias test, in which the x-axis represents the standardized bias between the treatment group and control group before and after being matched, and the y-axis represents the covariates involved in the logit model. As we can see, the standardized bias of covariates narrows significantly after PSM, which is considered to be suitable according to the 20% standard value of Rosenbaum et al. [60]. Furthermore, Figure 5c,d show the kernel density distribution curves before and after PSM, respectively, in which the x-axis represents the propensity score value, and the y-axis represents the kernel density of the propensity score. It reveals that the difference in propensity score between the treatment group and the control group has declined after PSM.
The matching balance test is then conducted to examine the distribution of the covariates between the treatment group and the control group. Table 5 provides the details of covariates before and after the PSM. As we can see, the overall differences of covariates decline significantly to less than 10%, which meets the requirement of no more than 20%. Moreover, the t-value for all covariates is not significant after PSM, demonstrating that there is no systematic difference between the treatment group and the control group after matching except for whether they are subject to the EID. In summary, the sample after PSM is suitable for further DID analysis.

4.5. Parallel Trend Test

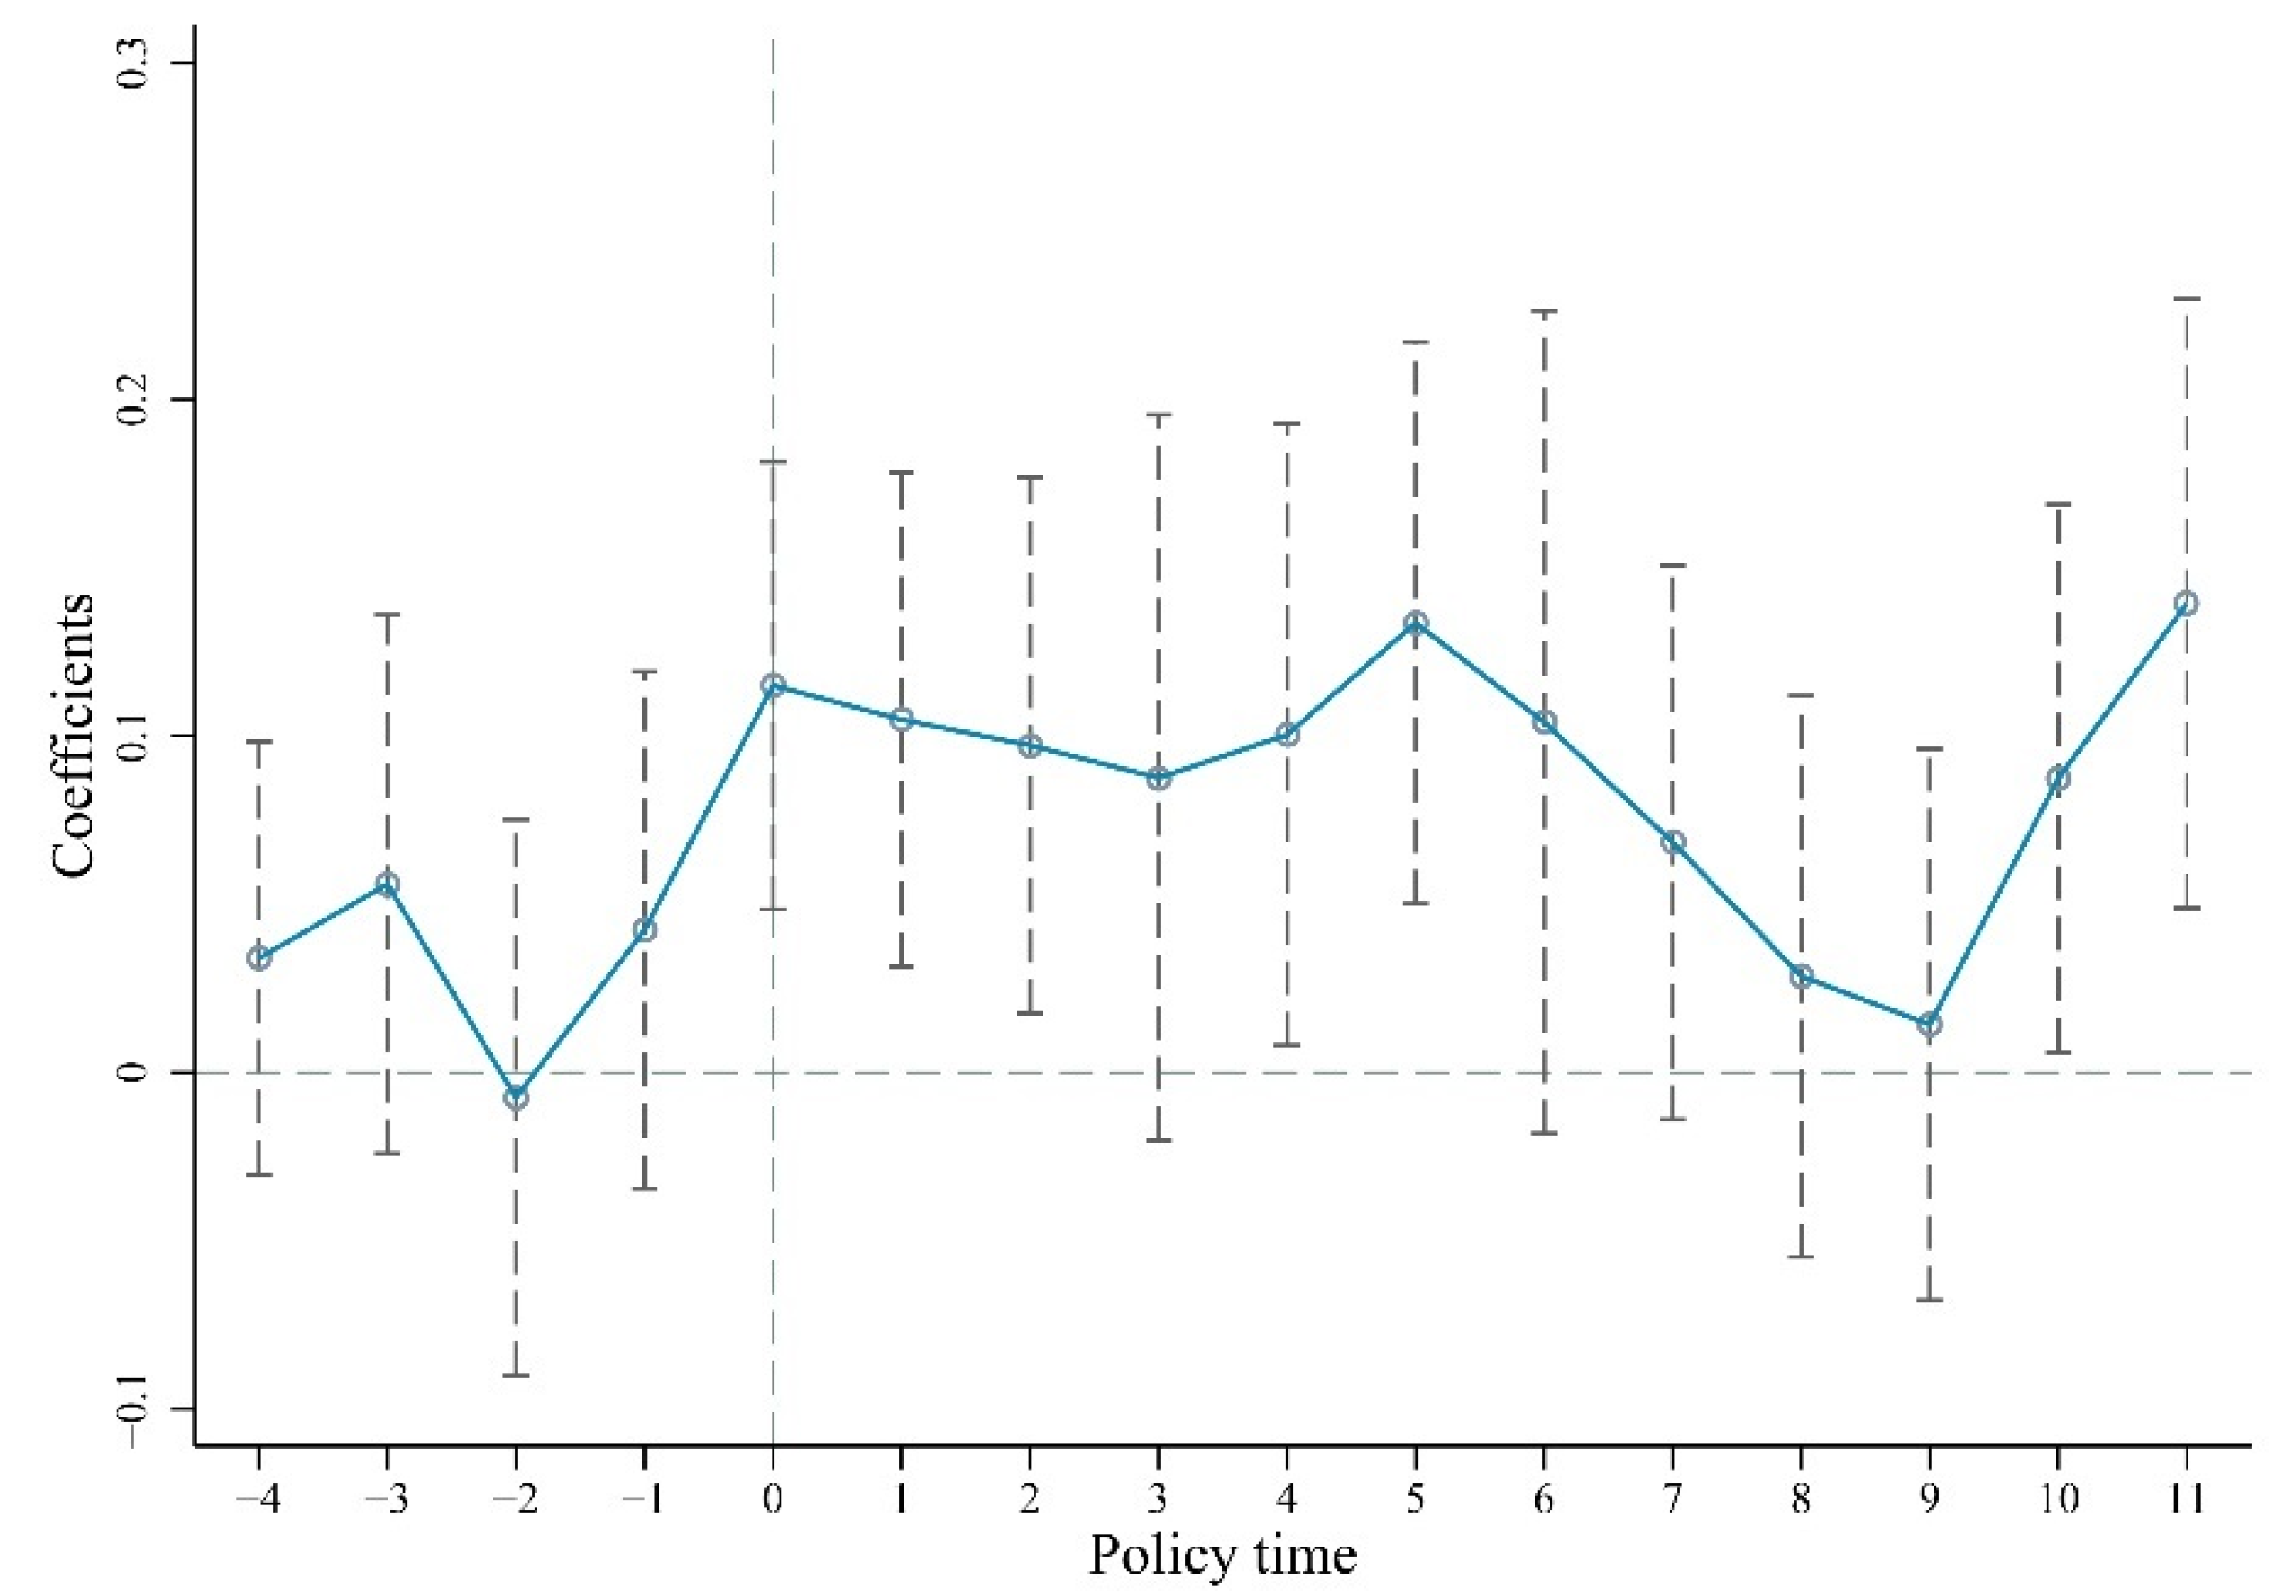
The essential premise of the DID method is that the dependent variable requires to satisfy the parallel trend assumption, namely, the HQD of the treatment group and the control group should maintain a consistent trend before the exogenous shock of EID. Therefore, referring to the research of Beck et al. [72], the event study approach is adopted to conduct the parallel trend test, and the specific model is constructed as follows:
H Q D i t = δ 0 + δ i t j = 5 j = 11 δ t 0 + j E I D i t 0 + j + δ 2 X i t + λ i + μ t + ε i t
where E I D t 0 + j is the interaction term of T r e a t   i and T i m e t dummy variables, indicating whether city i implements EID in year t0 + j. The T i m e t dummy variables include time for 5 years before the EID implementation and 11 years after the EID implementation. Subscript t0 indicates the first implementation point of EID. The coefficient δ denotes the variation in the HQD between the treatment group and control group at the jth year of the EID implementation. In addition, the other variables are consistent with formula (4).
Figure 6 presents the dynamic trend of EID affecting HQD, in which the x-axis represents the time before and after the implementation of EID, the y-axis represents the margin effect of the EID on HQD, and dashed lines indicate the 95% confidence interval. As can be seen, the estimated coefficients of EID approach 0 significantly at a 95% confidence interval from 2004 to 2007, which demonstrates that there are no remarkable differences in HQD between the treatment group and the control group before the implementation of EID. At this point, the parallel trend hypothesis holds. Furthermore, the impact of EID on HQD starts to be significant after the implementation of EID and presents a relatively fluctuating trend over time in general. The possible reason is that the EID system in China is imperfect. For example, the majority of enterprises are still reluctant to disclose environmental information and shoulder environmental protection responsibilities consciously, which makes it difficult to form a long-term mechanism for promoting the HQD [68].

4.6. Baseline Regression Results

The baseline regression results are shown in Table 6. Columns (1)–(3) show the regression results of the DID method and columns (4)–(6) present the regression results of the PSM-DID method. Columns (1) and (4) are the preliminary estimation results without the control variables added, showing that the EID implementation has a remarkable positive impact on the HQD of RBCs and passes the 1% significance test. Columns (2) and (5) report the regression results with the control variables, and the coefficients of EID are still positive and statistically significant at the critical levels of 10% and 5%, respectively. Columns (3) and (6) show the regression results with further consideration of two-way fixed effects, which show that the implementation of EID has significantly increased the HQD of RBCs. In particular, the estimated coefficient of column (6) indicates that the implementation of EID improves the HQD level of disclosing RBCs by 5.9% at a significance level of 1%. From this, hypothesis H1 is verified.
The regression results of the control variables are described as follows: (1) The estimated coefficient of economic development level (Econ) is significantly positive at the 1% level, indicating that the higher the level of economic development of a city, the more it can promote HQD. (2) The urban greening level (Green) is significantly positive at the 1% level, indicating that the increase in greening coverage is conducive to the development of the urban economy in a green and high-efficiency way. (3) The infrastructure level (Infra) is significantly negatively related to the HQD. The reason may be that massive, blind, and duplicative infrastructure construction generates excess and ineffective capacity, crowding out other types of investment, which is detrimental to the HQD of RBCs. (4) The effect of the informatization level (Infor) is positive, denoting that the information revolution is helpful to promote the quality and efficiency of urban development. (5) The effect of financial development (Fina) is positive but not significant, which may be attributed to the financial resource misallocation, resulting in the imbalance of economic structure and hindering the optimization and adjustment of the industry [73]. (6) The impact of resource endowment (Resou) on HQD is negative. This is probably because the excessive dependence on natural resources in RBCs squeezes out the positive factors such as technology innovation and talent reserve, and further impedes the HQD.

4.7. Robustness Test

In this section, a series of robustness tests are carried out to further justify the validity of the above empirical results.

4.7.1. Instrumental Variable Approach

To further address the potential endogeneity issue caused by the nonrandom layout of EID, the instrumental variable approach is employed to quantitatively investigate the impact of EID on the HQD after endogeneity elimination. Specifically, we select the air ventilation coefficient (VC) as an instrumental variable for EID by referring to Hering et al. [74] and Chen et al. [75], and construct a two-stage least squares (2SLS) regression estimation model as follows:
E I D i t = θ 0 + θ 1 V C i t + θ 2 X i t + λ i + μ t + ε i t
H Q D i t = γ 0 + γ 1 E I D i t + γ 2 X i t + λ i + μ t + ε i t
where V C i t represents the air ventilation coefficient, which is obtained from the European Centre for Medium-Range Weather Forecasts (ECMWF). Other variables are set the same as in the baseline model.
The outcomes of the instrumental variable test are listed in columns (1) and (2) of Table 7. For the validity of the instrumental variable, the value of the Kleibergen–Paap rank Wald F statistic is beyond 10, indicating the rejection of the hypothesis of the weak instrumental variable. Meanwhile, the P-value of the Kleibergen–Paap rank LM statistic is significant at the 1% level, denoting the rejection of the hypothesis of under-identification. Thus, the above tests illustrate that the selection of our instrumental variable is appropriate. In addition, column (1) of Table 7 reports the first-stage regression result, which denotes that the VC is positively correlated with EID at the 1% significant level. The second stage regression result is presented in column (2) of Table 7. Compared with the baseline regression results in Table 6, the coefficient of EID increases remarkably after the instrumental variable is involved, indicating that the implementation of EID can indeed improve the HQD of RBCs and the potential endogeneity issues tend to understate the contribution of EID on the HQD.

4.7.2. Eliminate Disturbing Policies

In the estimation process of the impact of EID on the HQD, it is inevitable that there will be other environmental policy influencing factors, so that the estimation effect would be biased. In 2007, China launched the pilot project of emissions trading in 11 provinces, which is a market-based environmental regulatory policy that may affect the HQD. Therefore, the interaction term of this policy and time is involved as a control variable in our baseline regression model, by referring to Tao et al. [76]. Column (3) of Table 7 shows the estimated coefficient of EID after eliminating the disturbing policies, which is in line with the baseline regression results, proving the robustness of the baseline results in this study.

4.7.3. Counterfactual Test

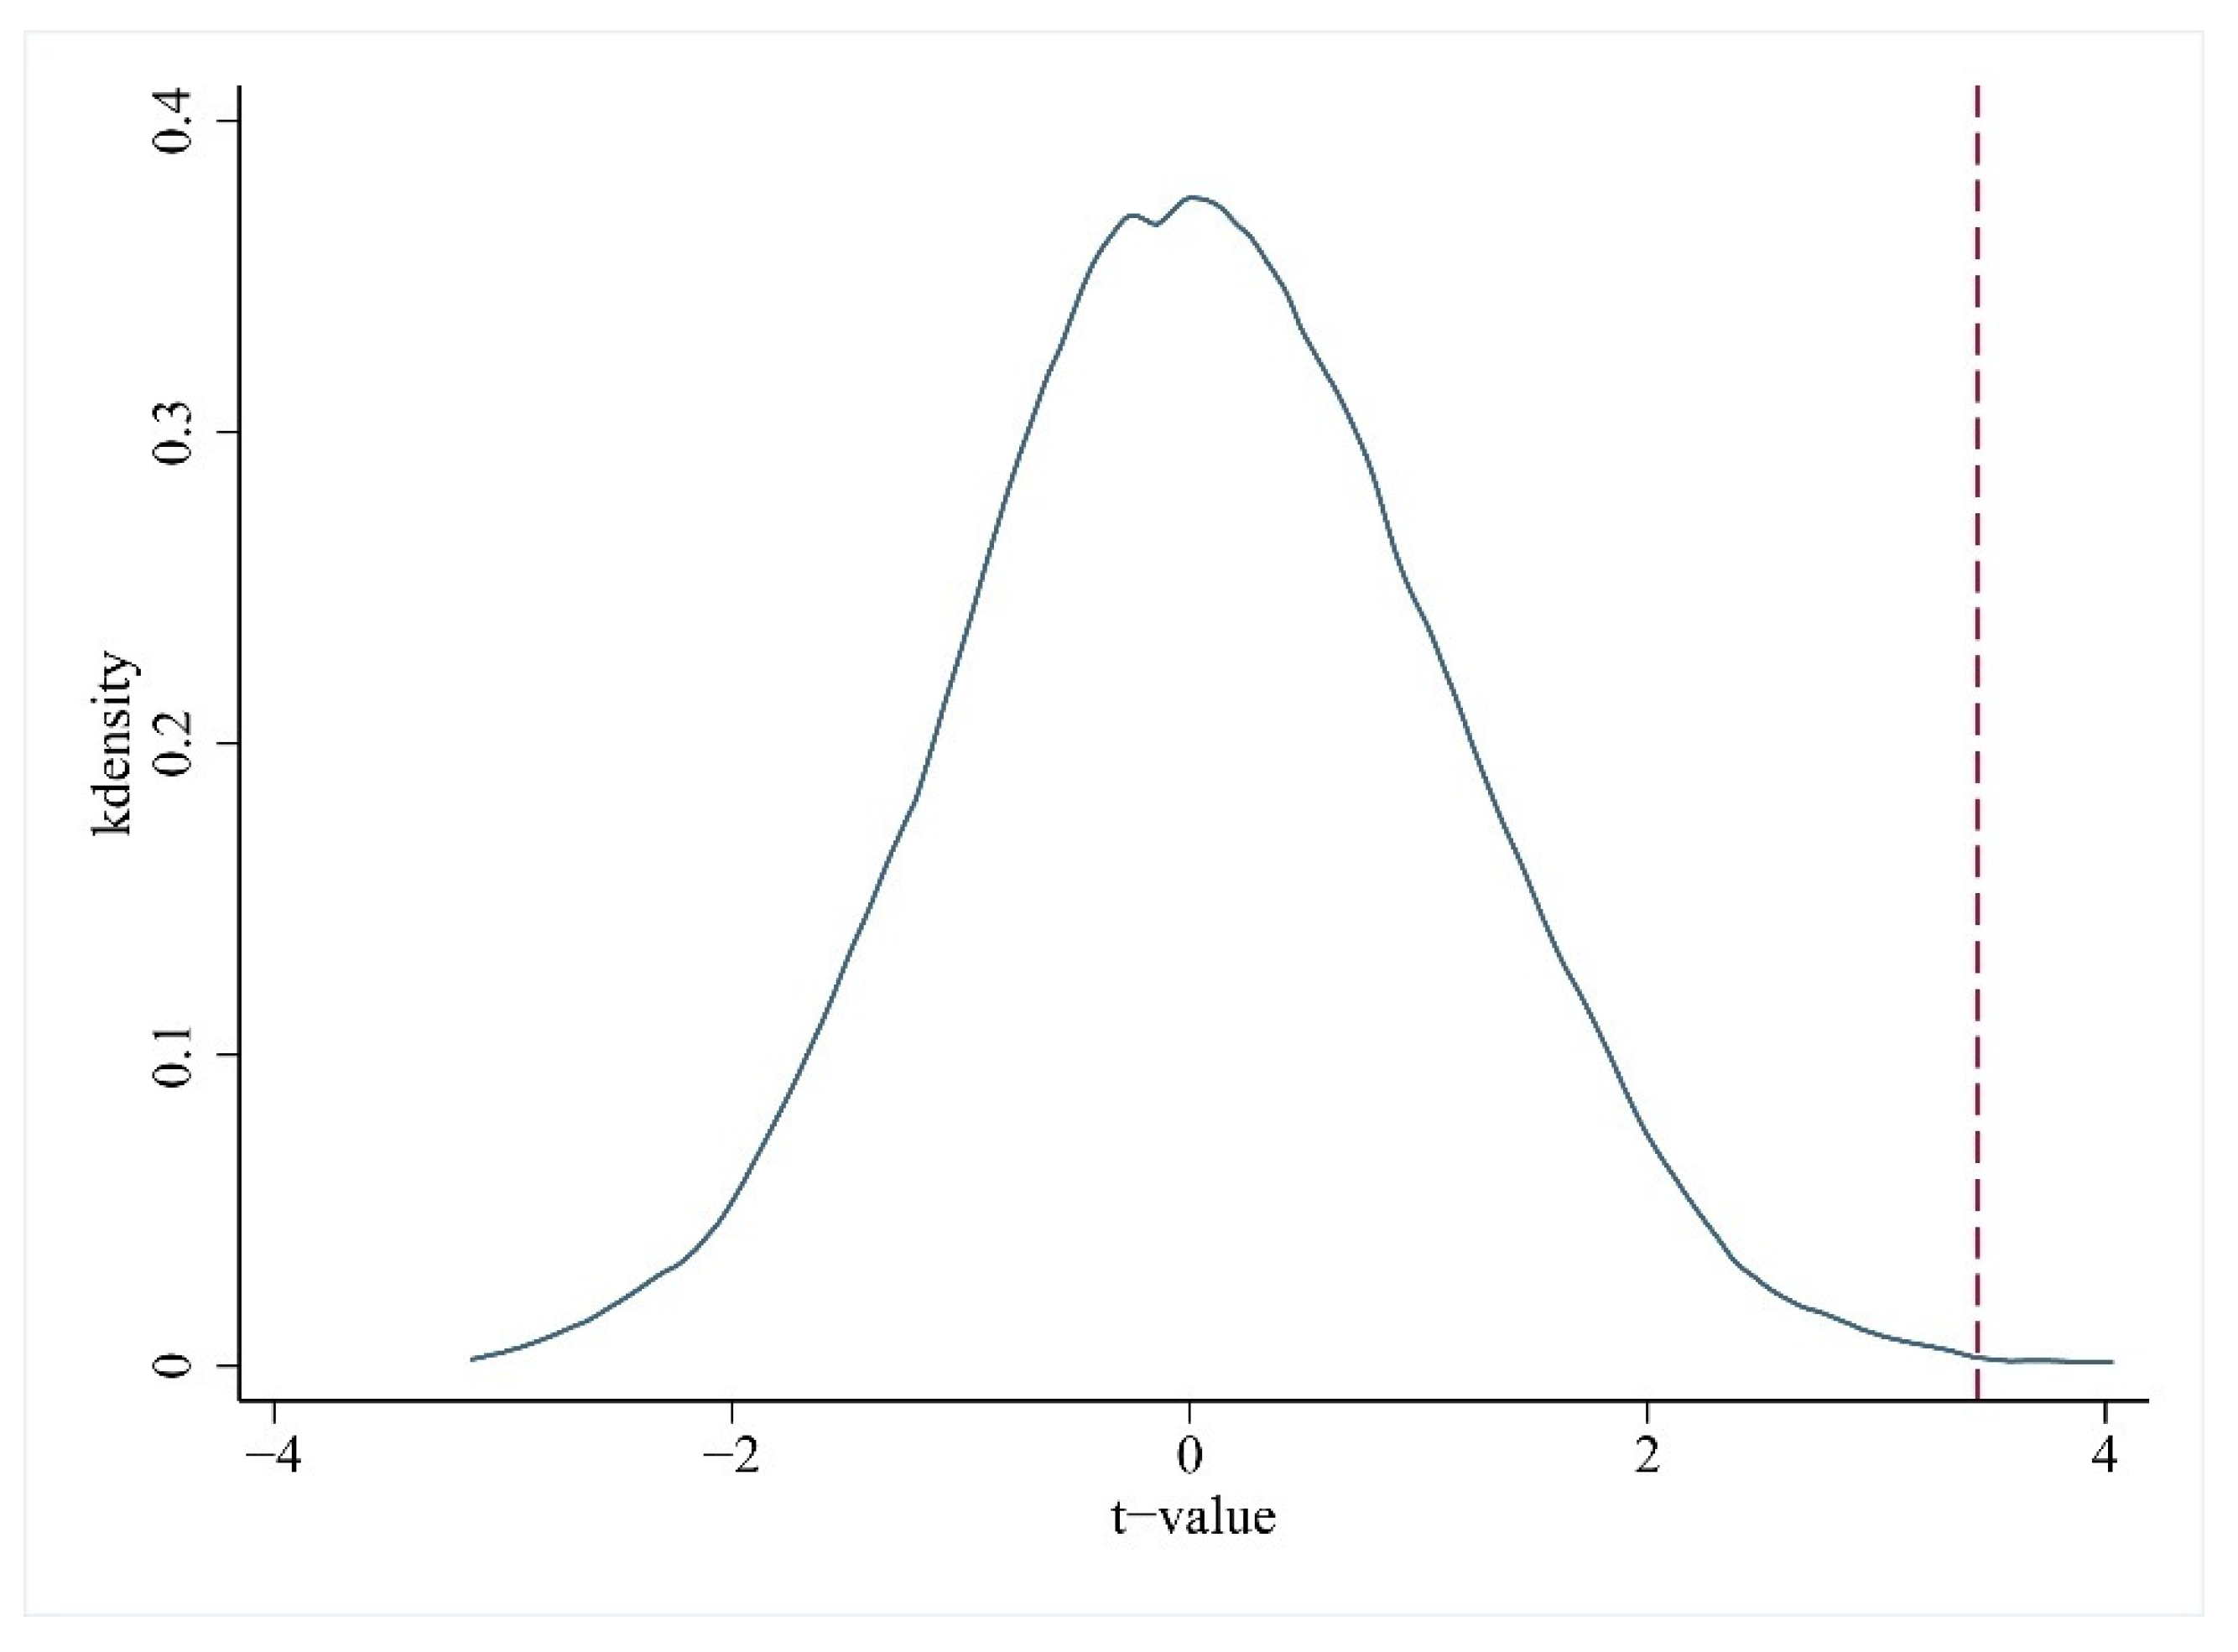
The counterfactual tests are conducted to exclude other random factors. First, referring to Tang et al. [77], the implementation point of EID is delayed for two years, and the coefficient is re-estimated. Column (4) of Table 7 shows that the estimated coefficient of the fictitious EID intervention is not significant, verifying that the promotion of the HQD is indeed due to the implementation of EID rather than other policies. Second, a placebo test is performed by randomly selecting the pseudo treatment group 1000 times. Thus, 1000 estimated coefficients are obtained and plotted on the kernel density distribution map, as shown in Figure 7, where the x-axis represents the t-statistic value of the estimated interaction term coefficients and the y-axis represents the density of the t-statistic value. We can find that only a few of the t-statistic values exceed that of the baseline model in Table 6, which proves that the promotion effect of EID on the HQD is not seriously affected by the non-observed factors. In summary, the baseline regression results in this study are robust.

4.7.4. Change the Sample Time Window

In this study, the baseline regression is based on the relatively long period from 2003 to 2019. To eliminate the interference of other environmental policies on the effect of EID, we adjust the sample period to 2003–2012 and perform the parameter estimation again. The regression result is presented in column (5) of Table 7, which shows that the estimated coefficient of EID is significantly positive after the sample period is adjusted. Therefore, the robustness of the estimation results of the baseline regression model is verified.

4.7.5. Alternative Matching Method

To verify whether the method of PSM affects the accuracy of the benchmark results, we adopt the kernel matching method to rematch the research samples and perform the DID regression. According to column (6) of Table 7, the coefficient of EID is still significantly positive, which indicates that the promotion effect of EID on the HQD is estimated to be robust.

5. Further Analysis

5.1. Heterogeneity Analysis

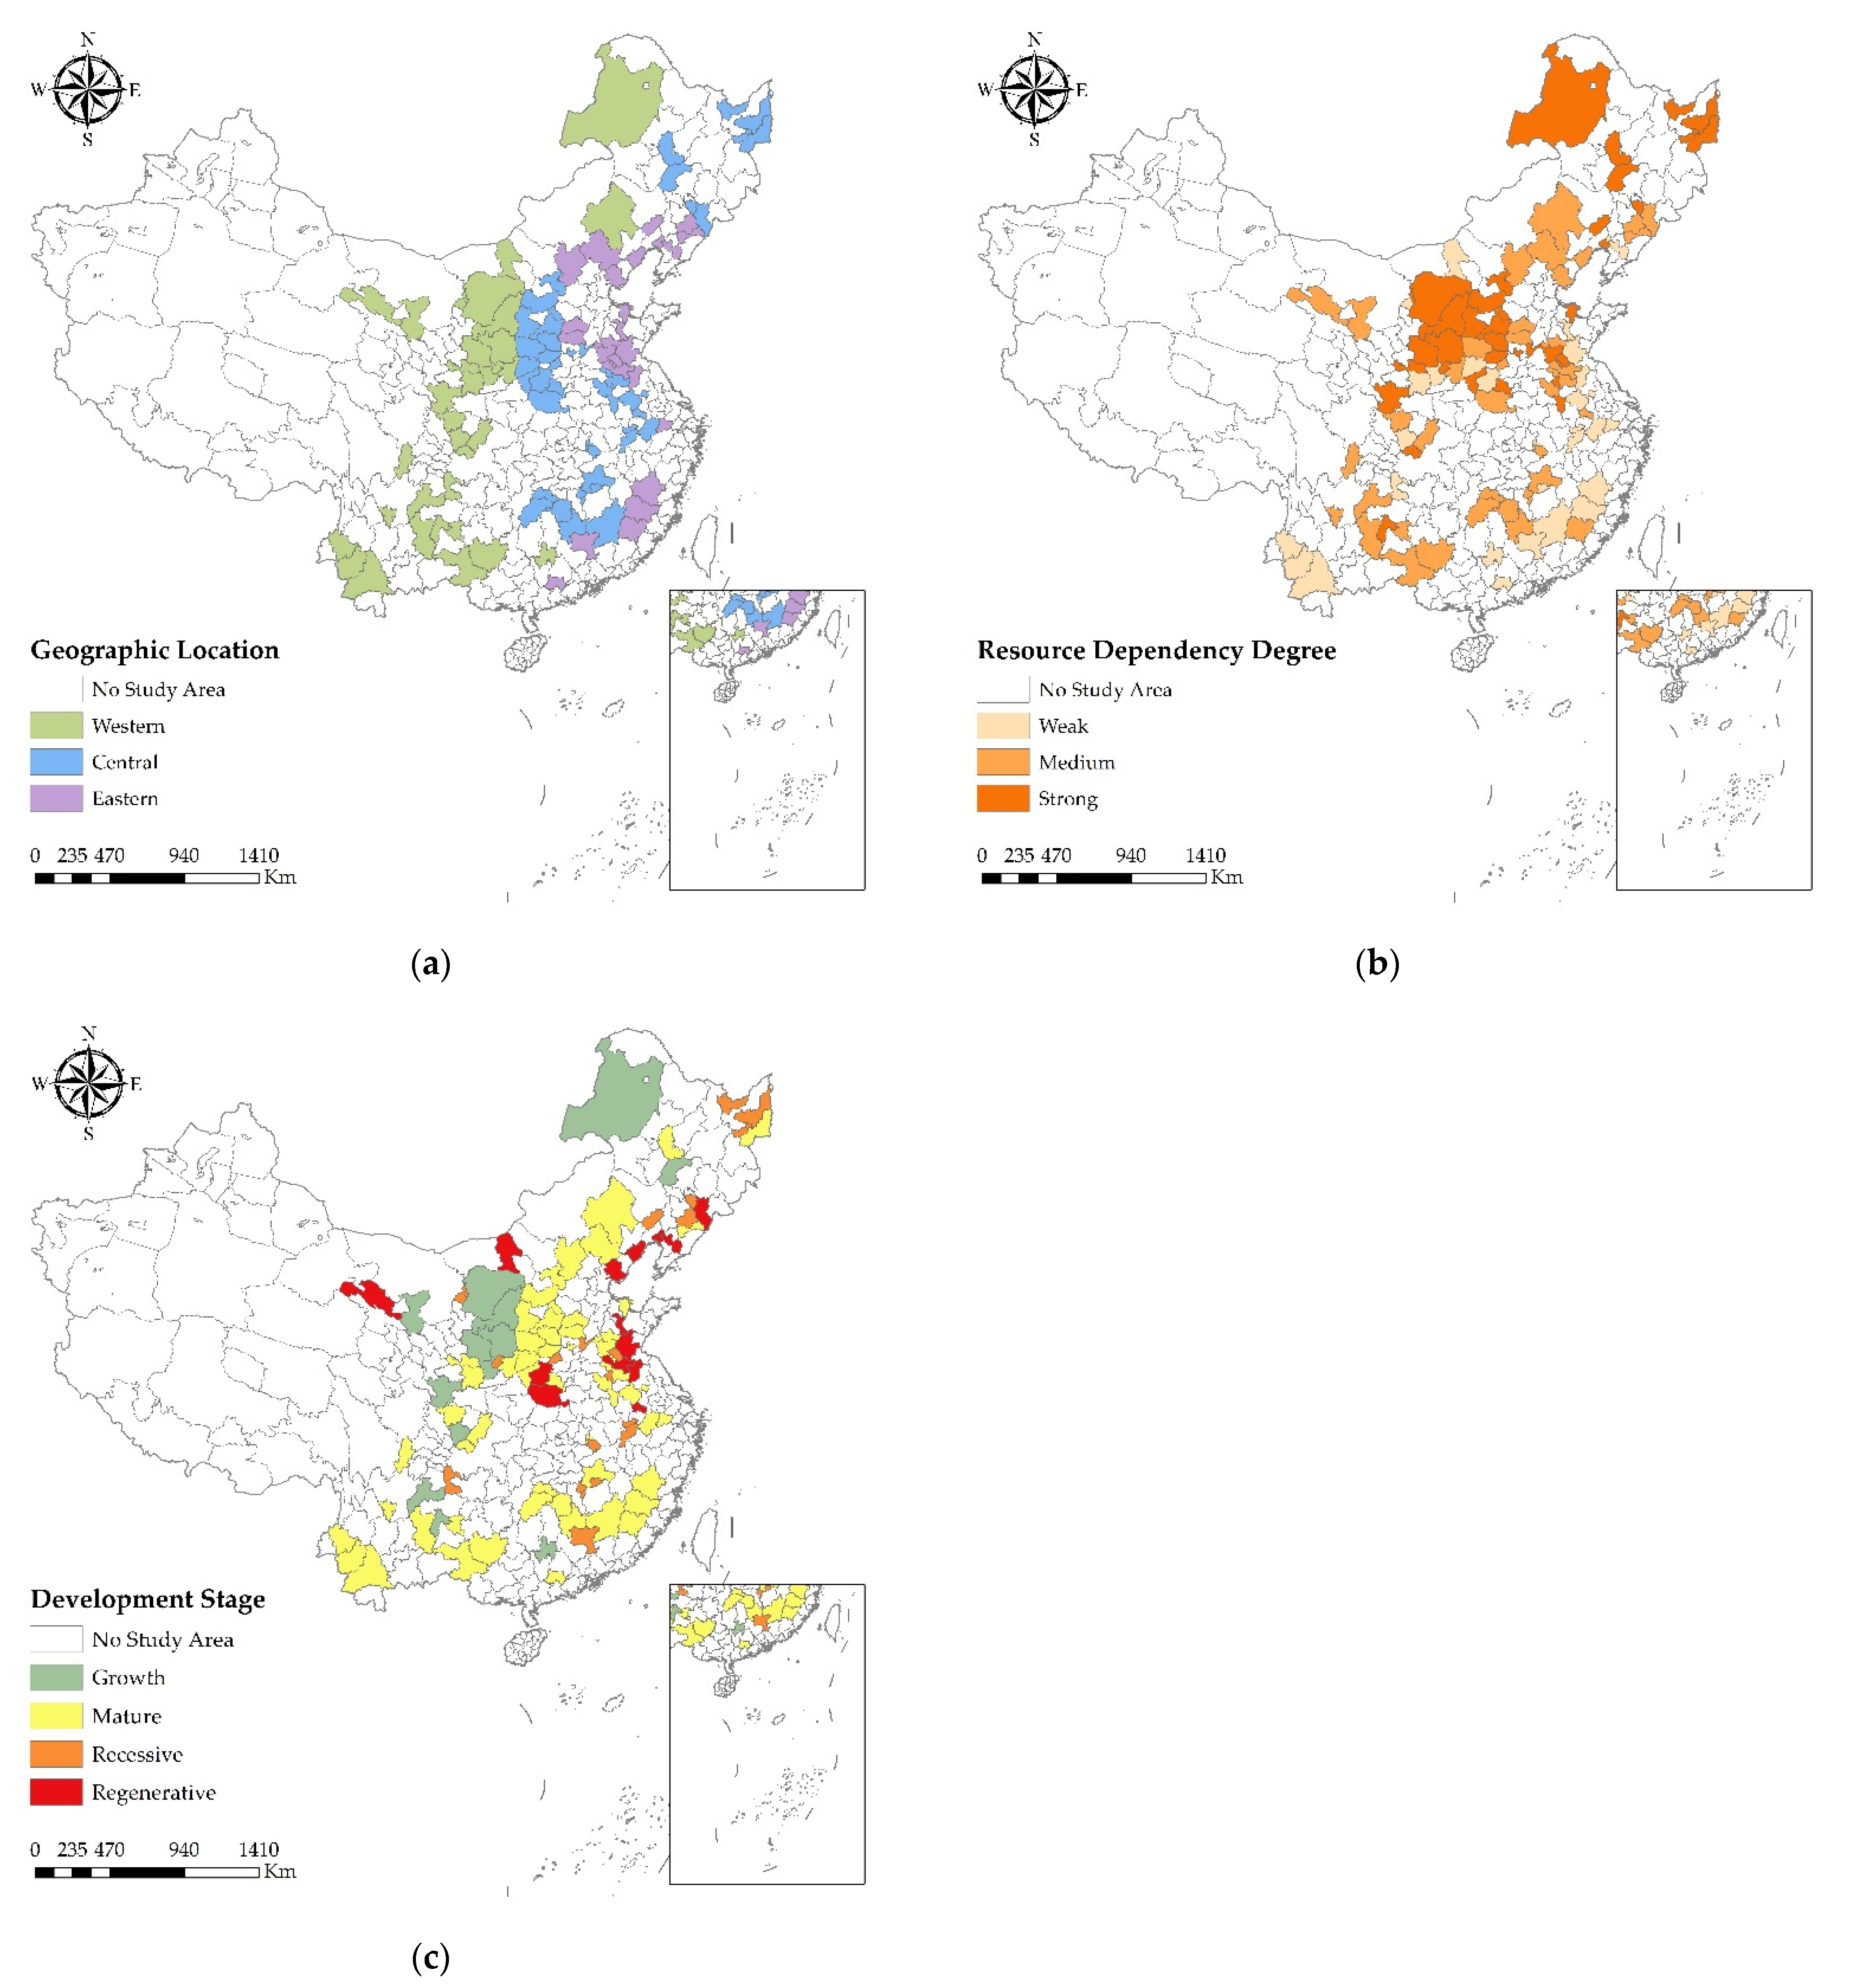
In this section, we explore three factors that may contribute to the heterogeneous impact of EID on the HQD, including urban geographic location, urban resource dependency degree, and urban development stage. The spatial pattern of China’s RBCs under the three classifications drawn by ArcGIS 10.8 is shown in Figure 8.

5.1.1. Heterogeneity of Urban Geographic Location

There are spatially unbalanced characteristics among different regions in terms of urban economic development level, industrial structure, and so on. To explore the heterogeneous effect of EID on the HQD caused by the geographic location, the overall research sample is divided into western, central, and eastern regions based on urban geographic location, as shown in Figure 8a. Regressions are then conducted separately for each region (see Table 8). Columns (1)–(3) show that the estimated coefficients of EID are positive in all regions. However, only the coefficient of the central RBCs is significant, indicating that the effect of EID on the HQD is different across geographic locations. The possible reasons are as follows. At present, the disparity in economic development across regions in China still exists objectively. Benefiting from the reform and opening-up policies and its location, the eastern RBCs have a first-mover advantage in finance, talents, and technology, which leads to a relatively weak shock of external policies on its HQD. For the western RBCs, on the one hand, the government may strenuously pursue economic overtaking due to the pressure of political performance rather than to emphasize the implementation of environmental governance. On the other hand, although the western region is abundant in natural resources, its excessive dependency on resource extraction may also plunge it into the resource curse [78], thus impeding its transformation and HQD.

5.1.2. Heterogeneity of Urban Resource Dependency Degree

Resource dependency is the essential characteristic of RBCs, and is also a significant basis for the government to formulate transformation policies for RBCs. As to determine whether the effect of EID on the HQD is heterogeneous among cities due to resource dependence, China’s RBCs are categorized into strong-dependent RBCs, medium-dependent RBCs, and weak-dependent RBCs, according to the division criteria of Yan et al. [79] (see Figure 8b). Regressions are independently performed for the three sub-samples, and the estimated results are shown in columns (4)–(6) of Table 8. The regression coefficient of EID is significantly positive in strong-dependent RBCs, while the coefficients of weak-dependent and medium-dependent RBCs are not significant, demonstrating the heterogeneous influence of different resource dependency degrees on the HQD enhancement. This is probably because weak-dependent and medium-dependent RBCs are less dependent on resource-based industries for development than strong-dependent RBCs. Therefore, the HQD of the first two types of RBCs is less likely to fluctuate significantly with the implementation of policies related to the resource and environment.

5.1.3. Heterogeneity of Urban Development Stage

RBCs at different stages of development vary in their development priorities and face distinct challenges. Based on The Plan, we classify the research sample into four groups of growth, mature, recessive, and regenerative RBCs according to the development stage of the RBCs (see Figure 8c). Columns (7)–(10) of Table 8 present the regression results, indicating that the impacts of EID on the HQD are remarkably positive in the cities of all four stages. Specifically, the growth and regenerative RBCs have a greater response to EID while the mature and recessive RBCs do not. This might be attributed to the differences in resource security capacity and sustainable development capacity across the different stages of RBCs. Although the mature RBCs are in a stable phase of resource exploitation, they are also facing the difficulties of a single industrial structure and insufficient endogenous power for urban transformation. Meanwhile, regressive RBCs are confronted with the prominent issues of resource exhaustion and ecological environment destruction, which result in a lower gathering capacity for capital and talents and difficulties in forming complete replacement industries in a short period.

5.2. Mechanism Analysis

5.2.1. Environmental Pollution Reduction Effect

The regression results are reported in Table 9, which show that the estimated coefficients of EID in columns (2), (5), and (8) are negative at the significance level of 5%, 10%, and 5%, respectively, indicating that EID has significantly reduced the discharge of wastewater, as well as the emission levels of SO2 and PM2.5. Columns (3), (6), and (9) reflect the regression results of EID on the HQD after controlling for environmental pollutants. We can see that the estimated coefficients of EID are lower in columns (3) and (9) and are no longer significant in column (6) compared to the baseline regression results in Table 6, indicating that pollution reduction is an essential mechanism for EID to affect the HQD. In addition, the above regression results pass the Sobel test at least at the 5% significance level, illustrating the robustness of the empirical results. It can be concluded that the implementation of EID could drive polluting industrial enterprises to phase out backward production capacity, improve resource allocation efficiency, and pay attention to energy conservation and environmental pollution reduction, so as to promote the HQD of RBCs. In other words, the implementation of EID can contribute to the improvement of HQD by reducing environmental pollutants.

5.2.2. Industrial Structure Upgrading Effect

The corresponding regression results are presented in Table 10. According to the mediation effect test procedure, the estimated coefficient of EID in column (2) is significantly negative at the 1% significant level after controlling the city and year fixed effect, and the estimated coefficient of EID in column (3) is positive at a 5% significant level, which denote that the implementation of EID promotes the HQD by contracting the added value of the secondary industry. In column (5), the estimated coefficient of EID on ISU is significantly positive at the 1% confidence level, which indicates that EID has effectively increased ISU. The estimated coefficient of EID on the HQD in column (6) is still significant at a 1% critical level, demonstrating that ISU is an essential path for EID to influence the HQD improvement. Furthermore, the mediating effect of CSI and ISU both pass the Sobel test significantly, which demonstrates that the above results are valid. Consequently, EID may stimulate the invention and creation of new technologies, new products, and new processes, which will then accelerate the transformation and upgrading of industrial structures, thus promoting the improvement of the HQD. That is, the implementation of EID can stimulate the HQD through industrial structure upgrading.
In summary, the implementation of EID can enhance the HQD and improvement of RBCs by reducing environmental pollution and boosting industrial structure upgrading. Thus, hypothesis 2 is supported.

6. Conclusion and Policy Implications

This study treats the EID implementation in 2008 as a natural exogenous shock and constructs a quasi-natural experiment using panel data of 102 RBCs in China from 2003 to 2019. We first measure the HQD levels for each RBC by adopting the SBM-DDF-GML index of an improved DEA model, which takes capital, labor, and energy as input factors, economic and ecological benefits as desirable outputs, and environmental pollutant emissions as undesirable outputs. On this basis, the PSM-DID method and the mediating effect model are employed to systematically investigate the effect and the impact mechanisms of EID on HQD. The main findings of this study are as follows: (1) In general, there is an upward trend of the HQD of RBCs in China from 2004 to 2019. Meanwhile, the implementation of EID can significantly promote the HQD of RBCs, and the conclusions remain unchanged after performing a series of robustness tests, which confirm that the baseline results are stable. (2) EID promotes HQD more significantly for central RBCs and resource strong-dependent RBCs than cities in other locations and with other degrees of resource dependency. In terms of the stage of urban development, EID has a greater contribution to HQD in growth and regenerative RBCs. (3) Environmental pollution reduction and industrial structure upgrading are critical transmission mechanisms by which EID facilitates HQD.
Based on the above conclusions, this study has the following practical insights for RBCs’ HQD in China: (1) The government should further extend the scope and intensity of EID implementation. At the same time, the characteristics across different types of RBCs, including geographic location, resource dependence, and development stages, should be considered in the formulation of HQD strategies. (2) The government should speed up the modernization process of the national environmental governance system and accelerate the establishment of a multi-governance platform for EID covering the government, enterprises, and the public, so as to better serve the transformation and HQD of RBCs. (3) The government needs to focus on environmental pollution reduction and pay more attention to the crucial role of industrial structure adjustment on the HQD of RBCs. Meanwhile, the government should motivate enterprises to reduce environmental pollution and optimize resource allocation efficiency and guide the public to actively participate in environmental governance.
This study has certainly complemented the academic gap in the relationship between EID and HQD, but there are still some limitations that warrant future research. First, we regard the release of the PITI index as a quasi-natural experiment, focus on the policy shock of EID on HQD, and reveal the “black box” of EID affecting HQD. However, whether the influence of EID on HQD varies with the heterogeneity of the PITI index remains to be investigated. We could construct a threshold model to quantify the effect of EID on HQD under different PITI index values in further research. Second, the scope of this study is set at the macro level of RBCs. However, the policy impact of EID on the HQD of various industries and different types of enterprises is also worthy of discussion in the follow-up research. Third, this study mainly performs quantitative empirical research based on China’s RBCs and lacks a multi-angle demonstration of different methods such as comparative study and qualitative case studies, which are all worthy topics for continued research in the future. To be specific, comparative studies with western EID theories and practice will help China to enhance its environmental governance and HQD by combining its own urban characteristics and advanced experience in the West. Furthermore, the survey-based case studies would be conducive to deeply revealing the intrinsic mechanisms of EID affecting HQD.

Author Contributions

Conceptualization, C.X. and X.L.; methodology, X.L.; software, X.L.; validation, C.X.; formal analysis, X.L.; investigation, X.L.; resources, X.L.; data curation, X.L.; writing—original draft preparation, X.L.; writing—review and editing, X.L. and C.X.; visualization, X.L.; supervision, C.X.; project administration, C.X.; funding acquisition, C.X. and X.L. All authors have read and agreed to the published version of the manuscript.

Funding

This research was funded by Beijing Natural Science Foundation, grant number 9222026, the National Natural Science Foundation of China, grant number 71774161, and the Fundamental Research Funds for the Central Universities, grant number 2020YJSGL08.

Institutional Review Board Statement

Not applicable.

Informed Consent Statement

Not applicable.

Data Availability Statement

All data used in this work are available publicly and also from the authors. Please contact corresponding author Xiufeng Lai with data requests ([email protected]).

Conflicts of Interest

The authors declare no conflict of interest.

References

  1. Sun, T.; Lu, Y.; Cheng, L. Implementation effect of resource exhausted cities’ supporting policies, long-term mechanism and industrial upgrading. China Ind. Econ. 2020, 38, 98–116. [Google Scholar] [CrossRef]
  2. Cui, D.; Bu, X.; Xu, Z.; Li, G.; Wu, D. Comprehensive evaluation and impact mechanism of high-quality development of China’s resource-based cities. Sci. Geogr. Sin. 2021, 76, 2489–2503. [Google Scholar]
  3. Tan, J.; Hu, X.; Hassink, R.; Ni, J. Industrial structure or agency: What affects regional economic resilience? Evidence from resource-based cities in China. Cities 2020, 106, 102906. [Google Scholar] [CrossRef]
  4. Wu, X.; Zhang, J.; Geng, X.; Wang, T.; Wang, K.; Liu, S. Increasing green infrastructure-based ecological resilience in urban systems: A perspective from locating ecological and disturbance sources in a resource-based city. Sustain. Cities Soc. 2020, 61, 102354. [Google Scholar] [CrossRef]
  5. Chen, W.; Shen, Y.; Wang, Y. Evaluation of economic transformation and upgrading of resource-based cities in Shaanxi province based on an improved TOPSIS method. Sustain. Cities Soc. 2018, 37, 232–240. [Google Scholar] [CrossRef]
  6. Ruan, F.; Yan, L.; Wang, D. The complexity for the resource-based cities in China on creating sustainable development. Cities 2020, 97, 102571. [Google Scholar] [CrossRef]
  7. Notice of the State Council on Printing and Distributing the National Sustainable Development Plan for Resource-Based Cities (2013–2020). Available online: http://www.gov.cn/zwgk/2013-12/03/content_2540070.htm (accessed on 28 April 2022).
  8. Guiding Opinions on Classification and Cultivation of Resource-Based Cities to Transform and Develop New Momentum. Available online: https://www.ndrc.gov.cn/xxgk/zcfb/tz/201701/t20170125_962892.html?code=&state=123 (accessed on 28 April 2022).
  9. The Implementation Plan for the 14th Five-Year Plan to Promote the High-Quality Development of Resource-Based Areas. Available online: https://www.ndrc.gov.cn/xwdt/tzgg/202111/t20211112_1303791.html?code=&state=123 (accessed on 28 April 2022).
  10. Hui, L.; Chen, R.; Huang, B. Research on high quality development of resource-based cities from the perspective of new structural economics: Taking the industrial transformation and strategic choice of Ruhr area of Germany as an example. J. Macro-Qual. Res. 2020, 8, 100–113. [Google Scholar] [CrossRef]
  11. He, X.; Shi, S. Population mobility, environmental regulation and high quality development of urban economy in China. Financ. Econ. 2021, 65, 78–91. [Google Scholar]
  12. Zhao, J.; Shi, D.; Deng, Z. A framework of China’s high-quality economic development. Res. Econ. Manag. 2019, 40, 15–31. [Google Scholar] [CrossRef]
  13. Yu, Y.; Yang, X.; Zhang, S. Research on the characteristics of time and space conversion of China’s economy from high-speed growth to high-quality development. J. Quant. Tech. Econ. 2019, 36, 3–21. [Google Scholar] [CrossRef]
  14. Shi, D.; Shi, X. Green finance and high-quality economic development: Mechanism characteristics and empirical study. Stat. Res. 2022, 39, 31–48. [Google Scholar] [CrossRef]
  15. Guo, S.; Guo, J. The establishment of “Comprehensive Reform Zone”, industrial diversification and high-quality development of resource-based regions. Ind. Econ. Res. 2019, 18, 87–98. [Google Scholar] [CrossRef]
  16. Guo, C.; Luo, L.; Ye, M. Empirical analysis of factors influencing the sustainable development of resource-based cities. China Popul. Resour. Environ. 2014, 24, 81–89. [Google Scholar]
  17. Wang, F.; Shi, X. Measurement of high-quality development level of China’s manufacturing and its influencing factors. China Soft Sci. 2022, 37, 22–31. [Google Scholar]
  18. He, D.; Liu, P. Population aging, manufacturing transformation and upgrade, and high-quality economic development—based on mediating effect model. Res. Econ. Manag. 2020, 41, 3–20. [Google Scholar] [CrossRef]
  19. Wang, Z.; Wang, Y.; Zhao, L.; Zhao, L. Spatio-temporal evolution and influencing factors of total factor productivity in China’s manufacturing industry. Acta Geogr. Sin. 2021, 76, 3061–3075. [Google Scholar] [CrossRef]
  20. Deng, K. The change of environmental regulation under the condition of big data—The perspective of function for environmental information regulation. Chin. J. Environ. Manag. 2019, 11, 100–106. [Google Scholar] [CrossRef]
  21. Cohen, M.A.; Santhakumar, V. Information disclosure as environmental regulation: A theoretical analysis. Environ. Resour. Econ. 2007, 37, 599–620. [Google Scholar] [CrossRef]
  22. Hou, J.; Shang, Y. Reform and reconstruction of environmental administration system underthe era of big data. Leg. Forum 2020, 35, 13–21. [Google Scholar]
  23. Jiang, H.; Lu, Y.; Zhou, S.; Yang, Y. Progress in research and application of ecological environment big data. Chin. J. Environ. Manag. 2019, 11, 11–15. [Google Scholar] [CrossRef]
  24. Lin, Y.; Huang, R.; Yao, X. Air pollution and environmental information disclosure: An empirical study based on heavy polluting industries. J. Clean. Prod. 2021, 278, 124313. [Google Scholar] [CrossRef]
  25. Tian, X.; Guo, Q.; Han, C.; Ahmad, N. Different extent of environmental information disclosure across Chinese cities: Contributing factors and correlation with local pollution. Glob. Environ. Chang. 2016, 39, 244–257. [Google Scholar] [CrossRef]
  26. Zhang, H.; Feng, F. Does informal environmental regulation reduce carbon emissions?—Evidence from a quasi-natural experiment of environmental information disclosure. Res. Econ. Manag. 2020, 41, 62–80. [Google Scholar] [CrossRef]
  27. Liu, M.; Chen, L. Effect of pollution emission reduction in the evaluation of environmental information disclosure. China Popul. Resour. Environ. 2020, 30, 53–63. [Google Scholar]
  28. Feng, Y.; Chen, H.; Chen, Z.; Wang, Y.; Wei, W. Has environmental information disclosure eased the economic inhibition of air pollution? J. Clean. Prod. 2021, 284, 125412. [Google Scholar] [CrossRef]
  29. Zhang, T.; Xie, L. The protected polluters: Empirical evidence from the national environmental information disclosure program in China. J. Clean. Prod. 2020, 258, 120343. [Google Scholar] [CrossRef]
  30. Zhao, L.; Chen, L. Research on the impact of government environmental information disclosure on green total factor productivity: Empirical experience from Chinese province. Int. J. Environ. Res. Public Health 2022, 19, 729. [Google Scholar] [CrossRef]
  31. Feng, Y.; Wang, X.; Liang, Z. How does environmental information disclosure affect economic development and haze pollution in Chinese cities? The mediating role of green technology innovation. Sci. Total Environ. 2021, 775, 145811. [Google Scholar] [CrossRef]
  32. Fang, J.; Liu, C.; Gao, C. The impact of environmental regulation on firm exports: Evidence from environmental information disclosure policy in China. Environ. Sci. Pollut. Res. 2019, 26, 37101–37113. [Google Scholar] [CrossRef]
  33. Jiang, Y.; Guo, C.; Wu, Y. Can environmental information disclosure promote the high-quality development of enterprises? The mediating effect of intellectual capital. Environ. Sci. Pollut. Res. 2021, 28, 30743–30757. [Google Scholar] [CrossRef]
  34. Ahmad, N.; Li, H.; Tian, X. Increased firm profitability under a nationwide environmental information disclosure program? Evidence from China. J. Clean. Prod. 2019, 230, 1176–1187. [Google Scholar] [CrossRef]
  35. Ren, S.; Wei, W.; Sun, H.; Xu, Q.; Hu, Y.; Chen, X. Can mandatory environmental information disclosure achieve a win-win for a firm’s environmental and economic performance? J. Clean. Prod. 2020, 250, 119530. [Google Scholar] [CrossRef]
  36. Long, R.; Li, H.; Wu, M.; Li, W. Dynamic evaluation of the green development level of China’s coal-resource-based cities using the TOPSIS method. Resour. Policy 2021, 74, 102415. [Google Scholar] [CrossRef]
  37. Jing, Z.; Wang, J. Sustainable development evaluation of the society–economy–environment in a resource-based city of China: A complex network approach. J. Clean. Prod. 2020, 263, 121510. [Google Scholar] [CrossRef]
  38. Ge, X.; Xu, J.; Xie, Y.; Guo, X.; Yang, D. Evaluation and dynamic evolution of eco-efficiency of resource-based cities—A case study of typical resource-based cities in China. Sustainability 2021, 13, 6802. [Google Scholar] [CrossRef]
  39. Wang, X.; Sun, W. Transformation efficiency of resource-based cities in the Yellow River Basin and its influencing factors. Prog. Geogr. 2020, 39, 1643–1655. [Google Scholar] [CrossRef]
  40. Yan, D.; Kong, Y.; Ren, X.; Shi, Y.; Chiang, S. The determinants of urban sustainability in Chinese resource-based cities: A panel quantile regression approach. Sci. Total Environ. 2019, 686, 1210–1219. [Google Scholar] [CrossRef]
  41. Wang, Y. Development characteristics, influencing mechanism and coping strategies of resource-based cities in developing countries: A case study of urban agglomeration in northeast China. Environ. Sci. Pollut. Res. 2021, 29, 25336–25348. [Google Scholar] [CrossRef]
  42. Zhang, M.; Yan, T.; Ren, Q. Does innovative development drive green economic growth in resource-based cities? Evidence from China. Front. Environ. Sci. 2022, 9, 683. [Google Scholar] [CrossRef]
  43. Xing, M.; Luo, F.; Fang, Y. Research on the sustainability promotion mechanisms of industries in China’s resource-based cities—from an ecological perspective. J. Clean. Prod. 2021, 315, 128114. [Google Scholar] [CrossRef]
  44. Li, Q.; Zeng, F.E.; Liu, S.; Yang, M.; Xu, F. The effects of China’s sustainable development policy for resource-based cities on local industrial transformation. Resour. Policy 2021, 71, 101940. [Google Scholar] [CrossRef]
  45. Yang, X.; Wang, W.; Wu, H.; Wang, J.; Ran, Q.; Ren, S. The impact of the new energy demonstration city policy on the green total factor productivity of resource-based cities: Empirical evidence from a quasi-natural experiment in China. J. Environ. Plann. Manag. 2021, 64, 1–34. [Google Scholar] [CrossRef]
  46. Gao, S.; Ling, S.; Liu, W. The role of social media in promoting information disclosure on environmental incidents: An evolutionary game theory perspective. Sustainability 2018, 10, 4372. [Google Scholar] [CrossRef] [Green Version]
  47. Carlisle, K.M.; Gruby, R.L. Polycentric systems of governance: A theoretical model for the commons. Policy Stud. J. 2019, 47, 927–952. [Google Scholar] [CrossRef] [Green Version]
  48. Zhao, X.; Chen, L.; Liu, C. Can informal environmental regulation induce green innovation? Verification from the perspective of ENGOs. China Popul. Resour. Environ. 2021, 31, 87–95. [Google Scholar]
  49. Li, Q.; Xiao, Z. Heterogeneous environmental regulation tools and green innovation incentives: Evidence from green patents of listed companies. Econ. Res. J. 2020, 55, 192–208. [Google Scholar]
  50. Lyu, P.; Huang, S. Can state environment pressure push corporate transformation and upgrading? Nankai Bus. Rev. 2021, 24, 116–129. [Google Scholar]
  51. Yang, Z. On the nature of the environmental right. China Leg. Sci. 2020, 37, 280–303. [Google Scholar] [CrossRef]
  52. Zhang, S.; Wang, L. The influence of government transparency on governance efficiency in information age: The environmental governance behavior of Guangdong, China. J. Enterp. Inform. Manag. 2021, 34, 446–459. [Google Scholar] [CrossRef]
  53. Xu, L.; Ma, Y.; Wang, X. Study on environmental policy selection for green technology innovation based on evolutionary game: Government behavior vs. Public participation. Chin. J. Manag. Sci. 2022, 39, 1–13. [Google Scholar] [CrossRef]
  54. Banker, R.D.; Charnes, A.; Cooper, W.W. Some models for estimating technical and scale inefficiencies in data envelopment analysis. Manag. Sci. 1984, 30, 1078–1092. [Google Scholar] [CrossRef] [Green Version]
  55. Chung, Y.; Färe, R.; Grosskopf, S. Productivity and undesirable outputs: A directional distance function approach. J. Environ. Manag. 1997, 51, 229–240. [Google Scholar] [CrossRef] [Green Version]
  56. Tone, K. A slacks-based measure of efficiency in data envelopment analysis. Eur. J. Oper. Res. 2001, 130, 498–509. [Google Scholar] [CrossRef] [Green Version]
  57. Fukuyama, H.; Weber, W.L. A directional slacks-based measure of technical inefficiency. Socioecon. Plan. Sci. 2009, 43, 274–287. [Google Scholar] [CrossRef]
  58. Liu, Z.; Xin, L. Has China’s Belt and Road Initiative promoted its green total factor productivity? Evidence from primary provinces along the route. Energy Policy 2019, 129, 360–369. [Google Scholar] [CrossRef]
  59. Oh, D. A global malmquist-luenberger productivity index. J. Prod. Anal. 2010, 34, 183–197. [Google Scholar] [CrossRef]
  60. Rosenbaum, P.R.; Rubin, D.B. The central role of the propensity score in observational studies for causal effects. Biometrika 1983, 70, 41–55. [Google Scholar] [CrossRef]
  61. Heckman, J.J.; Ichimura, H.; Todd, P.E. Matching as an econometric evaluation estimator: Evidence from evaluating a job training programme. Rev. Econ. Stud. 1997, 64, 605–654. [Google Scholar] [CrossRef]
  62. Caliendo, M.; Kopeinig, S. Some practical guidance for the implementation of propensity score matching. J. Econ. Surv. 2008, 22, 31–72. [Google Scholar] [CrossRef] [Green Version]
  63. Baron, R.M.; Kenny, D.A. The moderator-mediator variable distinction in social psychological research: Conceptual, strategic, and statistical considerations. J. Pers. Soc. Psychol. 1986, 51, 1173–1182. [Google Scholar] [CrossRef]
  64. Li, Z.; Yang, S. Fiscal decentralization, government innovation preferences and regional innovation efficiency. Manag. World 2018, 34, 29–42. [Google Scholar] [CrossRef]
  65. Cao, W.; Wang, H.; Ying, H. The effect of environmental regulation on employment in resource-based areas of China—An empirical research based on the mediating effect model. Int. J. Environ. Res. Public. Health 2017, 14, 1598. [Google Scholar] [CrossRef] [PubMed] [Green Version]
  66. Shan, H. Reestimating the capital stock of China: 1952~2006. J. Quant. Tech. Econ. 2008, 25, 17–31. [Google Scholar]
  67. Cao, X.; Deng, M.; Li, H. How does e-commerce city pilot improve green total factor productivity? Evidence from 230 cities in China. J. Environ. Manag. 2021, 289, 112520. [Google Scholar] [CrossRef]
  68. Pan, D.; Fan, W. Benefits of environmental information disclosure in managing water pollution: Evidence from a quasi-natural experiment in China. Environ. Sci. Pollut. Res. 2020, 28, 14764–14781. [Google Scholar] [CrossRef]
  69. Banerjee, A.; Duflo, E.; Qian, N. On the road: Access to transportation infrastructure and economic growth in China. J. Dev. Econ. 2020, 145, 102442. [Google Scholar] [CrossRef] [Green Version]
  70. Kong, L.; Gao, B.; Huang, Y. Provinical market opening, local government investment and manufacturing structure differences. J. Financ. Econ. 2017, 43, 133–144. [Google Scholar] [CrossRef]
  71. Zhong, J.; Li, T. Impact of financial development and its spatial spillover effect on green total factor productivity: Evidence from 30 provinces in China. Math. Probl. Eng. 2020, 2020, 5741387. [Google Scholar] [CrossRef] [Green Version]
  72. Beck, T.; Levine, R.; Levkov, A. Big bad banks? The winners and losers from bank deregulation in the united states. J. Financ. 2009, 65, 1637–1667. [Google Scholar] [CrossRef] [Green Version]
  73. Wen, S.; Liu, X. Financial misallocation, pollution, and sustainable growth. Res. Econ. Manag. 2019, 40, 3–20. [Google Scholar] [CrossRef]
  74. Hering, L.; Poncet, S. Environmental policy and exports: Evidence from Chinese cities. J. Environ. Econ. Manag. 2014, 68, 296–318. [Google Scholar] [CrossRef]
  75. Chen, S.; Chen, D. Air pollution, government regulations and high-quality economic development. Econ. Res. J. 2018, 53, 20–34. [Google Scholar]
  76. Tao, F.; Zhao, J.; Zhou, H. Does environmental regulation improve the quantity and quality of green innovation—Evidence from the target responsibility system of environmental protection. China Ind. Econ. 2021, 2, 136–154. [Google Scholar] [CrossRef]
  77. Tang, Z.; Mei, Z.; Zou, J. Does the opening of high-speed railway lines reduce the carbon intensity of China’s resource-based cities? Energies 2021, 14, 4648. [Google Scholar] [CrossRef]
  78. Cheng, Z.; Li, L.; Liu, J. Natural resource abundance, resource industry dependence and economic green growth in China. Resour. Policy 2020, 68, 101734. [Google Scholar] [CrossRef]
  79. Yan, T.; Hu, Y. Classification of resource-based cities from the perspective of resource decoupling. Resour. Sci. 2019, 41, 2172–2181. [Google Scholar] [CrossRef]
Figure 1. The impact mechanism of environmental information disclosure (EID) on the high-quality development (HQD) of China’s resource-based cities (RBCs).
Sustainability 14 06518 g001
Figure 2. Spatial pattern of the EID implementation in China’s RBCs. Note: The spatial distribution map shows the implementation scope of EID in China’s RBCs and the comparison of spatial location between EID RBCs and non-EID RBCs.
Sustainability 14 06518 g002
Figure 3. Flow scheme of empirical research. Note: This flow scheme illustrates the empirical research process of this study, presenting the details and main links of research preparation, effect evaluation, and further analysis.
Sustainability 14 06518 g003
Figure 4. (a) Spatial pattern of the HQD of China’s RBCs in 2004; (b) Spatial pattern of the HQD of China’s RBCs in 2019. Note: The spatial distribution maps present the temporal and spatial variation characteristics of the HQD in China’s RBCs. Owing to space limitations, only the results of HQD calculation for 2004 (a) and 2019 (b) are presented.
Sustainability 14 06518 g004
Figure 5. (a) Common support test; (b) Covariates standardized bias test; (c) Kernel density distribution of propensity score before Propensity Score Matching (PSM); (d) Kernel density distribution of propensity score after PSM.
Sustainability 14 06518 g005
Figure 6. Parallel trend test. Note: This figure shows the dynamic trend of the HQD variation between the treatment group and control group from 5 years before the EID implementation to 11 years after the EID implementation.
Sustainability 14 06518 g006
Figure 7. Distributions of t value of estimated coefficients for the placebo test. Note: This figure shows the distribution of the t-statistic values for the estimated coefficients of the variable HQD over the process of repeating the random selection of the treatment group 1000 times.
Sustainability 14 06518 g007
Figure 8. (a) Spatial pattern of urban geographic location in China’s RBCs; (b) Spatial pattern of urban resource dependency degree in China’s RBCs; (c) Spatial pattern of urban development stage in China’s RBCs. Note: This figure presents the spatial layout of different types of RBCs in China.
Sustainability 14 06518 g008
Table 1. Evaluation indicator system for the global Malmquist–Luenberger index based on directional distance function (SBM-DDF-GML index).
IndexTypeSpecific IndicatorUnit
InputLabor inputNumber of employees at the end of the year104 persons
Capital investmentCapital stock104 yuan
Energy consumptionTotal energy consumption104 tons of standard coal
Desirable outputEconomic growthReal GDP104 yuan
Ecological efficiencyGreen coverage rate%
Undesirable outputWastewater dischargeIndustrial wastewater discharge104 tons
Exhaust emissionIndustrial SO2 emission104 tons
Particulate emissionPM2.5 concentrationmg/m3
Table 2. Sample descriptive statistics.
Panel A Summary Statistics for the Full Sample
VariableNMeanStd. Dev.MinMaxP25MedianP75
HQD17340.8480.3270.3122.2710.6160.8251.000
EID17340.2340.4230.0001.0000.0000.0000.000
Wastewater17348.0900.9555.5379.8737.4938.1838.814
SO2173410.4681.1167.75912.5259.67310.68211.346
PM2.517343.7570.3283.0454.4703.5113.7494.011
CSI173449.88711.47023.78278.65041.95050.25057.840
ISU173477.93533.55519.623195.38154.46872.08393.531
Econ17349.2230.5488.04010.7648.8719.1739.558
Green17349.2230.5488.04010.7648.8719.1739.558
Infra173436.3328.4926.13049.75933.19038.73541.678
Infor173413.9837.2263.28039.8209.27012.25016.880
Fina173411.2289.8660.44751.1463.6128.17016.197
Resou1734189.24365.73779.265403.318141.490176.400223.975
Panel B Comparison between the Treatment Group and the Control Group
VariablesTreatment Group (N = 595)Control Group (N = 1139)Differences: Treatment-Control
MeanMedianStd. Dev.MeanMedianStd. Dev.Mean (t-test)Median (z-test)
HQD0.9080.8870.3210.8170.7770.3260.092 ***32.671 ***
EID0.6811.0000.4670000.681 ***1011.547 ***
Wastewater8.4108.4990.8907.9228.0140.9450.487 ***67.980 ***
SO210.99311.2431.04010.19410.3251.0540.799 ***161.197 ***
PM2.53.8423.8560.3393.7133.7040.3140.129 ***29.294 ***
CSI55.31555.0409.22347.05146.56011.5118.264 ***188.862 ***
ISU67.65763.83726.33083.30476.66235.619−15.647 ***−66.322 ***
Econ9.5209.5220.5019.0689.0370.5060.452 ***244.301 ***
Green38.78439.9906.62235.05037.5929.0633.734 ***52.322 ***
Infra14.38712.3207.34213.77212.1907.1590.615 *0.151
Infor13.21810.22210.82210.1897.0069.1633.029 ***32.671 ***
Fina176.884164.60359.824195.700183.19267.757−18.816 ***−23.092 ***
Resou1.9992.4331.3501.7311.7681.3230.267 ***52.322 ***
Note: This table shows the descriptive data on the composition of our sample. Panel A reports descriptive statistics for the full sample for the entire period (prefecture-level city data from 2003 to 2019). Panel B reports the values of mean, median, and standard deviation for the treatment group and control group, and the differences in mean and median values. All continuous variables are winsorized at 1% and 99% levels. * and *** indicate significance levels at 10% and 1%, respectively.
Table 3. The correlation coefficient matrix.
VariablesHQDEIDEconGreenInfraInforFinaResou
HQD10.051 **0.067 ***0.029−0.119 ***−0.0100.089 ***0.175 ***
EID0.082 ***10.399 ***0.361 ***0.187 ***0.379 ***−0.041 *0.078 ***
Econ0.058 **−0.109 ***−0.447 ***−0.057 **0.076 ***0.110 ***0.476 ***−0.326 ***
Green0.046 *0.324 ***0.493 ***10.383 ***0.629 ***0.095 ***−0.024
Infra−0.0220.174 ***0.297 ***0.360 ***10.476 ***0.004−0.155 ***
Infor0.093 ***0.347 ***0.399 ***0.494 ***0.386 ***10.315 ***−0.049 **
Fina0.122 ***−0.035−0.310 ***0.0190.0010.356 ***1−0.076 ***
Resou0.130 ***0.071 ***0.191 ***−0.038−0.180 ***−0.096 ***−0.041 *1
Note: The lower left corner of the diagonal of the table is the Pearson correlation coefficient matrix. The upper right corner of the diagonal of the table is the Spearman correlation coefficient matrix. *, **, and *** indicate significance levels at 10%, 5%, and 1%, respectively.
Table 4. The result of variance inflation factor (VIF) test.
VariableVIF1/VIF
Infor2.1400.468
Econ2.1000.477
Fina1.6300.612
Green1.6000.626
Infra1.3000.772
EID1.2500.799
Resou1.1600.865
Mean VIF1.600
Note: This table presents the variance inflation factor (VIF) and the tolerance (1/VIF) of the independent variables.
Table 5. Balance test results of covariates before and after propensity score matching (PSM).
Variable(1)(2)(3)(4)(5)(6)
UnmatchedMeanBias (%)Reduct Bias
(%)
t-Test
MatchedTreatedControl
EconU9.52019.068489.796.417.71 ***
M9.50759.49123.20.58
GreenU38.78435.05047.089.68.89 ***
M38.74039.128−4.91.04
InfraU14.38713.7728.523.81.68 *
M14.29813.8306.51.22
InforU13.21810.18930.294.16.13 ***
M13.19513.0171.80.3
FinaU176.88195.70−29.484.4−5.71 ***
M177.87174.934.60.86
ResouU1.99881.73142071.33.97 ***
M1.98761.91085.70.99
Note: This table presents statistics of post-match differences in propensity score matching. Columns (2) and (3) present the sample averages of city characteristics in the treatment group and control group, respectively. Column (4) presents the bias of the differences between the treatment group and control group before and after being matched. Column (5) presents the absolute value of bias reduction in differences between the treatment group and control group after being matched. Column (6) presents the t-test values of the differences between the treatment group and the control group. * and *** indicate significance levels at 10% and 1%, respectively.
Table 6. Regression results of the baseline model.
Variable(1)(2)(3)(4)(5)(6)
HQDHQDHQDHQDHQDHQD
EID0.064 ***0.034 *0.071 ***0.052 ***0.050 **0.059 ***
(3.431)(1.673)(3.411)(2.665)(2.407)(3.206)
Econ 0.079 ***0.233 *** 0.095 ***0.356 ***
(3.562)(4.709) (3.707)(7.214)
Green −0.0010.014 *** −0.003 **0.014 ***
(−0.534)(14.040) (−2.431)(12.024)
Infra −0.002−0.006 *** −0.001−0.005 **
(−1.343)(−5.159) (−0.683)(−2.761)
Infor −0.0000.001 −0.0020.001
(−0.019)(0.767) (−1.343)(0.481)
Fina 0.001 ***−0.000 0.001 ***0.000
(5.237)(−0.293) (7.360)(1.637)
Resou 0.025 ***−0.010 0.021 ***−0.011
(4.074)(−0.946) (3.236)(−0.922)
Constant0.833 ***−0.042−1.369 **0.849 ***−0.157−2.639 ***
(93.070)(−0.208)(−2.723)(81.967)(−0.661)(−5.415)
City FENoNoYesNoNoYes
Year FENoNoYesNoNoYes
N173417341734138313831383
R20.0070.0500.3800.0050.0680.381
Note: This table reports the baseline regression results from the estimation of formula (4). Columns (3) and (6) are the regression results that control for city-fixed and year-fixed effects. *, **, and *** indicate 10%, 5%, and 1% significance levels, respectively. Standard errors in parentheses.
Table 7. Results of robustness tests.
Variable(1)(2)(3)(4)(5)(6)
First Stage2SLSEliminate Disturbing PoliciesTwo Lag PeriodsAdjust Sample PeriodKernel Matching
EID 0.865 ***0.054 **0.0590.087 ***0.062 ***
(2.846)(2.904)(1.702)(10.203)(3.144)
VC0.421 ***
(3.500)
Emissions Trading Program Control
Constant0.440−4.722 ***−1.515 ***−1.254 **−3.442 ***−1.407 **
(0.341)(−3.092)(−4.184)(−2.751)(−5.114)(−2.850)
ControlsYesYesYesYesYesYes
City FEYesYesYesYesYesYes
Year FEYesYesYesYesYesYes
Endogeneity test14.078 ***
Kleibergen–Paap rank LM12.16 ***
Kleibergen–Paap rank Wald F13.03
N17341734139717347931691
R20.3760.4250.3610.3630.3490.372
Note: This table examines the robustness of the effect of EID on HQD. All regressions control for city-fixed and year-fixed effects. ** and *** indicate 5% and 1% significance levels, respectively. Standard errors in parentheses.
Table 8. Regression results of the heterogeneity analysis.
VariableGeographic LocationResource Dependency DegreeDevelopment Stage
(1)(2)(3)(4)(5)(6)(7)(8)(9)(10)
WesternCentralEasternWeakMediumStrongGrowthMatureRecessiveRegenerative
EID0.0470.111 ***0.0590.0230.0090.131 **0.126 *0.047 **0.066 **0.105 **
(0.870)(4.059)(1.512)(0.722)(0.298)(2.696)(2.002)(2.679)(2.770)(2.516)
Constant−3.166 ***−2.161 ***−4.492 ***−1.711 ***−2.470 ***−2.896 ***−3.596−2.374 ***−1.871 ***−3.935 ***
(−3.515)(−2.925)(−8.031)(−3.973)(−4.090)(−3.336)(−1.617)(−3.355)(−3.573)(−5.735)
ControlYesYesYesYesYesYesYesYesYesYes
City FEYesYesYesYesYesYesYesYesYesYes
Year FEYesYesYesYesYesYesYesYesYesYes
N401595387390488505149716313205
R20.3190.4670.5300.5750.4160.3460.3710.4570.4490.630
Note: This table reports the heterogeneous effects of EID on HQD. Columns (1)–(3) show the heterogeneity of urban geographic locations. Columns (4)–(6) are the regression results of the heterogeneity test in resource dependency degree. Columns (7)–(10) present the regression results of the heterogeneity test in the development stage of RBCs. All regressions control for city-fixed and year-fixed effects. *, **, and *** indicate 10%, 5%, and 1% significance levels, respectively. Standard errors in parentheses.
Table 9. Regression results of environmental pollution reduction effect.
Variable(1)(2)(3)(4)(5)(6)(7)(8)(9)
HQDWastewaterHQDHQDSO2HQDHQDPM2.5HQD
EID −0.172 **0.025 * −0.158 *0.028 −0.033 **0.050 **
(−2.706)(1.941) (−2.083)(1.091) (−2.447)(2.797)
Wastewater−0.199 *** −0.198 ***
(−14.218) (−13.733)
SO2 −0.201 *** −0.200 ***
(−11.964) (−11.445)
PM2.5 −0.280 ** −0.264 **
(−2.378) (−2.262)
Constant−1.101 **7.381 ***−1.178 **−0.888 **8.348 ***−0.973 **−1.3154.249 ***−1.517 *
(−2.520)(5.176)(−2.592)(−2.763)(10.477)(−2.680)(−1.643)(14.318)(−1.925)
ControlsYesYesYesYesYesYesYesYesYes
City FEYesYesYesYesYesYesYesYesYes
Year FEYesYesYesYesYesYesYesYesYes
N138313831383138313831383138313831383
R20.4890.3080.4890.4970.6790.4980.3850.6870.387
Sobel3.835 ***3.730 **2.718 ***
Note: This table reports the regression results for the mediating effect of environmental pollution reduction including wastewater, SO2, and PM2.5. All regressions control for city-fixed and year-fixed effects. *, **, and *** indicate 10%, 5%, and 1% significance levels, respectively. Standard errors in parentheses.
Table 10. Regression results of industrial structure upgrading effect.
Variable(1)(2)(3)(4)(5)(6)
HQDCSIHQDHQDISUHQD
EID −1.926 ***0.051 ** 5.708 ***0.051 ***
(−4.393)(2.804) (3.288)(3.063)
SCI−0.005 ** −0.004 **
(−2.665) (−2.461)
ISU 0.001 *** 0.001 ***
(4.786) (4.598)
Constant−2.815 ***−67.810 ***−2.928 ***−2.832 ***222.972 ***−2.953 ***
(−5.151)(−5.251)(−5.524)(−5.388)(6.838)(−5.719)
ControlsYesYesYesYesYesYes
City FEYesYesYesYesYesYes
Year FEYesYesYesYesYesYes
N138313831383138313831383
R20.3830.5860.3850.3860.5910.388
Sobel2.643 ***2.471 **
Note: This table reports the regression results for the mediating effect of industrial structure upgrading. All regressions control for city-fixed and year-fixed effects. ** and *** indicate 5% and 1% significance levels, respectively. Standard errors in parentheses.
Publisher’s Note: MDPI stays neutral with regard to jurisdictional claims in published maps and institutional affiliations.