Article

How to Promote a Smart City Effectively? An Evaluation Model and Efficiency Analysis of Smart Cities in China

1
School of Computer Science and Technology, University of Science and Technology Beijing, Beijing 100083, China
2
Informatization and Industry Development Department, State Information Center, Beijing 100045, China
*
Author to whom correspondence should be addressed.
Sustainability 2022, 14(11), 6512; https://doi.org/10.3390/su14116512
Submission received: 26 April 2022 / Revised: 20 May 2022 / Accepted: 23 May 2022 / Published: 26 May 2022
(This article belongs to the Special Issue Smart Sustainable Cities in the Era of Big Data)

Abstract

:
With the rapid development of smart cities, smart city evaluation is receiving an increasing amount of attention. However, the link between the evaluation results of smart cities and the decision making of urban construction roadmap is still relatively lacking. Therefore, it is necessary to quantitatively analyze the evaluation results, to support cities to formulate specific measures for effectively improving their smartness construction. The era of big data gives us the opportunity to evaluate and improve the development of smart cities with urban data. This paper proposes a Capability–Performance–Experience (CPE) evaluation model. An empirical study was conducted with 275 Chinese cities as samples. Principal component analysis and k-means clustering were adopted to classify cities according to their infrastructure readiness level. For each category, multi-linear regression and sensitivity analysis were adopted to analyze the impact of each input factors on each output factors. The results contribute to reasonably design or adjust strategies for smart cities based on their own development stages. Some policy implications are proposed to better prioritize investment in smart cities and to maximize the return on citizens’ experience.

1. Introduction

With the development of cloud computing, the Internet of Things, big data, data visualization, distributed computing, and other information technologies, ICT integration has become one of the most important development strategies of cities in the last 20 years. The concepts of wireless city [1], network city [2], digital city [3], intelligent city [4], smart city [5], and sentient city [6] have all been put forward to describe the relationship between ICT and urbanization. These terms mainly reflect the objectives of introducing specific technologies to a city [7]. Over the past decade, the level of digitization and informatization of urban systems has become higher and higher, and fundamental changes have taken place in citizens’ living environments and cities’ governance modes. The smart city has become a paradigm of city development and sustainable socio-economic growth [5] and has been widely discussed by governments, industry, and academia all over the world [8]. With the rapid advancement of urbanization, urban development is also facing great challenges. At present, cities around the world are making a rapid transition to a low-carbon environment, high quality of life, and resource-saving economy. The future of urban development will depend not only on the deployment of hard infrastructure but also on the availability and quality of knowledge communication and social infrastructure [9]. The smart city has become an effective solution to the complex problems encountered in the process of rapid urbanization [10].
Evaluation has come to play an increasingly important role in the construction of smart cities [11]. Identifying the key aspects of smart cities and systematically evaluating their level of development will be of great significance for guiding and promoting the smart development of cities [11,12]. With the development of smart city research, academia, governments, and enterprises have proposed multifarious evaluation methods to measure the development level of smart cities. Some standards have specified and established definitions and methodologies for a set of indicators for smart cities. The current smart city evaluation index model has a variety of architectural methods. Some of these methods evaluate the critical factors of smart cities, such as the Rankings of European Medium-Sized Cities [13,14], the Cohen Smart City Index [15,16], and Sustainable Cities and Communities—Indicators for Smart Cities (ISO 31722:2019) [17]. Some of them evaluate the infrastructure capabilities pillar and service performance pillar, such as the IMD-SUTD Smart City Index [18], the Evaluation Indicators for New-Type Smart Cities (GB/T 33356–2016) [19], and the Information Technology—Smart City ICT Indicators (ISO/IEC 30146:2019) [20]. The smart city evaluation results play a significant role in the study of smart cities. The performance of smart cities is a very important guide for stakeholders in positioning these cities, triggering more projects to be undertaken [21], and defining strategies for future development [22].
Return on investment (ROI) is a performance measure used to evaluate the efficiency of an investment in a particular case. It measures the amount of return made on an investment relative to the cost [23]. In smart cities, ROI is becoming a key consideration in terms of the Internet of Things [24,25,26], data centers [27], smart homes [25], smart grids [28,29], data security [30], and other technologies. Investment in public services is generally shrinking due to the deteriorating global economic situation, leading to services with both social utility and a clear return on investment being given priority [31,32]. A major concern is that while many smart city solutions are expensive to procure and service, it is not clear what their return on investment will be [33,34]. However, there is a lack of appropriate, systematic, and proven methodologies or metrics for reporting and verifying the return on investment for the design of smart cities [31,35,36]. To better prioritize investment, maximizing return on investment should be seen as a standard objective of smart cities [9].
A smart city is a long-term evolution system, which cannot be studied statically and in isolation. In the existing smart city evaluation research, many methods divide a smart city into several dimensions according to the key factors. This can guide the construction of smart city conceptually. However, without the support of quantitative analysis, it will be difficult to guide the actual decision-making process in smart cities. Since people’s participation, ideas, and perspectives are critical factors for smart cities [37], the concept of Quality of Experience (QoE) is rapidly gaining attention in smart cities [38]. This means that for user-centered public services in smart cities, it is necessary to not only ensure a high Quality of Service (QoS) but also provide a satisfactory Quality of Experience (QoE). The evaluation, analysis, and improvement of QoE in smart cities are challenging research problems.
The aim of this paper is to analyze the effectiveness of smart cities through evaluation, and provide reference and guidance for rational decision making of smart city construction. Inspired by the aforementioned smart city evaluation models, we focus our study on learning how smart city infrastructure capability and service performance affect citizen experience. The model and analysis methods proposed in this paper can not only avoid the limitations of previous studies, but also provide targeted promotion strategies to smart cities based on their own development stage, to achieve more accurate and efficient improvement. The rest of this paper is organized as follows. In Section 2, the current research on QoE in smart cities and smart city evaluation models are reviewed. Section 3 explains the design of research methods. Section 4 presents the results of data analysis. Section 5 discusses the results, and Section 6 concludes the paper.

2. Literature Review

2.1. Quality of Experience (QoE) in Smart Cities

Quality of Service (QoS) is a method that is widely used to evaluate service, which mainly reflects the performance of services at the technical level but cannot directly reflect the user’s recognition of services [39]. Quality of Experience (QoE) can be understood as the evaluation of the QoS mechanism from the perspective of users. It is defined as the overall acceptability of an application or service as it is subjectively perceived by the end users [40]. It assesses their experience interacting with technology and business entities in a particular context [41].
A smart city is a socio-economic development by introducing ICT infrastructures and new innovative technologies to urban places from citizens’ viewpoint [7,42]. Cities use technologies to engage more effectively and actively with their citizens [9]; provide better city services [43]; and ultimately focus on improving the quality of life [7,44], welfare [45], and well-being [9] of citizens.
Within smart cities, the public services provided are user-centered. Therefore, ensuring a high-performance QoS is not sufficient [9]. It is also necessary to move beyond monitoring QoS and expand that focus to ensuring a high-level QoE [46,47]. Providing a satisfactory QoE is becoming one of the major challenges in smart cities [48]. In the context of the development of smart cities, the quality of experience (QoE) can be impacted by factors such as usability, personalization, usefulness, transparency, accessibility, effectiveness, efficiency, learnability, and findability [9]. In order to improve the quality of urban life, it is necessary to better understand cities and their underlying systems [49]. Though the role of people has been recognized in discussions about smart cities [21], the perceptions or feelings of citizens were not considered until the mid-2010s [44]. As people are an essential component of smart cities [50], their participation, ideas, and perspectives are critical factors in smart city development [37]. People can be involved in smart cities as users, decision makers, and reliable sources of data and information [51]. Many bottom-up actions focused on improving urban life can come directly from active citizens [45], which is important for the implementation of a smart city project based on planning, management, and stewardship [52]. Citizens’ engagement is a new form of interactive process that takes place between citizens and governments, and contributes to the creation and implementation of public policies in a transparent and responsible manner [53].
In summary, QoE is a crucial criterion for evaluating applications, services, or systems in smart cities [48] during both the design and operation phases [46]. Moreover, the quantitative and qualitative values of QoE can be translated into strategic action to improve the performance of applications, services, or systems [54]. We must highlight the citizen-centric smart city initiative [44] and further emphasize citizens’ experience in smart city evaluation.

2.2. Smart City Evaluation Models

2.2.1. Evaluation Model Based on Critical Factors

Some smart city evaluation index models divide a smart city into several dimensions according to the key factors, and evaluate the development of each dimension. The most frequently mentioned dimensions include economy, people, governance, mobility, environment, energy, and others.
The International Organization for Standardization (ISO) provides Sustainable Cities and Communities—Indicators for Smart Cities (ISO 31722:2019) [17] as a complete set of indicators to measure progress made towards creating a smart city. This standard provides 19 primary indicators and 80 secondary indicators, and mainly promotes the improvement in city services and quality of life. For each secondary indicator, indicator requirements, data sources, and data interpretation are provided. Cities can choose some indicators to measure the development level themselves.
Vienna University of Technology established six factors for assessing the smartness of a city: economy, people, governance, mobility, environment, and living [13,14]. The index has 31 secondary indicators and 74 tertiary indicators. The objective of the evaluation system is to rank the smartness of medium-sized cities in the EU. This index aims to strengthen the international image of excellent cities through ranking and help less developed cities identify their weaknesses from low scoring indicators. In the practice of evaluation, all sample cities are compared horizontally rather than by evaluating the smartness of a single city. This evaluation method was also accepted by many following scholars, especially in the EU [55,56].
Cohen et al. established a smart city index to evaluate the smartness of a city from six dimensions: the environment, mobility, government, economy, people, and living [15,16]. The index has 18 secondary indicators and 62 tertiary indicators, and a specific description of each indicator is given. Some indicators are based on the Sustainable Development of Communities—Indicators for City Services and Quality of Life (ISO 37120:2018) [57]. This index is used for the annual ranking of smart cities ranking by the Smart City Council.
The main contents, calculation methods, weights, and implementation scopes of the above evaluation models are presented in Table 1.

2.2.2. Two-Pillar Evaluation Models

Some smart city evaluation index models evaluate smart cities from the perspectives of capability and performance. The capability pillar refers to the readiness of infrastructure, including network facilities, information security, data resources, and others. The performance pillar refers to the quality of various urban services, including smart education, smart transportation, smart healthcare, online government services, and others.
The National Standards Commission of China issued the Evaluation Indicators for New-Type Smart Cities (GB/T 33356-2016) [19]. The eight primary indicators are classified as capability indicators, performance indicators, and a citizen experience indicator. The capability indicators include intelligent facilities, data resources, cyber security, and reform and innovation. The performance indicators include livelihood services, precision governance, and ecological livability. The standard includes 21 secondary indicators and 54 tertiary indicators. Based on this index system, China has conducted nationwide smart city evaluations twice, with more than 300 cities participating.
The International Organization for Standardization (ISO) established Information Technology—Smart City ICT indicators (ISO/IEC 30146:2019) to evaluate the level of development of smart cities [20], focusing on the individual efficient functioning of different systems, infrastructures, and facilities. The six primary indicators are classified as capability indicators and performance indicators. The capability indicators include smart facilities, information resources, and cyber security. The performance indicators include citizen service, efficient governance, and livable environment. The standard has 19 secondary indicators and 57 tertiary indicators. This index system can be used as a whole package to evaluate a smart city holistically, or tailored as individual parts for evaluating certain aspects of cities.
The Institute for Management Development in collaboration with the Singapore University for Technology and Design released the IMD-SUTD Smart City Index [18]. This index assesses the perceptions of residents regarding the structures pillar and technology pillar. The structures pillar refers to the existing infrastructure of a city, while the technology pillar describes the technological provisions and services available to its inhabitants. Each pillar is evaluated over five key areas: health and safety, mobility, activities, opportunities, and governance.
The main contents, calculation methods, weights, and implementation scopes of the above evaluation models are presented in Table 2.

2.3. Shortcomings of Existing Research

In recent years, more and more attention has been given to the evaluation of the smartness of cities. However, current studies and applications of smart city evaluation are still in the exploratory stage [11], with few analyses on their weaknesses. We summarize the following shortcomings of existing research on smart city evaluation:
  • Lack of citizen engagement:
As summarized in Section 2.1, citizens should be engaged in smart city development and implementation processes as essential stakeholders. The existing evaluation methods do not combine urban development (QoS) indicators with citizens’ perception (QoE) indicators well enough. Most evaluation methods are based on dimensions of urban development. Although some index systems [13,14,15,16] take the smartness of people into account, only a few index systems [18,19] involve the content of citizens’ perception of smart cities. Moreover, QoE in smart cities is rarely analyzed in depth in each dimension, but is usually presented in the form of statistical data, the reference values of which remain to be discussed.
2.
Ignoring the efficiency of construction:
Many studies have proposed evaluation systems, but it is difficult to reflect the effectiveness of a smart city’s construction by only measuring its development level. Moreover, the evaluation of smart cities should not only use indicators that measure the deployment of smart solutions, but also indicators that measure their contribution towards the ultimate goals [58]. Therefore, evaluating the construction efficiency of a smart city from an input–output perspective can more meaningfully reflect the effectiveness of the construction of a smart city.
3.
Inadequate evaluation samples:
Although many governments, enterprises, and academic institutions have put forward different evaluation methods and ranked smart cities according to these methods, not all the currently published ranking results are reliable for various reasons [21]. Some evaluations used incomplete data sources, resulting in them having a poor data quality. Some evaluations may select the city based on population, which means some small cities may be excluded. Some evaluations have results for comparison of more than 100 cities [18,19], while others only compared the result of 10 or 20 cities [59,60]. Incomplete data sources and small sample sizes can cause evaluation results to be not representative, so it is difficult to further study sample cities and draw useful conclusions from the evaluation results.
4.
Insufficient quantitative analysis:
Many existing methods mainly focus on thematic taxonomy and indicator typology. They focus on the proposal and construction of smart city index systems, mainly qualitative research, and quantitative analysis is relatively lacking. Some methods do not even provide any information about how they calculate their evaluation results [21]. The assignment of the weight of indicators directly impacts the results of evaluation [58]. However, some studies simply assign equal weight for each indicator, or determine the weight of each indicator based on expert scoring or an analytic hierarchy process. Their evaluation results are, therefore, highly subjective [12]. In addition, the total evaluation score should not be the only data that are analyzed. Dimension level results are also meaningful and deserve more attention [61].
5.
Overlooking of interlinkages:
It is increasingly recognized that cities are ‘systems of systems’, which means that multiple sub-systems in an urban system interact with and influence each other through various feedback loops. Accordingly, smart city evaluation is a multi-index information aggregation problem [58]. There may be mutual influence and interdependence among indicators. However, many existing studies fail to acknowledge the inherent complexities of urban dynamics, leading them to neglect complex interrelations and causalities in smart cities [13]. A major drawback of smart city evaluation methods is that they lack the ability to deal with the interlinkages and interdependencies of different sub-systems of the urban system. In order to evaluate a smart city more scientifically, the interlinkages between indicators should not be ignored, and redundant indicators need to be identified.
6.
Lack of tailored guidance:
Connecting evaluation results to action plans is essential in order to effectively influence the planning and policy making of smart cities. However, most existing research on this topic remains theoretical and methodological, with limited case studies on the application and comparative analysis of actual smart cities [11]. In an investigation of 34 smart city evaluation tools, only 25% of the selected tools provide recommendations on how to link assessment findings to road mapping and action planning [61]. The different fundamental conditions of each city can be recognized from the evaluation results, so as to put forward customized development suggestions for each city, rather than one-size-fits-all solutions. At present, most evaluation methods used are not classified or tailored to local conditions, especially to the readiness of smart cities, meaning that their usefulness for guiding urban construction is limited.

3. Methods

3.1. Research Framework and Models

3.1.1. Input–Output Model for Smart Cities

A smart city is the product of the extensive use of information technology to highly integrated urban development with information technology. In this paper, the infrastructure capability and service performance are the input factors of a smart city, and the citizens’ experience is an output factor. From the analysis of the key input–output elements of smart city construction, we can clearly see the logical bottom-up structure of smart city construction and development: (1) infrastructure construction, policy innovation, and capital investment; (2) improving the government’s urban management ability and service level, achieving the sustainable development of the city’s economy, and improving the people’s quality of life; and (3) improving the citizens’ overall experience of the smart city. This structure forms the input–output model of a smart city, as shown in Figure 1.
There is no definite or known formula for the input–output production function of smart city construction, so it is very difficult to evaluate its effectiveness through the use of traditional evaluation methods. The question of how to allocate investment reasonably and achieve the best results possible with limited resources has become an important research topic. For smart cities, controlling inputs is easier and more achievable than controlling outputs. That is to say, in order to improve citizens’ perceptions more efficiently at a lower cost, it is necessary to discuss the investment allocation for each input factor.

3.1.2. CPE Evaluation Model for Smart Cities

Based on the above analysis, we proposed a CPE evaluation model for smart cities, where C represents infrastructure capability, P represents service performance, and E represents citizen experience, as shown in Figure 2. Ci (i = 1, 2, …, m) and Pj (j = 1, 2, …, n) are the input factors of the model, and Ek (k = 1, 2, …, n) are the output factors of the model. Here, m represents the number of infrastructure capability indicators and, n represents both the number of service performance indicators and citizen experience indicators, which is the number of service domains. When j is not equal to k, Pj and Ek describe different service domains—that is, the connection weight between Pj and Ek is 0. Therefore, a multi-input multi-output network can be disassembled into n multi-input single-output networks, where n is the number of service domains.
Furthermore, in order to evaluate cities in different situations in a more pertinent manner, we classified cities according to a certain attribute A or series of attributes {A, B, …}, and denote the categories as {a1, a2, …}. Each city category a corresponds to a set of n multiple-input single-output networks. The corresponding index system for each category of cities is shown in Table 3.
Here, attributes of cities can be either basic characteristics such as population, GDP level, major industries, or comprehensive characteristics like maturity level [62]. Among various urban attributes, readiness is a highly recognized one. For example, the World Economic Forum uses Networked Readiness Index (NRI) to measure how well an economy is using information and communications technologies for more than 140 economies [63]. As shown in Table 2, the two-pillar evaluation methods mentioned [18,19,20] usually contain a capability pillar, which refers to the readiness of network facilities, information security, data resources, and other infrastructure. Our purpose is to identify different development strategies for smart cities with different basic conditions. Therefore, we classified cities according to readiness level, that is, the infrastructure capability in the CPE evaluation index system.
After classifying the cities, we investigated the correlation between the input indicators and output indicators for each category of cities, and separately analyzed the impact of the change in each input indicator on the different output indicators.

3.2. Smart City Evaluation Index System Based on CPE Model

3.2.1. Criteria for Selecting Indicators

To promote the efficient development of smart cities, it is necessary to establish a systematic and scientific system for the evaluation of smart cities. To propose a feasible index system in line with the CPE framework, it is necessary to avoid the weaknesses mentioned in Section 2.3 and fully take into account the principles of comprehensiveness, operability, and citizen engagement.
  • Comprehensiveness:
The indicators of the index system should be able to comprehensively evaluate the smartness of a city from multiple perspectives, including the capability of the infrastructure, the performance of services, and citizens’ experience of service domains. The selected indicators should be representative.
2.
Operability:
The indicators of the index system should be able to be collected through proven and feasible channels. In order to allow these to be analyzed and compared, the selected indicators should mainly be quantitative.
3.
Citizen engagement:
The index system should involve citizens’ perceptions of smart cities. Moreover, the domains of citizen evaluation should correspond to the domains of service performance evaluation on a one to one basis.
We extracted representative indicators from the literature to establish a specific, measurable, and achievable index system. The indicators of the CPE framework were selected according to the above indicator selection criteria, with comprehensive reference to the existing research methods and frameworks. Five capability indicators, three performance indicators, and three experience indicators were finally selected for use in the analysis, as shown in Table 4. It is noteworthy that, for ease of description and understanding, only some service domains of smart cities were included in the evaluation index. However, the evaluation framework can be extended and other evaluation indicators can also be added, in order to cover all service domains of smart cities.

3.2.2. Data Sources

In this study, the evaluation results obtained for 275 Chinese cities according to the Evaluation Indicators for New-Type Smart Cities (GB/T 33356-2016) were selected as the experimental data, in order to ensure the feasibility of the evaluation, the accessibility of data, and the presence of a sufficient number of samples. Infrastructure capability indicators and service performance indicators were obtained from municipal governments. We took the scoring rate of these indicators as the indicator value, and normalized these values in the range [0,1] to eliminate the impact of different weights. Citizen experience data for each service domain were obtained by issuing a 5-point Likert scale questionnaire to more than 1,073,500 people. The average score for each service domain in each city was calculated, and then normalized in the range [0,1].

3.3. Design of Data Processing and Analysis

The steps of data processing and analysis are shown in Figure 3.
  • Step 1: Data preparation
In multi index evaluation systems, each evaluation indicator usually has different orders of magnitude and units. Directly using the original data will highlight the role of indicators with higher values in the analysis and relatively weaken the role of indicators with lower values. Therefore, in order to ensure the reliability of the analysis, it is necessary to standardize the original data.
Here, we normalized the data obtained for the infrastructure capability indicators in the range [0,1] prior to our analysis. To avoid outlier issues [64], a Z-score normalization method was used for normalization:
Z C i = c i c ¯ σ ,   i = 1 ,   2 ,   ,   5  
where c i is the i-th original value, c ¯ is the arithmetic mean, σ is the standard deviation, and Z C i   is the normalized value. Indicator data { c 1 ,   c 2 ,   c 3 ,   c 4 , c 5 } from 275 cities were numbered and normalized using the Z-score normalization method, resulting in dimensionless datasets with an average of 0 and a standard deviation of 1. Data points outside the range of (−3, 3) were considered to be outliers, and data from four cities were excluded to ensure the normal distribution (−3σ, 3σ) of the processed data. Normalized data { Z C 1 ,   Z C 2 ,   Z C 3 ,   Z C 4 , Z C 5 } from five infrastructure capability indicators measured in 271 cities were then renumbered for use in subsequent analyses.
  • Step 2: City classification
In order to provide customized development suggestions for cities with different fundamental conditions, we classified the cities according to their readiness level.
Principal component analysis (PCA) is an unsupervised technique that is widely used for dimensionality reduction and feature extraction [65]. It can reduce dimensions by explaining multiple original indicators in fewer principal components, which are new indicators that cannot be directly measured through experiments [66,67]. Therefore, we applied PCA to simplify the number of evaluation indicators while preserving most of their information, making it easier to demonstrate the readiness of smart cities.
Then, we applied k-means clustering analysis according to principal components generated by PCA. It can ensure that each city belongs to only one category, and cities in the same category have similar attributes.
  • Step 3: Data fitting
After classifying the cities according to their readiness level, we investigated the correlation between the input and output indicators of each categories of city separately. According to Figure 2 in Section 3.1.2, the CPE evaluation model for each service domain actually showed a six-input one-output neural network. Multiple linear regression (MLR) is a classic regression method that has multiple inputs and a single output [68]. It can be used to analyze the sole effect of a specific independent variable on the dependent variable while considering the effects of other independent variables, and the degree and direction of the pure influence of each independent variable on the dependent variable can be compared with each other. In addition, the indicators are mostly scored by linear weighting in the existing evaluation methods. Therefore, the multiple linear regression method was used for fitting the data in this study.
  • Step 4: Input-output analysis
Then, we explored the impact of each input factor on citizen experience in each type of city. Sensitivity analysis involves the measurement of the impact of a given input on the output [69]. By changing the input parameters and analyzing the changes in output, sensitivity analysis can be applied to determine the extent to which each input parameter contributes to the generation of output variability.

4. Results

4.1. Smart City Classification Based on Infrastructure Capability Indicators

4.1.1. Principal Component Analysis of Infrastructure Capability Indicators

The validity of the normalized data was evaluated using the Kaiser–Meyer–Olkin (KMO) test and Bartlett’s test. The results are shown in Table 5. The value of KMO was 0.751, which was higher than the cut-off value of 0.5, indicating a high level of correlation between the five normalized indicators. Bartlett’s test of sphericity significance (Sig.) produced a value of less than 0.05, which indicated the utility of PCA.
The content of each principal component can be defined through a component score P C n j as follows:
P C n j = i = 1 5 e j i Z C n i
where e j i is the load of the i-th original indicator in the j-th principal component, P C n j is the score of the j-th principal component for the n-th city, and Z C n i is the i-th normalized indicator value of the n-th city. The variance contribution rate of each indicator can be used as the weight, indicating the proportion of indicators reflecting the overall data. To evaluate the readiness of smart cities, we obtained a comprehensive readiness score via the following formula:
R n = j = 1 5 P C n j λ j
where λ j represents the variance of the j-th principal component, and R n represents the comprehensive readiness score of the n-th city.
The PCA results obtained for the five normalized indicators of 271 cities are shown in Table 6 and Table 7. The cumulative variance of components 1, 2, and 3 was over 75%, which means these three principal components include most of the information from the five original indicators. The first principal component (PC1) represented comprehensive properties and was strongly influenced by Z C 3 and Z C 4 , which indicates data opening and sharing. The second principal component (PC2) was mainly influenced by Z C 1 , which indicates ICT infrastructures. The third principal component (PC3) was mainly influenced by Z C 5 , which indicates organization and management.
The values of principal components PC1, PC2, and PC3 were calculated using Equation (2) and Table 7, as follows:
P C 1 = 0.473 Z C 1 + 0.709 Z C 2 + 0.744 Z C 3 + 0.736 Z C 4 + 0.666 Z C 5 , P C 2 = 0.815 Z C 1 + 0.236 Z C 2 0.218 Z C 3 0.314 Z C 4 0.240 Z C 5 , P C 3 = 0.067 Z C 1 + 0.144 Z C 2 0.389 Z C 3 0.292 Z C 4 + 0.652 Z C 5 ,
The comprehensive readiness score for the n-th city was calculated using Equation (3) and Table 6, as follows:
R n = P C n 1 45.330 % + P C n 2 18.470 % + P C n 3 13.723 %

4.1.2. City Classification by K-Means Clustering Analysis

In the actual construction of smart cities, it is not suitable to adopt a one-size-fits-all construction method for cities at different stages of development. Therefore, we placed the cities with similar readiness into the same category, to enable us to better study on the efficiency of the smart cities in each category. First, we determined what the best quantity of clusters was using Ward’s method. Then, we applied k-means clustering analysis to the 271 sample cities according to principal components PC1, PC2, and PC3.
Ward’s hierarchical clustering method can be used prior to k-means clustering, to determine the optimal number of clusters in advance [70,71]. The results obtained from the use of Ward’s method are shown in Table 8 and Figure 4. The coefficient suddenly increased to 18.350 between step 268 and step 269. Therefore, the best quantity of clusters according to Ward’s method was 3. This means the optimal number of clusters, k, should be adopted in k-means clustering analysis was 3.
We divided 271 smart cities into three categories using k-means clustering. The clustering analysis results obtained are shown in Table 9. For each category, the number of cities, percentage of cities, and average R n were calculated, as shown in Table 10. The classification of cities is intuitively visualized in Figure 5. K-means clustering can be used to classify cities with more obvious internal similarities. This is helpful for follow-up analyses of cities according to their features in further research.
We investigated the characteristics of the three clusters of cities. The average capability indicators { Z C 1 ,   Z C 2 ,   Z C 3 ,   Z C 4 , Z C 5 } and average comprehensive readiness R n of the three clusters were all ordered from high to low, as shown in Table 11 and Figure 6. We named the three clusters according to their readiness level. Cities in Clusters 1, 2, and 3 were defined as having a high level of readiness, medium level of readiness, and low level of readiness, respectively.

4.2. Multiple Linear Regression of Output Parameters

In order to further explore the impact of each input variable in different city categories and different service domains, we conducted a multiple linear regression analysis. For the i-th service domain, the service performance Pi and infrastructure capability {C1, C2, C3, C4, C5} were selected as independent variables, while experience Ei was selected as the dependent variable. In this analysis, the regression model was established as shown in Equation (6) to examine the relationship between the dependent variable Ei and the independent variables C1, C2, C3, C4, C5, and Pi. In this equation, β 0 is a constant, and β 1 , , β 6 are the regression coefficients.
E i = f ( C , P ) = β 0 + β 1 C 1 + β 2 C 2 + + β 5 C 5 + β 6 P i + ϵ
The MLR analysis results obtained for government service, smart transportation, and smart healthcare in high readiness cities, moderate readiness cities, and low readiness cities are shown in Table 12.
To examine the prediction performance of the proposed regression model more intuitively, a comparison was made between the actual value E and the corresponding predicted value E′, as illustrated in Figure 7. The root mean square errors (RMSEs) of (a) to (i) were 0.065, 0.056, 0.063, 0.067, 0.067, 0.067, 0.039, 0.041, and 0.043, respectively. Therefore, the actual values and the corresponding predicted values are in good agreement for each service domain and each category of city.

4.3. Sensitivity Analysis of Input Parameters

The sensitivity coefficient S m of the input parameter m can be determined as shown in Equation (7):
S m = Δ X / X 0 Δ Y m / Y m 0 × 100 % = ( X m X 0 ) / X 0 ( Y m Y m 0 ) / Y m 0 × 100 %
where Δ Y m represents the change in input parameter m, Y m 0 is the baseline value of input parameter m, Δ X is the change in output corresponding to the change in input parameter m, and X 0 is the output value in the baseline case.
In this study, the sensitivity coefficient S m is the unstandardized coefficients shown in Table 12. For example, for citizens’ experience with government service (E1) in a high readiness city (a1), the sensitivity coefficient of ICT infrastructures (C1) was 0.013. For citizens’ experience with smart transportation (E2) in a low readiness city (a3), the sensitivity coefficient of smart transportation service performance (P2) was 0.024.

4.3.1. From the Perspective of Service Domain

According to the sensitivity analysis results shown in Table 12, the influences of input factors on citizens’ experience in each service domain (E1, E2, and E3) were obtained and compared, as shown in Figure 8.
  • Government service:
For the high readiness cities, government service performance (P1) had the most positive impact on citizens’ experience with government service (E1). For the moderate readiness cities, government service performance (P1) had the most positive impact on citizens’ experience of government service (E1); organization and management (C5) and ICT infrastructures (C1) also have positive impacts. For the low readiness cities, none of the input factors had obvious impacts on citizens’ experience with government service (E1); of these, the most influential was ICT infrastructures (C1). These are as shown in Figure 8a.
2.
Smart transportation:
For the high, moderate, and low readiness cities, smart transportation service performance (P2) had the most positive impact on citizens’ experience with smart transportation (E2). For the moderate readiness cities, ICT infrastructures (C1) and organization and management (C5) also had positive impacts on citizens’ experience with smart transportation (E2). None of the other input factors had obvious impacts on citizens’ experience with smart transportation (E2); of these, the most influential was ICT infrastructures (C1). These are as shown in Figure 8b.
3.
Smart Healthcare:
For the high readiness cities, organization and management (C5) and open data (C3) had the most positive impacts on citizens’ experience with smart healthcare (E3). For the moderate readiness cities, smart healthcare service performance (P3) and organization and management (C5) had the most positive impacts on citizen experience of smart healthcare (E3). For the low readiness cities, none of the input factors had obvious impacts on citizens’ experience with smart healthcare (E3); of these, the most influential is ICT infrastructures (C1). These are as shown in Figure 8c.

4.3.2. From the Perspective of Input Factors

Based on the sensitivity analysis results shown in Table 12, the influence of each input factor (C1, C2, C3, C4, C5, P) on every service domain were obtained and compared, as shown in Figure 9.
  • ICT infrastructures:
Comparing the influence of ICT infrastructures (C1) on the three categories of city, moderate readiness cities (a2) were found to be the most affected, while low readiness cities (a3) were the least affected. These are as shown in Figure 9a.
2.
Open data and data sharing:
Comparing the influence of open data (C3) on the three categories of city, high readiness cities (a1) were found to be the most affected, while low readiness cities (a3) were the least affected, as shown in Figure 9c. The results were the same when comparing the influence of data sharing (C4), as shown in Figure 9d.
3.
Organization and management:
Comparing the influence of organization and management (C5) on the three categories of city, moderate readiness cities (a2) were found to be more affected than high readiness cities (a1), while low readiness cities (a3) were barely affected at all. These are as shown in Figure 9e.
4.
Service performance:
Comparing the influence of service performance (P1, P2, and P3) on the three categories of city, moderate readiness cities (a2) were found to be the most affected, while low readiness cities (a3) were the least affected. These are as shown in Figure 9f.
5.
Spatial–temporal data platform:
The influence of spatial–temporal data platform (C2) on the three categories of city was not obvious, as shown in Figure 9b.

5. Discussion

Smart city evaluation is an important form of guidance in the construction of smart city. Academia, governments, and enterprises have proposed different evaluation methods to measure the level of development of smart cities [72]. Most methods focus on how to measure the level of development of a smart city. However, since maximizing the return on investment (ROI) has become a standard objective of smart cities [9], knowing the overall score or ranking of smartness is not enough to guide the decision making. Measuring the efficiency of smart city construction is a basic and long-term work for urban sustainable development [12]. This study attempts to explore how to effectively improve the smart city, that is, to allocate investment reasonably and achieve the best results possible with limited resources.
The literature review of this study highlighted the significance of return on investment [23,31,32] and citizen engagement [21,37] in smart cities. We not only summarized the common features of smart city evaluation methods from the related literature, but also found research gaps from previous research. The common shortcomings include the lack of citizen engagement, ignoring the efficiency of construction, inadequate number of evaluation samples, insufficient quantitative analysis, overlooking of interlinkages, and lack of tailored guidance.
In order to solve the shortcomings mentioned, this study provides a solution for smart city evaluation and data analysis. The proposed model can be extended as needed to measure the service areas not mentioned in this study, or to apply in other countries or regions. The uniqueness of our evaluation framework includes: (1) its classification of cities according to their features; (2) focusing on citizens’ experience with smart city services; and (3) improving construction efficiency of smart cities by studying the relationship between input factors and output factors. The obvious breakthrough of this study is verifying the feasibility of the proposed method by real data.
However, the main limitation of this study is the high dependence on data availability. The effectiveness of the proposed method has been verified in only three service domains, of which the evaluation data is complete. Although the method is generally applicable and elastic, the analysis results of these three service domains cannot guide the construction of other service domains. Since each city has different conditions and characteristics, the specific findings in China may be different from those in other countries. At present, we have made the utmost effort to include as many cities and service domains as possible. In addition, the model proposed in this paper is a simplification of the real smart city. If there are enough credible data, more influencing factors can be added to the model to simulate urban development more accurately.
To overcome these limitations, further research in this area should focus on three directions. Firstly, it is necessary to explore the relationship between input and output factors in more service domains. Secondly, the economic and social attributes can be involved in the CPE model. The preliminary consideration of it is to improve the model into a neural network with hidden layers. Thirdly, when the evaluation data is accumulated for some time, the changes in development strategies after the improvement of urban readiness can be dynamically analyzed. These will be explored, enriched, and improved in further research.

6. Conclusions

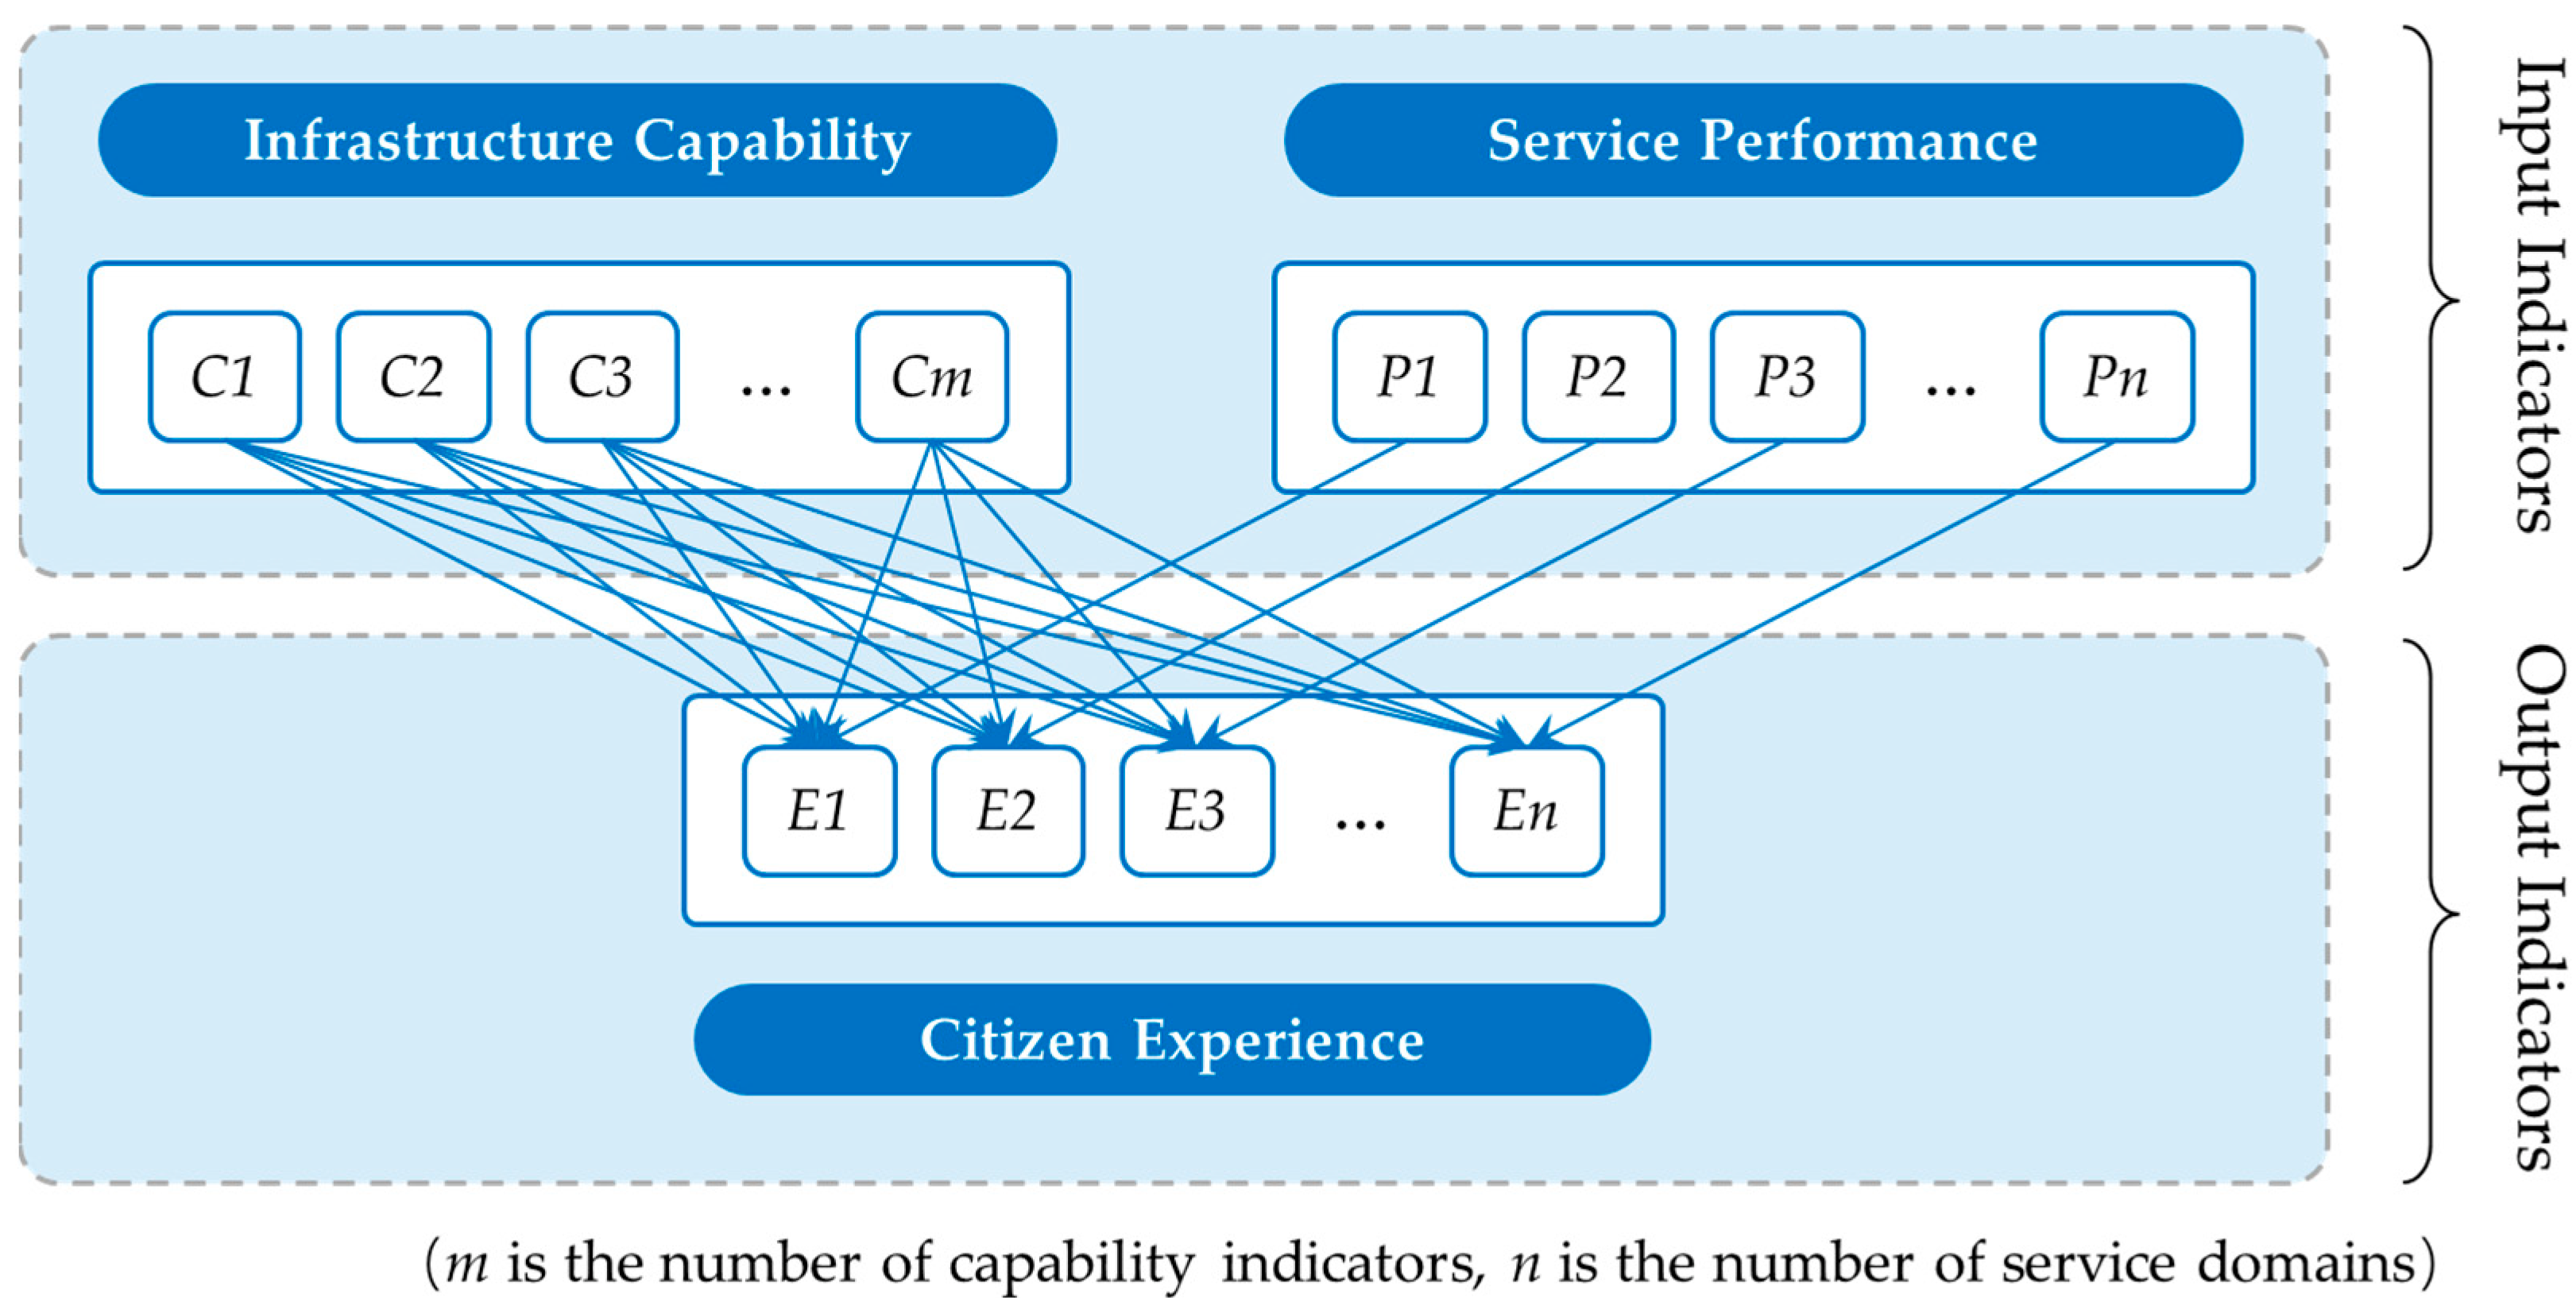
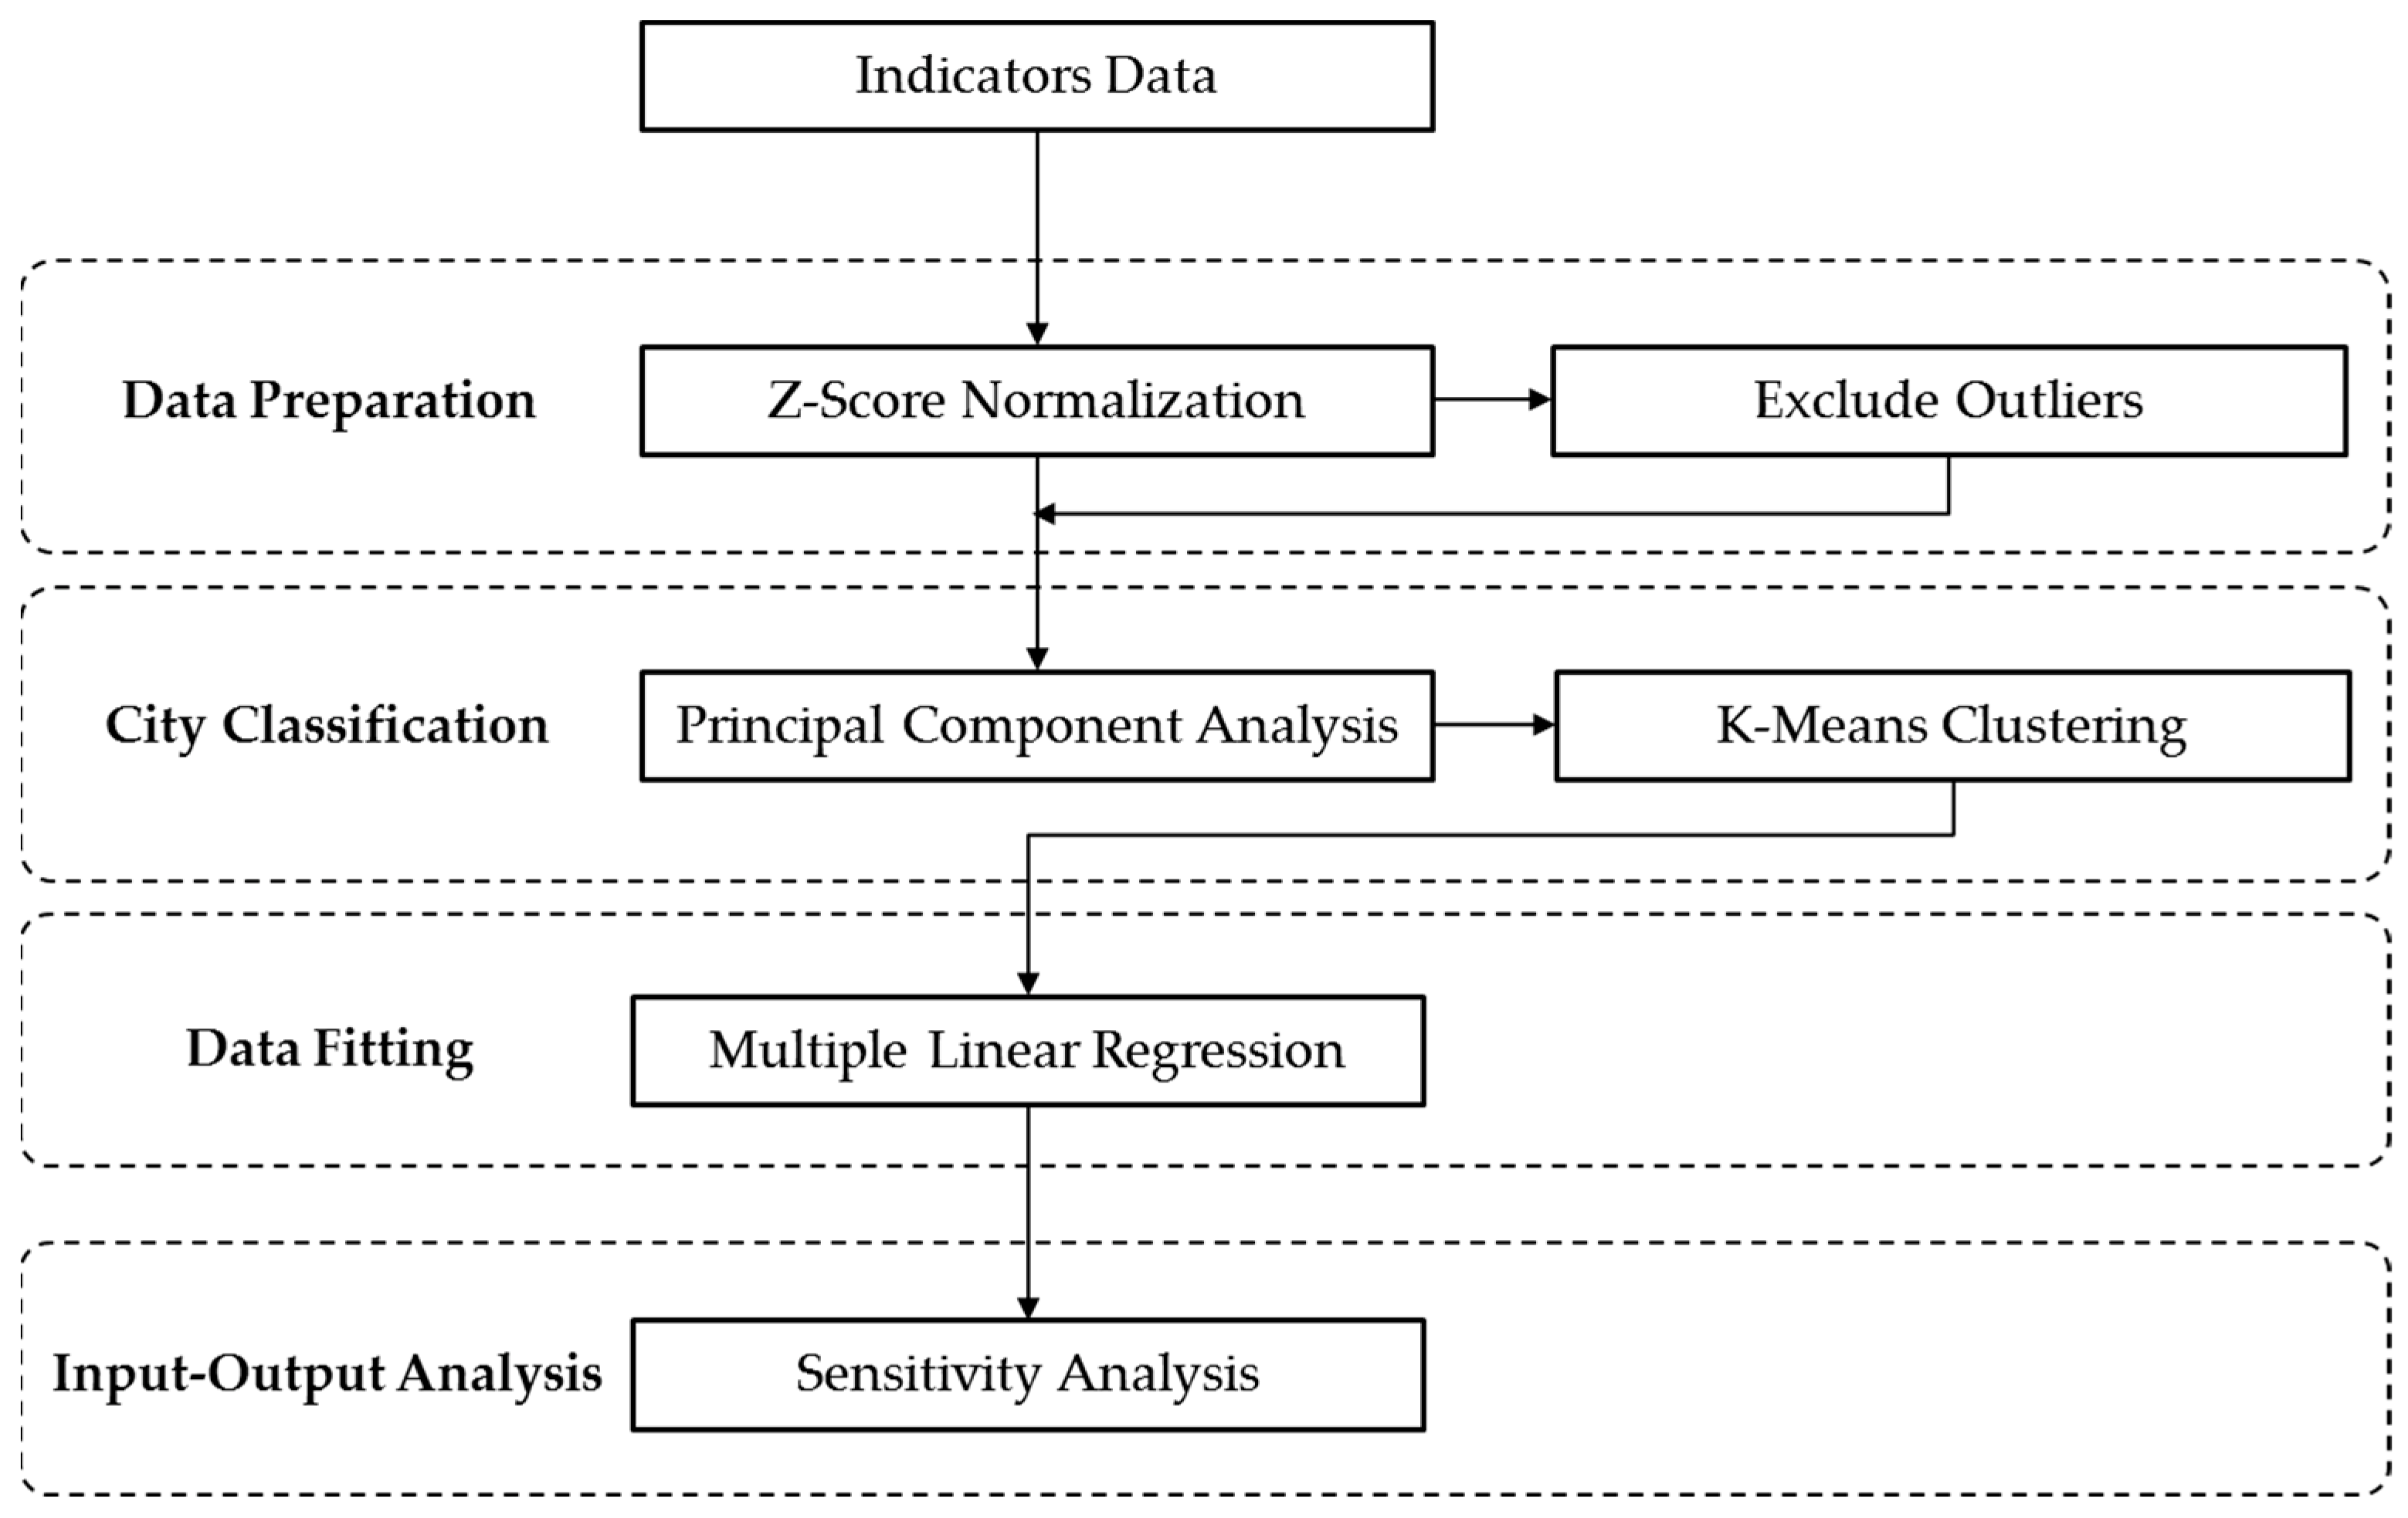
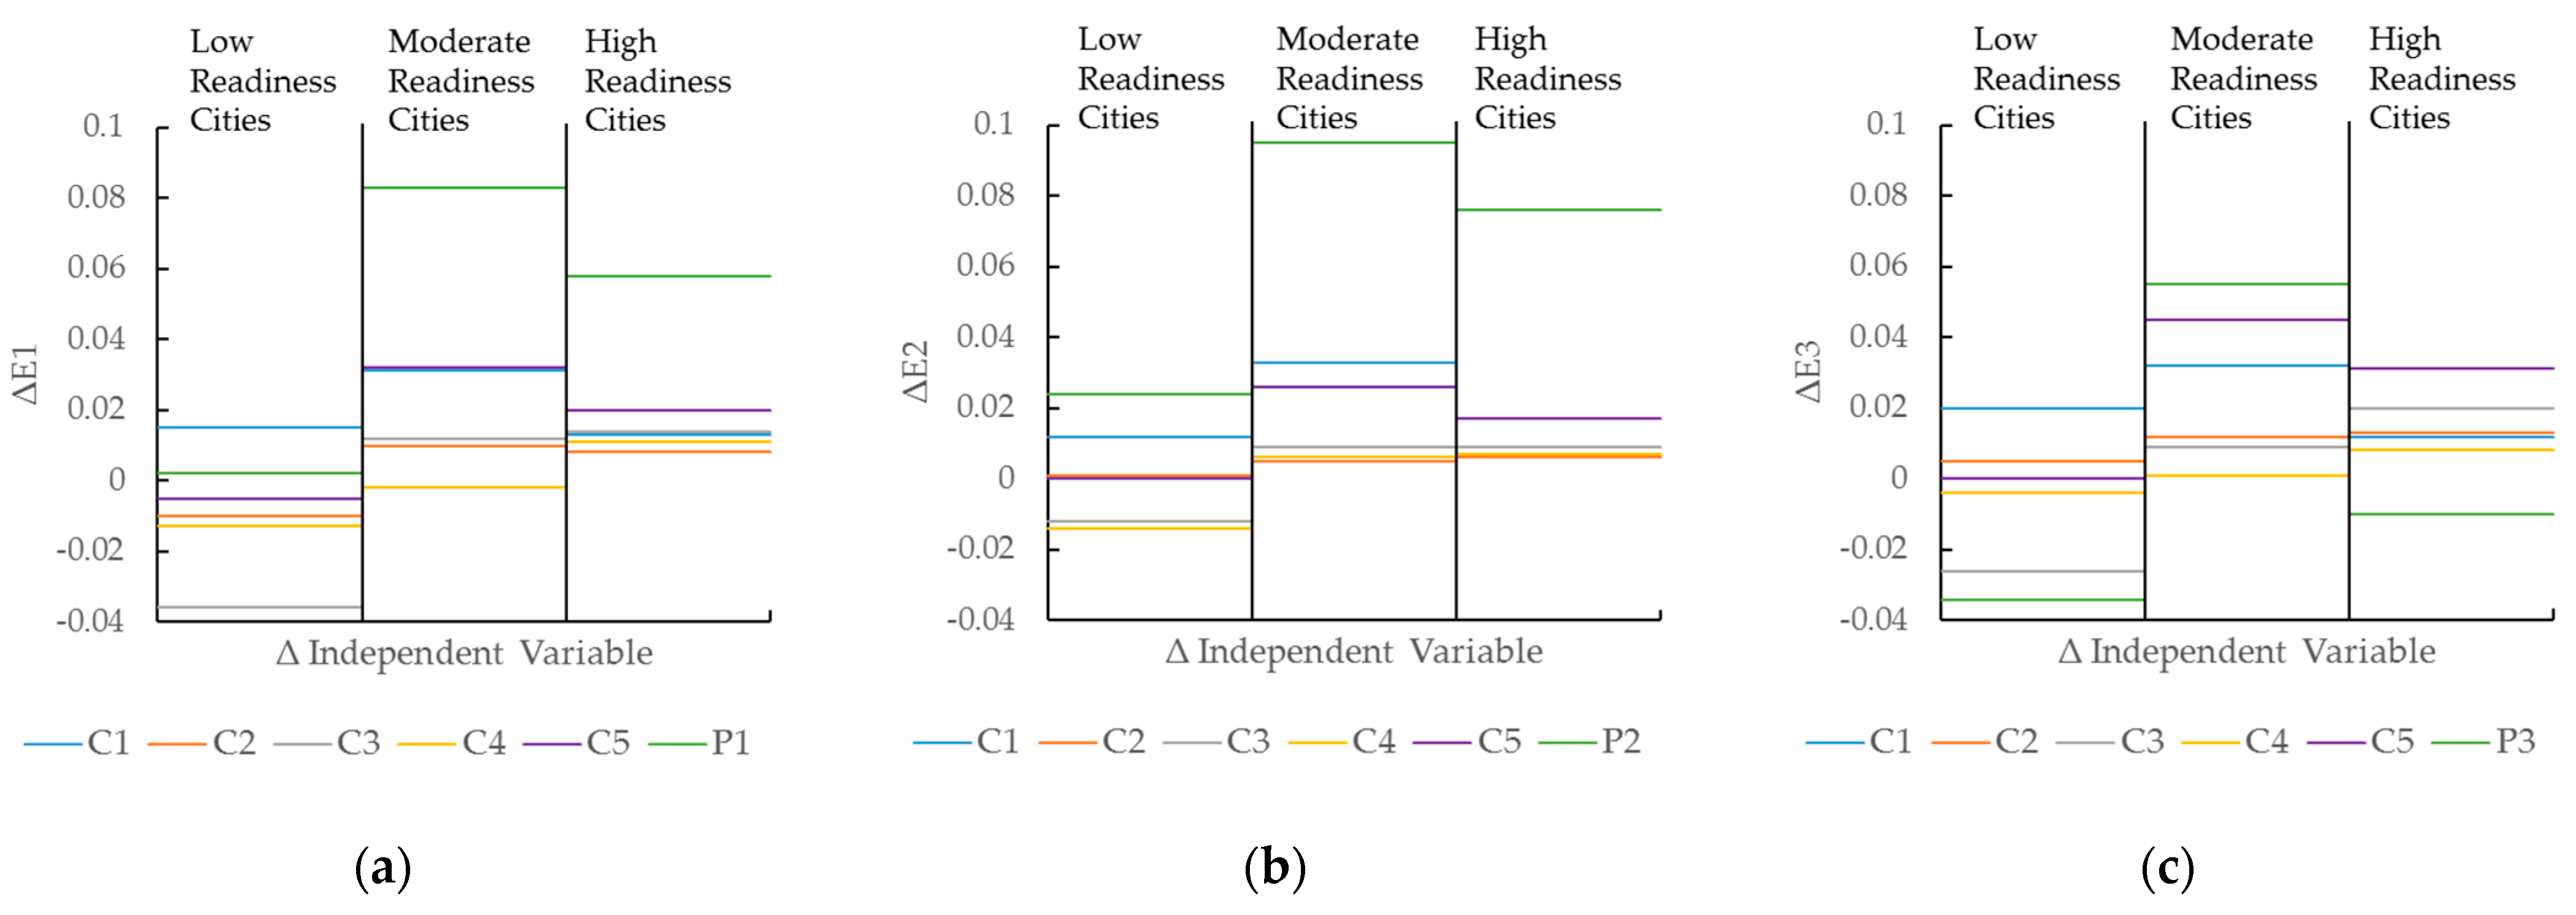
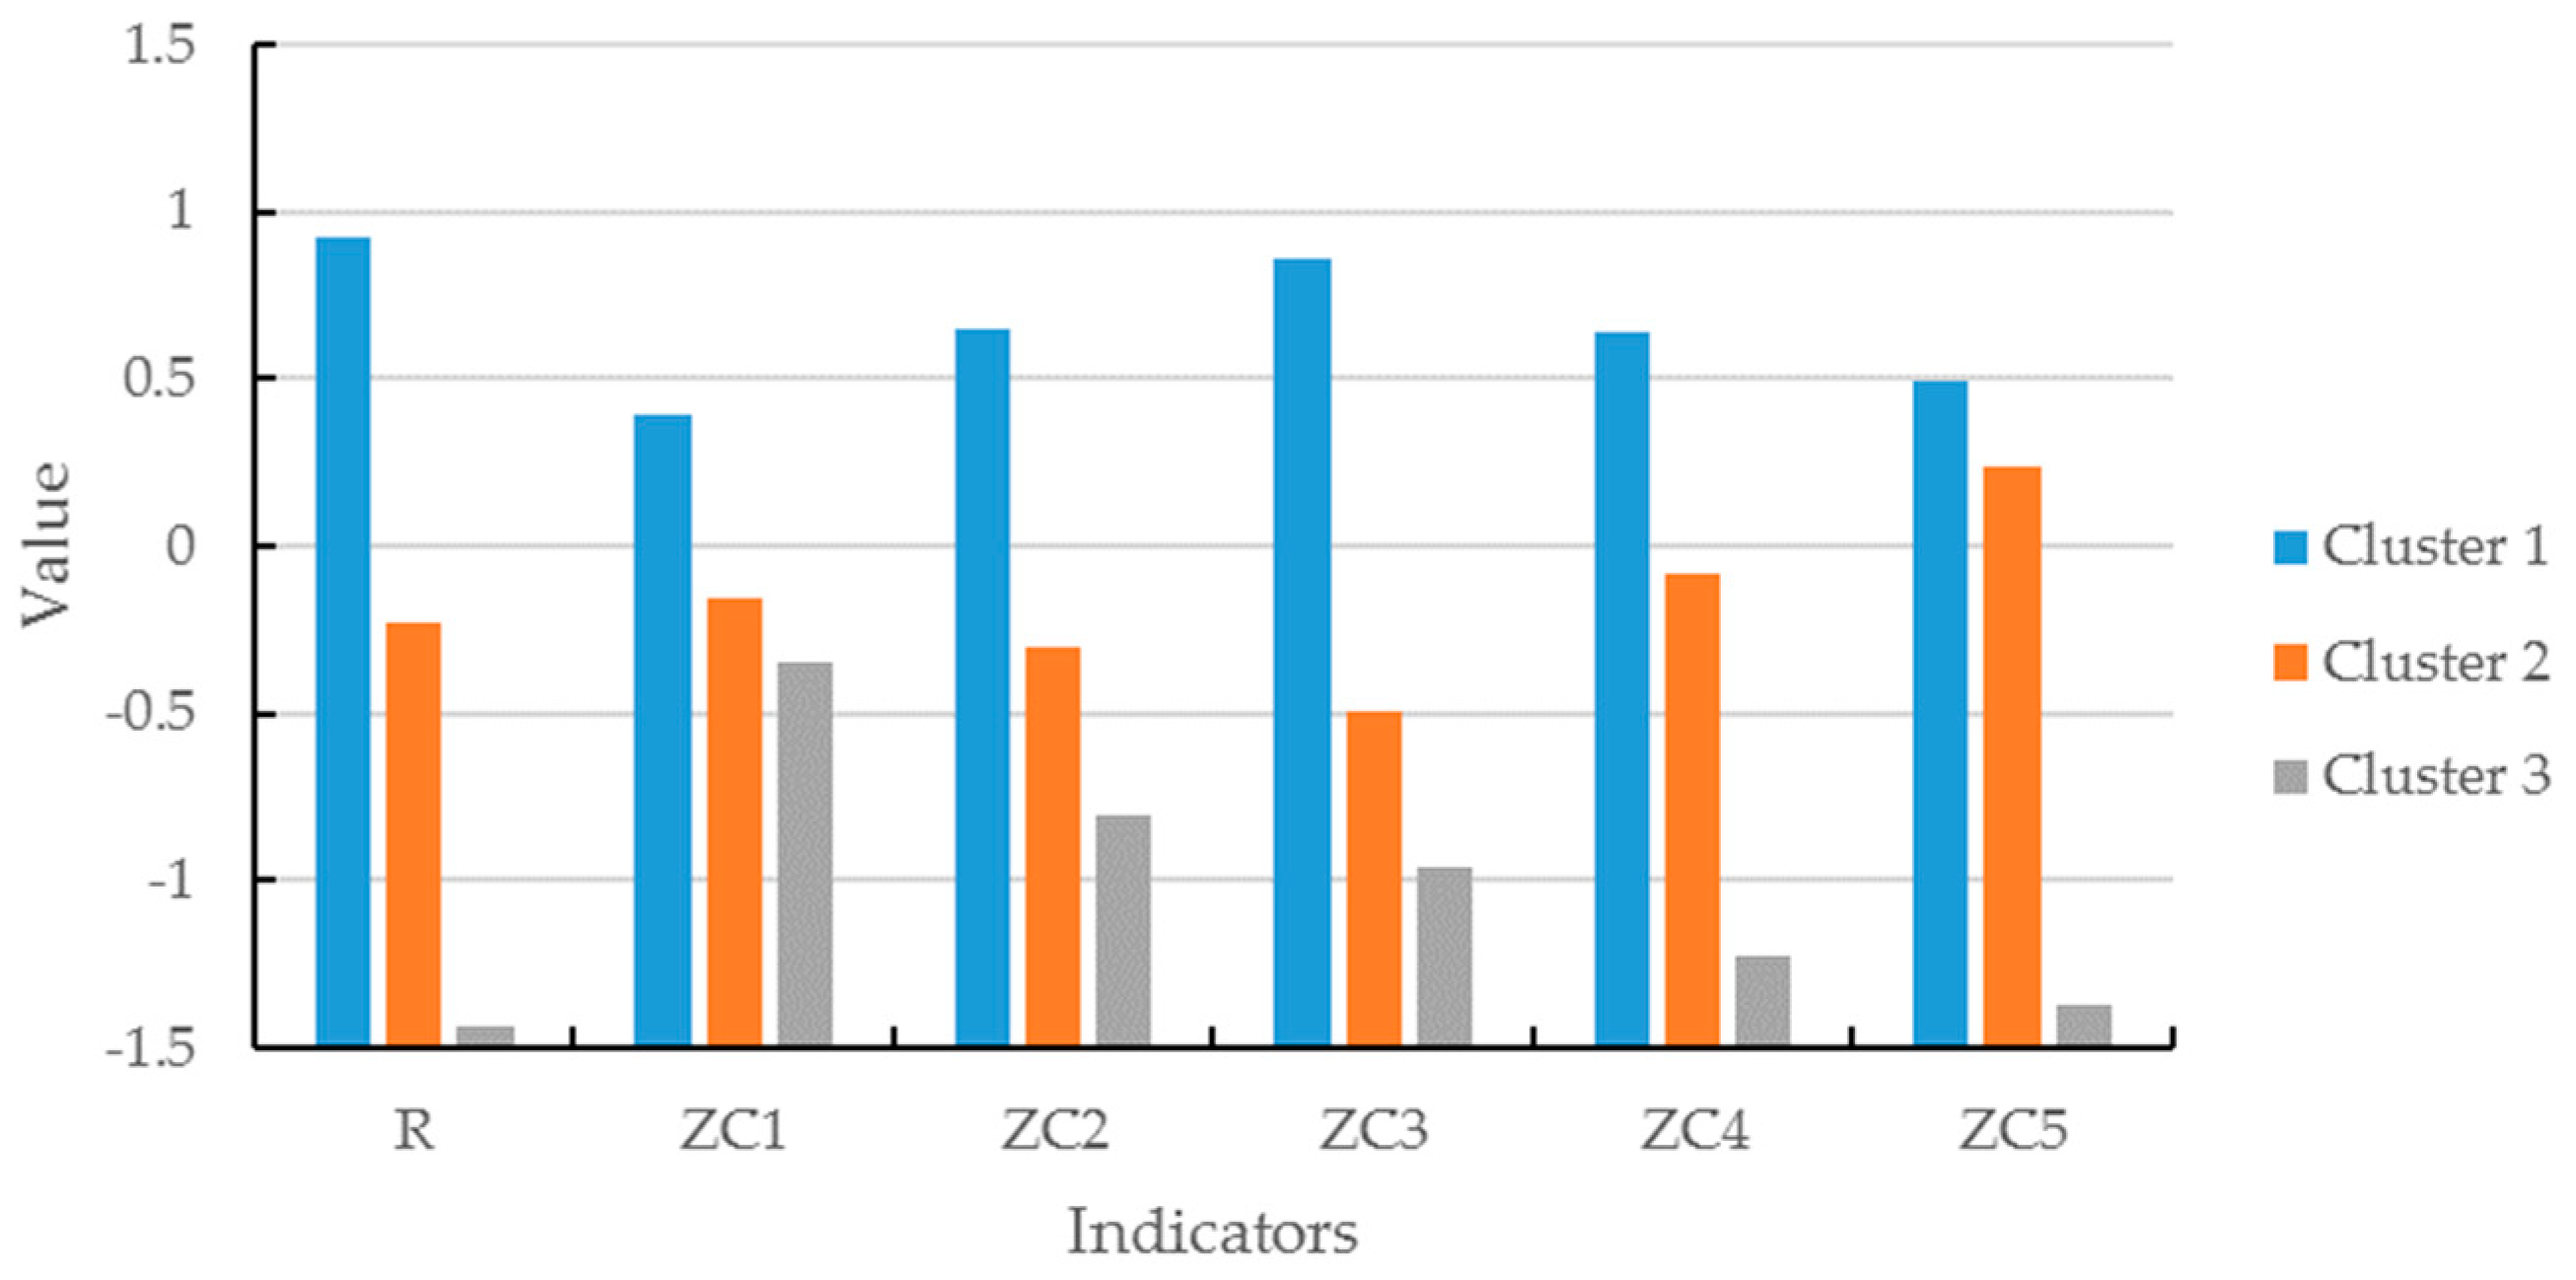
This paper proposes a correlation analysis method for input and output indicators of smart cities. From the analysis of literature on smart city evaluation, some typical input and output factors of smart cities are extracted. An extensible index system is established to evaluate the infrastructure capability, service performance, and citizen experience of smart cities. On this basis, principle component analysis and k-means clustering are applied to classify cities according to their readiness level of infrastructure. Multiple linear regression is applied to investigate the internal relationship between input indicators and output indicators in different types of cities. Then we analyze the impact of the change of each input indicator on each output indicator by sensitivity analysis.
The proposed evaluation method provides an effective basis for the scientific measurement of input and output factors of smart cities. It assists cities to assess the effect of existing smart services and more efficiently generating distribution schemes for the improvement of infrastructure capability and service performance. The findings contribute to accurately designing or adjusting strategies for different types of smart cities. Our method can guide city governments to formulate specific measures to improve the construction effectiveness of smart cities, which will also have a significant reference for the analysis of investment benefits under limited cost.
Through the empirical study involving 275 cities and 1,073,500 citizens in China, we draw some policy implications for smart city construction.

6.1. Considering Urban Characteristics in Policy Making

Since cities have huge differences in their basic conditions and planning directions, it is not suitable to adopt a one-size-fits-all development strategy for smart cities. Each city should focus on its own situation and actual demand when making development decisions. Policy makers should decide how to improve the smartness of the city according to its current stages of development, to achieve accurate and efficient improvement.
For example, in order to maximize the government service experience with limited investment, a developed city with mature ICT infrastructure and good organization may emphasize the improvement of service capacity, such as providing more diversified and convenient services. On the other hand, less developed cities should give priority to improving ICT infrastructure and organization and management, to ensure basic network transmission and process optimization.
According to our research, it is necessary for cities to find the correct positioning according to their own basic characteristics. The characteristics here include the readiness of facilities, data, and management analyzed in this paper. In addition, it can also include attributes such as population, GDP level, major industries, and so on.

6.2. Maximizing the Effectiveness of Investment

A truly efficient smart city needs to operate in an integrated manner in order to better prioritize investment and maximize the value of the return. In general, investment should be given priority to infrastructure, followed by organization and management, then to data and applications.
For example, for cities with underdeveloped infrastructures, investing in data sharing and data opening will not produce the desired benefits. If the decision makers unwisely choose to improve data sharing and data opening without paying attention to the construction of network facilities or IoT, the investment will be wasted and citizens’ experience will not be improved. Meanwhile, if the infrastructure and management of a city have been improved to a certain level, the beneficial effect gained by improving them will decrease. Decision makers should adjust their strategies in time to make data opening and data sharing their priority.
Cities need to comprehensively evaluate the possible effects of investment strategy, and decide the investment roadmap rationally. Especially for cities with limited budgets, priority should be given to the domains with the highest expected input-output ratio.

6.3. Emphasizing the Value of Citizens’ Perceptions

The smart city is the product of the high integration of socio-economic development and information technology. It should be emphasized that the performance at the technical level does not directly reflect the user’s satisfaction. In technology-driven smart city projects, citizens often passively accept top-down services rather than the bottom-up expression of opinions.
As citizens are the most critical users of smart cities, high citizen satisfaction should be one of the most important goals of smart cities. Citizens’ perceptions should be fully considered not only when measuring the effectiveness of smart city construction, but also before, during, and after smart city construction.
City governments can strengthen the requirement analysis through questionnaires or other methods during the designing period of smart city projects. After the smart city projects are put into application, a post-evaluation mechanism can support the sustainable improvement of the projects.

Author Contributions

Conceptualization, methodology, formal analysis, writing—original draft preparation and editing, visualization, Y.F.; writing—review, supervision, funding acquisition, Z.S. All authors have read and agreed to the published version of the manuscript.

Funding

This research was funded by National Key R&D Project of China (Grant No. 2018YFB2101501) and the National Natural Science Foundation of China (Grant No. 61832012).

Institutional Review Board Statement

Not applicable.

Informed Consent Statement

Informed consent was obtained from all subjects involved in this study.

Data Availability Statement

Not applicable.

Conflicts of Interest

The authors declare no conflict of interest.

References

  1. Dutton, W.H.; Blumler, J.G.; Kramer, K.L. Continuity and change in conceptions of the wired city. In Wired Cities: Shaping the Future of Communications; G. K. Hall & Co.: Boston, MA, USA, 1987; pp. 3–26. [Google Scholar]
  2. Graham, S.; Marvin, S. Planning cybercities: Integrating telecommunications into urban planning. Town Plan. Rev. 1999, 70, 89–114. [Google Scholar] [CrossRef]
  3. Ishida, T. Understanding digital cities. In Digital Cities; Sanchez, J., Vallejo, D., Eds.; Springer: Berlin/Heidelberg, 2000; Volume 1765, pp. 7–17. [Google Scholar] [CrossRef]
  4. Komninos, N. Intelligent Cities: Innovation, Knowledge Systems and Digital Spaces; Routledge: London, UK, 2013; pp. 176–201. [Google Scholar]
  5. Hollands, R.G. Will the real smart city please stand up? City 2008, 12, 303–320. [Google Scholar] [CrossRef]
  6. Al-Kodmany, K. Sentient city: Ubiquitous computing, architecture, and the future of urban space. J. Urban Technol. 2012, 19, 137–140. [Google Scholar] [CrossRef]
  7. Capdevila, I.; Zarlenga, M.I. Smart city or smart citizens? The Barcelona case. J. Strat. Manag. 2015, 8, 266–282. [Google Scholar] [CrossRef]
  8. Yin, C.; Xiong, Z.; Chen, H.; Wang, J.; Cooper, D.; David, B. A literature survey on smart cities. Sci. China Inf. Sci. 2015, 58, 1–18. [Google Scholar] [CrossRef]
  9. Ballesteros, L.G.M.; Álvarez, Ó.; Markendahl, J. Quality of Experience (QoE) in the Smart Cities Context: An Initial Analysis. In Proceedings of the IEEE First International Smart Cities Conference (ISC2), Guadalajara, Mexico, 25–28 October 2015; pp. 1–7. [Google Scholar]
  10. Nam, T.; Pardo, T.A. Smart City as Urban Innovation: Focusing on Management, Policy, and Context. In Proceedings of the 5th International Conference on Theory and Practice of Electronic Governance, Tallinn, Estonia, 26–28 October 2011; pp. 185–194. [Google Scholar]
  11. Li, C.; Dai, Z.; Liu, X.; Sun, W. Evaluation system: Evaluation of smart city shareable framework and its applications in China. Sustainability 2020, 12, 2957. [Google Scholar] [CrossRef] [Green Version]
  12. Li, G.; Wang, Y.; Luo, J.; Li, Y. Evaluation on construction level of smart city: An empirical study from twenty Chinese cities. Sustainability 2018, 10, 3348. [Google Scholar] [CrossRef] [Green Version]
  13. Giffinger, R.; Haindlmaier, G.; Kramar, H. The role of rankings in growing city competition. Urban Res. Pract. 2010, 3, 299–312. [Google Scholar] [CrossRef]
  14. Giffinger, R.; Fertner, C.; Kramar, H.; Meijers, E. City-ranking of European medium-sized cities. Cent. Reg. Sci. Vienna UT 2007, 9, 1–12. [Google Scholar]
  15. Smart City Index Master Indicators Survey. Available online: https://smartcitiescouncil.com/resources/smart-city-index-master-indicators-survey (accessed on 15 March 2022).
  16. The Smartest Cities in the World. Available online: http://www.fastcoexist.com/3038818/the-smartest-cities-in-the-world-2015-methodology (accessed on 15 March 2022).
  17. ISO 31722:2019; Sustainable Cities and Communities–Indicators for Smart Cities. ISO (International Organization for Standardization): Geneva, Switzerland, 2019.
  18. Smart City Index. Available online: https://www.imd.org/globalassets/wcc/docs/smart_city/smartcityindex_2020.pdf (accessed on 15 March 2022).
  19. GB/T 33356-2016; Evaluation Indicators for New-Type Smart Cities. Standardization Administration of China: Bejing, China, 2016.
  20. ISO/IEC 30146:2019; Information Technology–Smart City ICT Indicators. ISO (International Organization for Standardization): Geneva, Switzerland, 2019.
  21. Liu, F.; Shi, Y.; Chen, Z. Smart City Ranking Reliability Analysis. In Proceedings of the International Conference on Computational Science and Computational Intelligence (CSCI), Las Vegas, NV, USA, 12–14 December 2018; pp. 537–540. [Google Scholar]
  22. Shi, H.; Tsai, S.-B.; Lin, X.; Zhang, T. How to evaluate smart cities’ construction? A comparison of Chinese smart city evaluation methods based on PSF. Sustainability 2018, 10, 37. [Google Scholar] [CrossRef] [Green Version]
  23. Yousefimehr, A. Smart Cities; Analyzing Themes and Concepts of Smartness in Urban Environments. Master’s Thesis, Bilkent University, Ankara, Turkey, 2019. [Google Scholar]
  24. Reeves, D. How to create a smart city: Future-proofed cities that foster growth and innovation. IEEE Electrif. Mag. 2018, 6, 34–41. [Google Scholar] [CrossRef]
  25. Roshan, R.; Kr, A. Challenges and risk to implement IOT in smart homes: An indian perspective. Int. J. Comput. Appl. 2016, 153, 16–19. [Google Scholar] [CrossRef]
  26. Schiele, G.; Soldatos, J.; Mitton, N. Moving towards interoperable Internet-of-Things deployments in smart cities. ERCIM News 2014, 98, 16–17. [Google Scholar]
  27. Karamitsos, I.; Apostolopoulos, C. Optical trends in data centers architectures for smart cities. Int. J. Inf. Technol. 2018, 10, 3–9. [Google Scholar] [CrossRef]
  28. Calvillo, C.; Sánchez-Miralles, A.; Villar, J. Energy management and planning in smart cities. Renew. Sustain. Energy Rev. 2016, 55, 273–287. [Google Scholar] [CrossRef] [Green Version]
  29. Calvillo, C.F.; Sanchez, A.; Villar, J. Distributed Energy Generation in Smart Cities. In Proceedings of the International Conference on Renewable Energy Research and Applications, Madrid, Spain, 20–23 October 2013. [Google Scholar]
  30. Wang, P.; Ali, A.; Kelly, W. Data Security and Threat Modeling for Smart City Infrastructure. In Proceedings of the International Conference on Cyber Security of Smart Cities, Industrial Control System and Communications (SSIC), Shanghai, China, 5–7 August 2015; pp. 1–6. [Google Scholar]
  31. Walravens, N.; Ballon, P. Platform business models for smart cities: From control and value to governance and public value. IEEE Commun. Mag. 2013, 51, 72–79. [Google Scholar] [CrossRef]
  32. Zanella, A.; Bui, N.; Castellani, A.; Vangelista, L.; Zorzi, M. Internet of Things for smart cities. IEEE Internet Things J. 2014, 1, 22–32. [Google Scholar] [CrossRef]
  33. Kitchin, R.; Coletta, C.; Evans, L.; Heaphy, L.; Mac Donncha, D. Smart Cities, Urban Technocrats, Epistemic Communities and Advocacy Coalitions. In Proceedings of the A New Technocracy Workshop, Programmable City Working Paper 26, Amsterdam, The Netherlands, 20–21 March 2017. [Google Scholar] [CrossRef]
  34. Schechtner, K. Bridging the adoption gap for smart city technologies: An interview with Rob Kitchin. IEEE Pervasive Comput. 2017, 16, 72–75. [Google Scholar] [CrossRef]
  35. Vilajosana, I.; Llosa, J.; Martinez, B.; Domingo-Prieto, M.; Angles, A.; Vilajosana, X. Bootstrapping smart cities through a self-sustainable model based on big data flows. IEEE Commun. Mag. 2013, 51, 128–134. [Google Scholar] [CrossRef]
  36. Dohler, M.; Ratti, C.; Muñoz, L.; Chatzimisios, P. Editorial of ETT feature issue: Smart cities—Trends & technologies. Trans. Emerg. Telecommun. Technol. 2014, 25, 1–2. [Google Scholar] [CrossRef]
  37. Georgiadis, A.; Christodoulou, P.; Zinonos, Z. Citizens’ perception of smart cities: A case study. Appl. Sci. 2021, 11, 2517. [Google Scholar] [CrossRef]
  38. Tu, W. Data-driven QoS and QoE management in smart cities: A tutorial study. IEEE Commun. Mag. 2018, 56, 126–133. [Google Scholar] [CrossRef]
  39. Lin, C.; Hu, J.; Kong, X.-Z. Survey on models and evaluation of Quality of Experience. Chin. J. Comput. 2012, 35, 1–15. [Google Scholar] [CrossRef]
  40. Document ITU-T G.1011; Reference Guide to Quality of Experience Assessment Methodologies; ITU (International Telecommunication Union): Geneva, Switzerland, 2016.
  41. Laghari, K.U.R.; Connelly, K. Toward total quality of experience: A QoE model in a communication ecosystem. IEEE Commun. Mag. 2012, 50, 58–65. [Google Scholar] [CrossRef]
  42. Komninos, N.; Pallot, M.; Schaffers, H. Special issue on smart cities and the future Internet in Europe. J. Knowl. Econ. 2013, 4, 119–134. [Google Scholar] [CrossRef]
  43. Kosowatz, J. Building a smart city. Mech. Eng. 2017, 139, 32–37. [Google Scholar] [CrossRef] [Green Version]
  44. Oh, J. Smart city as a tool of citizen-oriented urban regeneration: Framework of preliminary evaluation and its application. Sustainability 2020, 12, 6874. [Google Scholar] [CrossRef]
  45. Garriga-Portolà, M.; López-Ventura, J. The role of open government in smart cities. In Open Government, Public Administration and Information Technology; Gascó-Hernández, M., Ed.; Springer: New York, NY, USA, 2014; Volume 4, pp. 205–216. [Google Scholar]
  46. Floris, A.; Porcu, S.; Atzori, L. Quality of Experience Management of Smart City Services. In Proceedings of the 10th International Conference on Quality of Multimedia Experience (QoMEX), Sardinia, Italy, 29 May–1 June 2018; pp. 1–3. [Google Scholar]
  47. Shin, D.-H. Conceptualizing and measuring quality of experience of the internet of things: Exploring how quality is perceived by users. Inf. Manag. 2017, 54, 998–1011. [Google Scholar] [CrossRef]
  48. He, X.; Wang, K.; Huang, H.; Liu, B. QoE-driven big data architecture for smart city. IEEE Commun. Mag. 2018, 56, 88–93. [Google Scholar] [CrossRef]
  49. Crooks, A.; Schechtner, K.; Dey, A.K.; Hudson-Smith, A. Creating smart buildings and cities. IEEE Pervasive Comput. 2017, 16, 23–25. [Google Scholar] [CrossRef]
  50. Dameri, R.P. Searching for smart city definition: A comprehensive proposal. Int. J. Comput. Technol. 2013, 11, 2544–2551. [Google Scholar] [CrossRef]
  51. Tadili, J.; Fasly, H. Citizen Participation in Smart Cities: A Survey. In Proceedings of the 4th International Conference on Smart City Applications, Casablanca, Morocco, 2–4 October 2019; pp. 1–6. [Google Scholar]
  52. Cardullo, P.; Kitchin, R. Being a ‘citizen’ in the smart city: Up and down the scaffold of smart citizen participation in Dublin, Ireland. GeoJournal 2019, 84, 1–13. [Google Scholar] [CrossRef]
  53. Mellouli, S.; Luna-Reyes, L.F.; Zhang, J. Smart government, citizen participation and open data. Inf. Polity 2014, 19, 1–4. [Google Scholar] [CrossRef] [Green Version]
  54. Suryanegara, M.; Prasetyo, D.A.; Andriyanto, F.; Hayati, N. A 5-step framework for measuring the Quality of Experience (QoE) of Internet of Things (IoT) Services. IEEE Access 2019, 7, 175779–175792. [Google Scholar] [CrossRef]
  55. Caragliu, A.; Del Bo, C.; Nijkamp, P. Smart cities in Europe. J. Urban Technol. 2011, 18, 65–82. [Google Scholar] [CrossRef]
  56. Roman, K. Analysis and evaluation of the implementation level of the smart city concept in selected polish cities. BRAIN. Broad Res. Artif. Intell. Neurosci. 2018, 9, 138–145. [Google Scholar]
  57. ISO 37120:2018; Sustainable Development of Communities–Indicators for City Services and Quality of Life. ISO (International Organization for Standardization): Geneva, Switzerland, 2018.
  58. Ahvenniemi, H.; Huovila, A.; Pinto-Seppä, I.; Airaksinen, M. What are the differences between sustainable and smart cities? Cities 2017, 60, 234–245. [Google Scholar] [CrossRef]
  59. Intelligent Community Indicators. Available online: https://www.intelligentcommunity.org/tags/ic_indicators (accessed on 15 March 2022).
  60. Global Smart City Performance. Available online: https://newsroom.intel.com/wp-content/uploads/sites/11/2018/03/smart-cities-whats-in-it-for-citizens.pdf (accessed on 15 March 2022).
  61. Sharifi, A. A critical review of selected smart city assessment tools and indicator sets. J. Clean. Prod. 2019, 233, 1269–1283. [Google Scholar] [CrossRef]
  62. Barsi, B. Beyond indicators, new methods in smart city assessment. Smart Cities Reg. Dev. (SCRD) J. 2018, 2, 87–99. [Google Scholar]
  63. What Is ‘Networked Readiness’ and Why Does It Matter? Available online: https://www.weforum.org/agenda/2016/07/what-is-networked-readiness-and-why-does-it-matter/ (accessed on 15 March 2022).
  64. Patro, S.G.K.; Sahu, K.K. Normalization: A preprocessing stage. Int. Adv. Res. J. Sci. Eng. Technol. 2015, 2, 20–22. [Google Scholar] [CrossRef]
  65. Bishop, C.M.; Nasrabadi, N.M. Pattern Recognition and Machine Learning; Springer: New York, NY, USA, 2006; Volume 4. [Google Scholar]
  66. Choi, S.; Kim, B. Applying PCA to deep learning forecasting models for predicting PM2. Sustainability 2021, 13, 3726. [Google Scholar] [CrossRef]
  67. Zhang, G.; Fu, Q.; Fu, Z.; Li, X.; Matetić, M.; Bakaric, M.B.; Jemrić, T. A comprehensive peach fruit quality evaluation method for grading and consumption. Appl. Sci. 2020, 10, 1348. [Google Scholar] [CrossRef] [Green Version]
  68. Liu, J.; Zhao, M.; Li, G.; Chen, J. Multiple linear regression prediction and wavelet neural network based intelligent online tuning control method. IEEE Access 2020, 8, 160684–160696. [Google Scholar] [CrossRef]
  69. Saltelli, A.; Tarantola, S.; Campolongo, F.; Ratto, M. Global sensitivity analysis for importance assessment. In Sensitivity Analysis in Practice; John Wiley & Sons: Hoboken, NJ, USA, 2002; pp. 31–61. [Google Scholar]
  70. Milligan, G.W.; Cooper, M.C. Methodology review: Clustering methods. Appl. Psychol. Meas. 1987, 11, 329–354. [Google Scholar] [CrossRef] [Green Version]
  71. Lin, R.-H.; Chuang, W.-W.; Chuang, C.-L.; Chang, W.-S. Applied big data analysis to build customer product recommendation model. Sustainability 2021, 13, 4985. [Google Scholar] [CrossRef]
  72. Huovila, A.; Bosch, P.; Airaksinen, M. Comparative analysis of standardized indicators for smart sustainable cities: What indicators and standards to use and when? Cities 2019, 89, 141–153. [Google Scholar] [CrossRef]
Figure 1. Input–output model for smart cities.
Sustainability 14 06512 g001
Figure 2. CPE evaluation model for a smart city.
Sustainability 14 06512 g002
Figure 3. The steps of data processing and analysis.
Sustainability 14 06512 g003
Figure 4. The coefficient increment of Ward’s method.
Sustainability 14 06512 g004
Figure 5. Result obtained from k-means clustering classification method.
Sustainability 14 06512 g005
Figure 6. Characteristics of the three clusters of cities.
Sustainability 14 06512 g006
Figure 7. Effective prediction for each service domain in each category of city. (a) Citizens’ experience with government service in high readiness cities; (b) citizens’ experience with government service in moderate readiness cities; (c) citizens’ experience with government service in low readiness cities; (d) citizen’s experience with smart transportation in high readiness cities; (e) citizens’ experience with smart transportation in moderate readiness cities; (f) citizens’ experience with smart transportation in low readiness cities; (g) citizens’ experience with smart healthcare in high readiness cities; (h) citizens’ experience with smart healthcare in moderate readiness cities; (i) citizens’ experience with smart healthcare in low readiness cities.
Sustainability 14 06512 g007
Figure 8. Sensitivity coefficient of input parameters for each service domain. (a) Government service; (b) smart transportation; (c) smart healthcare.
Sustainability 14 06512 g008
Figure 9. Sensitivity coefficient of each input factor on all service domains. (a) ICT infrastructures; (b) spatial–temporal data platform; (c) open data; (d) data sharing; (e) organization and management; (f) service performance.
Sustainability 14 06512 g009
Table 1. Existing smart city evaluation models based on critical factors.
TitlePrimary IndicatorsCalculation Method of IndicatorsWeightingScope of Implementation
Sustainable Cities and Communities—Indicators for Smart Cities (ISO 31722:2019)economy, education, energy, environment and climate change, finance, governance, health, housing, population and social conditions, recreation, safety, solid waste, sport and culture, telecommunication, transportation, urban/local agriculture and food safety, urban planning, waste water, waterN/AN/AN/A
City-ranking of European medium-sized citieseconomy, people, governance, mobility, environment, and livingyesequal-weighted70 European cities
Cohen Smart City Indexenvironment, mobility, government, economy, people, and livingyesN/Aworldwide
Table 2. Existing two-pillar smart city evaluation models.
TitlePrimary IndicatorsCalculation Method of IndicatorsWeightingScope of Implementation
Evaluation Indicators for New-Type Smart Cities (GB/T 33356-2016)capability: intelligent facilities, data resources, cyber security, reform and innovationyesdecided by experts337 Chinese cities
performance: livelihood services, precision governance, ecological livability
citizen experience
Information Technology—Smart City ICT indicators (ISO/IEC 30146:2019)capability: smart facility, information resource, cyber securityyesN/AN/A
performance: citizen service, efficient governance, livable environment
IMD-SUTD Smart City Indexstructure: infrastructures relating to health and safety, mobility, activities, opportunities, and governanceN/AN/A109 cities worldwide
technology: services relating to health and safety, mobility, activities, opportunities, and governance
Table 3. CPE evaluation index system.
CategoryInput IndicatorsOutput Indicators
Infrastructure CapabilityService PerformanceCitizen Experience
a1C1, C2, , CmP1E1
P2E2
PnEn
a2C1, C2, , CmP1E1
P2E2
PnEn
Table 4. A set of indicators based on the CPE evaluation model.
Primary IndicatorSecondary IndicatorEvaluation Content
Infrastructure Capability (C)C1: ICT infrastructuresCoverage of fixed broadband network and mobile broadband network, application of Internet of Things, clouds, etc.
C2: Spatial–temporal data platformConstruction and application of a spatial–temporal data platform
C3: Open dataEvaluation of the openness of public data to society
C4: Data sharingEvaluation of data sharing among government departments
C5: Organization and managementEstablishment of specialized organization, leadership systems, performance appraisals, and project management systems
Service Performance (P)P1: Government serviceConvenience of the physical or online government services that can be accessed by citizens
P2: Smart transportationEvaluation of real-time traffic light management, public transportation arrival forecasting, and e-payment systems in public vehicles
P3: Smart healthcareProportion of medical institutions with electronic medical records and online appointments
Citizen Experience (E)E1: Government serviceCitizens’ evaluation of government services (in terms of usability, usefulness, accessibility, efficiency, etc.)
E2: Smart transportationCitizens’ evaluation of smart transportation services (in terms of usability, usefulness, accessibility, efficiency, etc.)
E3: Smart healthcareCitizens’ evaluation of smart healthcare services (in terms of usability, usefulness, accessibility, efficiency, etc.)
Table 5. KMO and Bartlett’s test.
KMO and Bartlett’s Test
Kaiser–Meyer–Olkin Measure of Sampling Adequacy0.751
Bartlett’s Test of SphericityApprox. Chi-Square213.778
df10
Sig.0.000
Table 6. Percentage of the total variance explained.
ComponentInitial Eigenvalues
Total% of VarianceCumulative %
12.26745.33045.330
20.92318.47063.800
30.68613.72377.523
40.61312.26589.788
50.51110.212100.000
Table 7. Component matrix of the principal components.
IndicatorComponent
123
Z C 1 0.4730.815−0.067
Z C 2 0.7090.2360.144
Z C 3 0.744−0.218−0.389
Z C 4 0.736−0.314−0.292
Z C 5 0.666−0.2400.652
Table 8. The agglomeration schedule of Ward’s method.
StageCluster CombinedCoefficientsStage Cluster
First Appears
Next Stage
Cluster 1Cluster 2Cluster 1Cluster 2
1841740.000007
2882430.0000016
341620.000007
4952150.0000045
2643226.047261252268
2655106.549262258267
26611337.098263173269
2675207.463265260268
268359.322264267269
2691318.350266268270
27013241.5192692200
Table 9. Final clustering centers for 271 cities by the k-means clustering analysis.
Cluster
123
PC12.096−0.560−3.268
PC2−0.032−0.1230.447
PC3−0.1340.335−0.256
Table 10. Basic statistical description of each cluster.
ClusterNumber of Cities% of Cities Average   R n
112144.65%0.926
29535.06%−0.231
35520.30%−1.434
Total271100.00%0.041
Table 11. Characteristics of the three clusters of cities.
ClusterAverage Score
RZC1ZC2ZC3ZC4ZC5
10.9260.3970.6510.8640.6430.495
2−0.231−0.157−0.303−0.494−0.0810.234
3−1.434−0.348−0.809−0.958−1.227−1.371
Table 12. The multiple linear regression results of three service domains in three categories of city.
Dependent VariablesIndependent VariablesUnstandardized Coefficients B
High Readiness Cities
(a1)
Moderate Readiness Cities (a2)Low Readiness Cities
(a3)
E1Constant0.7610.7370.727
C10.0130.0310.015
C20.0080.010−0.010
C30.0140.012−0.036
C40.011−0.002−0.013
C50.0200.032−0.005
P10.0580.0830.002
E2Constant0.7760.7560.756
C10.0060.0330.012
C20.0060.0050.001
C30.0090.009−0.012
C40.0070.006−0.014
C50.0170.0260.000
P20.0760.0950.024
E3Constant0.7880.7530.758
C10.0120.0320.020
C20.0130.0120.005
C30.0200.009−0.026
C40.0080.001−0.004
C50.0310.0450.000
P3−0.0100.055−0.034
Publisher’s Note: MDPI stays neutral with regard to jurisdictional claims in published maps and institutional affiliations.

