Article

Freshwater Aquaculture Development in EU and Latin-America: Insight on Production Trends and Resource Endowments

by
Gergő Gyalog
1,*,
Julieth Paola Cubillos Tovar
2,* and
Emese Békefi
1
1
Research Centre for Aquaculture and Fisheries, Institute of Aquaculture and Environmental Safety, Hungarian University of Agriculture and Life Sciences, 5540 Szarvas, Hungary
2
Doctoral School of Economic and Regional Sciences, Hungarian University of Agriculture and Life Sciences, 2100 Gödöllő, Hungary
*
Authors to whom correspondence should be addressed.
Sustainability 2022, 14(11), 6443; https://doi.org/10.3390/su14116443
Submission received: 1 April 2022 / Revised: 20 May 2022 / Accepted: 23 May 2022 / Published: 25 May 2022

Abstract

:
This paper provides a comparative overview of decadal changes in aquaculture production in the European Union (EU-27) and Latin America and the Caribbean (LAC). Contrary to other regions of the world, freshwater fish farming in these two territories is a marginal sub-segment of the aquaculture sector. Using an indicator-based approach, we track development tendencies in freshwater aquaculture, focusing on the main established and emerging species, diversification, and shifts in the mean trophic level of farmed animals. Geographical patterns in production trends are revealed in both regions. The study attempts to explain between-region and between-country differences in aquaculture growth by analyzing freshwater resource endowments at region-level and country-level, using total renewable water resources (TRWR) as an indicator of water-abundancy. Thermal optimum of main produced species is matched against climate conditions prevailing in main producer countries to provide further understanding of spatial heterogeneity in growth rates of aquaculture sector.

1. Introduction

Since the mid-1990s, nearly all growth in seafood supply has originated from aquaculture. At the global level, the contribution of freshwater fish production to total aquaculture output increased from 55.6% to 61.2% between 1995 and 2019 [1], indicating that the growth rate of freshwater aquaculture outpaces that of mariculture. In the European Union (EU-27) and Latin America and the Caribbean (LAC), the profile of the aquaculture industry is different from the other regions, since coastal (marine or brackish water) aquaculture dominates the sector in both regions. In 2019, freshwater aquaculture only contributed 25.0% and 27.4% to total fish production in LAC and EU-27, respectively [1], and the rate of its growth was lower than that of marine aquaculture in both regions.
Nevertheless, freshwater aquaculture production experienced considerable growth in the latest decades in LAC [2]. In contrast, freshwater production in the EU has stagnated for decades, however, there is large heterogeneity between growth rates of member states. Opportunities for aquaculture growth are not the same in the two regions, as they differ from each other in terms of markets, regulation environment, and resource availability. Per capita fish consumption in the EU-27 is relatively high with a value of 24 kg/year, corresponding to a yearly consumed quantity of 12.3 million tons. With only a 41% self-sufficiency rate, the EU is the most important seafood importer in the world [3]. Moreover, in the category of freshwater fish, the self-sufficiency rate of the EU-27 is only 37% [4]. Conversely, LAC has the lowest per capita seafood consumption in the world with only 10.5 kg/year which is equivalent to a demand of 6.7 million tons, largely met by marine fisheries [5]. Latin American aquaculture is a net aquatic food exporter, and even though the majority of exports originated from the marine environment, tilapia, farmed in freshwater, is also marketed in large quantities to the USA [6]. However, domestic demand for aquatic food is increasing, as among all regions of the world the highest growth rate (+18% between 2016 and 2030) in per capita seafood consumption is projected for Latin America [5].
All in all, freshwater aquaculture has a marginal role in total fish production and aquatic food supply both in the EU and LAC, but domestic markets exist and are being developed for freshwater aquatic products, and for the latter, region export markets would also offer growth potential if competitiveness was further improved. This paper attempts to review the trends of freshwater aquaculture production under these circumstances. Although there are a variety of socio-economic and regulatory conditions in which the two regions differ from each other, it was not the intention of this study to explore these. Rather, using aggregate statistics we tracked the internal tendencies of the sector. As such, the paper presents, both at a regional and country-level, how the production volume changed over the last decade and investigates which species contributed to the growth. By using an index for diversification, we conclude whether freshwater aquaculture tends towards diversification or concentration. Between-country differences in production tendencies are revealed in both regions, and we attempt to explain these with differences in freshwater resource endowments and climatic conditions.

2. Data Sources for the Analysis

Data on aquaculture production (both quantity and value) was obtained from FAO FishstatJ [1]. The unit value of production was calculated by dividing production value by production quantity. Population information, which was used for calculating production growth per capita, was derived from the World Bank database [7]. Trophic levels (TL) in aquaculture were considered in our study. TL for each species was extracted from FishBase [8]. The TL of interspecific hybrids was assigned based on the TL of parental lines. Renewable freshwater estimates were obtained from the FAO Aquastat program website [9]. At the country-level, we used the indicator ‘Total annual renewable water resources (TRWR) per inhabitant’ to represent the water endowment of major aquaculture producer countries. In order to calculate the region-level (EU-27 and LAC) values for the availability of renewable water, first, we summed country-level data on ‘Total internal annual renewable water resources (TIRWR)’ (i.e., not counting external water resources) in order to avoid the problem of multiple accounting of resources shared by more than one country [10]. Second, the sum of the country-level TIRWR values was divided by the population of the region [7] to calculate the per-capita availability of renewable water resources in the EU-27 and LAC. We presented climate information for the analysis, which was extracted from the Climate Change Portal of the World Bank Group [11]. For our study, we utilized monthly mean temperature data recorded in the 1990–2020 reference period. The thermal optimum of cultured species was copied from the META (Maritime and Environmental Thresholds for Aquaculture) database [12].
To measure the diversification degree of the aquaculture sector, we implemented an index from Hofherr et al. (2012) [13]. This index was calculated both at the country-level and region-level. This diversification index (DIV) considers the Herfindahl-Hirschman Index (HHI), which is a calculation of variety that takes into account both richness (i.e., the number of farmed items) and evenness (i.e., how evenly the quantity produced is distributed among these items). The range of DIV is set from 0 to 1, where a score close to 1 indicates a highly diversified industry in terms of the families produced, and a score close to 0 indicates a sector that is highly concentrated on one family [14]. The calculation formula of DIV is as follows:
DIV = 1 i = 1 N s i 2
where Si: share of production of species belonging to a family in total aquaculture production, and N is the number of fish families farmed in the aquaculture sector.

3. Aquaculture Production Trends in the Two Regions

Although at the global level, freshwater aquaculture is expanding rapidly, there is spatial heterogeneity in development patterns both between regions and within each region. Figure 1 provides an overview of those countries in the two regions considered in this study, where freshwater aquaculture output fell over the last ten years.

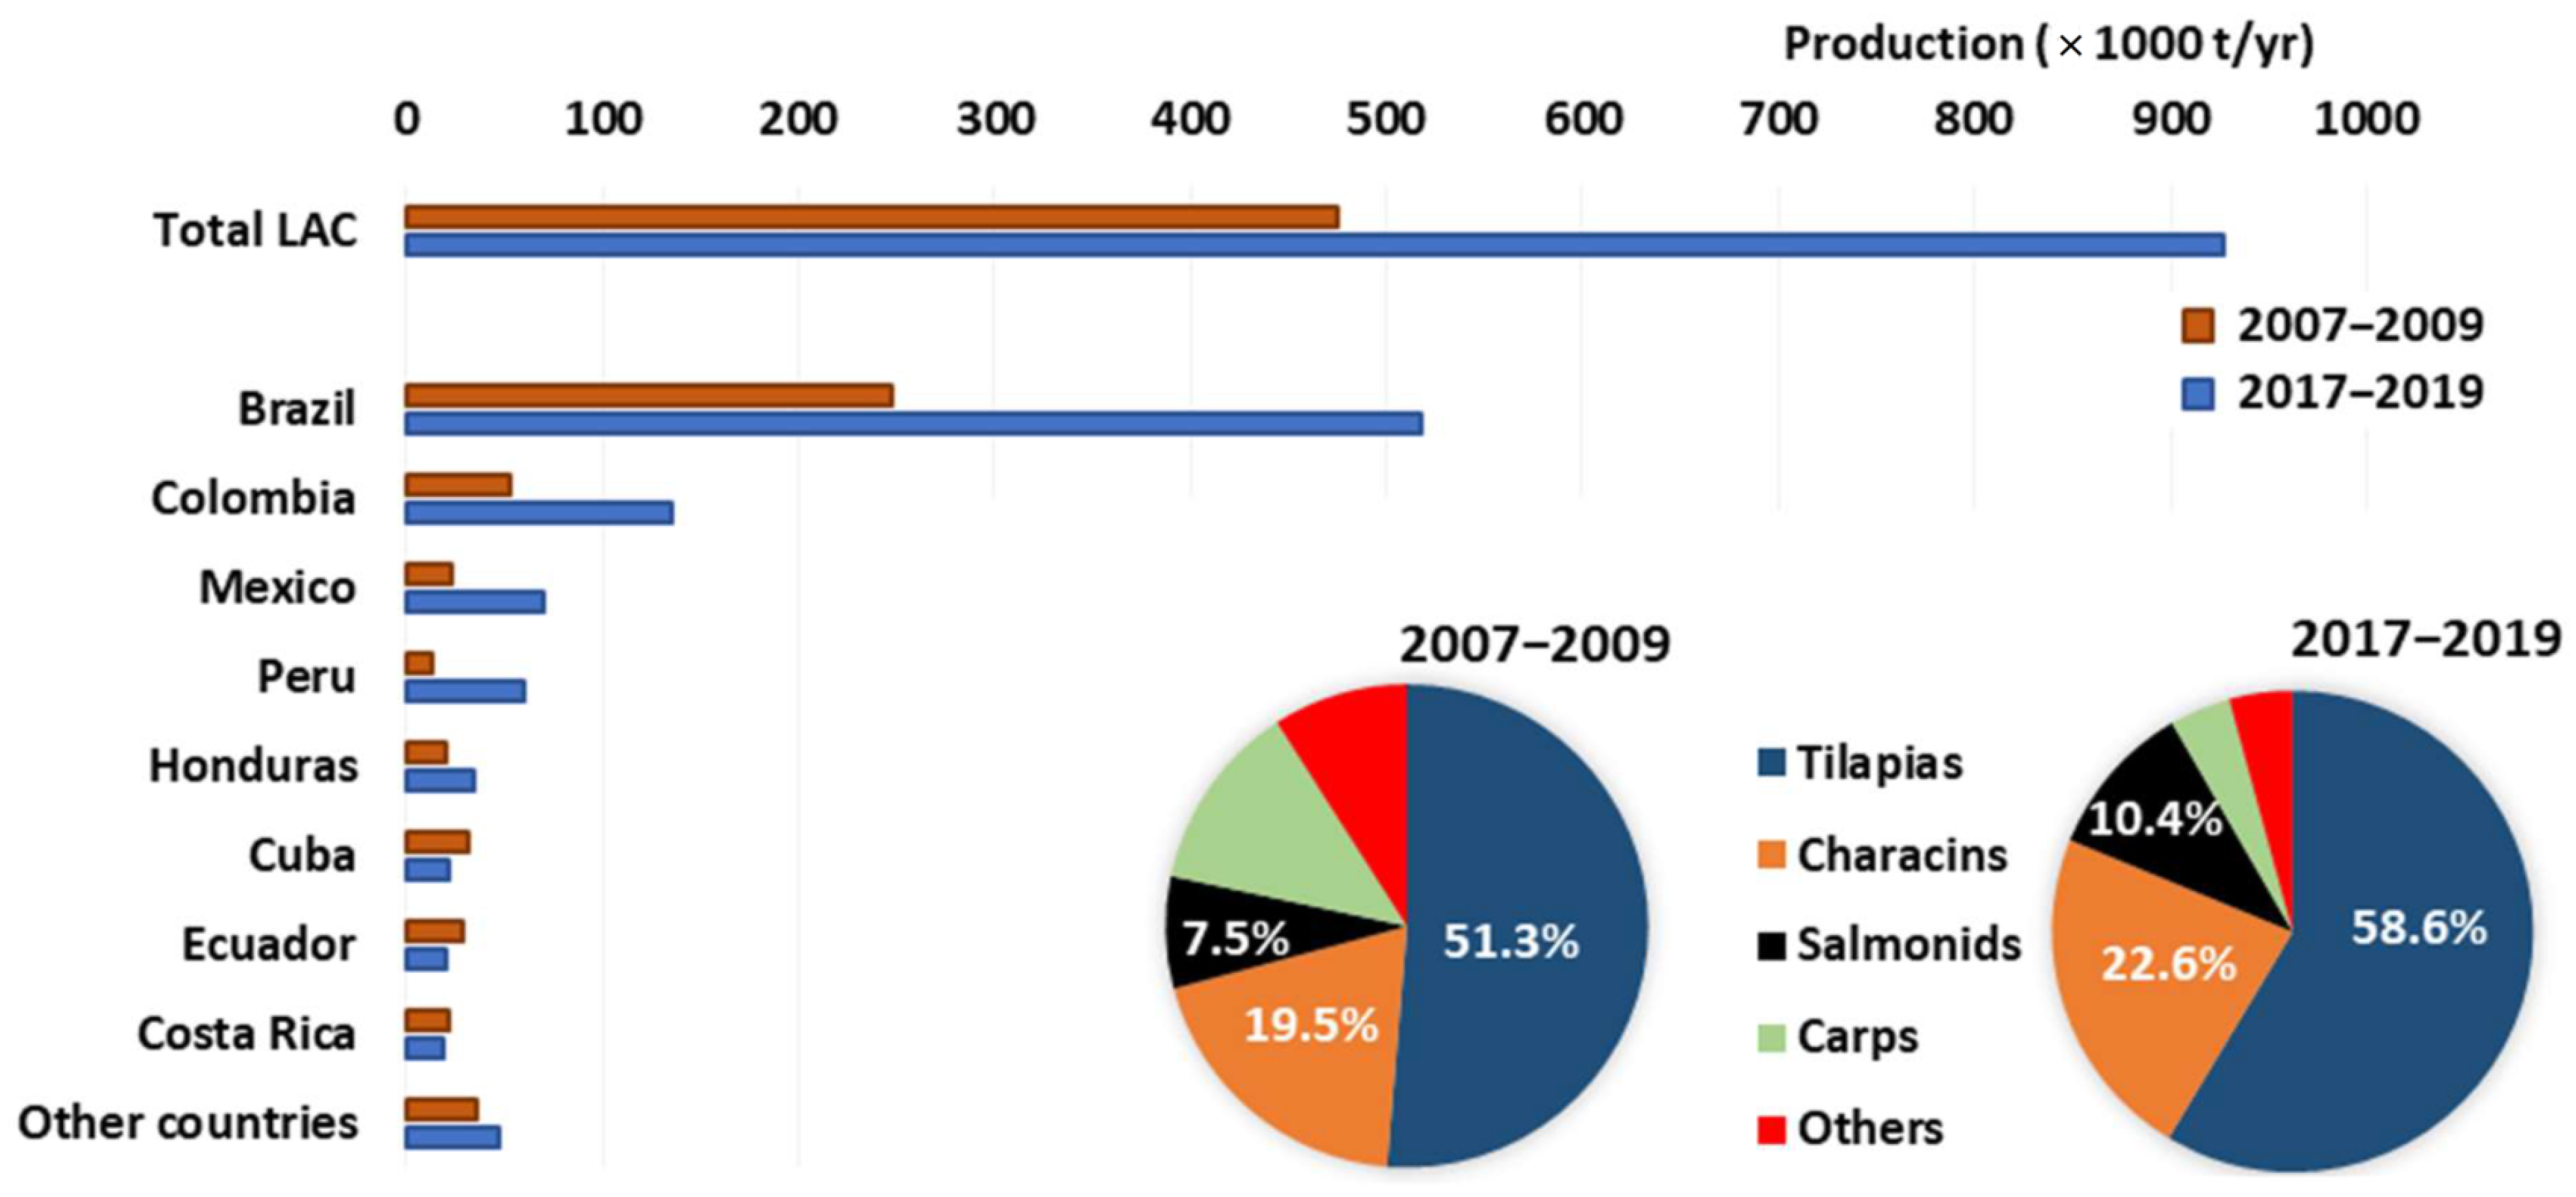
3.1. Production in LAC

Figure 2 presents the decadal changes in Latin American freshwater aquaculture production. During this period the output grew by 95% (from 476 to 927 kT), which is considerably higher than the growth rate of the global freshwater aquaculture level (60%) [1,5]. Brazil is by far the largest producer of LAC; it is the only non-Asian country in the top 10 of the global list of freshwater aquaculture producers (ranking 7th in 2019), and the 2.1-fold growth in Brazilian production over a decade is considerably higher than in other large global producers. However, in other major producers of LAC (Peru, Mexico, and Colombia) the sector grew at a rate even higher than in Brazil. Altogether the top-4 producers (Brazil, Colombia, Mexico, and Peru) account for 85% of total freshwater aquaculture output in the region, and contributed to 98% of the increment in production volume over a decade. Annual production in these four countries increased from 338 to 783 kT. On the contrary, there was a drop in output in some countries, including Ecuador and Chile in South America, and many of the Central American and Caribbean states (Cuba, Costa Rica, Jamaica, Panama).
Regional aquaculture development was centered around the growth of tilapia (mainly Nile tilapia) production, a non-native tropical fish with standardized rearing protocols which has robust domestic and export (USA and European) markets [15,16]. With a yearly output of 543 kT, tilapia contributes to 59% of regional production. Farming of characins, a family of tropical species native to LAC (mainly cachama, pirapatinga, pacu, and their interspecific hybrids), is produced entirely for domestic markets, and cold-water salmonids (almost exclusively represented by non-native rainbow trout) is also a rapidly growing segment in the region. Carp farming, a traditional and formerly important sub-sector in LAC aquaculture, has gradually lost its weight over the last decade (Figure 1).

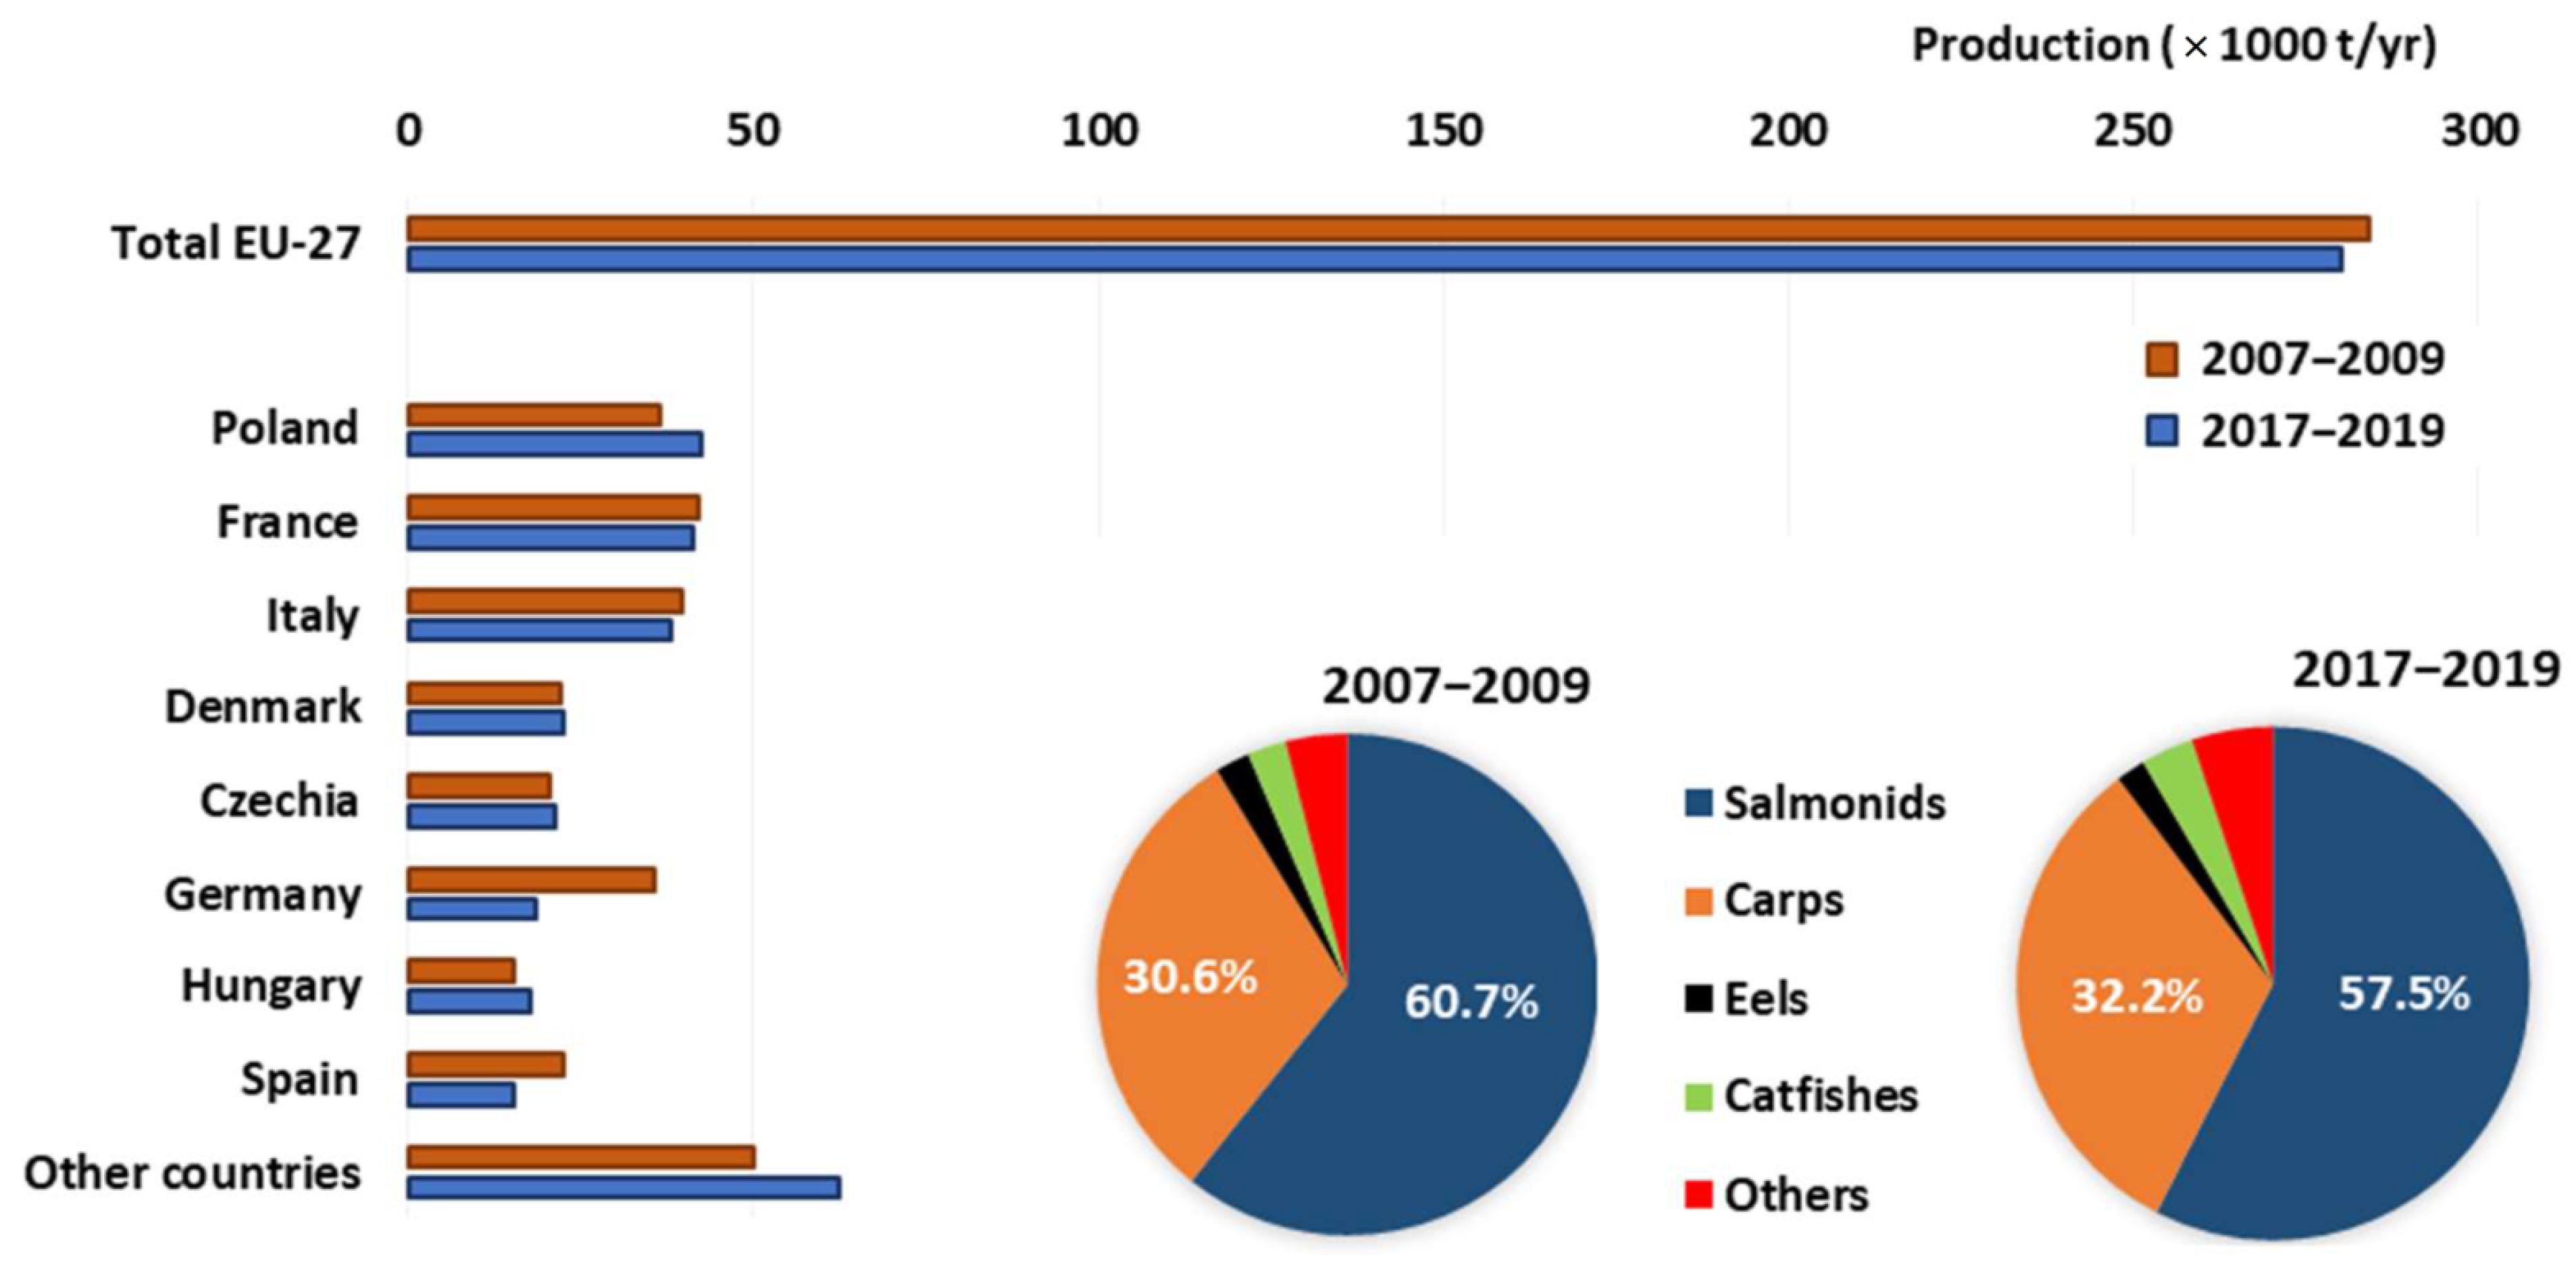
3.2. Production in EU

Contrary to significant development in Latin American and global freshwater aquaculture, output in the EU has not grown for decades. Production has slightly decreased from 284 to 280 kT over the last decade (Figure 3). Similar to Latin America, big differences exist between the development patterns of individual countries. There are marked west-east and south-north gradients in industry growth rates: aquaculture output in most of the Western and Mediterranean countries fell, on the contrary, Eastern and Northern EU states increased their fish production (Figure 1).
EU aquaculture is heavily concentrated on two species, which altogether account for 83% of production. Rainbow trout, a predatory species predominant in the aquaculture of Northern, Western, and Mediterranean countries, are farmed in cold-water systems. The production of this species fell in the period investigated, from 167 to 152 kT. The second most important farmed organism is the common carp (70 kT in 2007–2009 and 73 kT in 2017–2019), which is cultured at lower trophic levels in warm-water aquaculture, mainly in Eastern European EU states. Production statistics suggest that geographical patterns in aquaculture development are more important than general differences in growth pathways of different species, since carp production shrank significantly in France and Germany, despite the general growth of the carp industry in Eastern Europe.
In addition to rainbow trout and common carp, several other Salmonidae and Cyprinidae species are farmed as well, but in lower volumes. Next to salmonids and cyprinids, higher TL value species (catfishes, sturgeons, perciform sp., eel, pike) are cultured in the EU, which have a higher market value than cyprinids.

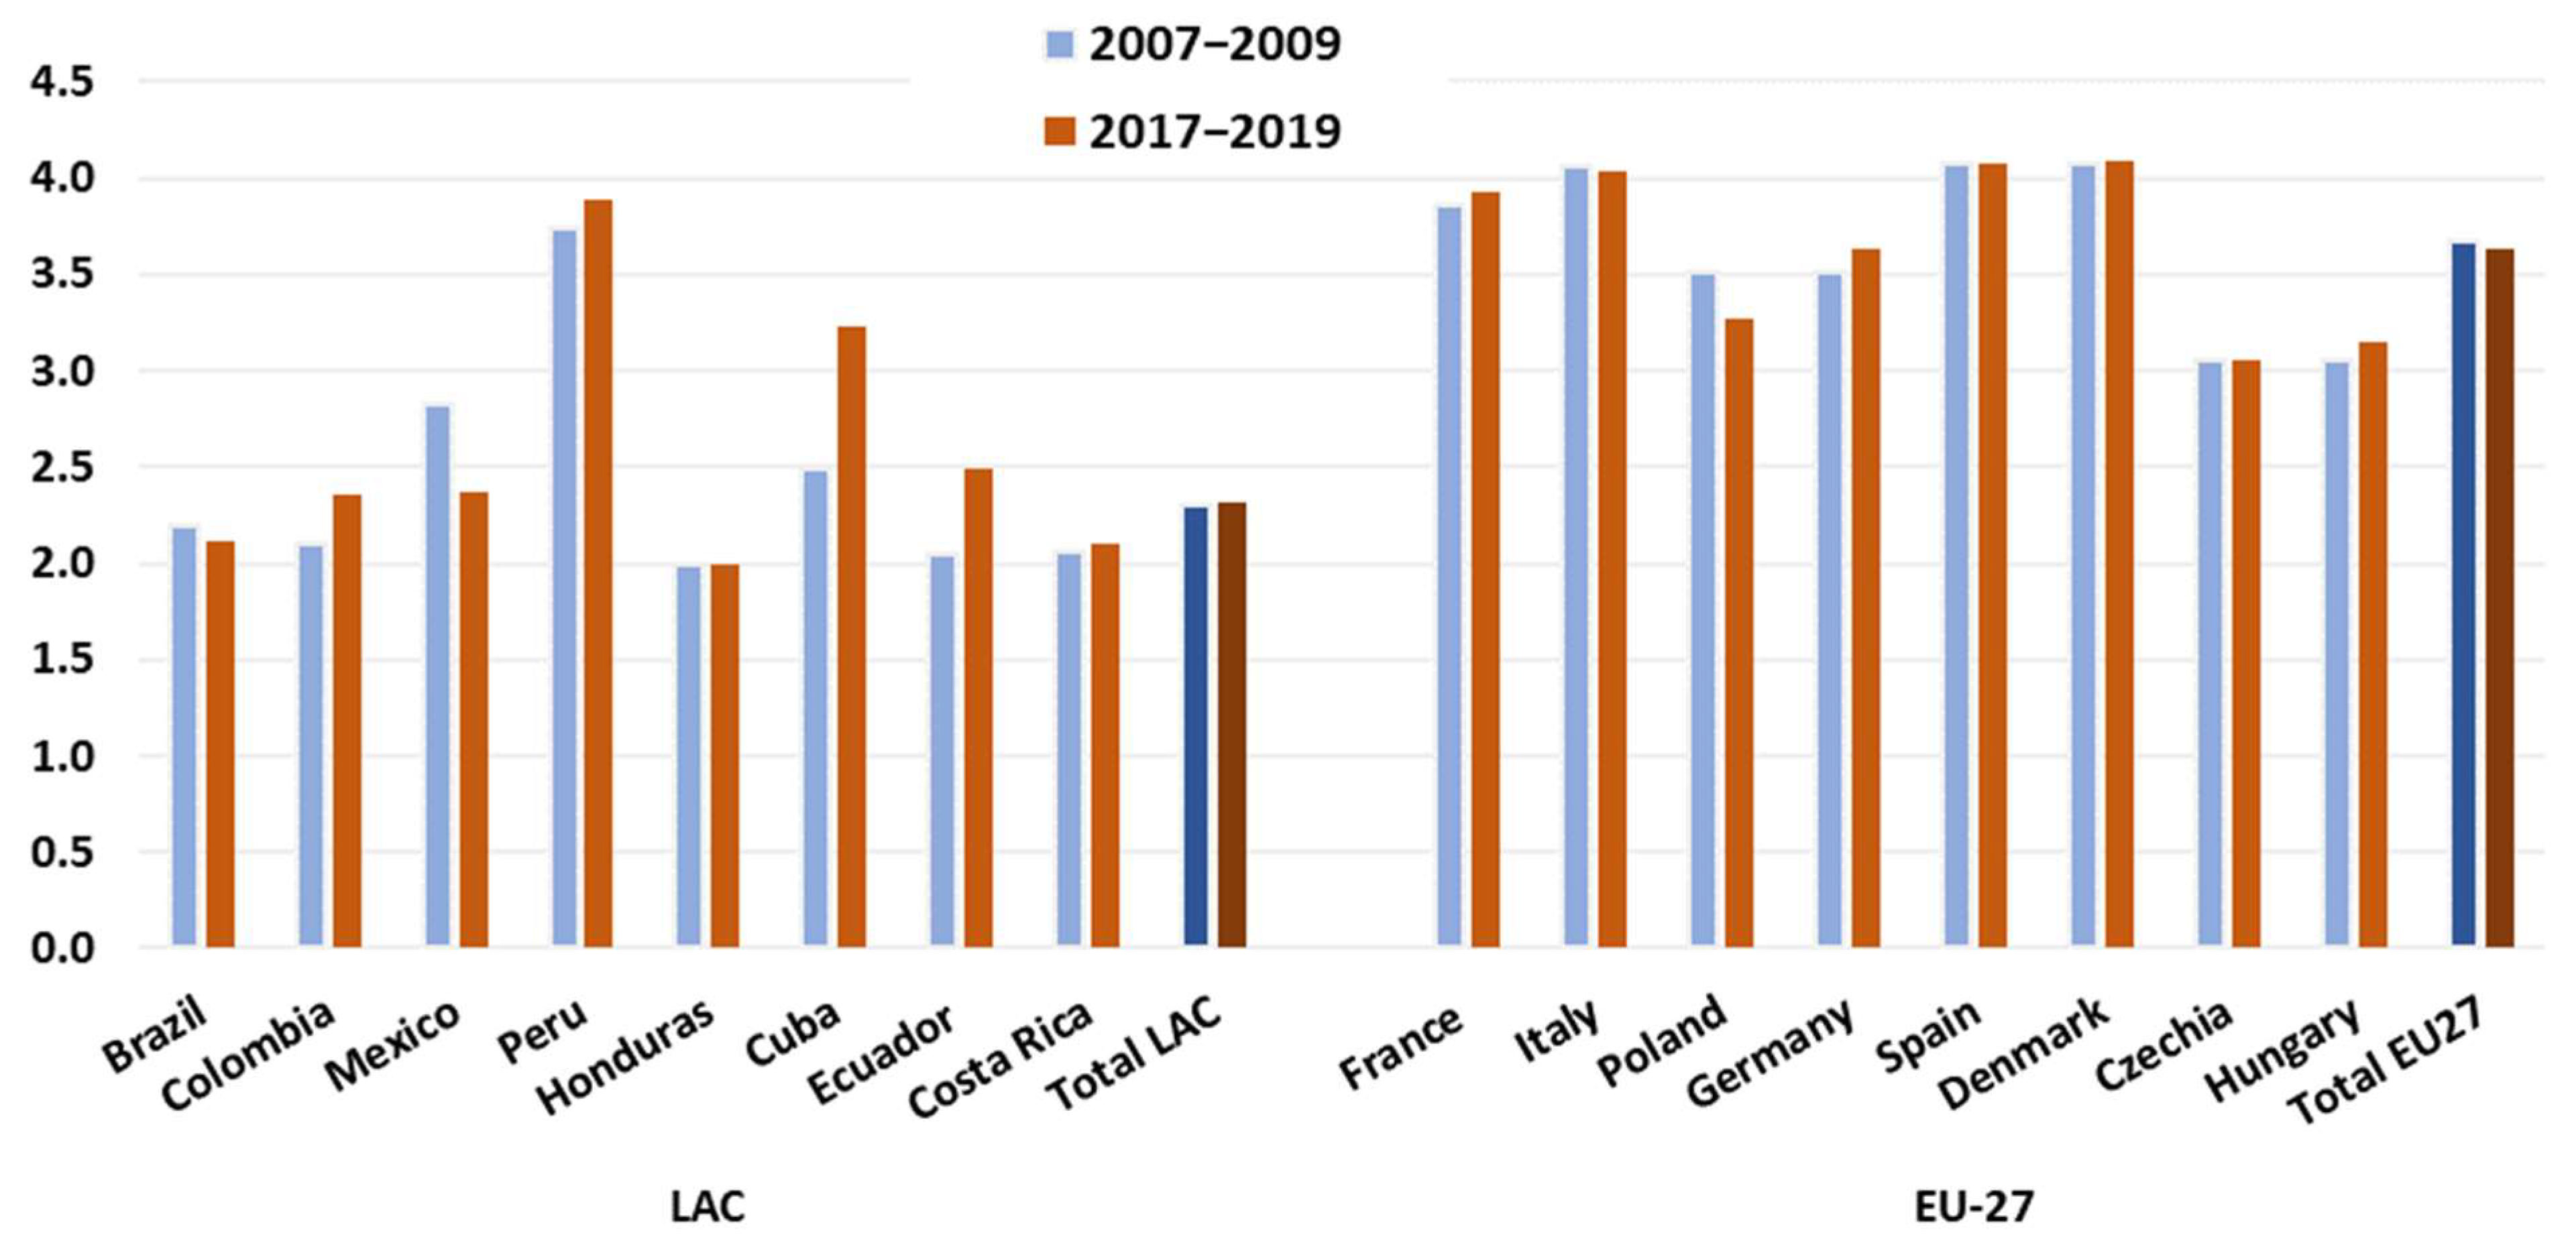
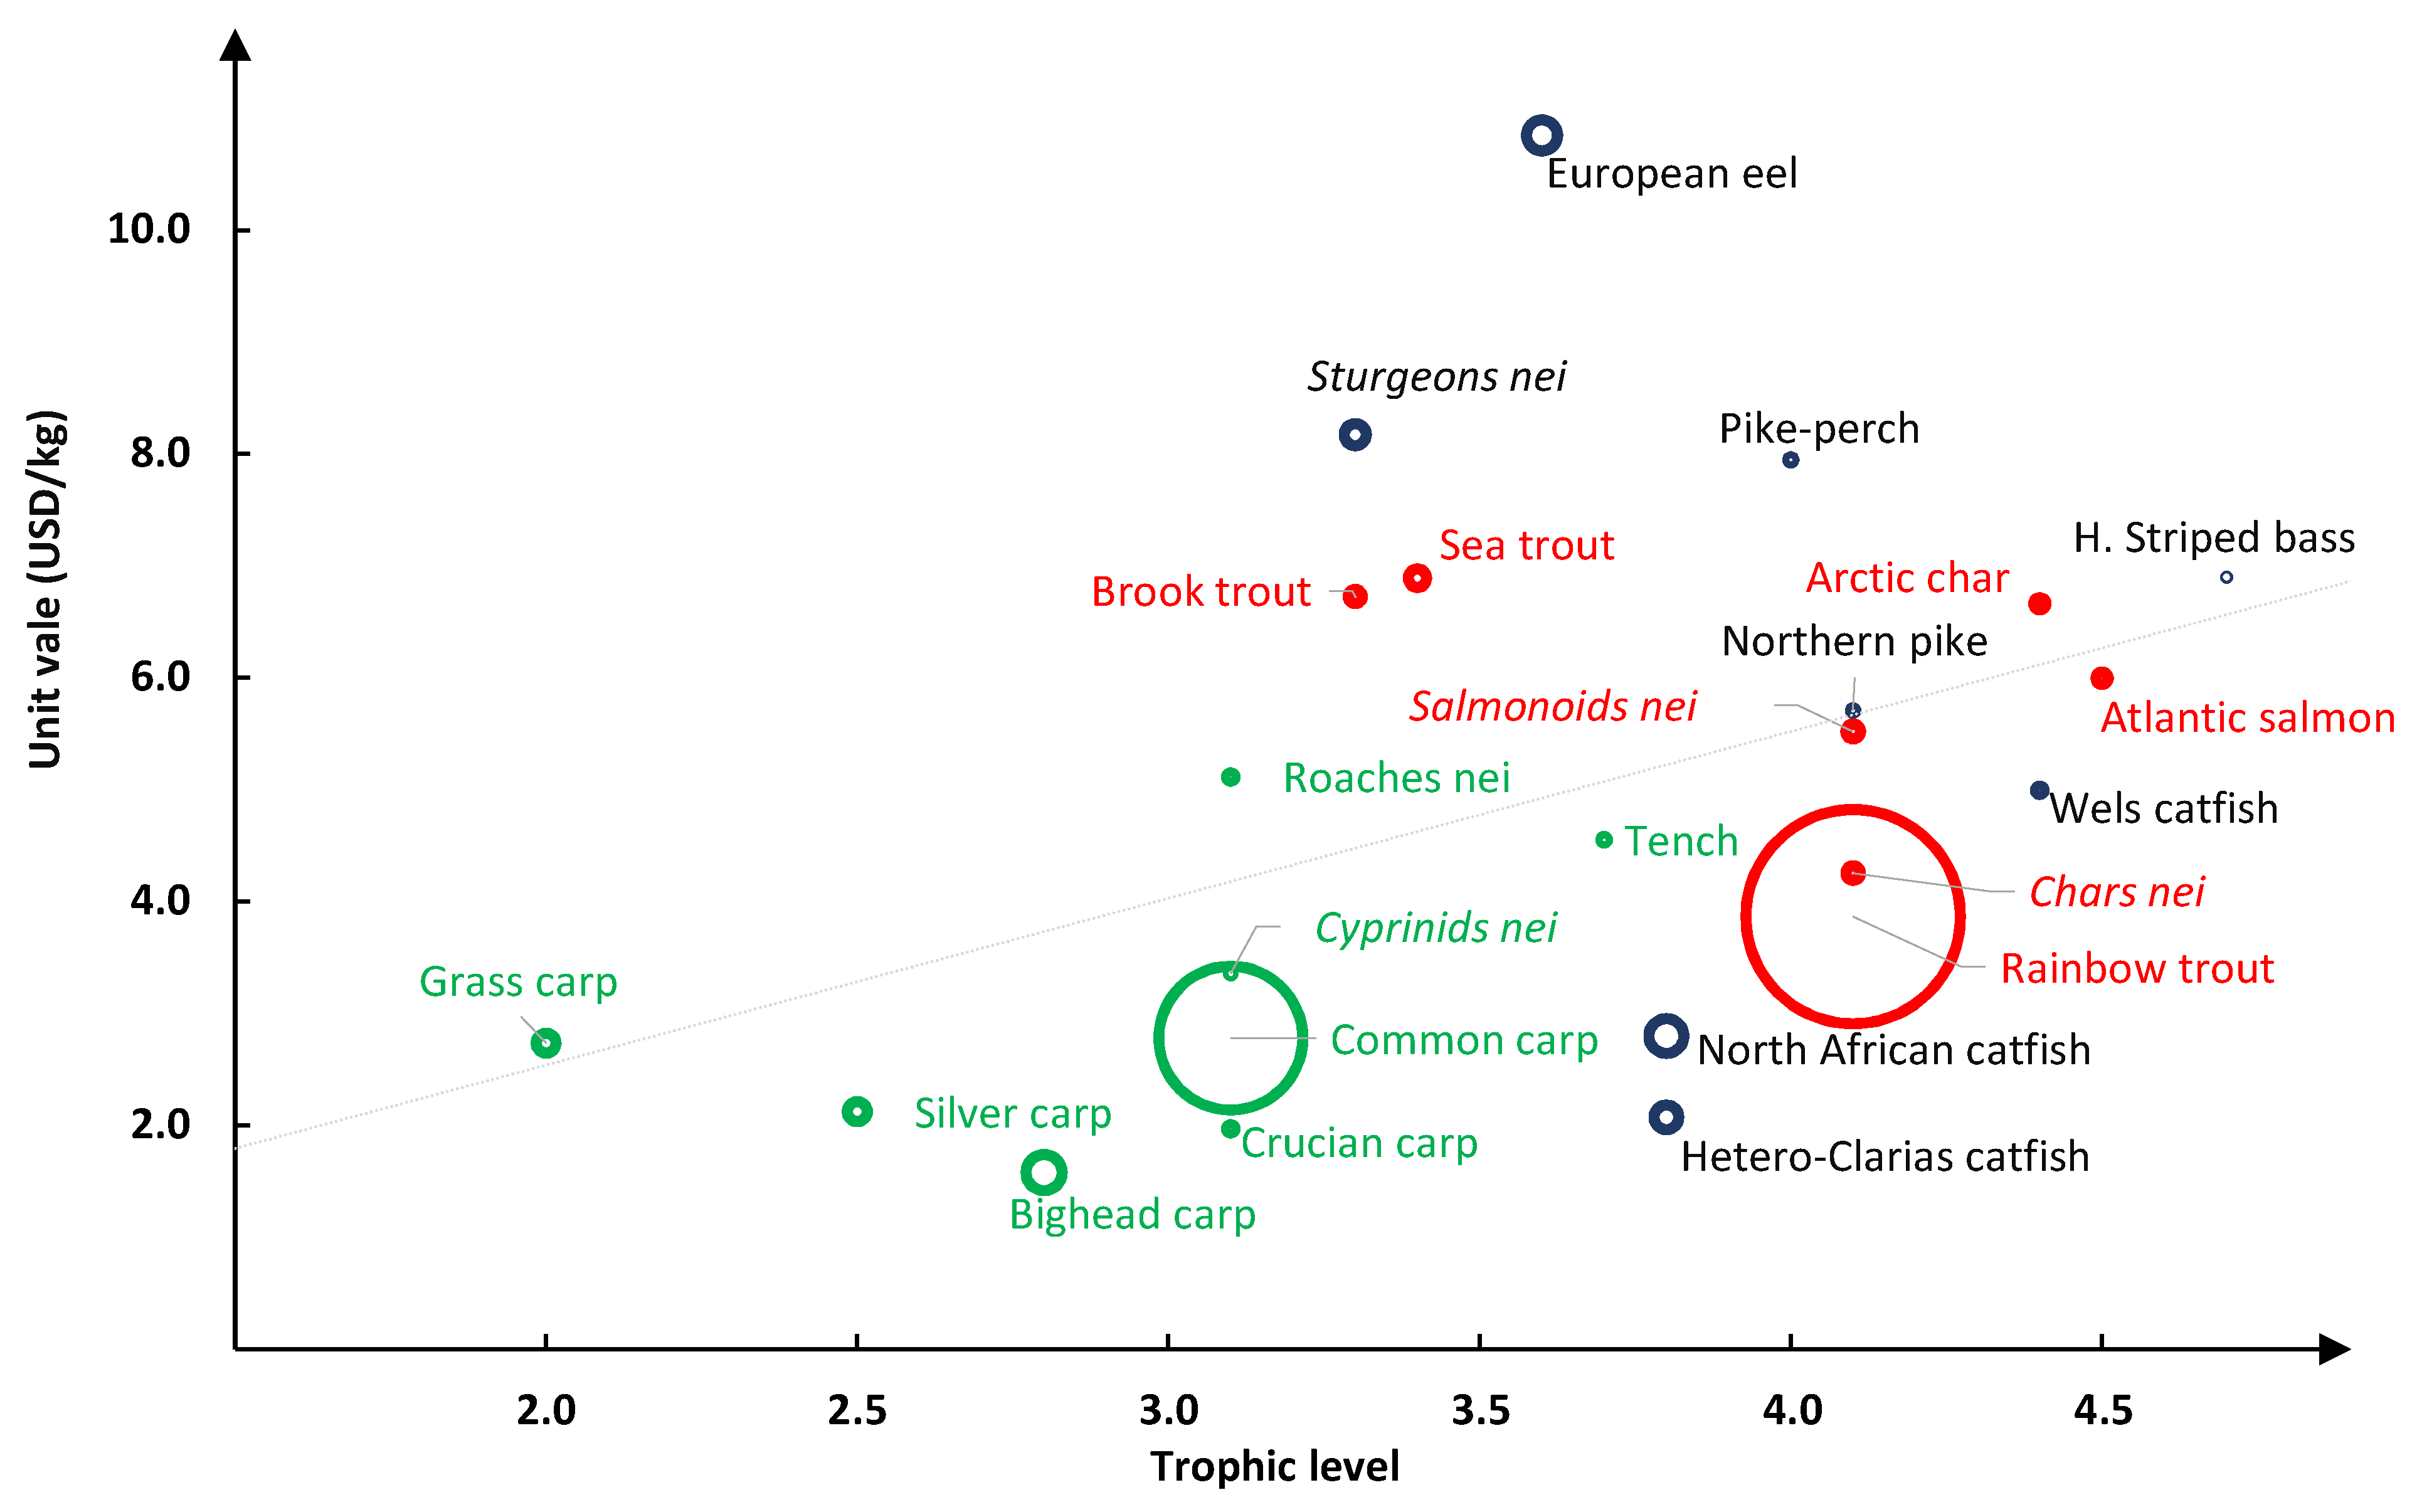
3.3. Trophic Level and Unit Value of Species Produced

At a global level, capture fisheries supply markets with carnivorous species, whereas aquaculture focuses on species that are lower in the food chain, and carnivorous species make up less than 10% of farmed output [17]. In line with global trends, the majority of species farmed in freshwater aquaculture in LAC are omnivorous and herbivorous fish, and carnivorous species (TL > 3.5) account for less than 12% of total production. Unlike global and Latin American aquaculture, EU-27 fish farming is focused on carnivorous fish, which contribute to 66% of production, while herbivorous and omnivorous species at TL < 3.5 account for only 34% of the production.
At a global level, carnivorous species are traded with higher value and have larger production costs due to protein-rich feeds applied in farming [17]. For the LAC and EU, Figure 4 and Figure 5 match the trophic level (TL) against the unit value of cultured species (including interspecific hybrids). Unlike general patterns in global markets of cultured species, in Latin America there is no (statistically) significant correlation between trophic level and market value; most of the carnivorous species are traded with values (<3 USD/kg) similar to those at lower trophic levels, with the exception of rainbow trout and arapaima that command a higher price on the markets. On the other hand, blue tilapia has a relatively high market value in spite of its herbivorous nature.
Unit values of fish in the EU are found in a wider range, from 1.6 (bighead carp) to 10.9 (eel) USD/kg, with a positive gradient along the trophic chain. There is a statistically significant correlation (r = 0.48, p = 0.02) between TL and the unit value of species, implying that European consumers have a willingness to pay higher prices for carnivorous species.
Diverting culture practices toward low trophic level species is identified as a strategy for sustainable aquaculture, to reduce nutrient loading and the demand for high-protein terrestrial or marine feed sources [18]. Each level up the trophic chain decreases the efficiency of utilizing energy produced by photosynthetic organisms. For this reason, metrics calculated with the trophic level are often used as indicators for sustainability [19,20]. Though the original meaning of TL has been blurred recently with the increasing share of vegetable-based ingredients in diets of farmed carnivorous species [21], the protein content (either it is sourced from vegetable or animal ingredients) and cost of aquafeed recipes are still higher for carnivorous species than for herbivores. Therefore, we continue to consider TL as a proxy indicator of the level of requirement for costly nutrients during the culture of fish species. Figure A1 illustrates the change in mean trophic level of freshwater aquaculture production (both at the region-level and country-level) between 2007–2009 and 2017–2019. In Latin America, there was only a slight increase in the mean trophic level of the regional aquaculture, from 2.30 to 2.32, which indicates the unchanged dominance of herbivore and omnivore species. On the contrary, the mean trophic level of EU aquaculture is relatively high (3.64 calculated for 2017–2019), but slightly decreasing with a rising share of carp in total production.

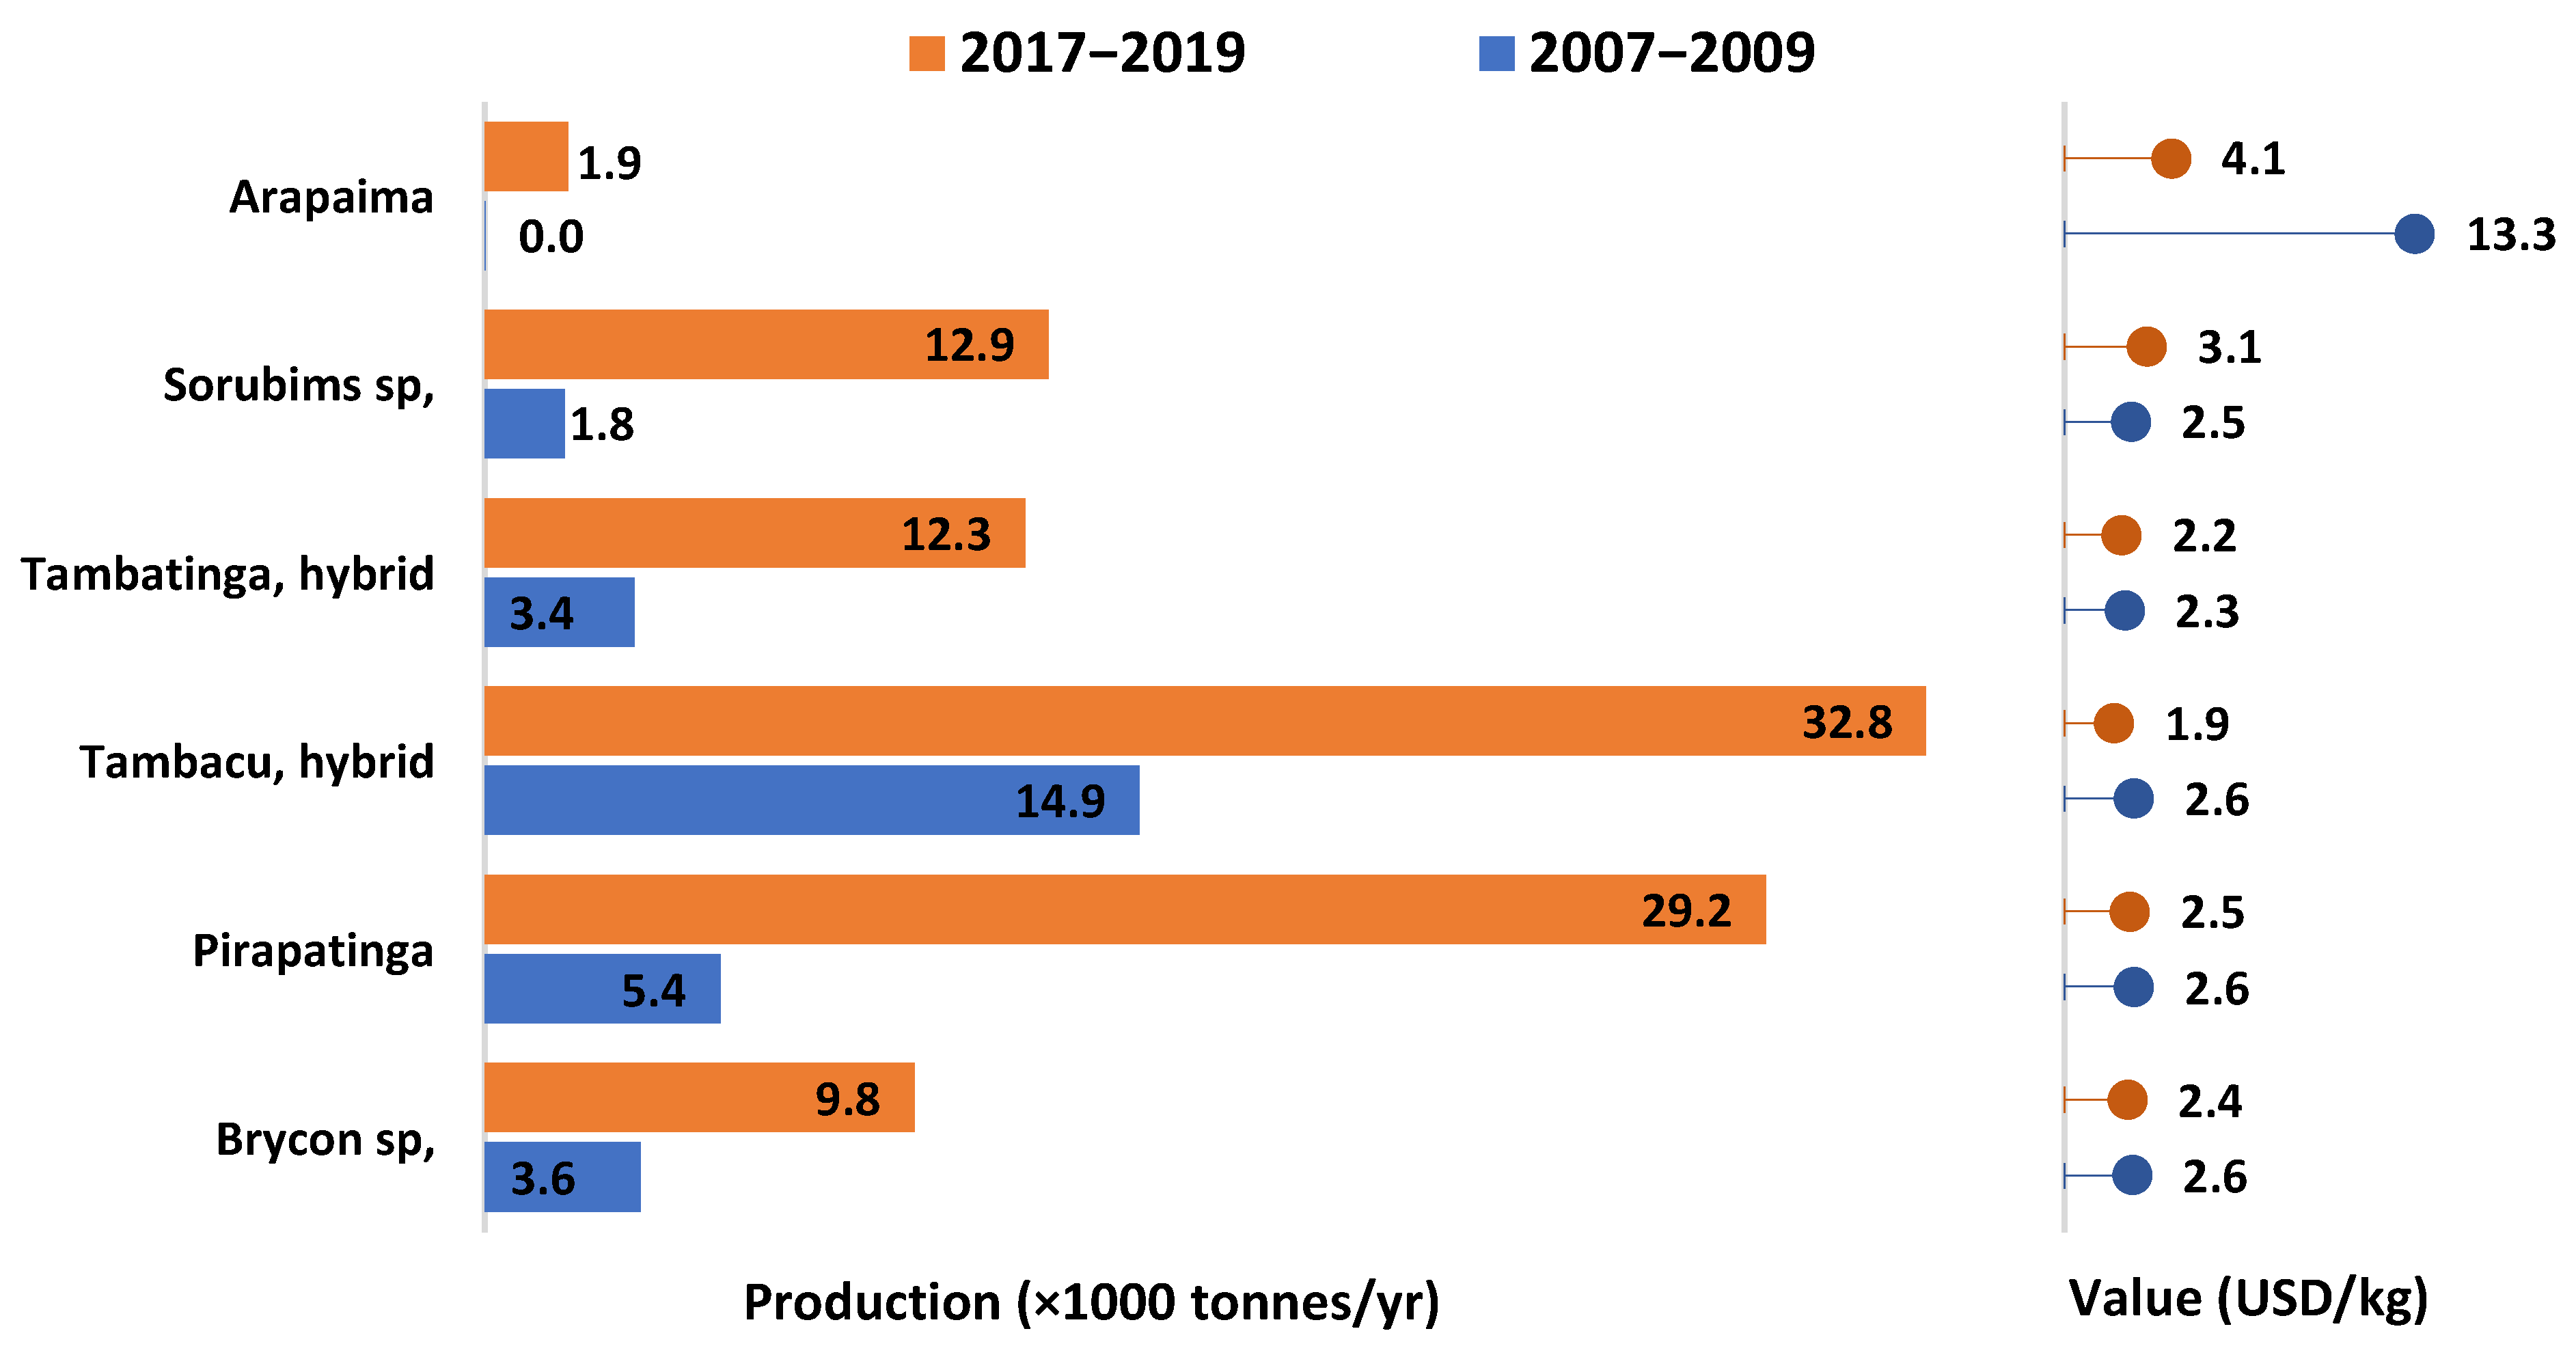
3.4. Diversification and Emerging Species

Species diversification increases the resilience of industry by reducing its vulnerability to market shocks and species-specific disease outbreaks [22,23,24]. To analyze the diversity of the aquaculture sector, we used metrics reflecting the degree to which fish production is evenly distributed among more species. Figure A2 presents the calculated diversification index (DIV) and its change between 2007–2009 and 2017–2019, for the two regions considered. Higher values indicate higher diversity. The DIV calculated for the Latin American freshwater aquaculture was reduced from 0.68 to 0.59 in the last decade, which suggests that concentration of the industry has taken place, and the sector became less diversified at the regional level. The reduction in the DIV is mainly attributed to the increasing dominance of Nile tilapia in Latin American aquaculture (Table A1). In Brazil, Mexico, and Peru the diversification of fish production was reduced significantly, corresponding to a development pattern where an already dominant species becomes even more dominant in production (tilapia for Mexico and Brazil, trout for Peru). This reflects that the aquaculture industry sees the opportunity in concentrating efforts, investments, and infrastructure on the production of these species. However, rainbow trout and tilapia are non-native species, and most recent aquaculture plans (Peru, Colombia, Brazil) identify the culture of native species as a priority and promote this as a path to sustainability [I]. Figure 6 provides an overview of the aquaculture development of native emerging species.
In contrast with the Latin American freshwater aquaculture, the species diversity slightly increased in the EU-27 in the last years from 0.54 to 0.56. This is mainly attributed to the shrinking contribution of trout to total production, but the increasing output of emerging species (Figure 6) also contributes to increased diversity in European aquaculture. Most of these novel species are carnivorous species with high but falling market value. African catfish (and its hybrid, the Hetero-clarias catfish) is exceptional in that it is marketed at low prices. Being an air-breathing organism and its wide tolerance for water quality, the African catfish is cultured in high densities [25] with low per-unit fixed costs, allowing farmers to position it as a low-value species. Thanks to its low price, it has a stable domestic market, and its calculated market value increased over the last decade. However, being a non-native invasive species, there are ecological concerns over escapees from culture units [26]. EU countries are important contributors to global sturgeon meat and caviar output, originating from aquaculture, but in recent years demand for these products was lower than the offer [27]. This is reflected in the decreasing unit prices (Figure 7), which has a negative impact on the growth prospects of this industry. Production of perciform species (pikeperch, perch, and hybrid striped bass) increased double-fold over the period investigated. Pikeperch is the most important native percid fish in Europe, with a very solid market price. Yet, various technological problems hamper the growth of pikeperch farming, such as unpredictability in reproductive performance and juvenile production [28]. Char farming is also an important emerging segment in EU aquaculture, especially in the Northern states, with the potential to diversify salmonid production [29]. Land-based Atlantic salmon farming is in its infancy, production is being upscaled in large RAS systems. Total RAS production of Atlantic salmon is larger than what is indicated in Figure 7, since there are land-based systems that produce salmon in salt water, and their production is reported under marine aquaculture production [29].
European aquaculture producers face import competition mainly from mid-value salmon and low-value pangasius originating from countries (Norway and Vietnam, respectively) where climatic and geographic conditions are ideal for these species, and the EU market penetration of these species is supported by a well-developed value chain. Conventional species (trout, carp) farmed in the EU do not have the perspective to increase domestic market share, therefore, European fish farmers try to find breakthrough points by diversifying production with species that are destined for supplying niche markets where international competition is lower.

4. Water Use and Resources in LAC and EU Aquaculture

4.1. Water Resource Intensity of LAC and EU Aquaculture Production

The intensity of resource use varies widely between culture systems. Therefore, first, we review major types of rearing systems used in aquaculture in LAC and EU before discussing the relationship between growth and freshwater resources. Although statistical reports do not break down production data by different farming systems for the Latin American region, based on literature sources it is obvious that earthen pond culture is dominant, especially in tilapia and characid sectors [2,16,30,31]. Pond farming technologies vary from low to high intensity, which differs in stocking densities, nutrient input, water quality, flow management, etc. A smaller part of the production takes place in static-water ponds under extensive (non-fed) conditions, where supplementary water is only withdrawn to replace what is lost through evaporation [16]. The largest portion of the output is farmed under semi-intensive conditions in fed and fertilized earthen ponds, where water management is either similar to that of extensive systems [31] or a moderate flow rate is provided [30]. Intensive technologies in earthen ponds are operated with high flow rates (proportional to biomass density) to provide constant water refreshment [30]. In addition to pond farming, the use of reservoirs for aquaculture is also common in LAC, either as a place for extensive management or intensive culture in floating cages [32,33,34]. Although recirculating aquaculture systems (RAS) are more and more widely used in culture of marine species using saltwater, they do not represent a significant share in Latin American freshwater aquaculture [16].
The main factors affecting specific (per kg) direct water use in production systems are yields (kg produced per m3 or ha) and flow regime (frequency of water intake, intensity of water exchange). Feed-associated (indirect) water use is also significant in fed-systems, in the range of 1–2.5 m3/kg production [35,36] System-associated water use takes place on the production site, but, by contrast, feed-associated water consumption is often incorporated into imported crop ingredients (e.g., soybean), with implications on water resources found in regions/countries far away from the fish production site. Therefore, with the consequent aim of investigating how the development of the aquaculture sector in LAC and the EU depends on the spatial availability of water resources, we focus on the system-associated water requirements of different systems below.
At a global level, RAS and cage systems are considered to use blue water resources most efficiently, with a minimal (<0.5 m3/kg) water footprint [37,38,39]. However, accounting freshwater use to cage culture when multiple uses occur in water bodies is not consistent [14]. On the other end, flow-through systems are considered to be the least efficient systems in terms of using blue waters, usually with a footprint >50 m3/kg [38,39,40]. Pond systems, which are the dominant environment for freshwater fish production both globally and in LAC, are in between RAS/cage and flow-through systems in terms of water use, with footprint values between 3 and 40 m3/kg, depending on yields, evaporation and seepage conditions at the production site, and water refreshment regime applied [37]. Generally, it is considered that specific water use has an asymptotic relationship with aquaculture production intensity, since more intensive production systems were found to use water resources more efficiently (per kg of fish produced) than extensive production systems [35,37,39,41,42]. Results of studies assessing water use in LAC and EU are summarized in Table 1.
Calculated per kg water demands of species farmed in Latin American systems (Table 1) fall in line with finding for other regions of the world discussed above. Although results are not supposed to be directly compared since different studies use different methodologies with different system boundaries, it is important to note that a recent study found that intensive tilapia culture was associated with a higher blue water footprint than extensive farming due to high flow rates of refreshing water in the former technology [30]. This is contradictory to common findings for other regions, as discussed above, and it may challenge the view that intensification in LAC comes with water resource efficiency.
For EU-27, the statistical office of the European Union reports aquaculture production data by production method (farming system) [45]. Based on data available it is estimated that 48% of freshwater production originates from flow-through pond/tank/raceway systems, 38% is produced in static-water earthen ponds, while RAS systems and cage/pen aquaculture account for 10% and 4% of production, respectively. Under flow-through conditions mainly trout [46], and to a lesser extent, African catfish, are cultured. Coldwater trout are often reared in surface water diverted from smaller water courses, while warm-water catfish are farmed in subterranean geothermal water. In the pond farming segment, typically a semi-intensive carp-dominant polyculture is practiced with low (<1 t/ha) yields [47,48,49]. Contrary to Latin America, European RAS systems are constructed primarily to farm freshwater species, mainly trout, catfishes, and sturgeons [50]. There are farms also that rear Atlantic salmon and eel in a freshwater RAS environment [29]. Unlike many regions of the world, where cage farming is an important segment of both freshwater and marine aquaculture, in the EU cage systems are not typical in freshwater environments [51], only some facilities exist to farm carp and sturgeon in reservoirs and on cooling water of thermal power plants. To minimize the discharge of trout farms and comply with strict environmental regulations, partial recirculation of water was a tendency in Denmark, one of the largest producers in the EU. The main advantage of these systems is reduced nutrient emission, but there are some disadvantages that limit the development of RAS culture, such as high capital cost and worse energy efficiency due to automation [29,50,52,53].
The water demand of the flow-through trout farming segment is high (50–100 m3/kg), and this can be reduced by up to two orders of magnitude (to 0.1–2 m3/kg) if systems are converted to RAS [36,38,54]. Carp produced in semi-intensive pond production in an Eastern European climate have a water demand of around 20 m3/kg ([55] and calculations in Table 1).

4.2. Role of Water Resources in Aquaculture Development

In the previous section, it was highlighted that aquaculture production growth requires some 5–50 m3 of water per kg of additional capacity, depending on the species and production system. Tilapia and carp aquacultures in most typical semi-intensive systems demand 10–30 m3/kg, while trout produced in conventional flow-through require more than 50 m3/kg. Here, we match between-region and between-country differences in growth rates with differences in freshwater resource endowments. In our study, we examined two regions: LAC, which are abundant in water resources with a TRWR value of 21,476 m3/capita/year, and the EU-27, which have a TRWR less by an order of magnitude (3041 m3/capita/year). Growth in annual freshwater aquaculture production over the last ten years was −0.01 kg/cap (the EU) and 0.70 kg/cap (LAC).
Figure 8 plots the per-capita availability of annually renewed freshwater resources against per-capita growth in the aquaculture sector in the last decade for the top 12 producing countries in each region. Per-capita growth if aquaculture was calculated as the difference between per-capita production in 2017–2019 and in 2007–2009. Therefore, countries with increasing populations and slightly increasing production may have negative values for per-capita change in fish production (e.g., Denmark). The calculated Pearson-r correlation between the two variables is 0.53 (p = 0.08) for Latin American countries, while for European countries it is 0.75 (p < 0.01) if outlier data for Bulgaria was excluded. These values suggest a positive relationship between per capita freshwater aquaculture development and per capita freshwater availability. In Latin America, Peru, Colombia, and Brazil are the most water-abundant countries, and these countries are ranked 2nd, 1st, and 4th in terms of per capita aquaculture growth, respectively. On the other hand, Cuba is characterized by the lowest water resource availability in LAC, and this corresponds to the biggest reduction in aquaculture production.
Among the major freshwater fish producer countries in the EU, Sweden, Hungary, and Romania have the largest volume of water resources, corresponding to positive growth rates of aquaculture on a per-capita basis in these countries. Sweden has the highest water abundance among the major producers in the EU and this enables the high growth rate of trout production in flow-through systems, which have the highest water demand among European systems. Recirculation aquaculture is relatively undeveloped in Sweden [HH]. Among countries that have a TRWR value of less than 4000 m3/capita/year, it can be seen that countries where carp-based pond aquaculture is dominant (Czechia, Poland, Bulgaria) increased their production, while per-capita aquaculture output fell in countries, where aquaculture sector is based on flow-through through systems (France, Germany, Italy, and Spain). Considering that flow-through systems (with a footprint of >50 m3/kg) are more sensitive to water stress than carp-based pond farming (~20 m3/kg), aquaculture development patterns can be partly explained by the difference in the degree of vulnerability of different systems to temporal water shortages, which are more frequent with climate change [25,56,57,58,59].
In water-poor regions, one strategy to maximize production value per m3 of water used is to farm high-value species in recirculation aquaculture systems (RAS), which minimize water footprint. RAS aquaculture (farming sturgeons, eel, catfish, trout) has developed rapidly, especially in the European countries where per capita water renewable resources are below 4000 m3. Denmark, France, Germany, Poland, and Spain altogether account for 75% of RAS production in the EU [50].
In addition to freshwater resource availability, the potential growth of freshwater aquaculture is also determined by climatic conditions since water temperature in most culture systems is under the control of the climate. The species for culture must be selected so that the range in temperature preference and tolerance of the species chosen is in harmony with the local climate [60]. Figure 9 provides an overview of the climatic conditions of the top 10 producers in both regions matched with the thermal preferences of the main target species. Although the graph represents data for air temperatures, it is often assumed that there is a linear relationship between air and water temperatures [57,61].
Most of the Latin American countries have a tropical climate with little variation in monthly temperatures, which favors aquaculture production by enabling them to plan production cycles without seasonality. Even in sub-tropical countries (Mexico), the range is narrower than in European countries, and warm-water species can be fattened in the colder season. Cold-water trout farmers at higher altitudes can also benefit from near-to-constant temperatures, as is shown in rainbow trout aquaculture development in Peru, the country with the coldest annual mean temperature among the major producer countries of the region.
Most of the EU territories are under a temperate climate, with large variations in monthly temperatures, therefore there is a strong seasonality in fish production cycles in open systems. The graphical tool helps the understanding of the difference in growth between trout and carp production over the last decade. Carp is a robust species with wide temperature tolerance and low biological sensitivity to environmental changes [63]. Temperature increase, which is an ongoing tendency, is forecasted to favor the metabolic activity and growth rate of carp under Eastern European conditions, since prevalent temperatures are far away from its upper limit of thermal preference [57,61]. On the one hand, trout is a species with a relatively low upper thermal limit, and consequently, warming may significantly enhance trout mortality and affect productivity, especially in Mediterranean countries [58]. In light of this, climate change contributes to the explanation of the difference in aquaculture production changes between Mediterranean and Northern European trout farming countries.

5. Emission of Aquaculture Production

Aquaculture generates emissions either to the air or to the aquatic space. The most pronounced environmental concerns are over (i) the release of nitrogenous or phosphorus, which may stimulate eutrophication processes in the receiving water body, and (ii) greenhouse gas (GHG) emission [64]. Unlike water footprint, which is mainly generated during on-farm activities, the majority of aquaculture-related GHGs are emitted during feed production, thus carbon footprint is largely determined by the feed conversion rates and the ingredients used in aquafeeds [65,66]. This implies that the nutritional habit of the cultured species and the regional availability of ingredients matching these nutritional requirements have a major influence on climate change mitigation. A recent study using relatively narrow system boundaries and standardized methodology across different systems and species found that tilapia farming in LAC has a significantly lower carbon footprint (2 kgCO2eq/kg fish, in live weight) than the global average tilapia production (3.7 kgCO2eq/kg fish), and this emission efficiency is mainly attributed to regional feeds with lower footprints and lower use of fossil energy during on-farm processes [66]. In the same study, the GHG emission of European carp production is calculated to be lower (1.6 kgCO2eq/kg fish) than the global average carp carbon footprint (3.2 kgCO2eq/kg fish). However, if the system boundaries of the analysis are expanded, the carbon footprint of carp production is found to be significantly higher (6 kgCO2eq/kg fish), as infrastructure maintenance (pond dredging) and post-harvest operations (packaging and transport) are responsible for a large amount of greenhouse gas emission [67]. While most systematic review studies conclude that per-unit GHG emissions of tilapia and carp production are in a similar range, there is disagreement on whether the carbon footprint of salmonids (including trout) is higher or lower than that of carp and tilapia [65,66,68]. Similarly, there is a lack of consensus in answering the question of whether RAS produced trout have a higher carbon footprint than one from a flow-through system, as the GHG emission during RAS production is largely dependent on the source (renewable or fossil) of the electricity used for operating the system [69]. Nevertheless, on-farm energy use in RAS technology is higher than in other systems, but in the post-harvest stage the fuel demand is often lower with shorter transportation routes because RAS facilities are built in the proximity of markets [70].
Nutrient emissions of aquaculture segments are determined by the utilization (retention) efficiency of input nutrients in farmed organisms, and treatment/recovery of the non-utilized part of nutrients. While the former factor is more species-specific, the latter one is system-specific. In flow-through and cage systems the non-retained part of nutrients is generally discharged with water exchange [53,71]. In RAS systems effluents are treated and solid wastes are collected [72], while in static-water pond culture part of the non-retained nutrient input is recycled through the food web and recovered in the plankton biomass [57]. For this reason, feed nitrogen and phosphorous conversion efficiency are relatively high (>40%) in European and Latin American pond cultures [47,73,74]. If the total (feed and fertilizer) nutrient inputs are considered, then pond farming has low conversion efficiency (<20%) in comparison to other systems, because nutrients present in fertilizers are not directly utilized by target fish species and transition losses arise with nutrients transferred through three levels of the trophic web (fertilizer-phytoplankton-zooplankton-tilapia/carp) [57,75]. However, we argue that the nutrient efficiency of fertilized systems cannot be directly compared with fed systems, as for the latter one fertilizer input during the production of crops used as aquafeed ingredients should also be accounted for.

6. Conclusions and Perspectives

There are several factors that play a significant role in aquaculture development, including market demand, environmental concerns, licensing regulations, and institutional capacity [76]. This study was not written with the objective to discuss socio-economic influences that may limit the exploitation of resources, rather it concentrated on production trends and underlying factors endowments as available from aggregate statistics. We investigated the climate and availability of freshwater resources, which are crucial factors in aquaculture development [77], and shed light on their influence on the growth prospects of the aquaculture sector. The LAC, accounting for one-third of the world’s total runoff [78], is well-endowed with currently underutilized renewable water resources [10] and still has a huge scope for expansion. In the European context, it is often cited that bureaucracy and restricting environmental regulations are barriers to growth [73,79], but it needs to be further understood whether regions poor in natural resources tend to have more strict environmental rules to ensure the conservation of biodiversity and ecosystem functioning and whether socio-economic and institutional influences are themselves consequences of resource scarcity. In fact, many of the European producers see the future potential of the industry rely on subsidies, rather than expansion of physical output [80,81].

Author Contributions

G.G.: Conceptualization; methodology, validation; formal analysis, investigation; writing—review and editing, visualization, supervision; J.P.C.T.: Conceptualization, Data curation, formal analysis, investigation, writing—original draft preparation; E.B.: Conceptualization; writing—review and editing. All authors have read and agreed to the published version of the manuscript.

Funding

This research received no external funding.

Institutional Review Board Statement

Not applicable.

Informed Consent Statement

Not applicable.

Data Availability Statement

The data that support the findings of this study are available from the corresponding author upon request.

Conflicts of Interest

The authors declare no conflict of interest. The funders had no role in the design of the study; in the collection, analyses, or interpretation of data; in the writing of the manuscript, or in the decision to publish the results.

Appendix A

Table A1. Aquaculture production of top 25 species in LAC and EU-27. Items in red are not species, but larger aggregates as per given by Aquatic Sciences and Fisheries Information System (ASFIS). Source: [1].
LAC Production (t/year)EU 27 Production (t/year)
ASFIS Species2007–20092017–2019ASFIS Species2007–20092017–2019
1Nile tilapia
(Oreochromis niloticus)
200,785416,322Rainbow trout
(Oncorhynchus mykiss)
167,173151,721
2Tilapias nei
(Oreochromis spp.)
40,740125,177Common carp
(Cyprinus carpio)
70,44873,355
3Cachama
(Colossoma macropomum)
49,361107,513Bighead carp
(Hypophthalmichthys nobilis)
36176255
4Rainbow trout
(Oncorhynchus mykiss)
31,02195,987North African catfish
(Clarias gariepinus)
52965966
5Pirapatinga
(Piaractus brachypomus)
538129,174Freshwater fishes nei
(Actinopterygii)
55875620
6Tambacu, hybrid
(P. mesopotamicus x C. macropomum)
14,93532,844European eel
(Anguilla Anguilla)
62805139
7Cyprinids nei
(Cyprinidae)
21,49018,348Hetero-Clarias catfish, hybrid
(H.longifilis x C.gariepinus)
18223372
8Pacu
(Piaractus mesopotamicus)
15,92116,283Sturgeons nei
(Acipenseridae)
13453008
9Silver carp
(Hypophthalmichthys molitrix)
19,18913,447Silver carp
(Hypophthalmichthys molitrix)
49173086
10Tambatinga, hybrid
(C. macropomum x P. brachypomus)
342211,894Grass carp
(Ctenopharyngodon idellus)
16962479
11Sorubims nei
(Pseudoplatystoma spp.)
012,404Sea trout
(Salmo trutta)
28602720
12Common carp
(Cyprinus carpio)
19,2756145Salmonoids nei
(Salmonidae)
2631628
13North African catfish
(Clarias gariepinus)
38386042Chars nei
(Salvelinus spp)
4921913
14Brycon amazonicus04346Brook trout
(Salvelinus fontinalis)
6931596
15Brycon spp04772Atlantic salmon
(Salmo salar)
261100
16Freshwater fishes nei
(Actinopterygii)
15,8263472Arctic char
(Salvelinus alpinus)
4041549
17Dorada
(Brycon moorei)
01346Crucian carp
(Carassius carassius)
33337
18Streaked prochilod
(Prochilodus lineatus)
03167Roaches nei
(Rutilus spp)
13710
19Leporinus spp03739Wels(=Som) catfish
(Silurus glanis)
13691051
20Magdalena River prochil
(Prochilodus magdalenae)
01634Silver, bighead carps nei
(Hypophthalmichthys spp)
0771
21Arapaima
(Arapaima gigas)
81898Tench
(Tinca tinca)
1299985
22Blue tilapia
(Oreochromis aureus)
25831862Pike-perch
(Sander lucioperca)
327780
23Brycon melanopterus0516Northern pike
(Esox Lucius)
286585
24Catfishes nei
(Ictalurus spp.)
01347Cyprinids nei
(Cyprinidae)
1245591
25Trahira
(Hoplias malabaricus)
186746Striped bass, hybrid
(Morone chrysops x M.saxatilis)
197344
Figure A1. Average trophic level of freshwater aquaculture production at the region-level and country-level (calculated for 8–8 largest producers) in 2007–2009 and 2017–2019. Data sources: [1,8].
Sustainability 14 06443 g0a1
Figure A2. Calculated diversification index (DIV, between 0 and 1) in freshwater aquaculture production at the region-level and country-level in 2007–2009 and 2017–2019. Note that DIV is 0 for Honduras because one family accounts for 100% of production. Data source: [1].
Sustainability 14 06443 g0a2

References

  1. FAO. FishStatJ—Software for Fishery and Aquaculture Statistical Time Series; FAO Fisheries Division: Rome, Italy, 2021. [Google Scholar]
  2. Valenti, W.C.; Barros, H.P.; Moraes-Valenti, P.; Bueno, G.W.; Cavalli, R.O. Aquaculture in Brazil: Past, Present and Future. Aquac. Rep. 2021, 19, 100611. [Google Scholar] [CrossRef]
  3. EUMOFA. European Market Observatory for Fisheries and Aquaculture Products (EUMOFA); The EU Fish Market: Luxembourg, 2021; Available online: https://www.eumofa.eu/documents/20178/477018/EN_The+EU+fish+market_2021.pdf/27a6d912-a758-6065-c973-c1146ac93d30?t=1636964632989 (accessed on 22 January 2022).
  4. EUMOFA. European Market Observatory for Fisheries and Aquaculture Products (EUMOFA); The EU Fish Market: Luxembourg, 2020. [Google Scholar] [CrossRef]
  5. FAO. The State of World Fisheries and Aquaculture 2020. Sustainability in Action; FAO: Rome, Italy, 2020; Volume 32. [Google Scholar] [CrossRef]
  6. FAO. Globefish Highlights April 2019 ISSUE, with Jan.–Dec. 2018 Statistics—A Quarterly Update on World Seafood Markets, 2nd ed.; FAO: Rome, Italy, 2019. [Google Scholar]
  7. World Bank. World Bank Database. Available online: https://databank.worldbank.org/home.aspx (accessed on 22 January 2022).
  8. Fishbase. Available online: https://www.fishbase.de/ (accessed on 14 January 2022).
  9. FAO. AQUASTAT Database, Global Information System on Water and Agriculture. Available online: https://www.fao.org/aquastat/en/databases/ (accessed on 11 August 2021).
  10. Boyd, C.E.; Li, L.; Brummett, R. Relationship of Freshwater Aquaculture Production to Renewable Freshwater Resources. J. Appl. Aquac. 2012, 24, 99–106. [Google Scholar] [CrossRef]
  11. World Bank. Climate Change Knowledge Portal. Available online: https://climateknowledgeportal.worldbank.org/ (accessed on 24 April 2022).
  12. Longline Environment Ltd. META Database—Maritime and Environmental Thresholds for Aquaculture. 2022. Available online: https://longline.co.uk/meta/ (accessed on 10 May 2022).
  13. Hofherr, J.; Natale, F.; Fiore, G. Indicators for Sustainable Aquaculture in the European Union an Approach towards European Aquaculture Performance Indicators, 1st ed.; Publication office of the European Union: Luxembourg, 2012. [Google Scholar] [CrossRef]
  14. Gephart, J.A.; Troell, M.; Henriksson, P.J.G.; Beveridge, M.C.M.; Verdegem, M.; Metian, M.; Mateos, L.D.; Deutsch, L. The ‘Seafood Gap’ in the Food-Water Nexus Literature—Issues Surrounding Freshwater Use in Seafood Production Chains. Adv. Water Resour. 2017, 110, 505–514. [Google Scholar] [CrossRef]
  15. Peixe, B.R.; Anuario Peixe-BR da Piscicultura. Associacao Brasileira da Piscicultura. Available online: https://www.peixebr.com.br/anuario-peixebr-2018/ (accessed on 21 November 2021).
  16. Wurmann, C.; Soto, D.; Norambuena, R. Regional Review on Status and Trends in Aquaculture Development in Latin America and the Caribbean-2020; Food and Agriculture Organization of the United Nations: Rome, Italy, 2022. [Google Scholar] [CrossRef]
  17. Neori, A.; Nobre, A.M. Relationship between Trophic Level and Economics in Aquaculture. Aquac. Econ. Manag. 2012, 16, 40–67. [Google Scholar] [CrossRef]
  18. Perschbacher, P.W. Sustainability Needs and Challenges: Freshwater Systems. In Tilapia in Intensive Co-Culture; Perschbacher, P.W., Stickney, R.R., Eds.; John Wiley & Sons, Ltd.: Hoboken, NJ, USA, 2017; pp. 114–128. [Google Scholar]
  19. Lucas, S.; Soler, L.G.; Irz, X.; Gascuel, D.; Aubin, J.; Cloâtre, T. The Environmental Impact of the Consumption of Fishery and Aquaculture Products in France. J. Clean. Prod. 2021, 299, 126718. [Google Scholar] [CrossRef]
  20. Tacon, A.G.J.; Metian, M.; Turchini, G.M.; de Silva, S.S. Responsible Aquaculture and Trophic Level Implications to Global Fish Supply. Rev. Fish. Sci. 2010, 18, 94–105. [Google Scholar] [CrossRef] [Green Version]
  21. Cottrell, R.S.; Metian, M.; Froehlich, H.E.; Blanchard, J.L.; Sand Jacobsen, N.; McIntyre, P.B.; Nash, K.L.; Williams, D.R.; Bouwman, L.; Gephart, J.A.; et al. Time to Rethink Trophic Levels in Aquaculture Policy. Rev. Aquac. 2021, 13, 1583–1593. [Google Scholar] [CrossRef]
  22. Valenti, W.C.; Kimpara, J.M.; Preto, B.D.L.; Moraes-Valenti, P. Indicators of Sustainability to Assess Aquaculture Systems. Ecol. Indic. 2018, 88, 402–413. [Google Scholar] [CrossRef] [Green Version]
  23. Boyd, C.E.; D’Abramo, L.R.; Glencross, B.D.; Huyben, D.C.; Juarez, L.M.; Lockwood, G.S.; McNevin, A.A.; Tacon, A.G.J.; Teletchea, F.; Tomasso, J.R.; et al. Achieving Sustainable Aquaculture: Historical and Current Perspectives and Future Needs and Challenges. J. World Aquac. Soc. 2020, 51, 578–633. [Google Scholar] [CrossRef]
  24. Metian, M.; Troell, M.; Christensen, V.; Steenbeek, J.; Pouil, S. Mapping Diversity of Species in Global Aquaculture. Rev. Aquac. 2020, 12, 1090–1100. [Google Scholar] [CrossRef]
  25. Popp, J.; Váradi, L.; Békefi, E.; Péteri, A.; Gyalog, G.; Lakner, Z.; Oláh, J. Evolution of Integrated Open Aquaculture Systems in Hungary: Results from a Case Study. Sustainability 2018, 10, 177. [Google Scholar] [CrossRef] [Green Version]
  26. Piria, M.; Jelkić, D.; Gavrilović, A.; Horváth, Á.; Kovács, B.; Balogh, R.E.; Špelić, I.; Radočaj, T.; Vilizzi, L.; Ozimec, S.; et al. Finding of Hybrid African Catfish “Clariobranchus” in the River Danube. J. Vertebr. Biol. 2022, 71, 22008. [Google Scholar] [CrossRef]
  27. Bronzi, P.; Chebanov, M.; Michaels, J.T.; Wei, Q.; Rosenthal, H.; Gessner, J. Sturgeon Meat and Caviar Production: Global Update 2017. J. Appl. Ichthyol. 2019, 35, 257–266. [Google Scholar] [CrossRef] [Green Version]
  28. Samuel-Fitwi, B.; Nagel, F.; Meyer, S.; Schroeder, J.P.; Schulz, C. Comparative Life Cycle Assessment (LCA) of Raising Rainbow Trout (Oncorhynchus Mykiss) in Different Production Systems. Aquac. Eng. 2013, 54, 85–92. [Google Scholar] [CrossRef]
  29. Vielma, J.; Kankainen, M.; Setälä, J. Current Status of Recirculation Aquaculture Systems (RAS) and Their Profitability and Competitiveness in the Baltic Sea Area; Natural Resources Institute Finland: Helsinki, Finland, 2021. [Google Scholar]
  30. Guzmán-Luna, P.; Gerbens-Leenes, P.W.; Vaca-Jiménez, S.D. The Water, Energy, and Land Footprint of Tilapia Aquaculture in Mexico, a Comparison of the Footprints of Fish and Meat. Resour. Conserv. Recycl. 2021, 165, 105224. [Google Scholar] [CrossRef]
  31. de Godoy, E.M.; David, F.S.; Fialho, N.S.; Proença, D.C.; Camargo, T.R.; Bueno, G.W. Environmental Sustainability of Nile Tilapia Production on Rural Family Farms in the Tropical Atlantic Forest Region. Aquaculture 2022, 547, 737481. [Google Scholar] [CrossRef]
  32. Nobile, A.B.; Cunico, A.M.; Vitule, J.R.S.; Queiroz, J.; Vidotto-Magnoni, A.P.; Garcia, D.A.Z.; Orsi, M.L.; Lima, F.P.; Acosta, A.A.; da Silva, R.J.; et al. Status and Recommendations for Sustainable Freshwater Aquaculture in Brazil. Rev. Aquac. 2020, 12, 1495–1517. [Google Scholar] [CrossRef]
  33. Fialho, N.S.; Valenti, W.C.; David, F.S.; Godoy, E.M.; Proenca, D.C.; Roubach, R.; Bueno, G.W. Environmental Sustainability of Nile Tilapia Net-Cage Culture in a Neotropical Region. Ecol. Indic. 2021, 129, 108008. [Google Scholar] [CrossRef]
  34. Saint-Paul, U. Native Fish Species Boosting Brazilian’s Aquaculture Development. Acta Fish. Aquat. Resour. 2017, 5, 1–9. [Google Scholar] [CrossRef]
  35. Verdegem, M.C.J.; Bosma, R.H. Water Withdrawal for Brackish and Inland Aquaculture, and Options to Produce More Fish in Ponds with Present Water Use. Water Policy 2009, 11, 52–68. [Google Scholar] [CrossRef]
  36. D’orbcastel, E.R.; Blancheton, J.P.; Belaud, A. Water Quality and Rainbow Trout Performance in a Danish Model Farm Recirculating System: Comparison with a Flow through System. Aquac. Eng. 2009, 40, 135–143. [Google Scholar] [CrossRef] [Green Version]
  37. Verdegem, M.C.J.; Bosma, R.H.; Verreth, J.A.J. Reducing Water Use for Animal Production through Aquaculture. Int. J. Water Resour. Dev. 2006, 22, 101–113. [Google Scholar] [CrossRef]
  38. Aubin, J.; Papatryphon, E.; van der Werf, H.M.G.; Petit, J.; Morvan, Y.M. Characterisation of the Environmental Impact of a Turbot (Scophthalmus Maximus) Re-Circulating Production System Using Life Cycle Assessment. Aquaculture 2006, 261, 1259–1268. [Google Scholar] [CrossRef]
  39. Yacout, D.M.M.; Soliman, N.F.; Yacout, M.M. Comparative Life Cycle Assessment (LCA) of Tilapia in Two Production Systems: Semi-Intensive and Intensive. Int. J. Life Cycle Assess. 2016, 21, 806–819. [Google Scholar] [CrossRef]
  40. Ghamkhar, R.; Boxman, S.E.; Main, K.L.; Zhang, Q.; Trotz, M.A.; Hicks, A. Life Cycle Assessment of Aquaculture Systems: Does Burden Shifting Occur with an Increase in Production Intensity? Aquac. Eng. 2021, 92, 102130. [Google Scholar] [CrossRef]
  41. Davis, R.P.; Boyd, C.E.; Davis, D.A. Resource Sharing and Resource Sparing, Understanding the Role of Production Intensity and Farm Practices in Resource Use in Shrimp Aquaculture. Ocean Coast. Manag. 2021, 207, 105595. [Google Scholar] [CrossRef]
  42. Engle, C.R.; Kumar, G.; van Senten, J. Resource-Use Efficiency in US Aquaculture: Farm-Level Comparisons across Fish Species and Production Systems. Aquac. Environ. Interact. 2021, 13, 259–275. [Google Scholar] [CrossRef]
  43. Rincón, M.A.P.; Hurtado, I.C.; Restrepo, S.; Bonilla, S.P.; Calderón, H.; Ramírez, A. Metodología Para La Medición de La Huella Hídrica En La Producción de Tilapia, Cachama y Trucha: Estudios de Caso Para El Valle Del Cauca (Colombia). Ing. Compet. 2017, 19, 109–120. [Google Scholar] [CrossRef] [Green Version]
  44. Kiss, G. Statistical Report on Harvest Results in the Aquaculture Sector (2006–2019). 2020. Available online: repo.aki.gov.hu/3585/ (accessed on 14 January 2022). (In Hungarian)
  45. Eurostat. Production from Aquaculture Excluding Hatcheries and Nurseries. Available online: https://ec.europa.eu/eurostat/databrowser/view/fish_aq2a/default/table?lang=en (accessed on 9 May 2022).
  46. Tahar, A.; Kennedy, A.; Fitzgerald, R.D.; Clifford, E.; Rowan, N. Full Water Quality Monitoring of a Traditional Flow-through Rainbow Trout Farm. Fishes 2018, 3, 28. [Google Scholar] [CrossRef] [Green Version]
  47. Roy, K.; Vrba, J.; Kaushik, S.J.; Mraz, J. Nutrient Footprint and Ecosystem Services of Carp Production in European Fishponds in Contrast to EU Crop and Livestock Sectors: European Carp Production and Environment. J. Clean. Prod. 2020, 270, 122268. [Google Scholar] [CrossRef]
  48. Gyalog, G.; Oláh, J.; Békefi, E.; Lukácsik, M.; Popp, J. Constraining Factors in Hungarian Carp Farming: An Econometric Perspective. Sustainability 2017, 9, 2111. [Google Scholar] [CrossRef] [Green Version]
  49. Raftowicz, M.; le Gallic, B. Inland Aquaculture of Carps in Poland: Between Tradition and Innovation. Aquaculture 2020, 518, 734665. [Google Scholar] [CrossRef]
  50. European Commission. Directorate-General for Maritime Affairs and Fisheries; Recirculation Aquaculture Systems; EUMOFA: Luxembourg, 2020. [Google Scholar] [CrossRef]
  51. Gál, D.; Kucska, B.; Kerepeczki, É.; Gyalog, G. Feasibility of the Sustainable Freshwater Cage Culture in Hungary and Romania. AACL Bioflux 2011, 4, 598–605. [Google Scholar]
  52. Lasner, T.; Brinker, A.; Nielsen, R.; Rad, F. Establishing a Benchmarking for Fish Farming—Profitability, Productivity and Energy Efficiency of German, Danish and Turkish Rainbow Trout Grow-out Systems. Aquac. Res. 2017, 48, 3134–3148. [Google Scholar] [CrossRef]
  53. Dalsgaard, J.; Pedersen, P.B. Solid and Suspended/Dissolved Waste (N, P, O) from Rainbow Trout (Oncorynchus Mykiss). Aquaculture 2011, 313, 92–99. [Google Scholar] [CrossRef]
  54. Bregnballe, J. A Guide to Recirculation Aquaculture: An Introduction to the New Environmentally Friendly and Highly Productive Closed Fish Farming Systems, 2015th ed.; Food and Agriculture Organization of the United Nations: Copenhagen, Denmark, 2015. [Google Scholar]
  55. Adámek, Z.; Mössmer, M.; Hauber, M. Current Principles and Issues Affecting Organic Carp (Cyprinus carpio) Pond Farming. Aquaculture 2019, 512, 734261. [Google Scholar] [CrossRef]
  56. Eljasik, P.; Panicz, R.; Sobczak, M.; Sadowski, J. Key Performance Indicators of Common Carp (Cyprinus carpio L.) Wintering in a Pond and RAS under Different Feeding Schemes. Sustainability 2022, 14, 3724. [Google Scholar] [CrossRef]
  57. Varga, M.; Berzi-Nagy, L.; Csukas, B.; Gyalog, G. Long-Term Dynamic Simulation of Environmental Impacts on Ecosystem-Based Pond Aquaculture. Environ. Model. Softw. 2020, 134, 104755. [Google Scholar] [CrossRef]
  58. Rosa, R.; Marques, A.; Nunes, M.L. Impact of Climate Change in Mediterranean Aquaculture. Rev. Aquac. 2012, 4, 163–177. [Google Scholar] [CrossRef]
  59. Comte, A. Recent Advances in Climate Change Vulnerability/Risk Assessments in the Fisheries and Aquaculture Sector; Food and Agriculture Organization of the United Nations: Rome, Italy, 2021. [Google Scholar] [CrossRef]
  60. Boyd, C.E.; Effects of Weather and Climate on Aquaculture. Global Aquaculture Advocate. 2020. Available online: https://www.globalseafood.org/advocate/effects-of-weather-and-climate-on-aquaculture/ (accessed on 20 April 2022).
  61. Panicz, R.; Całka, B.; Cubillo, A.; Ferreira, J.G.; Guilder, J.; Kay, S.; Kennerley, A.; Lopes, A.; Lencart e Silva, J.; Taylor, N.; et al. Impact of Climate-driven Temperature Increase on Inland Aquaculture: Application to Land-based Production of Common Carp (Cyprinus carpio L.). Transbound. Emerg. Dis. 2022. [Google Scholar] [CrossRef]
  62. Cruz-Casallas, P.E.; Medina-Robles, V.M.; Velasco-Santamaría, Y.M. Fish Farming of Native Species in Colombia: Current Situation and Perspectives. Aquac. Res. 2011, 42, 823–831. [Google Scholar] [CrossRef]
  63. Blanchet, M.A.; Primicerio, R.; Smalås, A.; Arias-Hansen, J.; Aschan, M. How Vulnerable Is the European Seafood Production to Climate Warming? Fish. Res. 2019, 209, 251–258. [Google Scholar] [CrossRef] [Green Version]
  64. Hall, S.J.; Delaporte, A.; Phillips, M.J.; Beveridge, M.; O’keefe, M. Blue Frontiers: Managing the Environmental Costs of Aquaculture; WorldFish: Penang, Malaysia, 2011. [Google Scholar]
  65. Gephart, J.A.; Henriksson, P.J.G.; Parker, R.W.R.; Shepon, A.; Gorospe, K.D.; Bergman, K.; Eshel, G.; Golden, C.D.; Halpern, B.S.; Hornborg, S.; et al. Environmental Performance of Blue Foods. Nature 2021, 597, 360–365. [Google Scholar] [CrossRef] [PubMed]
  66. MacLeod, M.J.; Hasan, M.R.; Robb, D.H.F.; Mamun-Ur-Rashid, M. Quantifying Greenhouse Gas Emissions from Global Aquaculture. Sci. Rep. 2020, 10, 11679. [Google Scholar] [CrossRef]
  67. Biermann, G.; Geist, J. Life Cycle Assessment of Common Carp (Cyprinus carpio L.)—A Comparison of the Environmental Impacts of Conventional and Organic Carp Aquaculture in Germany. Aquaculture 2019, 501, 404–415. [Google Scholar] [CrossRef]
  68. Waite, R.; Beridge, M.; Brummett, R.; Castine, S. Improving Productivity and Environmental Performance of Aquaculture; WorldFish: Washington, DC, USA, 2014. [Google Scholar]
  69. Liu, Y.; Rosten, T.W.; Henriksen, K.; Hognes, E.S.; Summerfelt, S.; Vinci, B. Comparative Economic Performance and Carbon Footprint of Two Farming Models for Producing Atlantic Salmon (Salmo Salar): Land-Based Closed Containment System in Freshwater and Open Net Pen in Seawater. Aquac. Eng. 2016, 71, 1–12. [Google Scholar] [CrossRef] [Green Version]
  70. Ahmed, N.; Turchini, G.M. Recirculating Aquaculture Systems (RAS): Environmental Solution and Climate Change Adaptation. J. Clean. Prod. 2021, 297, 126604. [Google Scholar] [CrossRef]
  71. Bouwman, A.F.; Beusen, A.H.W.; Overbeek, C.C.; Bureau, D.P.; Pawlowski, M.; Glibert, P.M. Hindcasts and Future Projections of Global Inland and Coastal Nitrogen and Phosphorus Loads Due to Finfish Aquaculture. Rev. Fish. Sci. 2013, 21, 112–156. [Google Scholar] [CrossRef]
  72. van Rijn, J. Waste Treatment in Recirculating Aquaculture Systems. Aquac. Eng. 2013, 53, 49–56. [Google Scholar] [CrossRef]
  73. Abate, T.G.; Nielsen, R.; Tveterås, R. Stringency of Environmental Regulation and Aquaculture Growth: A Cross-Country Analysis. Aquac. Econ. Manag. 2016, 20, 201–221. [Google Scholar] [CrossRef]
  74. Gál, D.; Pekár, F.; Kerepeczki, É. A Survey on the Environmental Impact of Pond Aquaculture in Hungary. Aquac. Int. 2016, 24, 1543–1554. [Google Scholar] [CrossRef]
  75. Aubin, J.; Baizeau, V.; Jaeger, C.; Roucaute, M.; Gamito, S. Modeling Trophic Webs in Freshwater Fishpond Systems Using Ecopath: Towards Better Polyculture Management. Aquac. Environ. Interact. 2021, 13, 311–322. [Google Scholar] [CrossRef]
  76. Bhari, B.; Visvanathan, C. Sustainable Aquaculture: Socio-Economic and Environmental Assessment. In Sustainable Aquaculture, Applied Environmental Science and Engineering for a Sustainable Future; Springer International Publishing AG: Berlin/Heidelberg, Germany, 2018; pp. 63–93. [Google Scholar] [CrossRef]
  77. Jayanthi, M.; Thirumurthy, S.; Samynathan, M.; Manimaran, K.; Duraisamy, M.; Muralidhar, M. Assessment of Land and Water Ecosystems Capability to Support Aquaculture Expansion in Climate-Vulnerable Regions Using Analytical Hierarchy Process Based Geospatial Analysis. J. Environ. Manag. 2020, 270, 110952. [Google Scholar] [CrossRef] [PubMed]
  78. Mahlknecht, J.; González-Bravo, R.; Loge, F.J. Water-Energy-Food Security: A Nexus Perspective of the Current Situation in Latin America and the Caribbean. Energy 2020, 194, 116824. [Google Scholar] [CrossRef]
  79. Nielsen, R.; Asche, F.; Nielsen, M. Restructuring European Freshwater Aquaculture from Family-Owned to Large-Scale Firms—Lessons from Danish Aquaculture. Aquac. Res. 2015, 47, 3852–3866. [Google Scholar] [CrossRef]
  80. Raftowicz, M.; le Gallic, B.; Kalisiak-mędelska, M.; Rutkiewicz, K.; Konopska-struś, E. Effectiveness of Public Aid for Inland Aquaculture in Poland—The Relevance of Traditional Performance Ratios. Sustainability 2021, 13, 5155. [Google Scholar] [CrossRef]
  81. Lasner, T.; Mytlewski, A.; Nourry, M.; Rakowski, M.; Oberle, M. Carp Land: Economics of Fish Farms and the Impact of Region-Marketing in the Aischgrund (DEU) and Barycz Valley (POL). Aquaculture 2020, 519, 734731. [Google Scholar] [CrossRef]
Figure 1. Geographical scope of the study. Blue- and red-colored countries represent increasing and falling freshwater aquaculture production between 2007–2009 and 2017–2019, respectively.
Sustainability 14 06443 g001
Figure 2. Freshwater aquaculture production in LAC. Data source: [1].
Sustainability 14 06443 g002
Figure 3. Freshwater aquaculture production in the EU-27 and in the top 8 producer countries (bar charts). Pie charts represent share of major groups in total production of EU-27. Data source: [1].
Sustainability 14 06443 g003
Figure 4. Bubble plot of the trophic level versus the unit value for the top-25 species in LAC aquaculture (calculated for 2019). The size of the bubbles relates to the production volume of a particular species. Cichlidae and Characidae species are marked in red and green, respectively. Items in italics are not species but higher-level aggregates. Data sources: [1,8].
Sustainability 14 06443 g004
Figure 5. Bubble plot of the trophic level versus the unit value for the top-25 species in EU-27 aquaculture (calculated for 2019). The size of the bubble relates to the production volume of a particular species. Salmonidae and Cyprinidae species are marked in red and green, respectively. Items in italics are not species but higher-level aggregates. Data sources: [1,8].
Sustainability 14 06443 g005
Figure 6. Emerging species in freshwater aquaculture of EU-27: production quantities and unit values in 2007–2009 and 2017–2019.
Sustainability 14 06443 g006
Figure 7. Emerging species in freshwater aquaculture of EU-27: production quantities and unit values in 2007–2009 and 2017–2019.
Sustainability 14 06443 g007
Figure 8. Bubble plot of the Total Renewable Water Resources (TRWR, 2018–2022) versus per capita growth of annual freshwater aquaculture production over a 10-year period (from 2007–2009 to 2017–2019) for top-12 freshwater aquaculture producers in LAC (upper) and EU (lower) graph. The size of the bubble relates to the freshwater aquaculture production (t/year) of the corresponding country (avg. for 2017–2019). Note that the x-axis is log-scaled, and scales differ between the two graphs. Data sources: [1,9].
Sustainability 14 06443 g008
Figure 9. Climatic conditions (range of mean monthly air temperatures) versus thermal optimum of major cultured species in the top 10 fish producing countries of LAC (left) and EU (right). The size of the bubbles relate to the production volume of species. The whiskers encompass the optimal water temperature range for each species. Source of data: [11,12,62].
Sustainability 14 06443 g009
Table 1. Per kg water use in typical fish production systems in LAC and EU as per literature sources.
Species, Production SystemDirect Water Use 1Source and Further Information on Indirect Water Use for Upstream and Downstream Segments
Rainbow trout, pond culture (Colombia)16.9 m3/kgSource: [43] The study calculated blue, grey, and green water footprint (WF) for the hatching and on-growing phases: feed and electricity (input) production. Calculated WFs were 19.8, 5.5, and 6.1 m3/kg for trout, tilapia, and chachama, respectively.
Tilapia, pond culture (Colombia)2.7 m3/kg
Cachama, pond culture (Colombia)3.9 m3/kg
Nile tilapia, extensive reservoir culture 2 (Mexico)2.8 m3/kgSource: [30]. The study calculated blue, grey, and green WFs for the following stages: broodstock keeping, on-growing, fish processing, transport, feed, and fertilizer (input) production. Calculated WFs were 4.0, 37.8, and 68.2 m3/kg for extensive, semi-intensive, and intensive culture, respectively (on a live weight basis).
Nile tilapia, semi-intensive pond culture 3 (Mexico)8.7 m3/kg
Nile tilapia, intensive pond culture 4 (Mexico)39.1 m3/kg
Nile tilapia, semi-intensive pond culture 5 (Brazil)17–34 m3/kgSource: [31] Water dependency analysis focused only on blue water use during on-growing stage.
Nile tilapia, Intensive cage culture in reservoir 6 (Brazil)<0.01 m3/kgWater dependency analysis focused only on blue water use during on-growing stage. Source: [33]
African catfish, intensive RAS culture 7 (Netherland)0.1 m3/kgAnalysis scoped system-associated (blue) water use during on-growing. If feed-associated (green) water use was added, water use would amount to 0.5 m3/kg. Source: [37]
Carp, semi-intensive pond culture 8 (Hungary)21.1 m3/kgCalculated system-associated (blue) water use based on data from country-level statistical report for 2019 [44]. If feed-associated water use was added, water use would amount to 24.8 m3/kg.
Trout farmed in flow-through raceway tanks 9 (France)54.2 m3/kgWater dependency analysis focused only on blue water use during on-growing stage. Source: [38]
1 Definitions of direct (system-associated) water use vary across studies. Most studies calculate the total amount of water withdrawn for production, which is larger than consumptive water use. 2 Non-fed, fertilized system with 1.5 kg/m3 max. biomass density. 3 Fed and fertilized system with a daily 30% water exchange. Max biomass density is 25 kg/m3. 4 Fed system with a daily 100–400% water exchange. Max biomass density is 40 kg/m3. 5 Fed, fertilized and aerated system, with supplementary water intake (offset evaporation loss) 9–14 t/ha. 6 Fed system in static water body. Max density is 37–43 kg/m3. 7 Water exchange is 0.1 m3/kg feed. Culture density is >300 kg/m3. 8 Fertilized and fed system with supplementary water intake (offset evaporation loss). Yield is 710 kg/ha. 9 Constant water flow diverted from a river; oxygen supply is provided.
Publisher’s Note: MDPI stays neutral with regard to jurisdictional claims in published maps and institutional affiliations.

