Impact of Inter-Annual Variation in Meteorology from 2010 to 2019 on the Inter-City Transport of PM2.5 in the Beijing–Tianjin–Hebei Region
Abstract
:1. Introduction
2. Methodology
2.1. Study Area and Modeling Domains
2.2. Model Configuration and Input Data
2.3. Model Evaluation
3. Results and Discussion
3.1. Impact of Inter-Annual Meteorological Variation on PM2.5 Concentration in Beijing–Tianjin–Hebei Region
3.2. Average Transport of PM2.5 among Cities in the BTH Region from 2010 to 2019
3.3. Impact of Inter-Annual Meteorological Variation on the Contribution of Regional Transport in the BTH Region
4. Conclusions
- (1)
- Inter-annual variation in meteorological conditions has an impact on both PM2.5 concentration and inter-city transport in the Beijing–Tianjin–Hebei (BTH) region.
- (2)
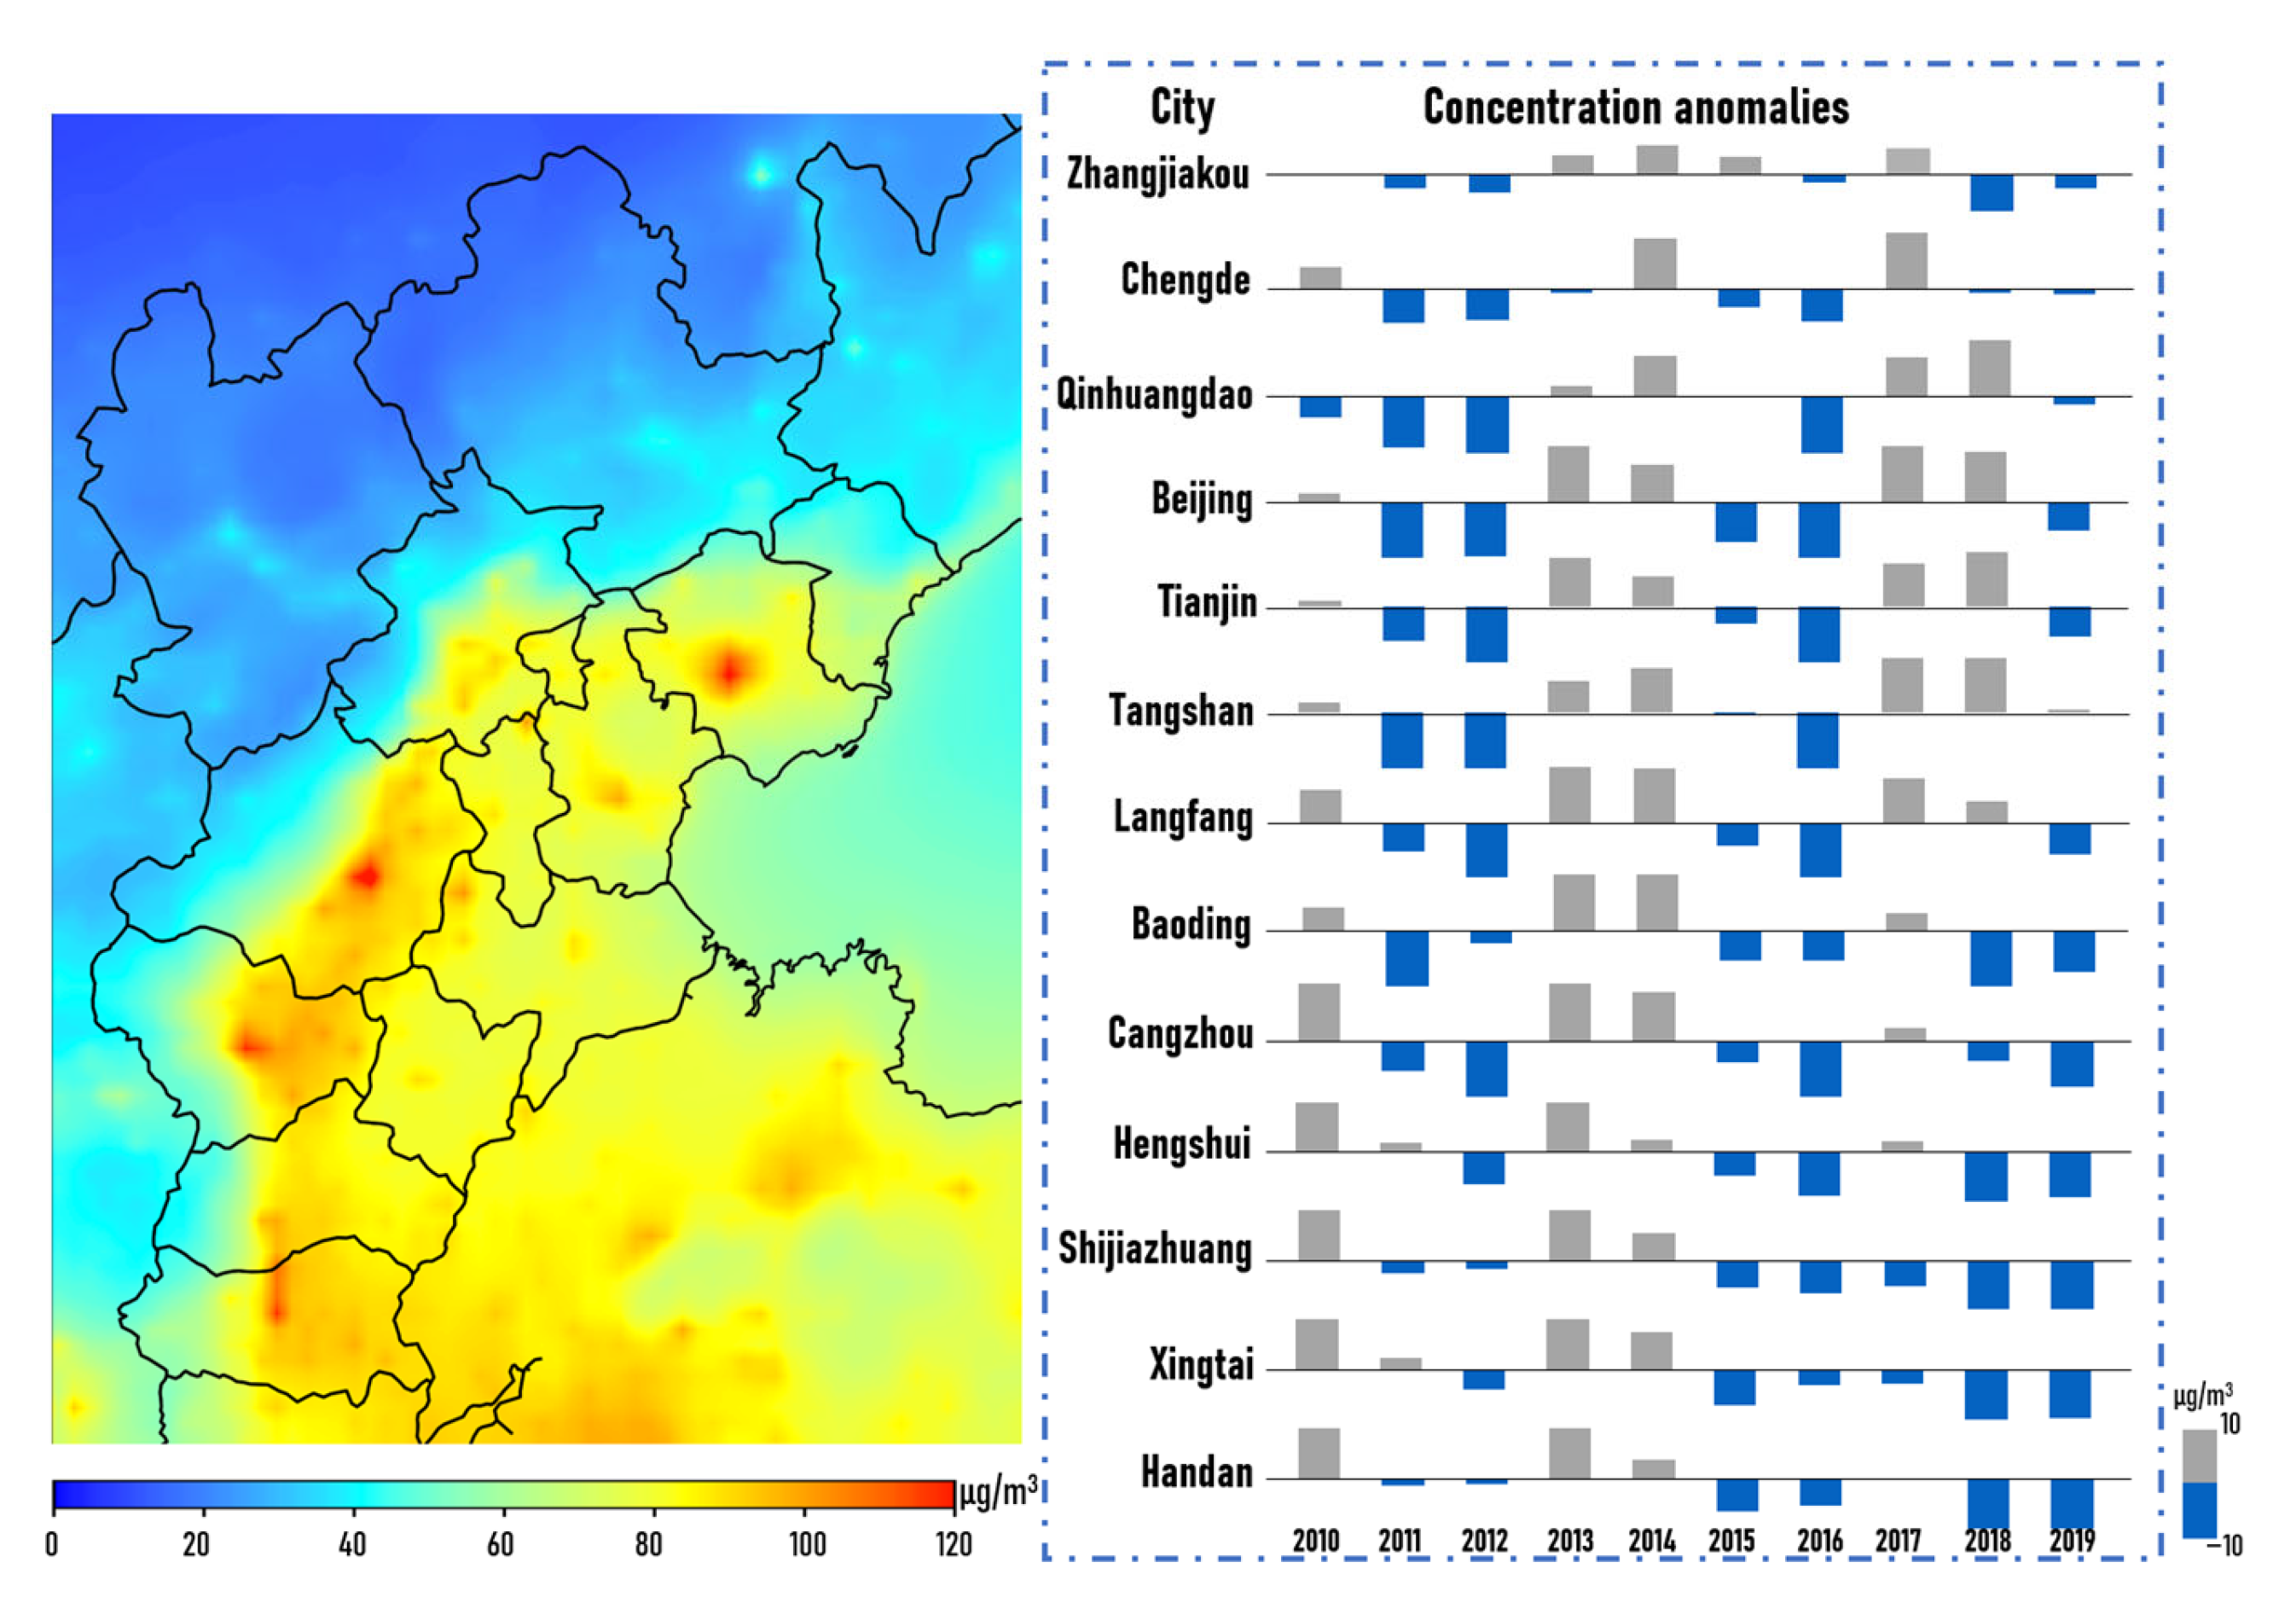
- The results show that the 10-year average PM2.5 concentration in 13 cities ranged from 30.1 μg/m3 to 134.4 μg/m3, showing a strong spatial inhomogeneity distribution. The highest PM2.5 concentration was found in Baoding (134.4 μg/m3), and the cities located in the southern part of the study area.
- (3)
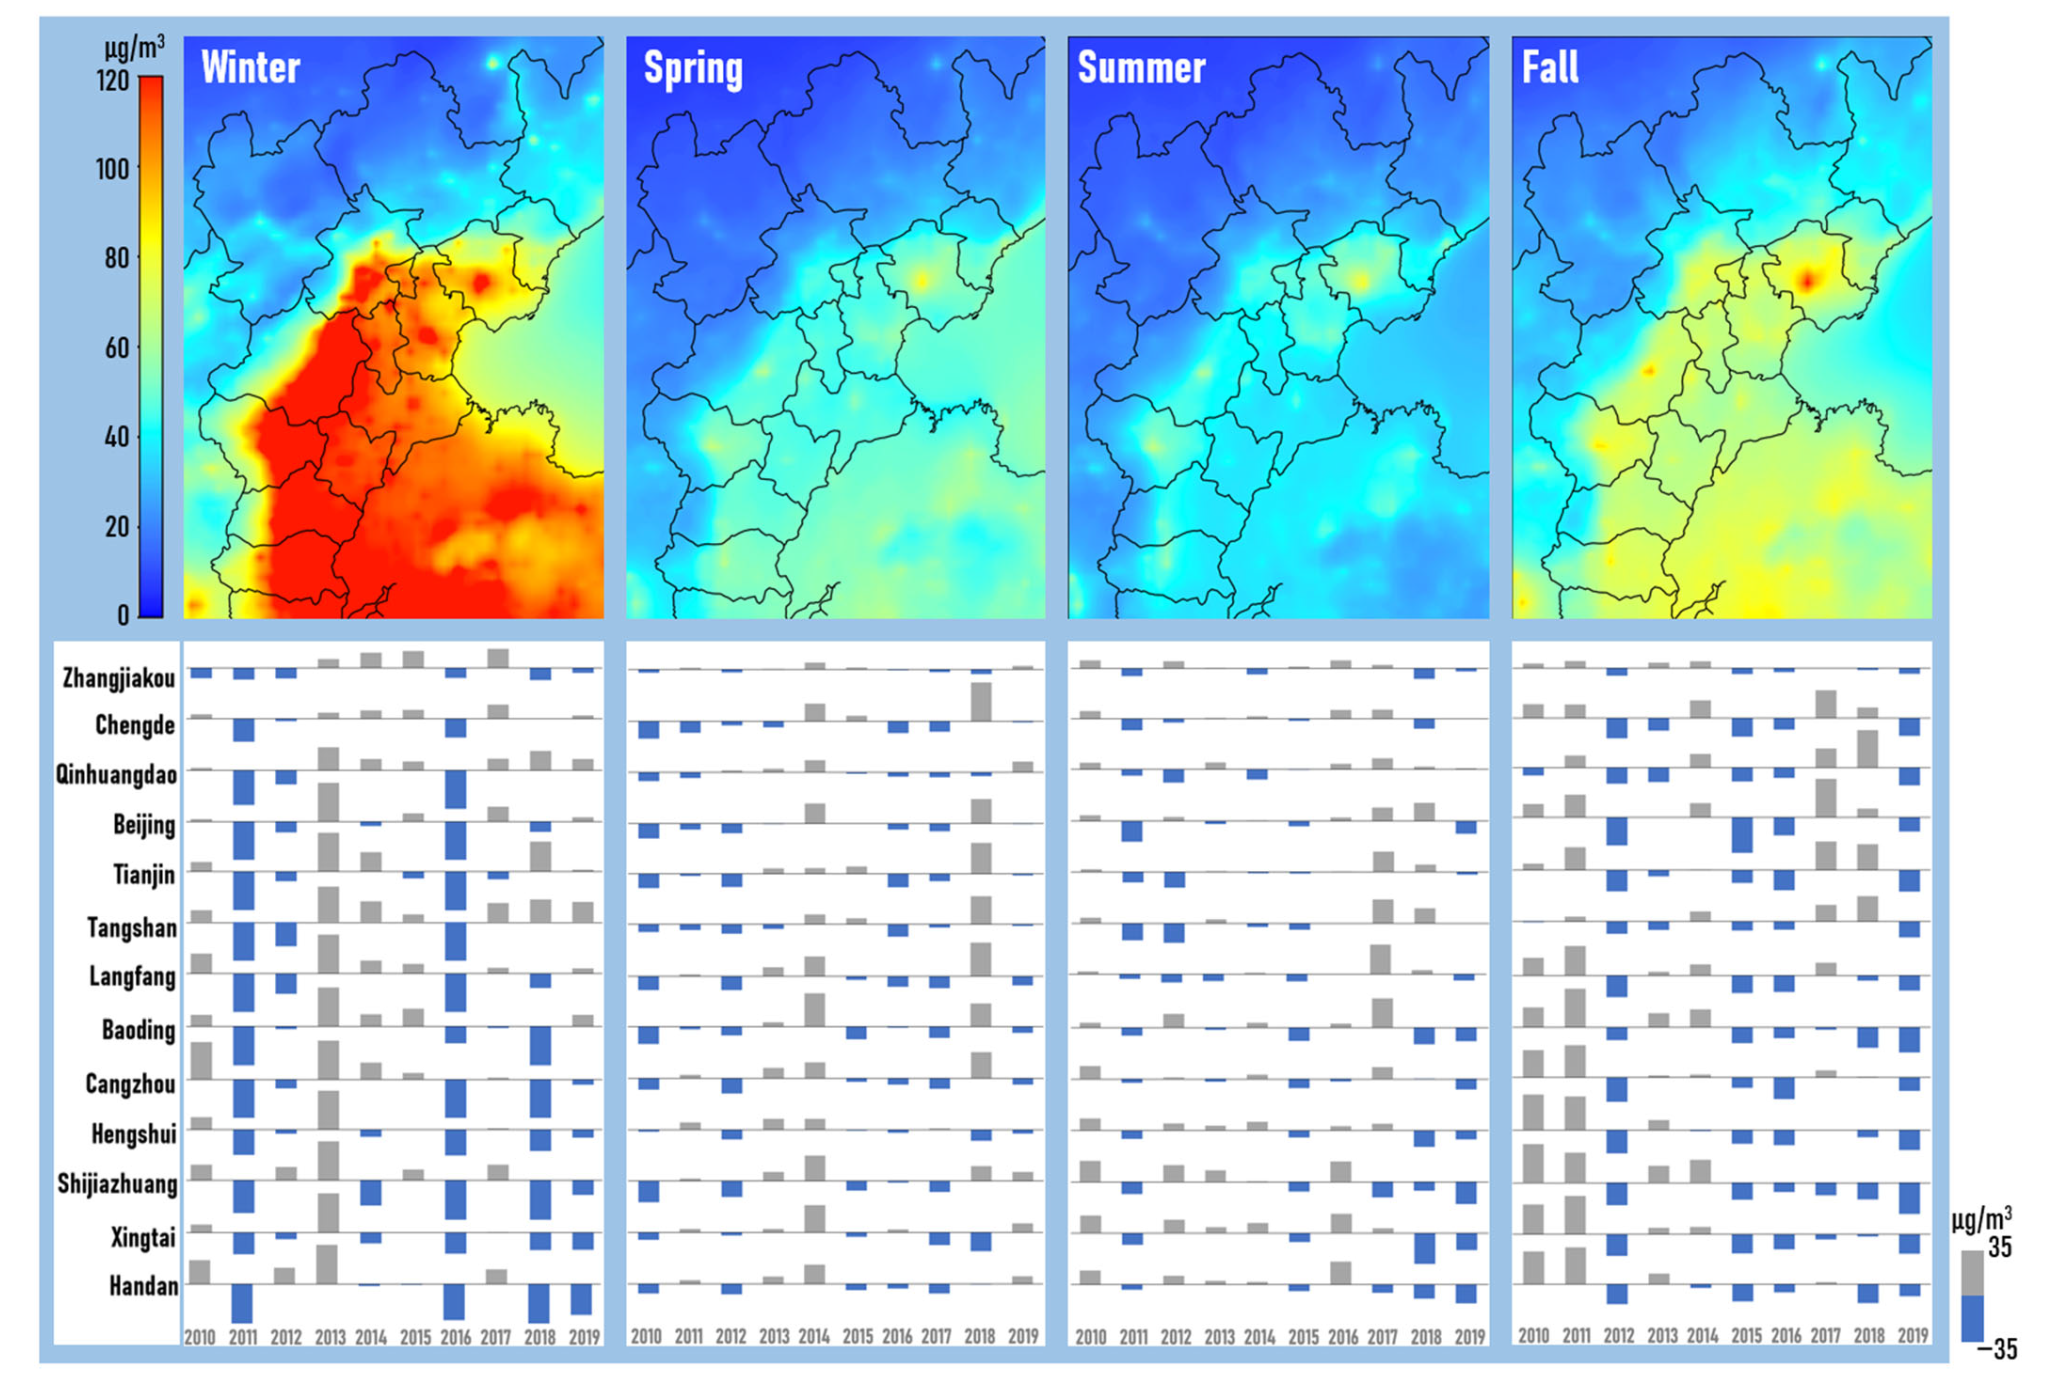
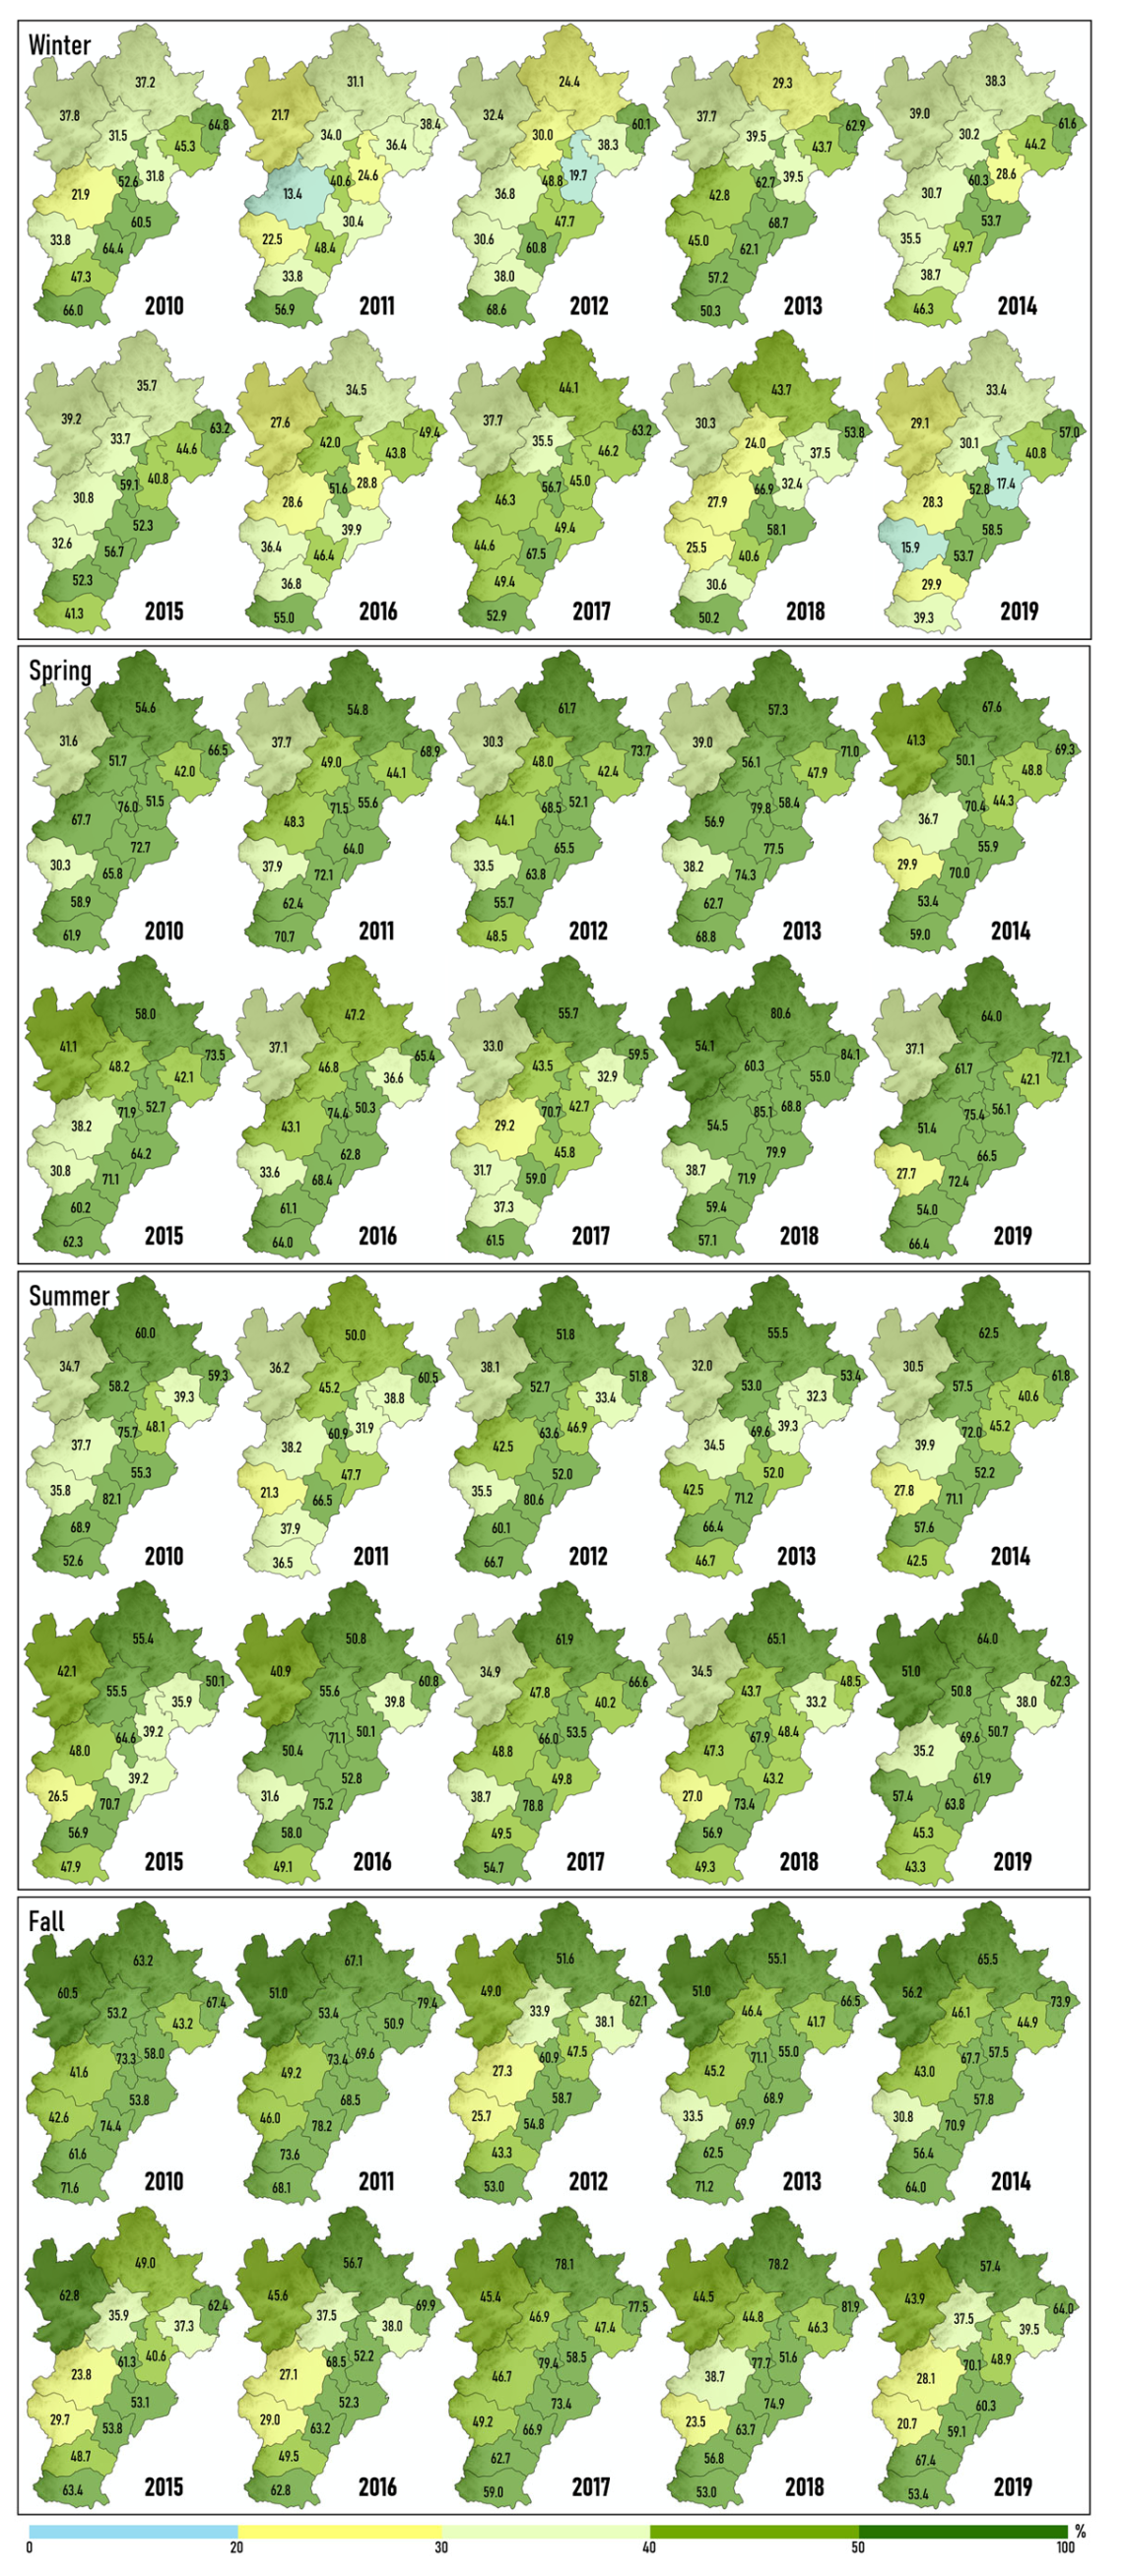
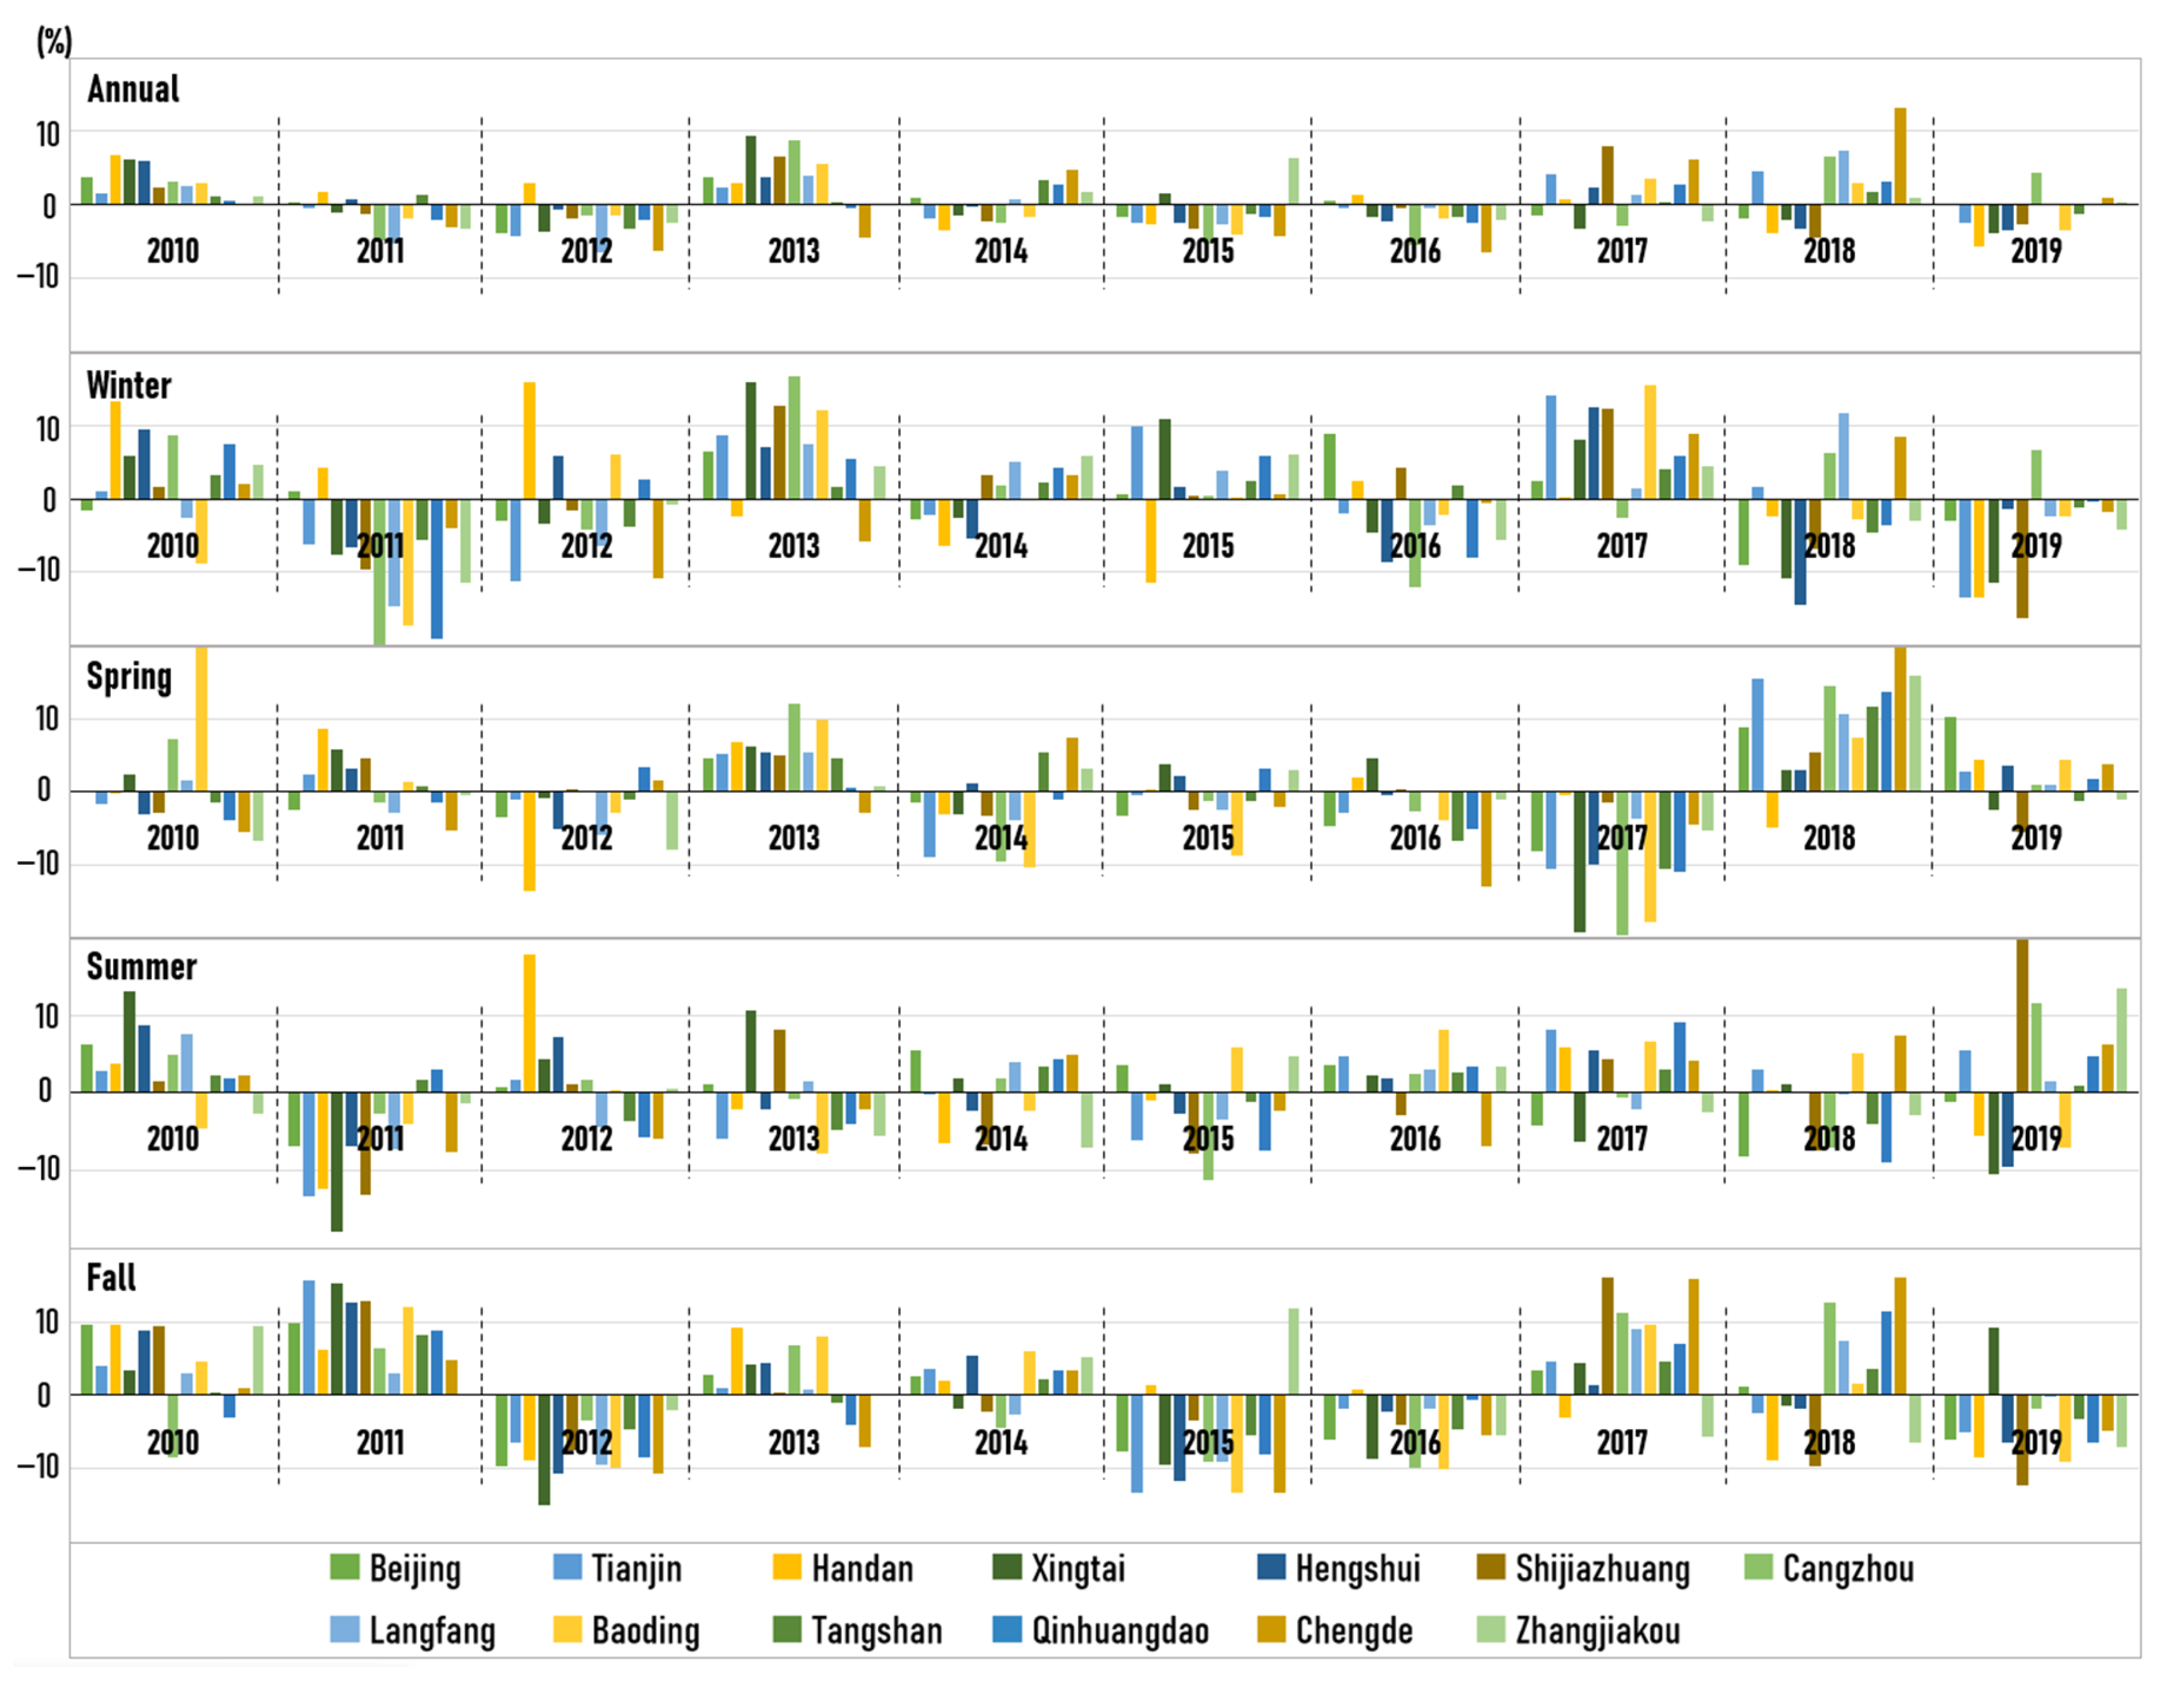
- The simulated annual average concentrations in 13 cities in BTH are highly variable, with fluctuations ranging from 30.8% to 54.1%, and more evident variations were found in seasonal results, with winter having the most significant inter-annual variation.
- (4)
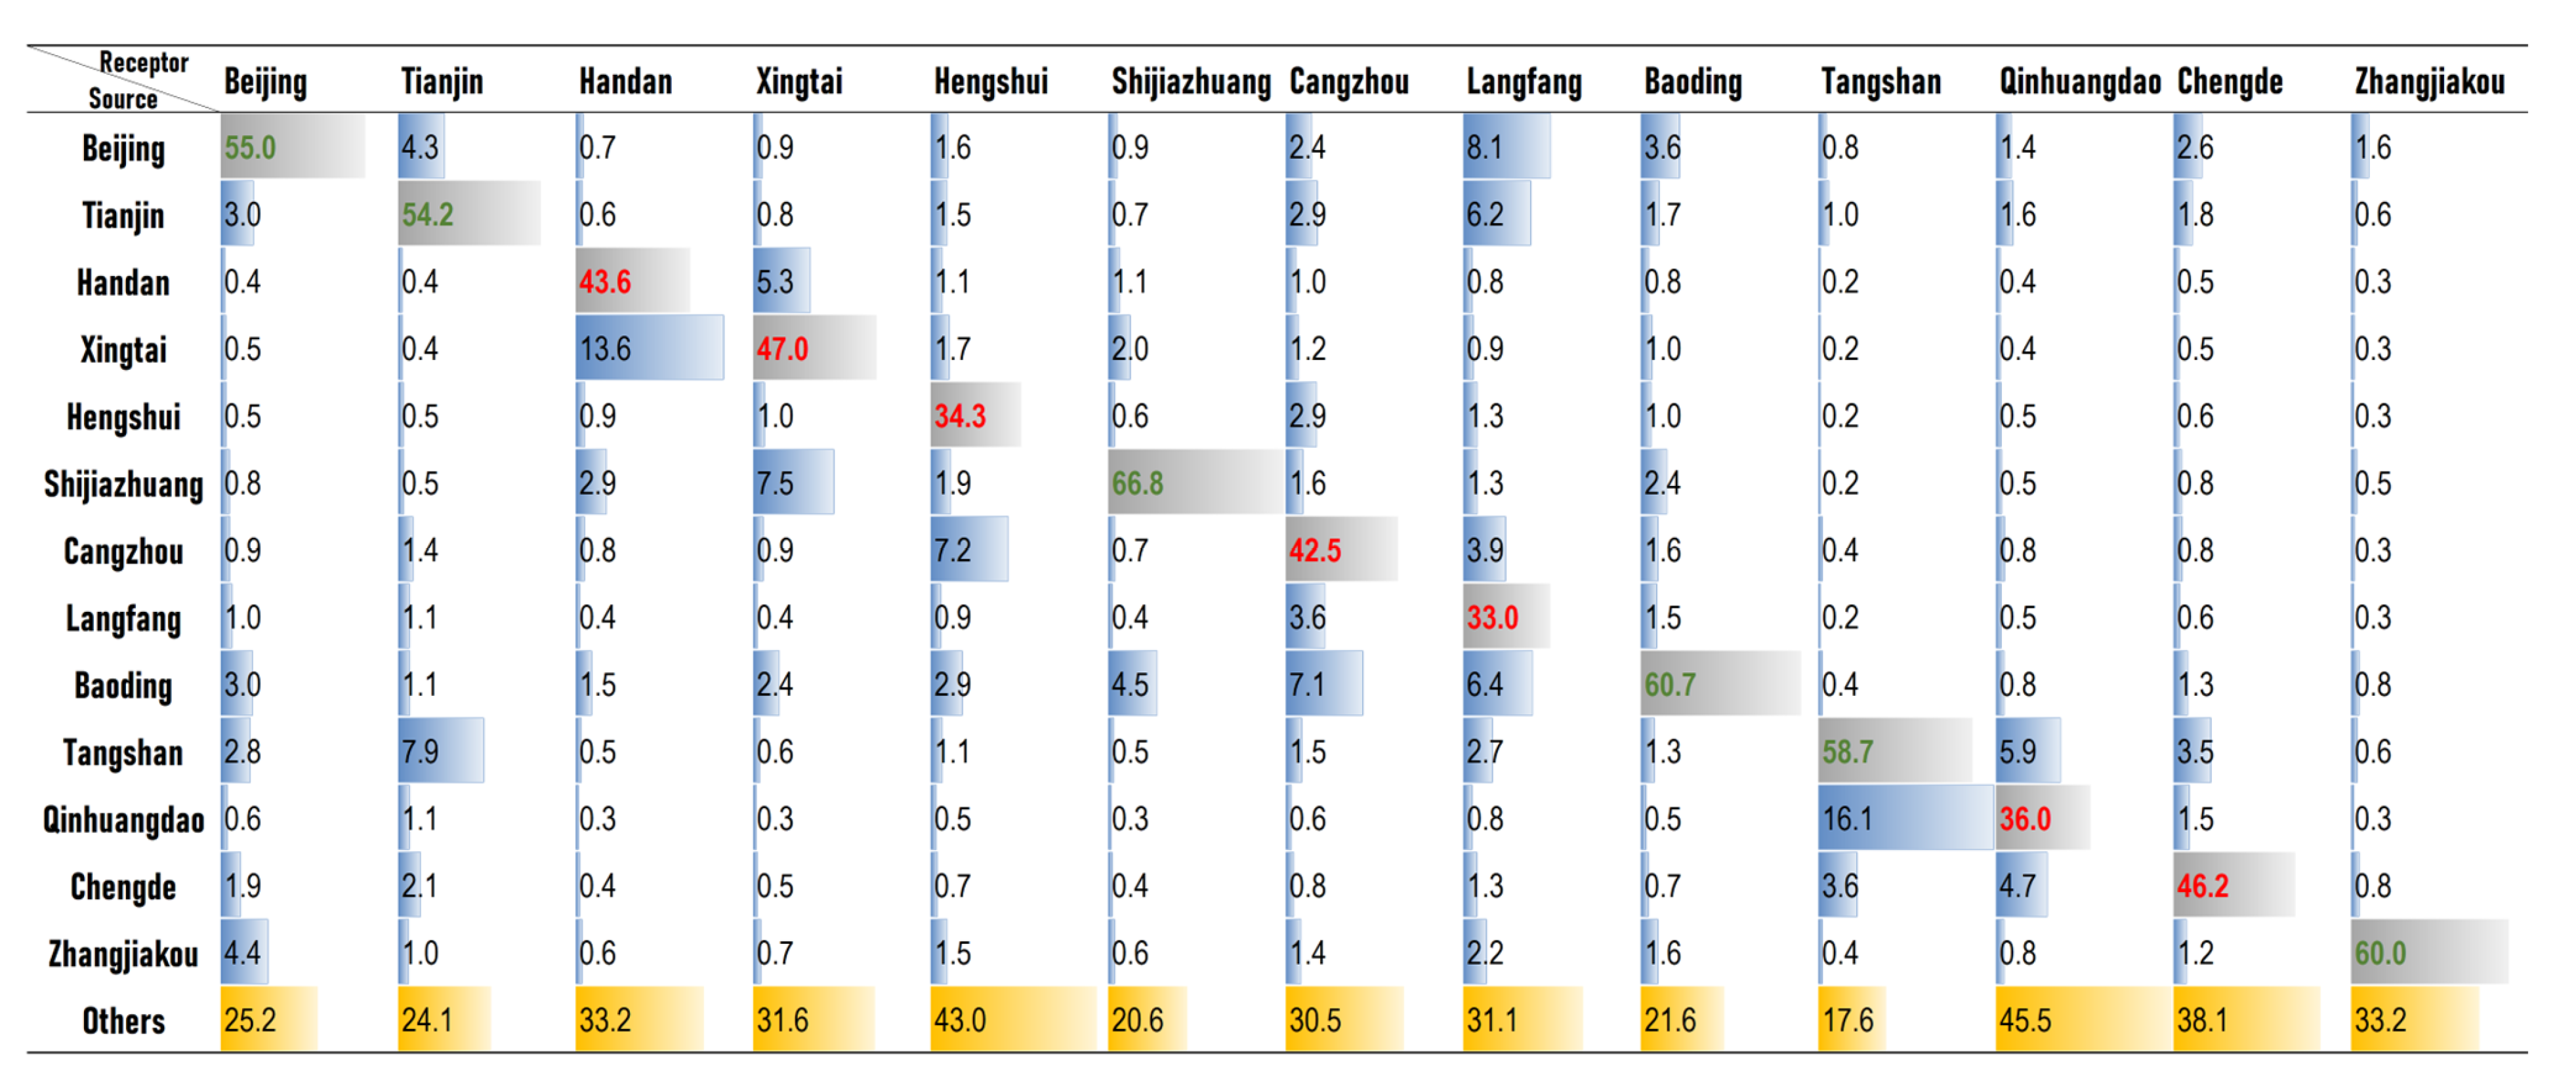
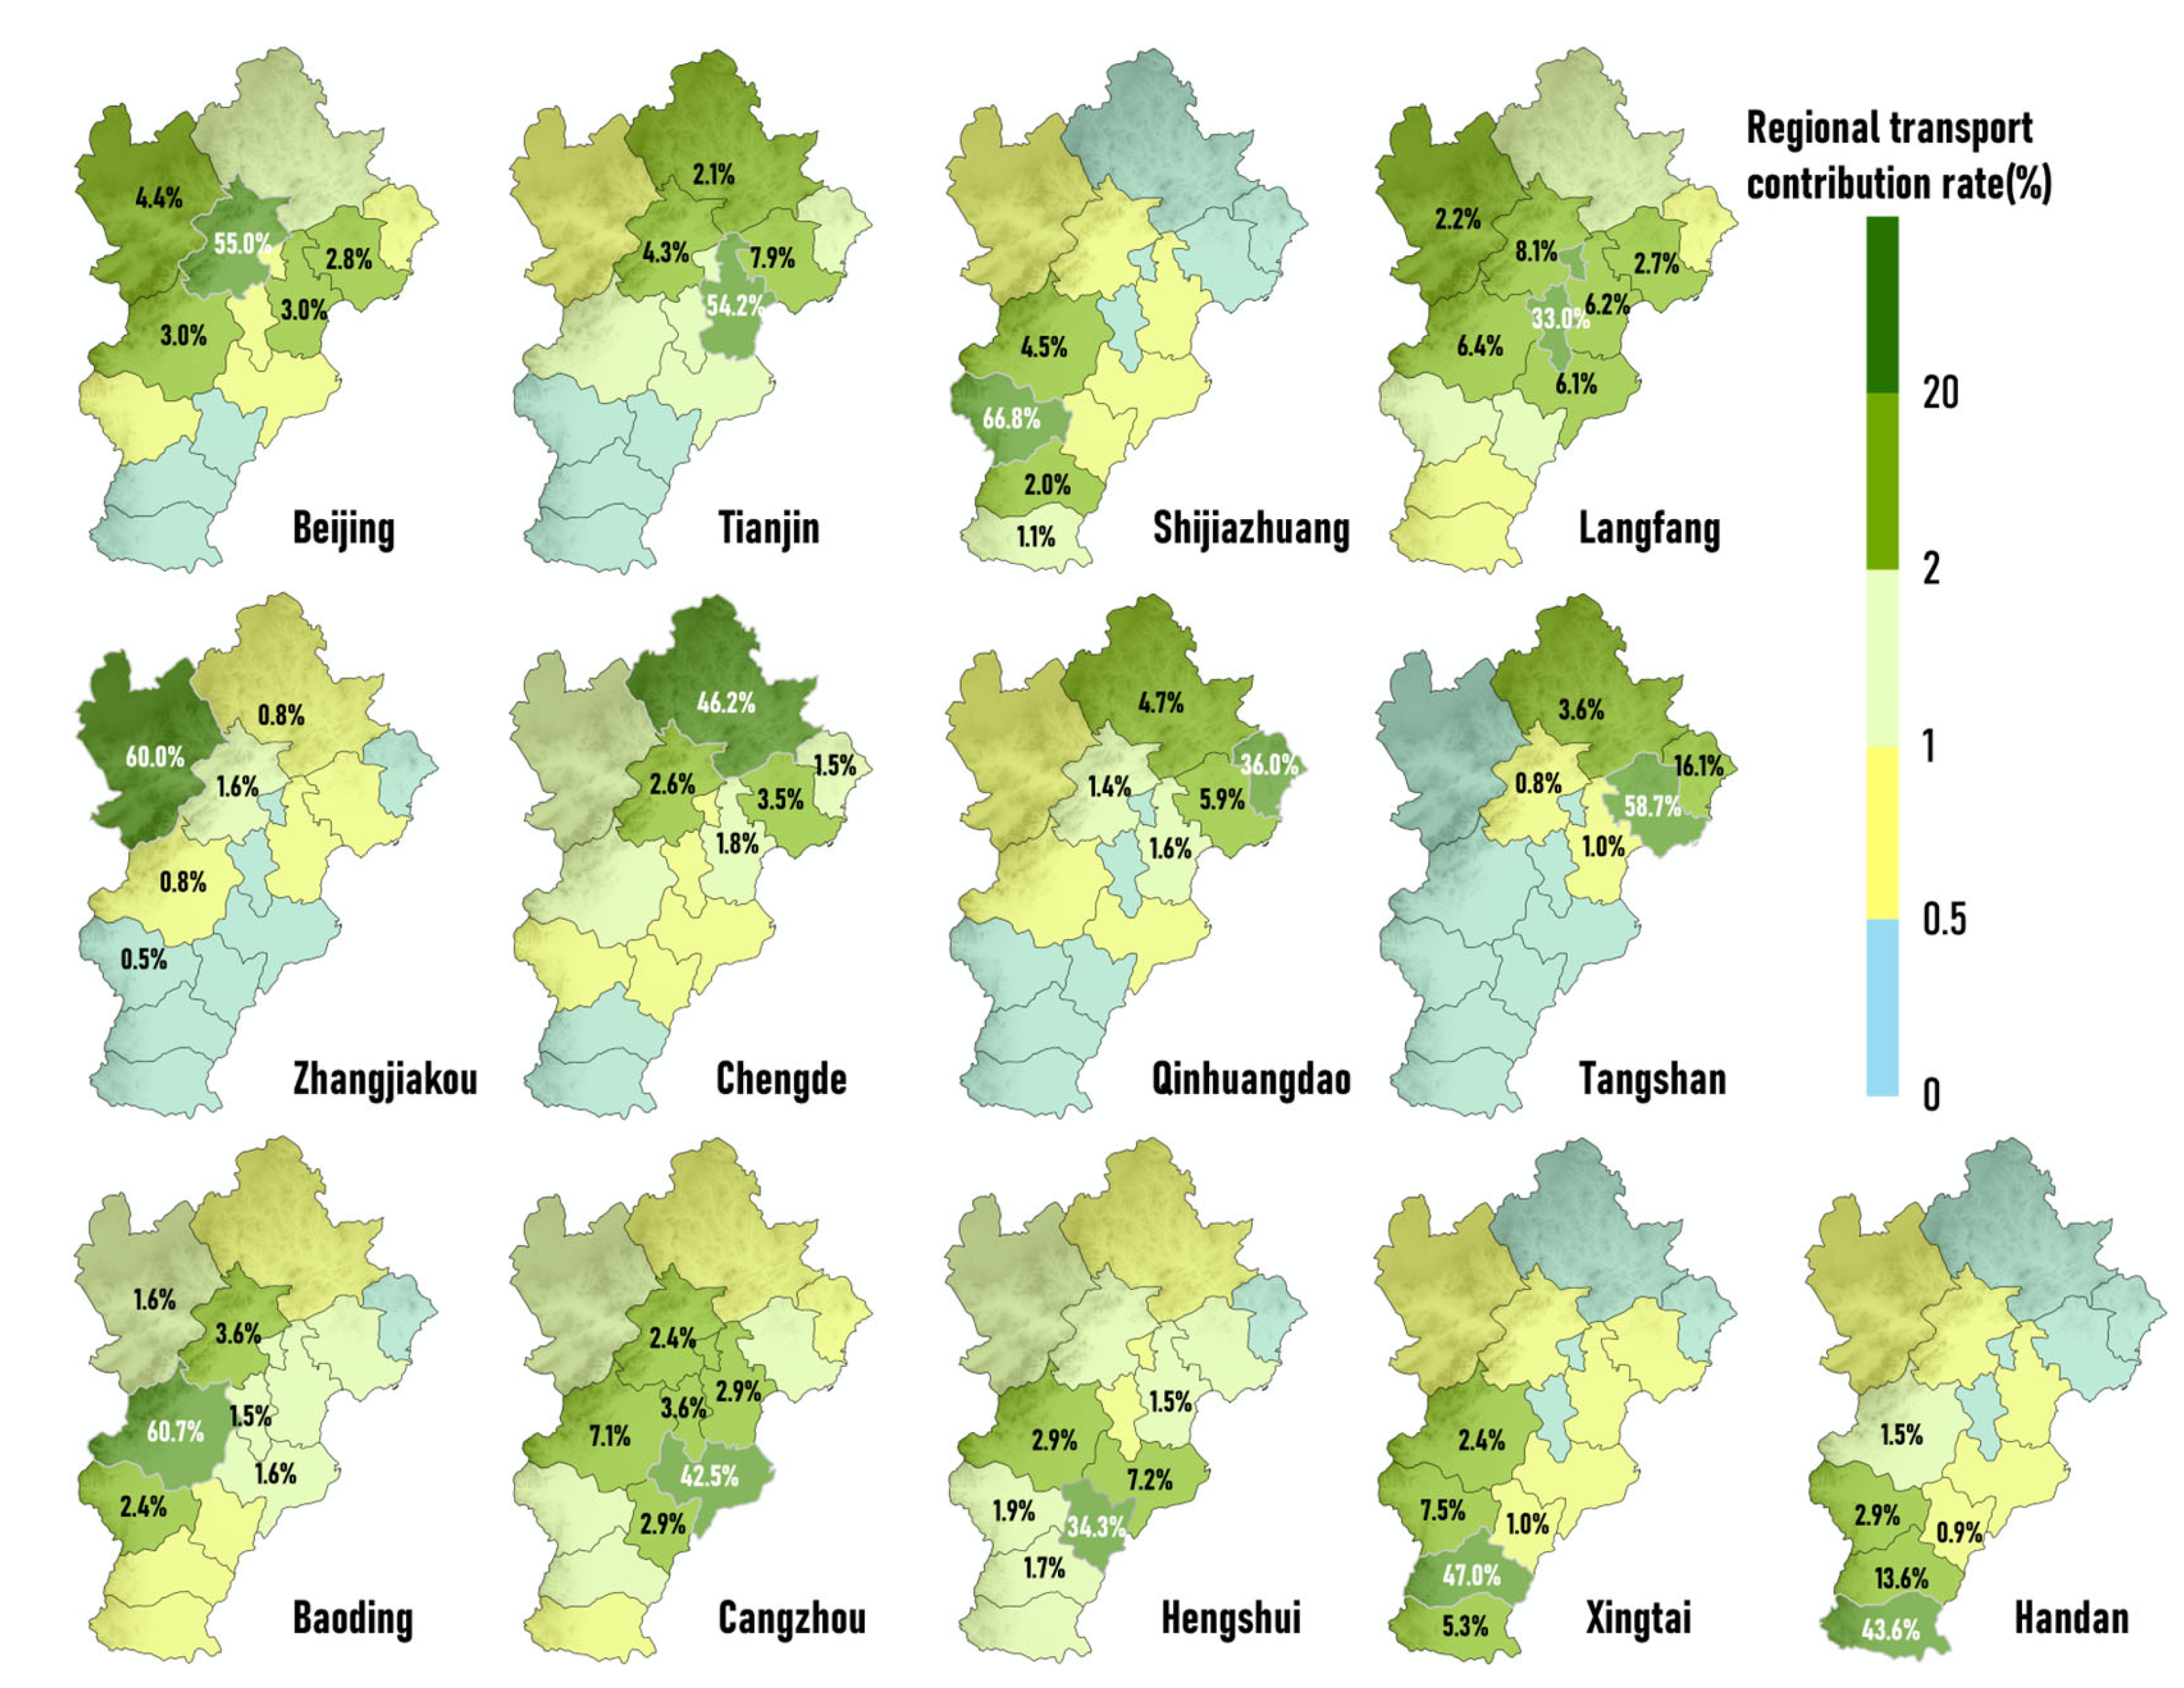
- Seven out of thirteen cities have a contribution from regional transport exceeding 50%, which are located in the eastern half of the Beijing–Tianjin–Hebei region, while the western half is dominated by local contributions.
- (5)
- The magnitude of the regional transport contribution varies significantly among the cities of BTH, on an annual basis, from a minimum inter-annual fluctuation of 8.9% to a maximum of 37.2%, and seasonal fluctuation is even more strongly evident.
- (6)
- Both in terms of concentration and regional contribution, values above and below the historical average in different seasons often cancel each other out, causing the annual average to be close to the historical average.
Author Contributions
Funding
Institutional Review Board Statement
Informed Consent Statement
Data Availability Statement
Acknowledgments
Conflicts of Interest
References
- Paital, B. Nurture to nature via COVID-19, a self-regenerating environmental strategy of environment in global context. Sci. Total Environ. 2020, 729, 139088. [Google Scholar] [CrossRef] [PubMed]
- Paital, B.; Agrawal, P.K. Air pollution by NO2 and PM2.5 explains COVID-19 infection severity by overexpression of angiotensin-converting enzyme 2 in respiratory cells: A review. Environ. Chem. Lett. 2021, 19, 25–42. [Google Scholar] [CrossRef] [PubMed]
- Pata, U.K. How is COVID-19 affecting environmental pollution in US cities? Evidence from asymmetric Fourier causality test. Air Qual. Atmos. Health 2020, 13, 1149–1155. [Google Scholar] [CrossRef]
- Chen, Z.; Xie, X.; Cai, J.; Chen, D.; Gao, B.; He, B.; Cheng, N.; Xu, B. Understanding meteorological influences on PM2.5 concentrations across China: A temporal and spatial perspective. Atmos. Chem. Phys. 2018, 18, 5343–5358. [Google Scholar] [CrossRef] [Green Version]
- Zhang, X.; Zhang, Q.; Hong, C.; Zheng, Y.; Geng, G.; Tong Dan Zhang, Y.; Zhang, X. Enhancement of PM2.5 Concentrations by Aerosol-Meteorology Interactions Over China. J. Geophys. Res. Atmos. 2018, 123, 1179–1194. [Google Scholar] [CrossRef]
- Hou, K.; Xu, X. Evaluation of the influence between local meteorology and air quality in Beijing using generalized additive models. Atmosphere 2022, 13, 24. [Google Scholar] [CrossRef]
- Cheng, Y.; Zheng, G.; Wei, C.; Mu, Q.; Zheng, B.; Wang, Z.; Gao, M.; Zhang, Q.; He, K.; Carmichael, G.; et al. Reactive nitrogen chemistry in aerosol water as a source of sulfate during haze events in China. Sci. Adv. 2016, 2, e1601530. [Google Scholar] [CrossRef] [Green Version]
- Jia, W.; Zhang, X. The role of the planetary boundary layer parameterization schemes on the meteorological and aerosol pollution simulations: A review. Atmos. Res. 2020, 239, 104890. [Google Scholar] [CrossRef]
- Zhai, S.; Jacob, D.J.; Wang, X.; Shen, L.; Li, K.; Zhang, Y.; Gui, K.; Zhao, T.; Liao, H. Fine particulate matter (PM2.5) trends in China, 2013-2018: Separating contributions from anthropogenic emissions and meteorology. Atmos. Chem. Phys. 2019, 19, 11031–11041. [Google Scholar] [CrossRef] [Green Version]
- Chen, Z.; Cai, J.; Gao, B.; Xu, B.; Dai, S.; He, B.; Xie, X. Detecting the causality influence of individual meteorological factors on local PM2.5 concentration in the Jing-Jin-Ji region. Sci. Rep. 2017, 7, 40735. [Google Scholar] [CrossRef] [Green Version]
- Gui, K.; Che, H.; Wang, Y.; Wang, H.; Zhang, L.; Zhao, H.; Zheng, Y.; Sun, T.; Zhang, X. Satellite-derived PM2.5 concentration trends over Eastern China from 1998 to 2016: Relationships to emissions and meteorological parameters. Environ. Pollut. 2019, 247, 1125–1133. [Google Scholar] [CrossRef]
- Xu, Y.; Xue, W.; Lei, Y.; Huang, Q.; Zhao, Y.; Cheng, S.; Ren, Z.; Wang, J. Spatiotemporal variation in the impact of meteorological conditions on PM2.5 pollution in China from 2000 to 2017. Atmos. Environ. 2020, 223, 117215. [Google Scholar] [CrossRef]
- Gao, M.; Liu, Z.; Zheng, B.; Ji, D.; Sherman, P.; Song, S.; Xin, J.; Liu, C.; Wang, Y.; Zhang, Q.; et al. China’s emission control strategies have suppressed unfavorable influences of climate on wintertime PM2.5 concentrations in Beijing since 2002. Atmos. Chem. Phys. 2020, 20, 1497–1505. [Google Scholar] [CrossRef] [Green Version]
- Zhang, X.; Xu, X.; Ding, Y.; Liu, Y.; Zhang, H.; Wang, Y.; Zhong, J. The impact of meteorological changes from 2013 to 2017 on PM2.5 mass reduction in key regions in China. Sci. China Earth Sci. 2019, 62, 1885–1902. [Google Scholar] [CrossRef]
- Zhang, H.; Cheng, S.; Yao, S.; Wang, X.; Zhang, J. Multiple perspectives for modeling regional PM2.5 transport across cities in the Beijing-Tianjin-Hebei region during haze episodes. Atmos. Environ. 2019, 212, 22–35. [Google Scholar] [CrossRef]
- Li, X.; Zhang, Q.; Zhang, Y.; Zheng, B.; Wang, K.; Chen, Y.; Wallington, T.J.; Han, W.; Shen, W.; Zhang, X.; et al. Source contributions of urban PM2.5 in the Beijing-Tianjin-Hebei region: Changes between 2006 and 2013 and relative impacts of emissions and meteorology. Atmos. Environ. 2015, 123, 229–239. [Google Scholar] [CrossRef] [Green Version]
- Li, X.; Zhang, Q.; Zhang, Y.; Zhang, L.; Wang, Y.; Zhang, Q.; Li, M.; Zheng, Y.; Geng, G.; Wallington, T.J.; et al. Attribution of PM2.5 exposure in Beijing-Tianjin-Hebei region to emissions: Implication to control strategies. Sci. Bull. 2017, 62, 957–964. [Google Scholar] [CrossRef] [Green Version]
- Li, R.; Mei, X.; Wei, L.; Han, X.; Zhang, M.; Jing, Y. Study on the contribution of transport to PM2.5 in typical regions of China using the regional air quality model RAMS-CMAQ. Atmos. Environ. 2019, 214, 116856. [Google Scholar] [CrossRef]
- Li, D.; Liu, J.; Zhang, J.; Gui, H.; Du, P.; Yu, T.; Wang, J.; Lu, Y.; Liu, W.; Cheng, Y. Identification of long-range transport pathways and potential sources of PM2.5 and PM10 in Beijing from 2014 to 2015. J. Environ. Sci. 2017, 56, 214–229. [Google Scholar] [CrossRef]
- Jiang, C.; Wang, H.; Zhao, T.; Li, T.; Che, H. Modeling study of PM2.5 pollutant transport across cities in China’s Jing-Jin-Ji region during a severe haze episode in December 2013. Atmos. Chem. Phys. 2015, 15, 5803–5814. [Google Scholar] [CrossRef] [Green Version]
- Chang, X.; Wang, S.; Zhao, B.; Cai, S.; Hao, J. Assessment of inter-city transport of particulate matter in the Beijing-Tianjin-Hebei region. Atmos. Chem. Phys. 2018, 18, 4843–4858. [Google Scholar] [CrossRef]
- Chen, D.; Liu, X.; Lang, J.; Zhou, Y.; Wei, L.; Wang, X.; Guo, X. Estimating the contribution of regional transport to PM2.5 air pollution in a rural area on the North China Plain. Sci. Total Environ. 2017, 583, 280–291. [Google Scholar] [CrossRef] [PubMed]
- Chang, X.; Wang, S.; Zhao, B.; Xing, J.; Liu, X.; Wei, L.; Song, Y.; Wu, W.; Cai, S.; Zheng, H.; et al. Contributions of inter-city and regional transport to PM2.5 concentrations in the Beijing-Tianjin-Hebei region and its implications on regional joint air pollution control. Sci. Total Environ. 2019, 660, 1191–1200. [Google Scholar] [CrossRef] [PubMed]
- Wang, Z.; Li, J.; Wang, Z.; Yang, W.; Tang, X.; Ge, B.; Yan, P.; Zhu, L.; Chen, X.; Chen, H.; et al. Modeling study of regional severe hazes over mid-eastern China in January 2013 and its implications on pollution prevention and control. Sci. China Earth Sci. 2014, 57, 3–13. [Google Scholar] [CrossRef]
- Ying, Q.; Wu, L.; Zhang, H. Local and inter-regional contributions to PM2.5 nitrate and sulfate in China. Atmos. Environ. 2014, 94, 582–592. [Google Scholar] [CrossRef]
- Hua, Y.; Wang, S.; Wang, J.; Jiang, J.; Zhang, T.; Song, Y.; Kang, L.; Zhou, W.; Cai, R.; Wu, D.; et al. Investigating the impact of regional transport on PM2.5 formation using vertical observation during APEC 2014 Summit in Beijing. Atmos. Chem. Phys. 2016, 16, 15451–15460. [Google Scholar] [CrossRef] [Green Version]
- Zhao, N.; Wang, G.; Li, G.; Lang, J.; Zhang, H. Air pollution episodes during the COVID-19 outbreak in the Beijing-Tianjin-Hebei region of China: An insight into the transport pathways and source distribution. Environ. Pollut. 2020, 267, 115617. [Google Scholar] [CrossRef]
- Zhang, Y.; Li, X.; Nie, T.; Qi, J.; Chen, J.; Wu, Q. Source apportionment of PM2.5 pollution in the central six districts of Beijing, China. J. Clean. Prod. 2018, 174, 661–669. [Google Scholar] [CrossRef]
- Chuang, M.T.; Lee, C.T.; Hsu, H.C. Quantifying PM2.5 from long-range transport and local pollution in Taiwan during winter monsoon: An efficient estimation method. J. Environ. Manag. 2018, 227, 10–22. [Google Scholar] [CrossRef]
- Wang, Y.; Bao, S.; Wang, S.; Hu, Y.; Shi, X.; Wang, J.; Zhao, B.; Jiang, J.; Zheng, M.; Wu, M.; et al. Local and regional contributions to fine particulate matter in Beijing during heavy haze episodes. Sci. Total Environ. 2017, 580, 283–296. [Google Scholar] [CrossRef]
- Lang, J.; Cheng, S.; Li, J.; Chen, D.; Zhou, Y.; Wei, X.; Han, L.; Wang, H. A Monitoring and Modeling Study to Investigate Regional Transport and Characteristics of PM2.5 Pollution. Aerosol Air Qual. Res. 2013, 13, 943–956. [Google Scholar] [CrossRef] [Green Version]
- Wang, Y.L.; Xue, W.B.; Lei, Y.; Wang, J.N.; Wu, W.L. Regional Transport Matrix Study of PM2.5 in Jingjinji Region, 2015. Environ. Sci. 2017, 38, 4897–4904. [Google Scholar] [CrossRef]
- Dong, Z.; Wang, S.; Xing, J.; Chang, X.; Ding, D.; Zheng, H. Regional transport in Beijing-Tianjin-Hebei region and its changes during 2014–2017: The impacts of meteorology and emission reduction. Sci. Total Environ. 2020, 737, 139792. [Google Scholar] [CrossRef] [PubMed]
- Chen, D.; Xia, L.; Guo, X.; Lang, J.; Zhou, Y.; Wei, L.; Fu, X. Impact of inter-annual meteorological variation from 2001 to 2015 on the contribution of regional transport to PM2.5 in Beijing, China. Atmos. Environ. 2021, 260, 118545. [Google Scholar] [CrossRef]
- Zhou, Y.; Xing, X.F.; Lang, J.L.; Chen, D.S.; Cheng, S.Y.; Wei, L.; Wei, X.; Liu, C. A comprehensive biomass burning emission inventory with high spatial and temporal resolution in China. Atmos. Chem. Phys. 2017, 17, 2839–2864. [Google Scholar] [CrossRef] [Green Version]
- Lin, Y.L.; Farley, R.D.; Orville, H.D. Bulk Parameterization of the Snow Field in a Cloud Model. J. Clim. Appl. Meteorol. 1983, 22, 1065–1092. [Google Scholar] [CrossRef] [Green Version]
- Ek, M.B.; Mitchell, K.E.; Lin, Y.; Rogers, E.; Grunmann, P.; Koren, V.; Gayno, G.; Tarpley, J.D. Implementation of Noah land surface model advances in the National Centers for Environmental Prediction operational mesoscale Eta model. J. Geophys. Res. Atmos. 2003, 108, 8851. [Google Scholar] [CrossRef]
- Hong, S.-Y.; Noh, Y.; Dudhia, J. A new vertical diffusion package with an explicit treatment of entrainment processes. Mon. Weather Rev. 2006, 134, 2318–2341. [Google Scholar] [CrossRef] [Green Version]
- Sarwar, G.; Luecken, D.; Yarwood, G.; Whitten, G.Z.; Carter, W.P.L. Impact of an updated carbon bond mechanism on predictions from the CMAQ modeling system: Preliminary assessment. J. Appl. Meteorol. Clim. 2008, 47, 3–14. [Google Scholar] [CrossRef]
- Whitten, G.Z.; Heo, G.; Kimura, Y.; Mcdonald-Buller, E.; Allen, D.T.; Carter, W.P.L.; Yarwood, G. A new condensed toluene mechanism for Carbon Bond CB05-TU. Atmos. Environ. 2010, 44, 5346–5355. [Google Scholar] [CrossRef]
- Kwok, R.H.F.; Napelenok, S.L.; Baker, K.R. Implementation and evaluation of PM2.5 source contribution analysis in a photochemical model. Atmos. Environ. 2013, 80, 398–407. [Google Scholar] [CrossRef]
- Chen, D.S.; Liang, D.Y.; Li, L.; Guo, X.R.; Lang, J.L.; Zhou, Y. The Temporal and Spatial Changes of Ship-Contributed PM2.5 Due to the Inter-Annual Meteorological Variation in Yangtze River Delta, China. Atmosphere 2021, 12, 722. [Google Scholar] [CrossRef]
- Chen, D.; Fu, X.; Guo, X.; Lang, J.; Zhou, Y.; Li, Y.; Liu, B.; Wang, W. The impact of ship emissions on nitrogen and sulfur deposition in China. Sci. Total Environ. 2020, 708, 134636. [Google Scholar] [CrossRef] [PubMed]
- Chen, D.S.; Cheng, S.Y.; Zhou, Y.; Guo, X.R.; Fan, S.B.; Wang, H.Y. Impact of Road Fugitive Dust on Air Quality in Beijing, China. Environ. Eng. Sci. 2010, 27, 825–834. [Google Scholar] [CrossRef]
- Chen, D.S.; Cheng, S.Y.; Liu, L.; Lei, T.; Guo, X.R.; Zhao, X.Y. Assessment of the integrated ARPS-CMAQ modeling system through simulating PM10 concentration in Beijing, China. Environ. Eng. Sci. 2008, 25, 191–205. [Google Scholar] [CrossRef]
- Chen, D.S.; Cheng, S.Y.; Liu, L.; Chen, T.; Guo, X.R. An integrated MM5-CMAQ modeling approach for assessing trans-boundary PM10 contribution to the host city of 2008 Olympic summer games—Beijing, China. Atmos. Environ. 2007, 41, 1237–1250. [Google Scholar] [CrossRef]
- Wang, L.T.; Wei, Z.; Wei, W.; Fu, J.S.; Meng, C.C.; Ma, S.M. Source apportionment of PM2.5 in top polluted cities in Hebei, China using the CMAQ model. Atmos. Environ. 2015, 122, 723–736. [Google Scholar] [CrossRef]
- Han, X.; Zhang, M.G.; Skorokhod, A.; Kou, X.X. Modeling dry deposition of reactive nitrogen in China with RAMS-CMAQ. Atmos. Environ. 2017, 166, 47–61. [Google Scholar] [CrossRef]
- Napelenok, S.L.; Vedantham, R.; Bhave, P.V.; Pouliot, G.A.; Kwok, R.H.F. Source-receptor reconciliation of fine-particulate emissions from residential wood combustion in the southeastern United States. Atmos. Environ. 2014, 98, 454–460. [Google Scholar] [CrossRef]
- Lu, Y.L.; Chi, J.W.; Yao, L.; Yang, L.X.; Li, W.J.; Wang, Z.F.; Wang, W.X. Composition and mixing state of water soluble inorganic ions during hazy days in a background region of North China. Sci. China Earth Sci. 2015, 58, 2026–2033. [Google Scholar] [CrossRef]
- China Meteorological Administration. Available online: http://data.cma.cn/ (accessed on 21 April 2022).
- Ministry of Ecology and Environmental of the People’s Republic. Ecological and Environmental Bulletin. Available online: http://www.mee.gov.cn/hjzl/ (accessed on 21 April 2022).
- Boylan, J.W.; Russell, A.G. PM and light extinction model performance metrics, goals, and criteria for three-dimensional air quality models. Atmos. Environ. 2006, 40, 4946–4959. [Google Scholar] [CrossRef]
- Zheng, B.; Huo, H.; Zhang, Q.; Yao, Z.L.; Wang, X.T.; Yang, X.F.; Liu, H.; He, K.B. High-resolution mapping of vehicle emissions in China in 2008. Atmos. Chem. Phys. 2014, 14, 9787–9805. [Google Scholar] [CrossRef] [Green Version]
- Liu, F.; Zhang, Q.; Tong, D.; Zheng, B.; Li, M.; Huo, H.; He, K.B. High-resolution inventory of technologies, activities, and emissions of coal-fired power plants in China from 1990 to 2010. Atmos. Chem. Phys. 2015, 15, 13299–13317. [Google Scholar] [CrossRef] [Green Version]
- Li, M.; Zhang, Q.; Streets, D.G.; He, K.B.; Cheng, Y.F.; Emmons, L.K.; Huo, H.; Kang, S.C.; Lu, Z.; Shao, M.; et al. Mapping Asian anthropogenic emissions of non-methane volatile organic compounds to multiple chemical mechanisms. Atmos. Chem. Phys. 2014, 14, 5617–5638. [Google Scholar] [CrossRef] [Green Version]




| Parameters | Month | MB 1 | MAE 2 | NMB 3 (%) | NME 4 (%) | R 5 |
|---|---|---|---|---|---|---|
| T2 (Temperature at 2 m) unit: °C | January | 0.93 | 1.63 | 6.23 | 3.37 | 0.87 |
| April | 1.67 | 2.83 | 10.70 | 17.93 | 0.83 | |
| July | 4.37 | 4.67 | 16.50 | 17.43 | 0.83 | |
| October | 2.33 | 3.03 | 17.53 | 22.10 | 0.90 | |
| RH2 (Relative humidity at 2 m) unit: % | January | −6.67 | 13.60 | −12.73 | 24.60 | 0.80 |
| April | −6.83 | 11.13 | −13.60 | 24.33 | 0.73 | |
| July | −13.73 | 15.83 | −13.93 | 18.87 | 0.80 | |
| October | −12.67 | 17.13 | −18.13 | 24.73 | 0.77 | |
| WS10 (Wind speed at 10 m) unit: m/s | January | 0.07 | 0.70 | −3.20 | 30.43 | 0.70 |
| April | 0.23 | 0.50 | 15.50 | 32.53 | 0.70 | |
| July | 0.47 | 0.63 | 15.57 | 29.90 | 0.70 | |
| October | 0.27 | 0.50 | 17.40 | 32.97 | 0.70 |
| Species | Month | NMB (%) | NME (%) | MFB 6 (%) | MFE 7 (%) | R |
|---|---|---|---|---|---|---|
| January | −9.41 | 19.54 | −6.59 | 10.25 | 0.79 | |
| PM2.5 | April | −7.99 | 16.01 | −5.61 | 10.49 | 0.83 |
| (μg/m3) | July | 1.10 | 21.07 | −5.30 | 11.97 | 0.83 |
| October | −9.58 | 18.12 | −5.57 | 8.31 | 0.89 |
| Year | BJ | TJ | HD | XT | HS | SJZ | CZ | LF | BD | TS | QHD | CD | ZJK |
|---|---|---|---|---|---|---|---|---|---|---|---|---|---|
| 2010 | 87.1 | 91.1 | 135.7 | 115.0 | 109.4 | 141.0 | 110.6 | 103.4 | 138.6 | 98.0 | 61.5 | 57.5 | 29.8 |
| 2011 | 75.4 | 83.8 | 120.5 | 106.5 | 98.0 | 125.5 | 90.3 | 92.1 | 121.2 | 79.2 | 56.1 | 47.5 | 27.7 |
| 2012 | 75.5 | 76.4 | 120.8 | 100.0 | 89.5 | 126.2 | 84.9 | 82.8 | 131.8 | 81.3 | 54.4 | 47.9 | 26.9 |
| 2013 | 103.4 | 99.1 | 149.3 | 127.0 | 119.5 | 161.1 | 121.8 | 118.0 | 169.1 | 102.0 | 67.2 | 53.0 | 33.6 |
| 2014 | 92.4 | 95.5 | 125.6 | 111.7 | 98.8 | 133.5 | 104.4 | 107.5 | 149.5 | 104.3 | 72.5 | 62.8 | 35.3 |
| 2015 | 78.1 | 86.9 | 115.1 | 96.7 | 91.5 | 122.3 | 91.8 | 93.1 | 128.9 | 95.6 | 65.1 | 50.5 | 33.3 |
| 2016 | 71.1 | 73.8 | 116.3 | 100.9 | 87.4 | 121.2 | 76.0 | 79.1 | 128.8 | 78.1 | 52.6 | 47.7 | 28.6 |
| 2017 | 99.1 | 97.9 | 121.8 | 101.3 | 98.4 | 122.8 | 97.8 | 105.5 | 137.4 | 108.8 | 72.3 | 64.0 | 34.6 |
| 2018 | 94.8 | 111.3 | 104.8 | 88.7 | 83.7 | 113.5 | 92.0 | 101.2 | 112.0 | 116.5 | 87.8 | 53.0 | 23.4 |
| 2019 | 80.4 | 84.6 | 110.0 | 94.1 | 87.0 | 114.7 | 87.5 | 91.6 | 126.7 | 96.6 | 63.7 | 52.6 | 27.7 |
| Average | 85.7 | 90.0 | 122.0 | 104.2 | 96.3 | 128.2 | 95.7 | 97.4 | 134.4 | 96.0 | 65.3 | 53.6 | 30.1 |
| Fluctuation (%) | 37.7 | 41.6 | 49.5 | 36.8 | 37.2 | 54.1 | 47.9 | 39.9 | 52.8 | 40.0 | 53.9 | 30.8 | 39.6 |
Publisher’s Note: MDPI stays neutral with regard to jurisdictional claims in published maps and institutional affiliations. |
© 2022 by the authors. Licensee MDPI, Basel, Switzerland. This article is an open access article distributed under the terms and conditions of the Creative Commons Attribution (CC BY) license (https://creativecommons.org/licenses/by/4.0/).
Share and Cite
Chen, D.; Jin, X.; Fu, X.; Xia, L.; Guo, X.; Lang, J.; Zhou, Y.; Wei, W. Impact of Inter-Annual Variation in Meteorology from 2010 to 2019 on the Inter-City Transport of PM2.5 in the Beijing–Tianjin–Hebei Region. Sustainability 2022, 14, 6210. https://doi.org/10.3390/su14106210
Chen D, Jin X, Fu X, Xia L, Guo X, Lang J, Zhou Y, Wei W. Impact of Inter-Annual Variation in Meteorology from 2010 to 2019 on the Inter-City Transport of PM2.5 in the Beijing–Tianjin–Hebei Region. Sustainability. 2022; 14(10):6210. https://doi.org/10.3390/su14106210
Chicago/Turabian StyleChen, Dongsheng, Xin Jin, Xinyi Fu, Lin Xia, Xiurui Guo, Jianlei Lang, Ying Zhou, and Wei Wei. 2022. "Impact of Inter-Annual Variation in Meteorology from 2010 to 2019 on the Inter-City Transport of PM2.5 in the Beijing–Tianjin–Hebei Region" Sustainability 14, no. 10: 6210. https://doi.org/10.3390/su14106210
APA StyleChen, D., Jin, X., Fu, X., Xia, L., Guo, X., Lang, J., Zhou, Y., & Wei, W. (2022). Impact of Inter-Annual Variation in Meteorology from 2010 to 2019 on the Inter-City Transport of PM2.5 in the Beijing–Tianjin–Hebei Region. Sustainability, 14(10), 6210. https://doi.org/10.3390/su14106210


