Article

Interprovincial Differences in Air Pollution in the Background of China’s Carbon Neutrality Target

1
Hubei Key Laboratory of Regional Development and Environmental Response, Hubei University, Wuhan 430062, China
2
Hubei Key Laboratory of Petroleum Geochemistry and Environment, Wuhan 430100, China
3
College of Resources and Environment, Yangtze University, Wuhan 430100, China
4
Hubei Ecological Environment Monitoring Center Station, Wuhan 430070, China
*
Authors to whom correspondence should be addressed.
Sustainability 2022, 14(10), 6200; https://doi.org/10.3390/su14106200
Submission received: 28 March 2022 / Revised: 12 May 2022 / Accepted: 17 May 2022 / Published: 19 May 2022
(This article belongs to the Special Issue Land Use Change, Air Quality and Environmental Pollution Government)

Abstract

:
Increasing air pollution, particularly in terms of fine particulate matter (PM2.5) and ozone (O3), caused by large-scale fossil fuel combustion, affects human health and economic activities in China. In this study, we analyzed the spatiotemporal trends of carbon emissions, carbon emission intensity, and concentrations of PM2.5 and O3 in 30 provincial-level administrative regions of China during 2010–2019. Overall, an increasing trend was observed in carbon emissions, with high emissions occurring in Shandong, Hebei, and Jiangsu in particular. The highest growth rates of carbon emissions were 169% and 117% in Xinjiang and Ningxia, respectively. Conversely, the carbon emission intensities and concentrations of PM2.5 and O3 decreased across the study regions at different rates. The western and central regions experienced the greatest decrease in carbon emissions in 2019 compared with that of 2010, followed by those in the northeastern and eastern regions. Spatiotemporal variations suggest that pollution control is essential for improving air quality and offsetting the negative impact of increased energy consumption. Overall, this study shows that pollution control policies lead to short-term improvements in air quality, and hence that the implementation of stringent environmental protection policies is essential.

1. Introduction

China’s economy has developed rapidly due to the implementation of reforms and the opening up of the economy. The average annual GDP growth rate was >8% from 2001 to 2007, and China overtook Japan to become the second largest economy in the world in 2010. Regional air pollution, characterized by excessive concentrations of PM2.5 and O3, severely affects the economic development and social harmony of China. Similar to other parts of the world, China is facing challenges related to both air pollution and climate change, and it is under pressure to reduce carbon emissions and combat air pollution. The massive use of fossil fuels is a major source of greenhouse gases and air pollutant emissions, and therefore, it has attained significant attention. Air pollutants such as PM2.5 and O3 affect both human health and economic activity. In 2019, a study on the global burden of disease found that the number of premature deaths in China exceeded 7 million, whereof 26% were attributed to exposure to PM2.5 and O3 [1]. Reducing carbon emissions is also essential in China, as it has emitted the greatest amount of carbon of all countries since 2007. Air quality can be effectively improved by pursuing strategies to reduce GHG emissions, and the resulting environmental benefits can reduce the costs of abatement technologies [2].
Several domestic and foreign scholars have examined the characteristics of regional carbon emissions from agriculture [3,4,5,6], manufacturing [7], transportation [8,9], and tourism [10]. Specifically, research on total carbon emissions and carbon emission intensities has focused on accounting methods, spatial distribution, and evolutionary trends. For example, Greening et al. [11] evaluated the carbon emission intensities of different sectors in 10 OECD countries using an adaptively-weighted Divisia index. Xia et al. [12] analyzed regional differences and spatiotemporal patterns of the intensity of carbon emissions from agricultural sources in China from 1997 to 2016, to predict the trend of emission evolution based on rescaled range analysis. Han et al. [13] measured total carbon emissions and intensities across various provinces in China from 2005 to 2017 based on the Theil index and Tapio model, identifying regional differences and the evolution of decoupling trends. Wang et al. [14] used the logarithmic mean Divisia method to decompose ten drivers of carbon emissions in 56 industries in India, in order to verify whether technological progress is a suitable strategy to decrease carbon emissions. Because of the severely increasing trend in global climate change, many studies focused on neutralizing carbon emissions, i.e., through carbon sinks. For example, Zhu et al. [15] assessed carbon sequestration in the Liaoning province during 2000–2014 and found that it gradually decreased from the northeast to the southwest. Ghaffar et al. [16] studied the relationship between economic development, carbon emissions, carbon sinks, and land use change in the Bangkok metropolitan area of Thailand, and suggested that increasing public awareness on expanding green space, planting trees, and using public transportation is an effective bottom-up policy to protect the environment and mitigate climate change. However, reducing carbon emissions only for high-carbon emitting enterprises is inadequate to achieve China’s “double carbon” target of reaching the carbon peak by 2030 and achieving carbon neutrality by 2060, as all individuals are emission sources. Therefore, personal low-carbon behavior is important for reducing carbon emissions [17].
China’s revised Air Pollution Prevention and Control Law of August 2015, which gained notoriety as the “strictest air pollution prevention and control law in history”, proposed the synergistic control of air pollutants and greenhouse gases [18]. At present, China is in a critical transformation period of economic development. Therefore, an optimal response strategy for air pollution control, carbon emissions reduction, and multiple other objectives is necessary to synergistically control air pollutants and greenhouse gases. Development is not balanced among China’s regions, leading to significant differences in carbon and air pollutant emissions among them. The characteristics of emissions also vary regionally. Therefore, the current status and causes of carbon emissions and air pollution in different provincial regions must be explored to lay the foundation for a future analysis of emissions to formulate specific policies for regional air governance and carbon emission reduction. According to China’s ecological environment status bulletin for the period 2014–2019 [19], PM2.5 and O3 were the primary pollutants on 45.0% and 41.7% of the total number of days when air pollution standards were exceeded (exceeding days), respectively. In 2020, PM2.5 and O3 were the primary pollutants on 51.0% and 37.1% of the exceeding days, respectively. Therefore, PM2.5 and O3 are the primary air pollutants in China. We measured the spatial and temporal trends of carbon emissions, carbon intensity, PM2.5, and O3 in 30 Chinese provinces from 2010 to 2019 using PM2.5 and O3 as representative air pollutants to explore the intrinsic linkage between them. We expect that the results of this study will enable the formulation and implementation of regionally specific climate policies in China for the improvement of air quality and the mitigation of climate change.

2. Materials and Methods

2.1. Study Regions

This study focused on the spatial and temporal evolution patterns of carbon emissions and carbon intensity in 30 provincial administrative regions of China (excluding Tibet, Hong Kong, Macau, and Taiwan, for which data were not completely available) during 2010–2019. Based on social, economic, and human environments, these 30 provinces were grouped into four main regions: east, central, west, and northeast. The eastern region includes Beijing, Tianjin, Hebei, Shanghai, Jiangsu, Zhejiang, Fujian, Shandong, Guangdong, and Hainan. The central region includes Shanxi, Anhui, Jiangxi, Henan, Hubei, and Hunan. The western region includes Chongqing, Sichuan, Guizhou, Yunnan, Shaanxi, Gansu, Ningxia, Qinghai, Xinjiang, Guangxi, and Inner Mongolia, The northeastern region includes Heilongjiang, Jilin, and Liaoning. Reductions in the emissions of PM2.5 and O3 in the 30 provinces were also studied to explore the inter-relationship between carbon emissions and other atmospheric pollutants (Figure 1).

2.2. Measurement of Total Carbon Emission

The surface energy consumption estimation method [20] was used for measuring the total carbon emissions. Parameters for carbon emissions were calculated based on the 2006 IPCC report (Equation (1)) [21,22,23]:
E g = Σ j ( A C j × F j ) × ( N C V j × E F j × 44 12 × 10 3 )
where Eg represents carbon emissions (104 t); ACj is the consumption of fuel j (104 t or 108 m8); Fj is the reduced coal coefficient of fuel j; NCVj is the net calorific value of fuel j (GJ/t); EFj is the carbon content per unit calorific value of different fossil fuels (kg/DJ or tc/TJ); and 44 12 is the molecular weight ratio of CO2 to C that is used here as a unit conversion coefficient.

2.3. Measurement of Carbon Emission Intensity

Carbon emission intensity was assumed to be equal to the ratio of carbon dioxide emission to GDP (Equation (2)):
I c = E g / G D P
where I c is a number >0 that represents the level of carbon emission intensity (tC (10,000 yuan)−1), and GDP (100 million) is the gross domestic product of each province (city or region).

2.4. Inverse Distance Weighting Interpolation Method

The inverse distance weighting interpolation method was used to analyze the spatial distribution of carbon emission intensity in each of the 30 provincial administrative regions of China, as it is a convenient and practical spatial interpolation method. According to the spatial correlation of spatially distributed phenomena, the closer the sample points are to the interpolation point, the greater the given weight, and the contribution of the weight is inversely proportional to the distance [24], which is expressed as follows:
Z = i = 1 n 1 ( D i ) p Z i / i = 1 n 1 ( D i ) p
where Z is the interpolated point attribute value, Zi is the measured sample value, n is the number of known samples, Di is the distance between the interpolated point and the ith station, and p represents the effect of the distance.

2.5. Data Sources

All energy and economic indicators for the 30 provincial districts were acquired from the China Carbon Accounting Database (1997–2019) [25], and Statistical Yearbook (1996–2020) of the National Bureau of Statistics [26].
The data of PM2.5 and O3 air pollutants of interest were acquired from the Statistical Bulletins of Ecological Environmental Status published by corresponding provincial departments over the years [27].

3. Results

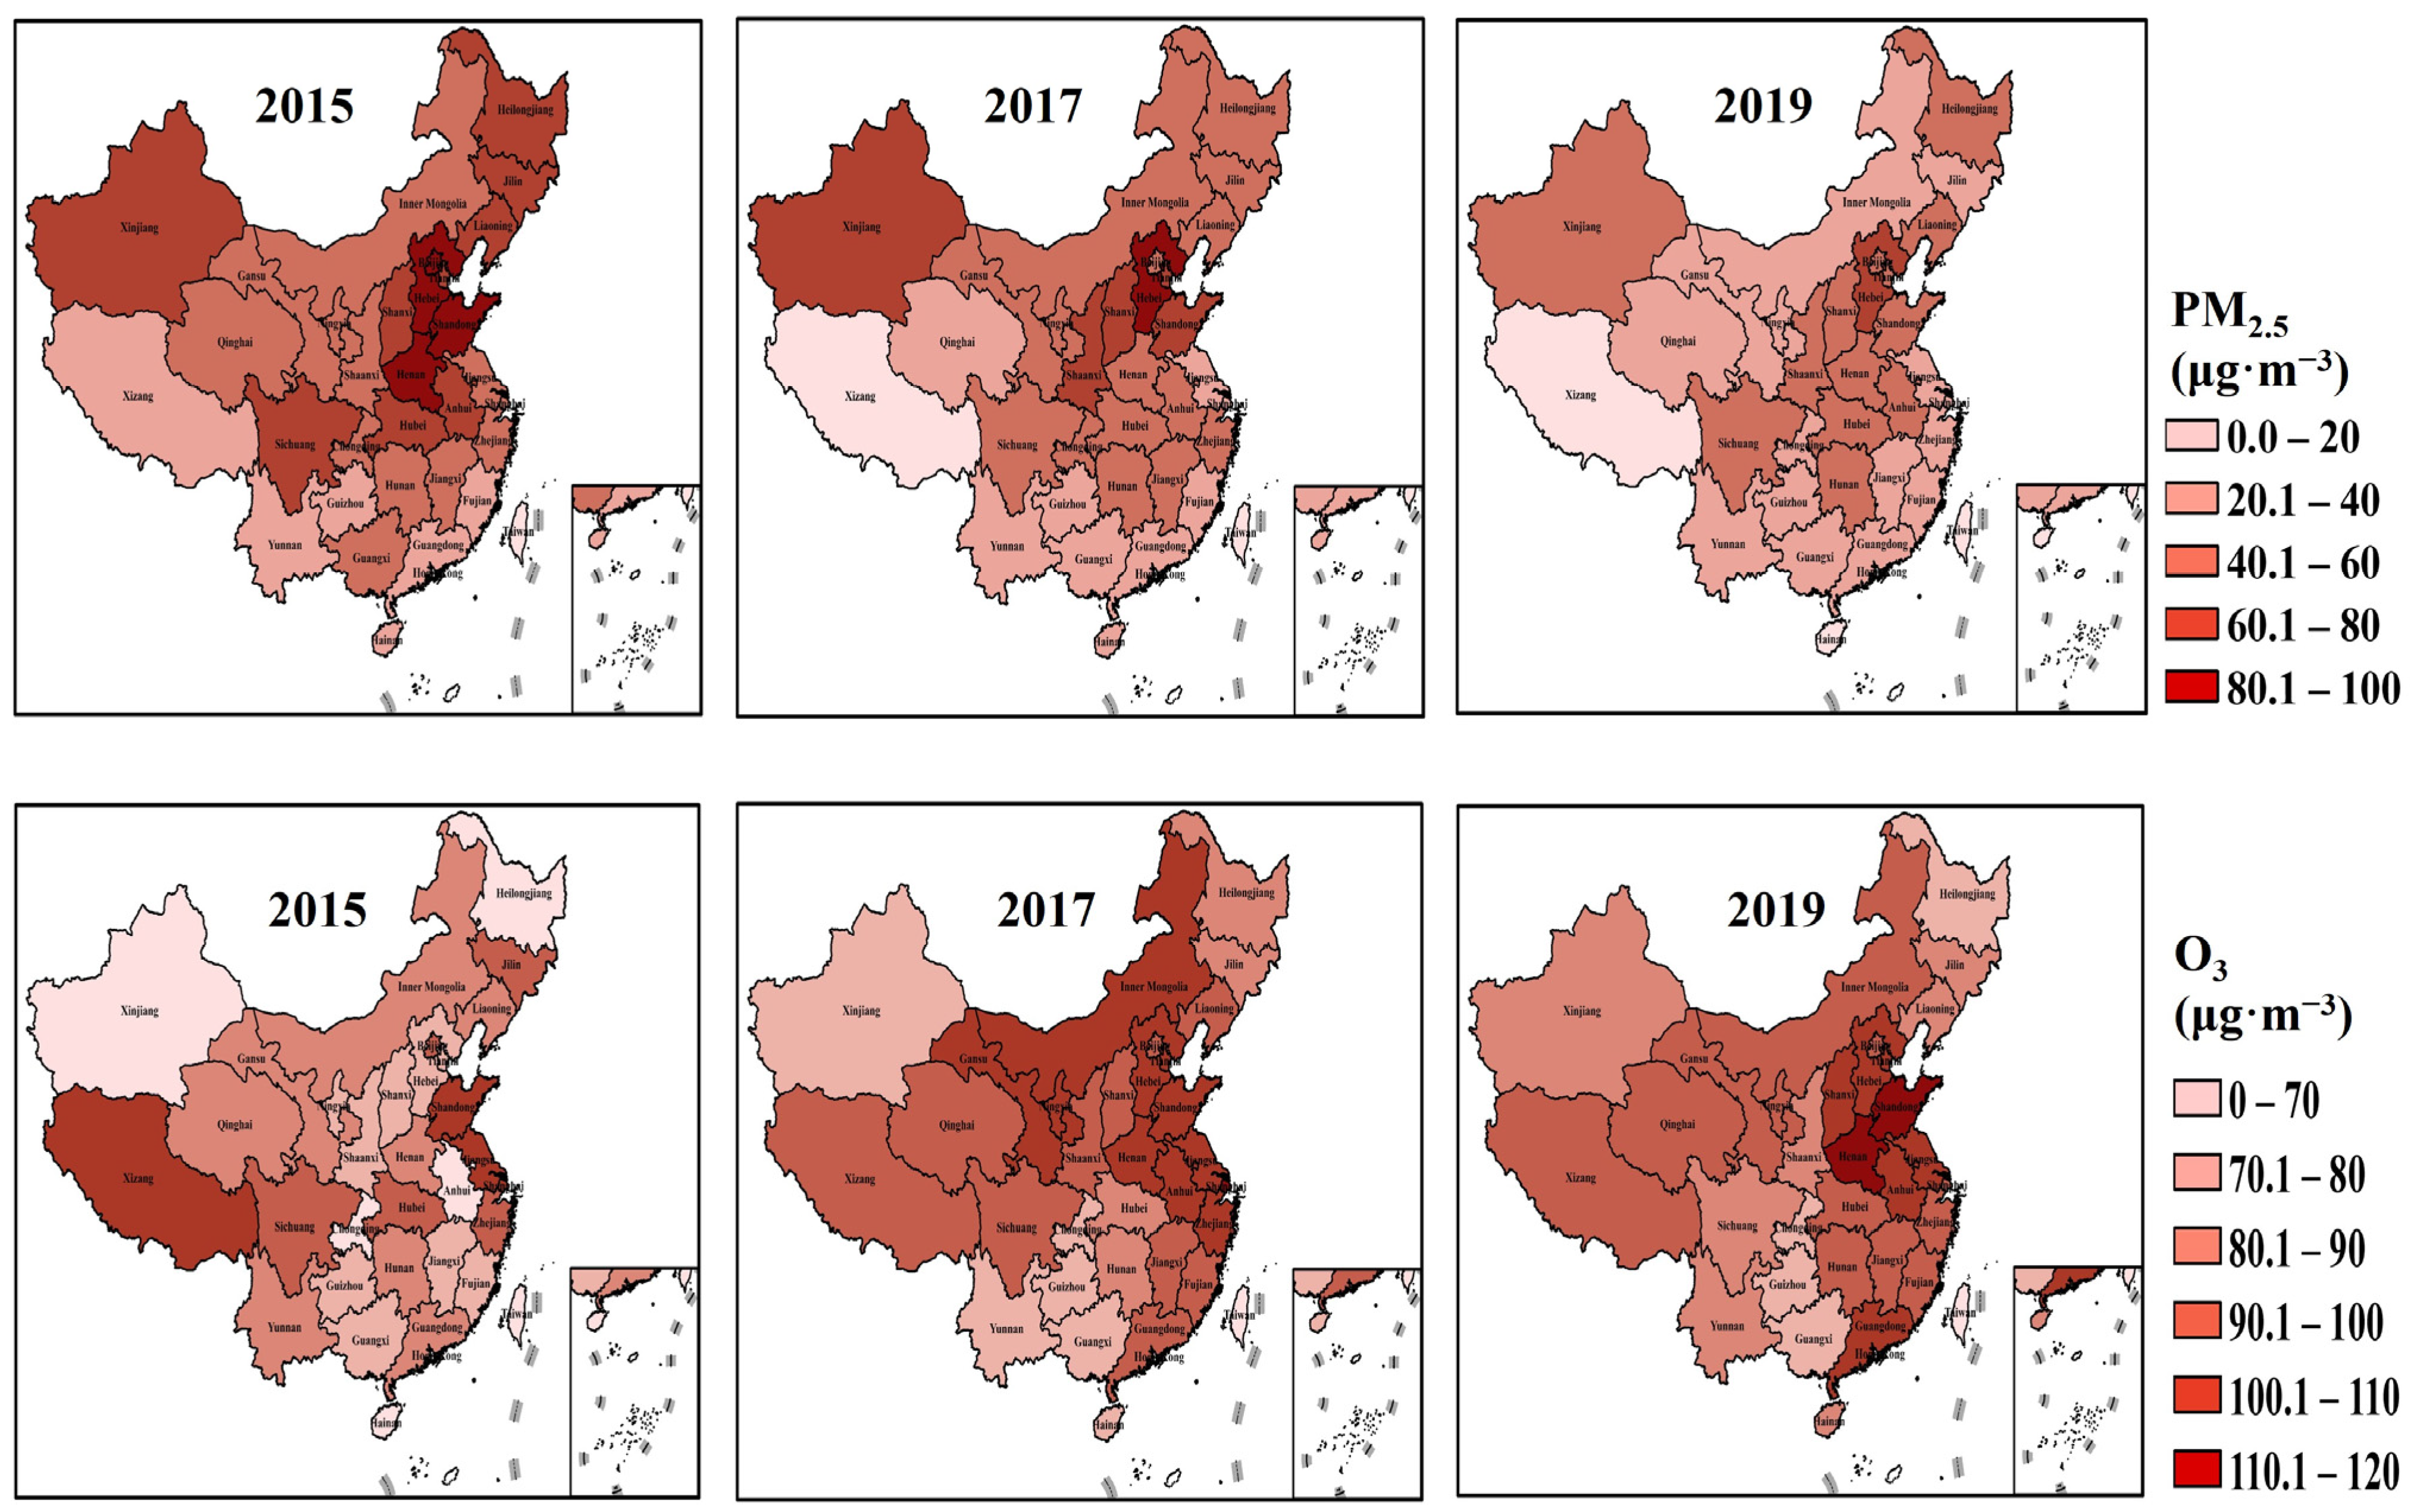
3.1. Spatial and Temporal Variation of Pollutants

In recent years, air quality has improved significantly in China because of the government’s efforts to combat pollution. According to the 13th Five-Year Plan for Ecological and Environmental Protection [28], cities at the prefecture level and above, which do not meet the annual average concentration of PM2.5, should reduce their annual concentration by 18% compared with that of the base year of 2015 by 2020. Accordingly, by the end of 2019, the annual average concentration of PM2.5 was reduced by 23.1%. However, the concentration of O3 increased by 10.4% in 2019 compared with 2015.
From 2015 to 2019, the concentration of PM2.5 in China decreased from 50 to 36 μg·m−3, with an average annual decrease of 7.88%, and the concentration of O3 increased from 134 to 148 μg·m−3, with an average annual increase of 2.51%. During 2015–2019, the annual average PM2.5 concentrations in 68.8% of the 30 provincial capitals in China exceeded the limit (35 μg·m−3) of the GB 3095-2012 secondary standard [29]. In 17.74% of the cities, the concentration of O3 was between the primary (100 μg·m−3) and secondary (160 μg·m−3) limits of the GB 3095-2012 standard. In general, the provinces are more polluted by PM2.5 than by O3.
The National Bureau of Statistics classifies the 30 provincial administrative regions in China into eastern, central, western and northeastern regions. As shown in Figure 2, the highest concentration of pollutants during 2015–2019 was in the eastern region, mainly concentrated in the Beijing–Tianjin–Hebei region, which is highly industrialized and has numerous pollutant emission sources. In addition, the surrounding mountain ranges in the Beijing–Tianjin–Hebei region hinder the transfer and diffusion of atmospheric pollutants, which results in heavy regional pollution. Because of the influence of topographic conditions, climatic factors, and human activities, O3 pollution is mainly concentrated in the eastern coastal areas of China and it gradually spreads to the central parts [30]. Since the provincial capital cities were chosen to represent the pollutant concentrations in this study, the concentrations of observed O3 were comparatively low; however, Guo et al. showed that the annual average O3 concentration in the cities exceeded the standard by 25.5% and 30.59% in 2015 and 2017, respectively [31], confirming the worsening pollution levels. The overall air pollutant concentrations in the western region are low because of the sparse population and underdeveloped economy; however, the air quality has gradually worsened even in this region in recent years.

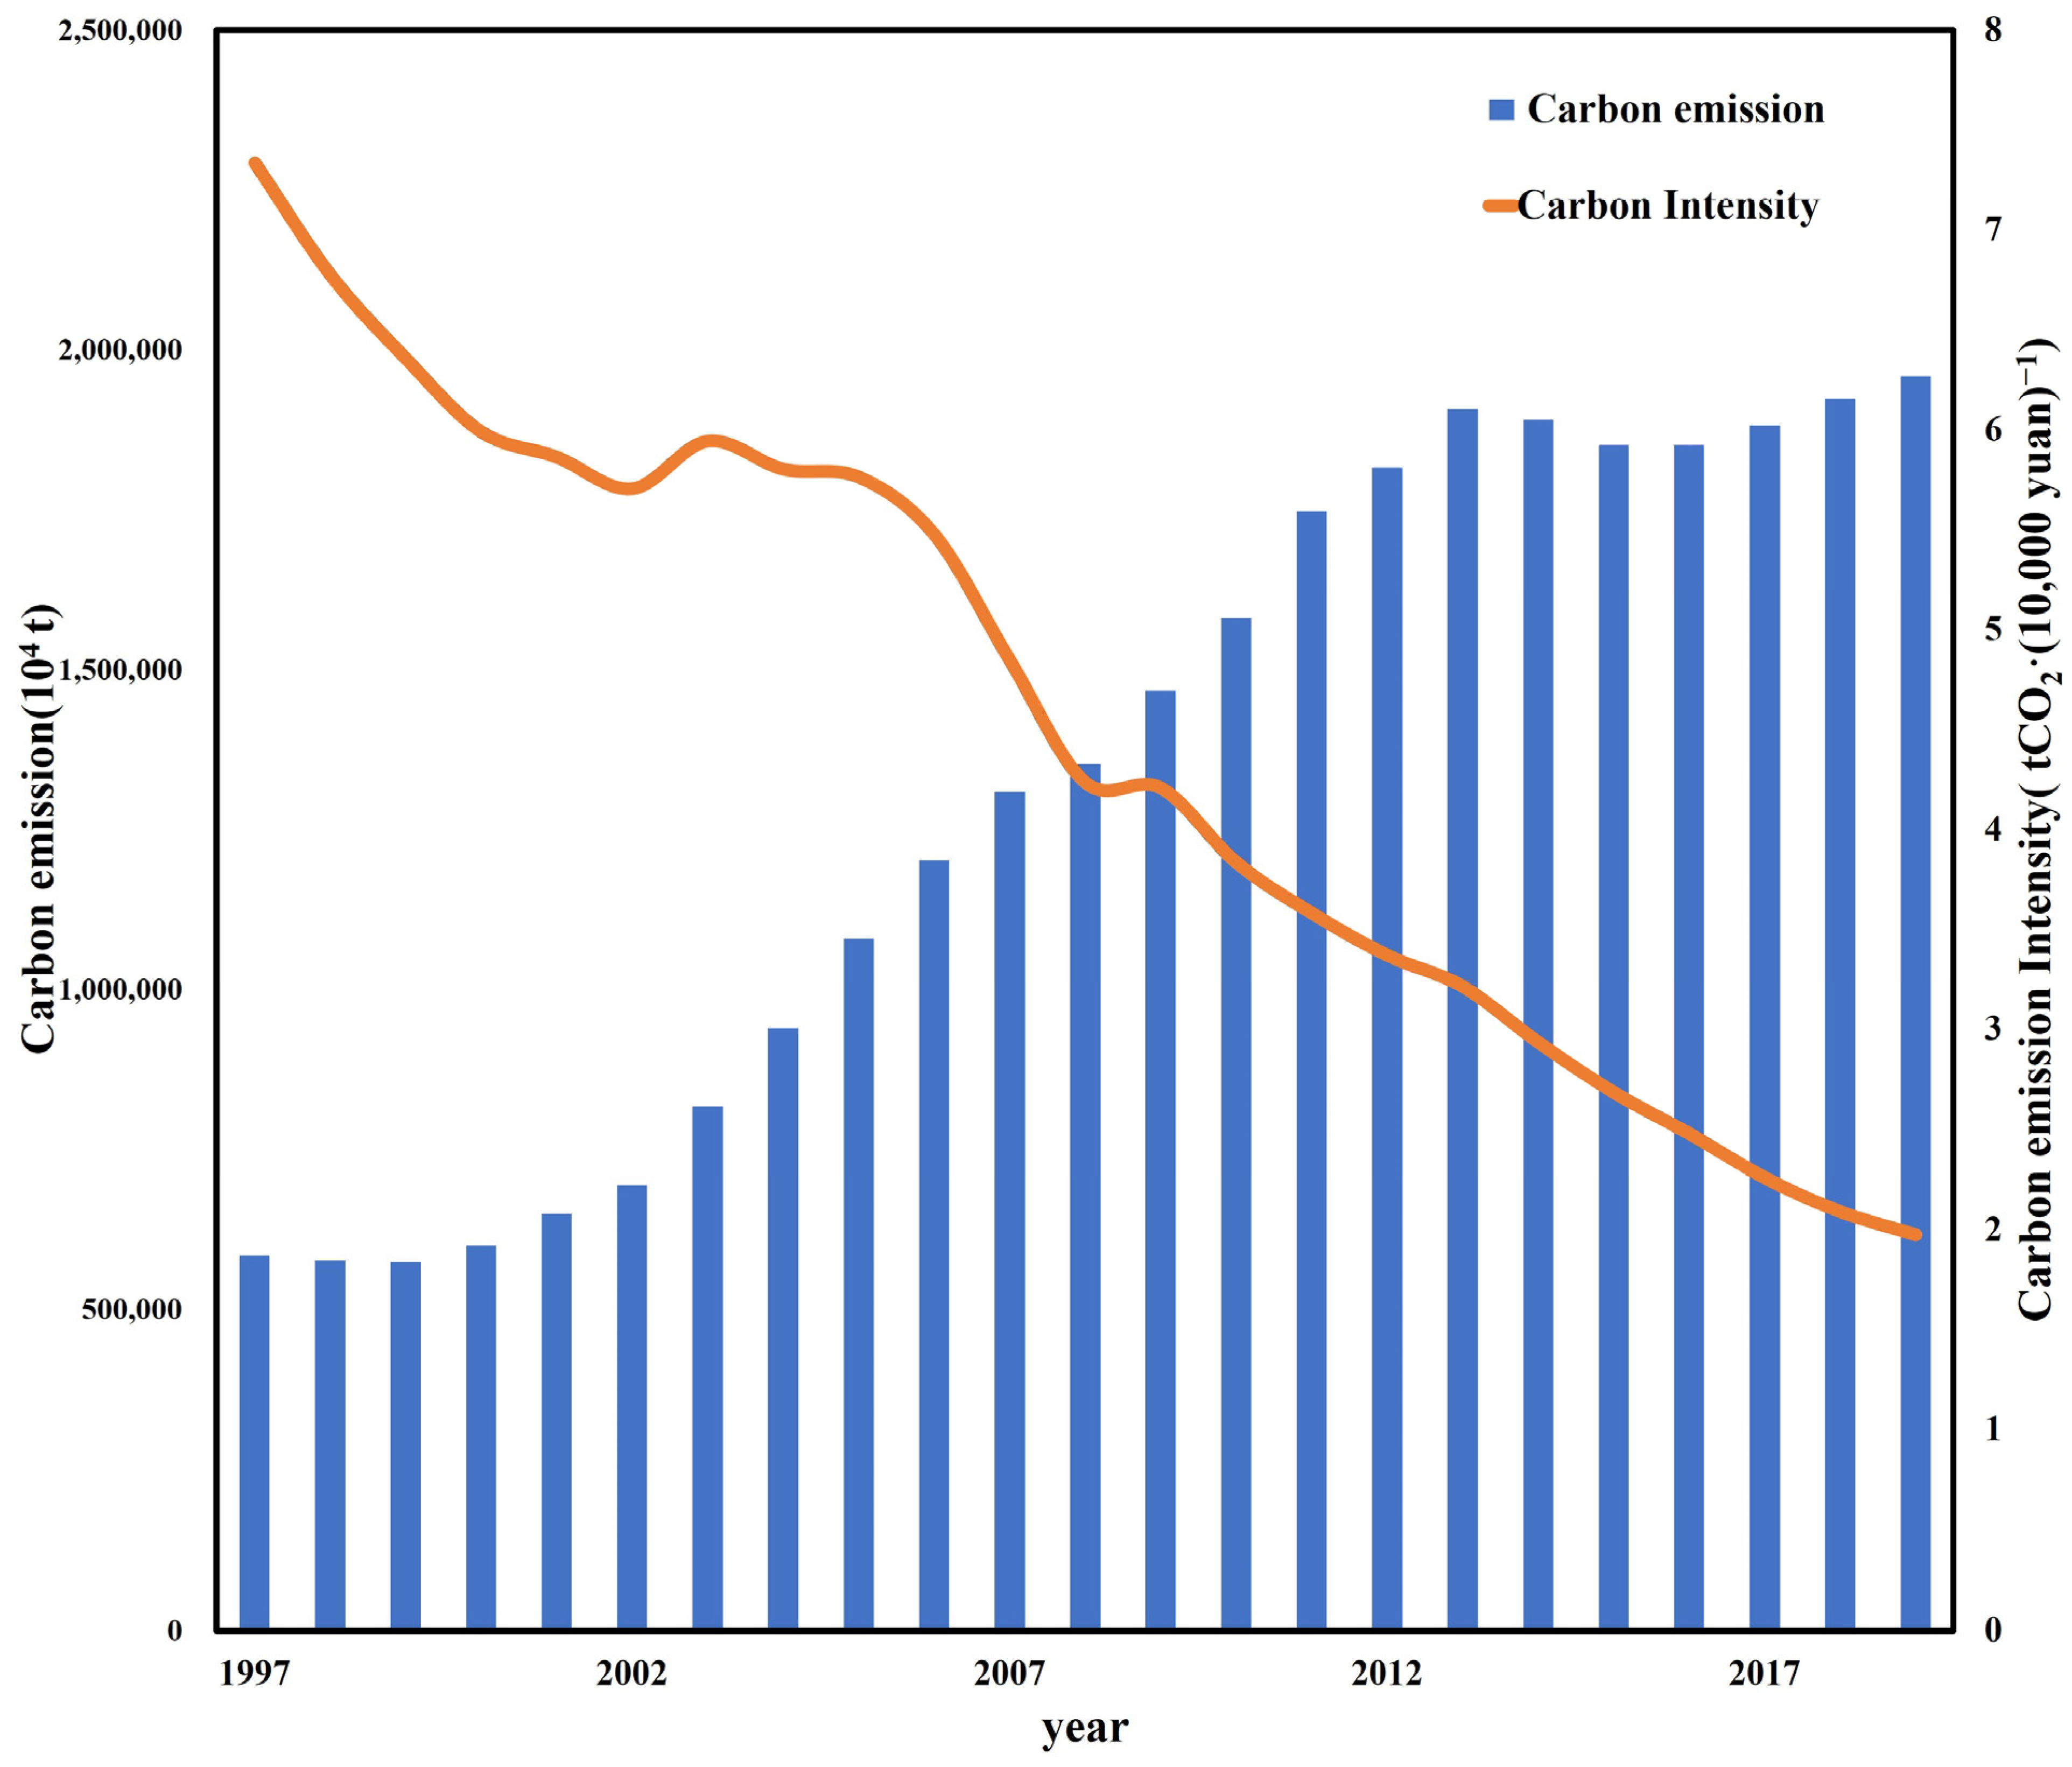
3.2. Temporal Variation of Carbon Emissions

The total carbon emissions and carbon emission intensities were estimated from 1997 to 2019 (Figure 3). Notably, from 1997 to 2000, annual carbon emissions increased from 302,603.86 to 321,406.90 104 t, with an annual growth rate of 2.03%. From 2001 to 2013, the total carbon emission increased substantially from 336,443.13 to 1,014,459.79 104 t, corresponding to an annual growth rate of 9.63%. From 2014 to 2019, the increase in emissions was from 1,001,306.54 to 1,043,484.48 104 t, which was the lowest, with an annual growth rate of 0.83%.
Overall, China’s carbon emissions increased annually during the study period. In contrast, the carbon emission intensity declined annually, especially after 2009, because of China’s emission reduction commitments at the Copenhagen Climate Change Conference [32]. The value of carbon intensity decreased from 3.80 t CO2·(10,000 yuan)−1 in 1997 to 1.05 t CO2·(10,000 yuan)−1 in 2019, representing a decrease of 72.37%. The total carbon emissions continued to increase because of China’s increasing need for economic and industrial development during 1997–2019. In contrast, during the same period, commitments made at Copenhagen in 2009 resulted in the active introduction and implementation of relevant carbon emission reduction policies and measures that have significantly reduced the intensity of carbon emissions [33,34].

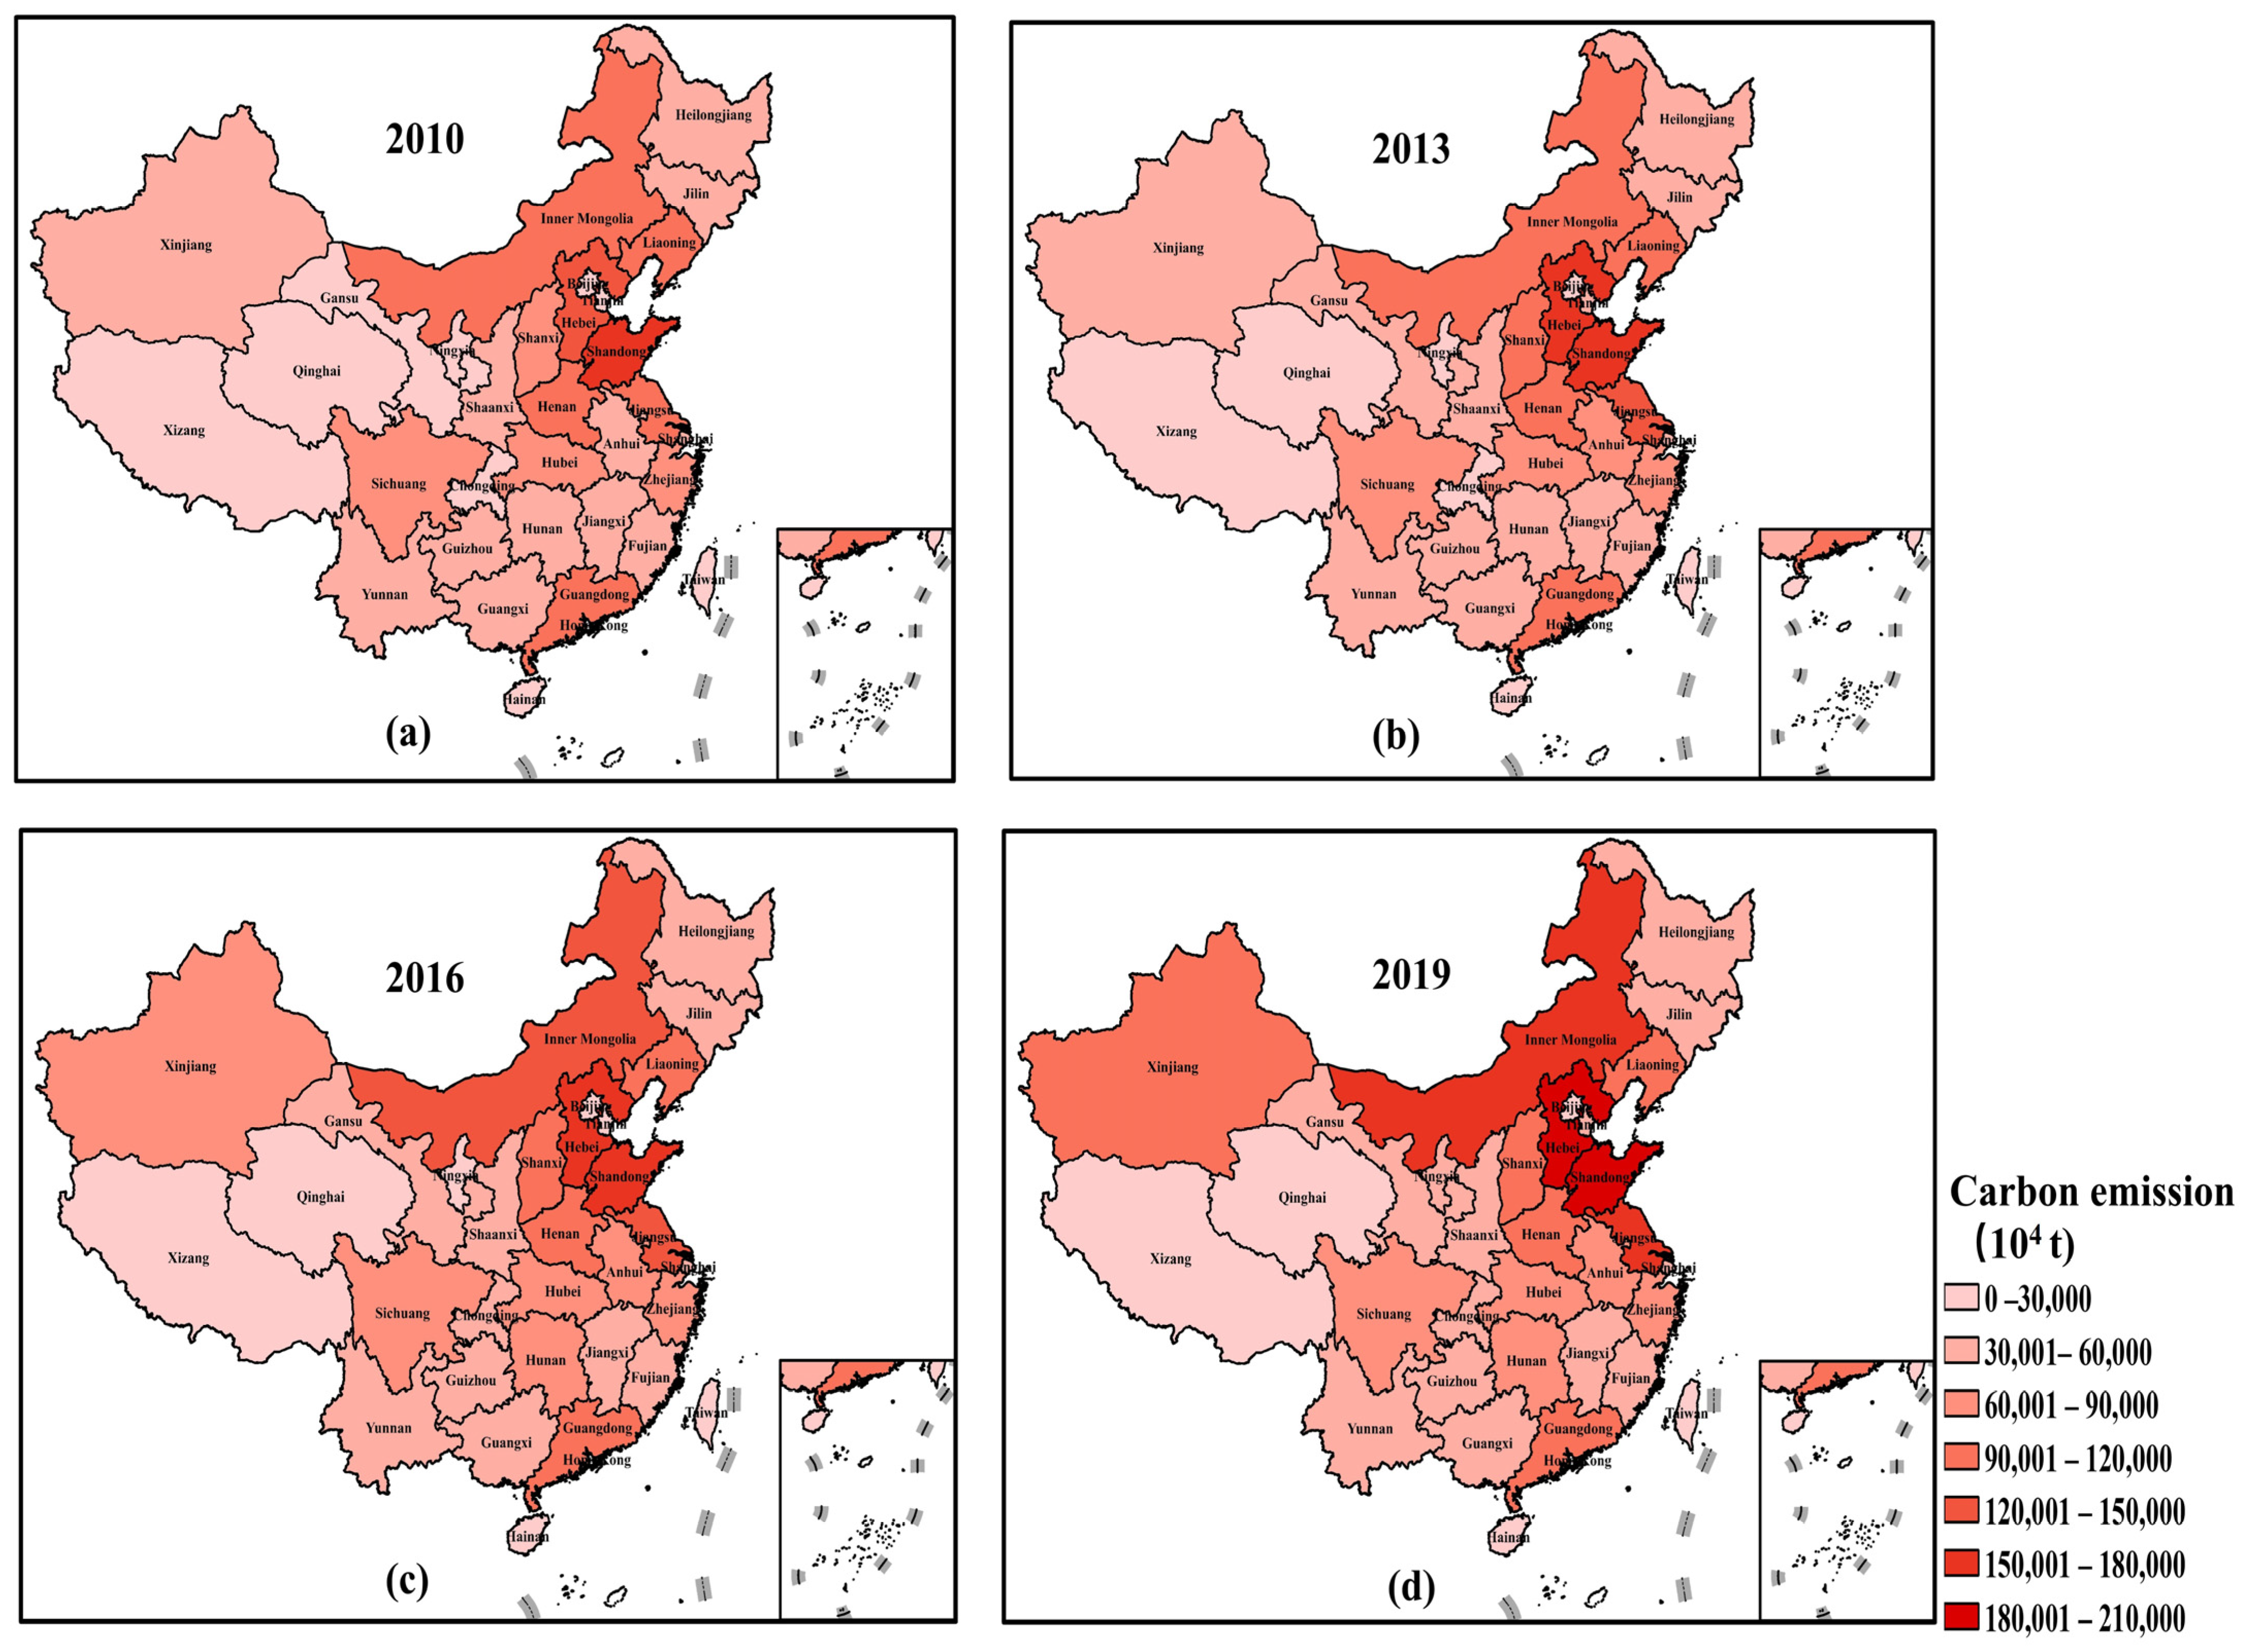
3.3. Spatial Variation Patterns of Carbon Emissions

Changes in the total cumulative carbon emissions and the corresponding carbon emission intensities for 30 provinces (cities and regions) from 2010 to 2019 are shown in Figure 4. The cumulative carbon emissions of the Shandong, Hebei, Jiangsu, and Inner Mongolia provinces were significantly higher than those of other cities in the region, especially Hainan and Qinghai. Ningxia, Inner Mongolia, and Shanxi recorded high carbon emission intensities. The ranks of the 30 provinces (cities and regions) based on their cumulative carbon emissions and carbon emission intensities (Table 1) revealed that some cities with high carbon emissions had low carbon emission intensities, for example Guangdong, Zhejiang, and Jiangsu. In contrast, some cities—Ningxia, Gansu, and Qinghai—with low carbon emissions had high carbon emission intensities. Inner Mongolia, as a typical resource-based city, lacks an overall industrial structure and its poor economic situation demands higher energy consumption. The high carbon emission of the economically developed province of Jiangsu in the eastern coastal region was because of its dense population, high urbanization level, and high level of economic consumption, which is exacerbated by the growth of secondary industries around primary manufacturing industries.

4. Discussion

From 2010 to 2019, the carbon emission intensities in the studied regions decreased annually. The high level of economic development and the large-scale economies in the Yangtze River Delta and Pearl River Delta regions induced a high demand for energy use, high energy use efficiency, and low carbon emissions per unit of GDP [35]. PM2.5 and O3 emissions were mainly concentrated in the Beijing, Tianjin, and Yangtze River Delta regions (Table 1). The overall downward trends were probably caused by differences in planning policies, transitions to new and renewable energy resources, and the modernization of the industrial structure [36]. The shift in China’s economic progress toward green development in the national economic development model induced these changes [37].

4.1. Differences in Provincial Pollution Reduction

To evaluate the differences in pollutant emission reductions, total carbon emissions and carbon emission intensity data pertaining to 2010, 2013, 2016, and 2019 for the 30 provinces were selected and analyzed.
The provinces of Guizhou, Zhejiang, Hainan, Guangdong, and the Guangxi Zhuang Autonomous Region experienced substantial reductions in PM2.5 emissions, while the regions with low reductions were Shaanxi, Heilongjiang, and Gansu. Guangdong and Hubei provinces and the Guangxi Zhuang Autonomous Region displayed high O3 emission reductions, whereas Sichuan, Heilongjiang, and Shanghai had low reduction levels.

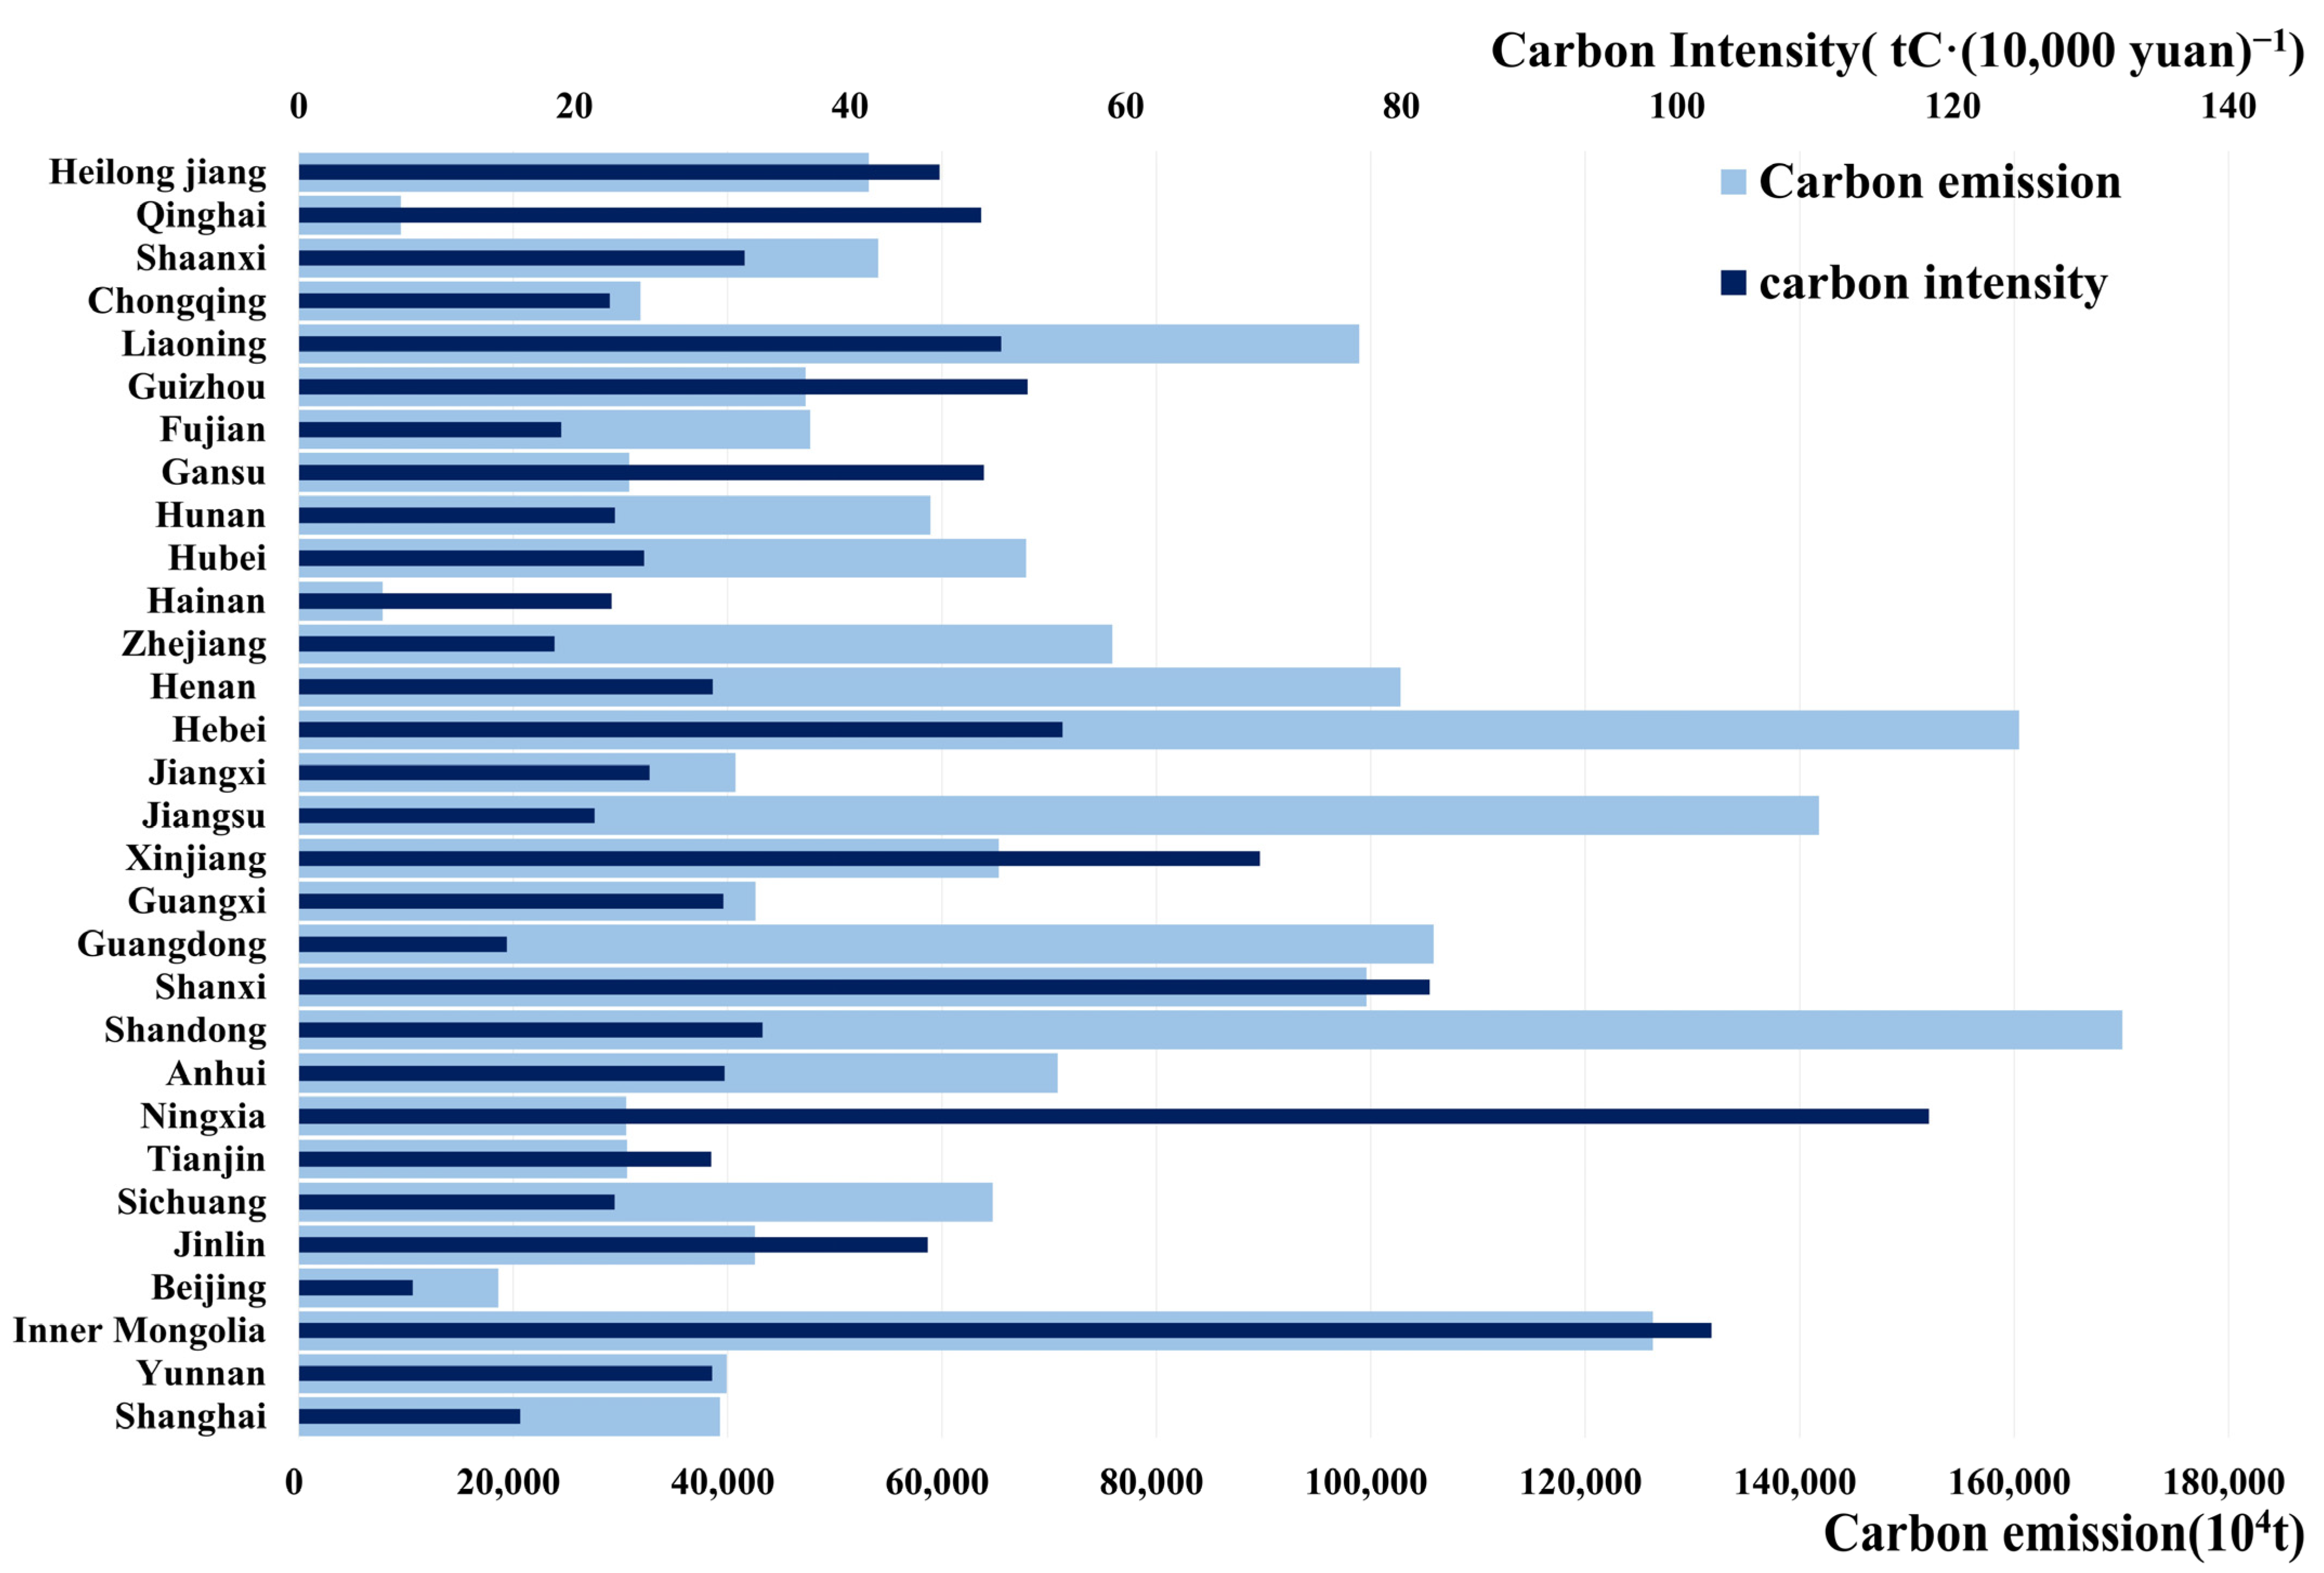
4.2. Differences in Provincial Carbon Emissions

According to the Netherlands Environmental Assessment Agency, China surpassed the United States of America in 2007 to become the world’s largest carbon emitter [38]. Owing to the limited availability of data, the carbon emissions of the 30 provincial-level administrative regions were examined only using data for 2010–2019. Significant changes were observed during this period, and specific ranges were adopted for carbon emissions to classify them into seven distinct levels and depict their spatial and temporal trends. The results of the classification are shown in Figure 5.
From 2010 to 2019, the carbon emissions of the 30 regions maintained an increasing trend, growing from an average of 57,324.6 to 72,544.8 104 t, and the growth rate varied by region. The growth rate of total carbon emissions was the greatest in the western region (45.50%). Additionally, total carbon emissions were the highest in the eastern region, which is closely related to its high population and long history of industrial development [39]. Notably, the spatial structure of carbon emissions did not change much in the eastern provinces during the study period, while it maintained a dual-core structure centered on the Shandong, Hebei, and Jiangsu provinces in the north, and the Guangdong province in the south. The northwest region experienced the lowest growth rate, with the Liaoning province displaying the highest average carbon emissions (98,758.7 104 t).

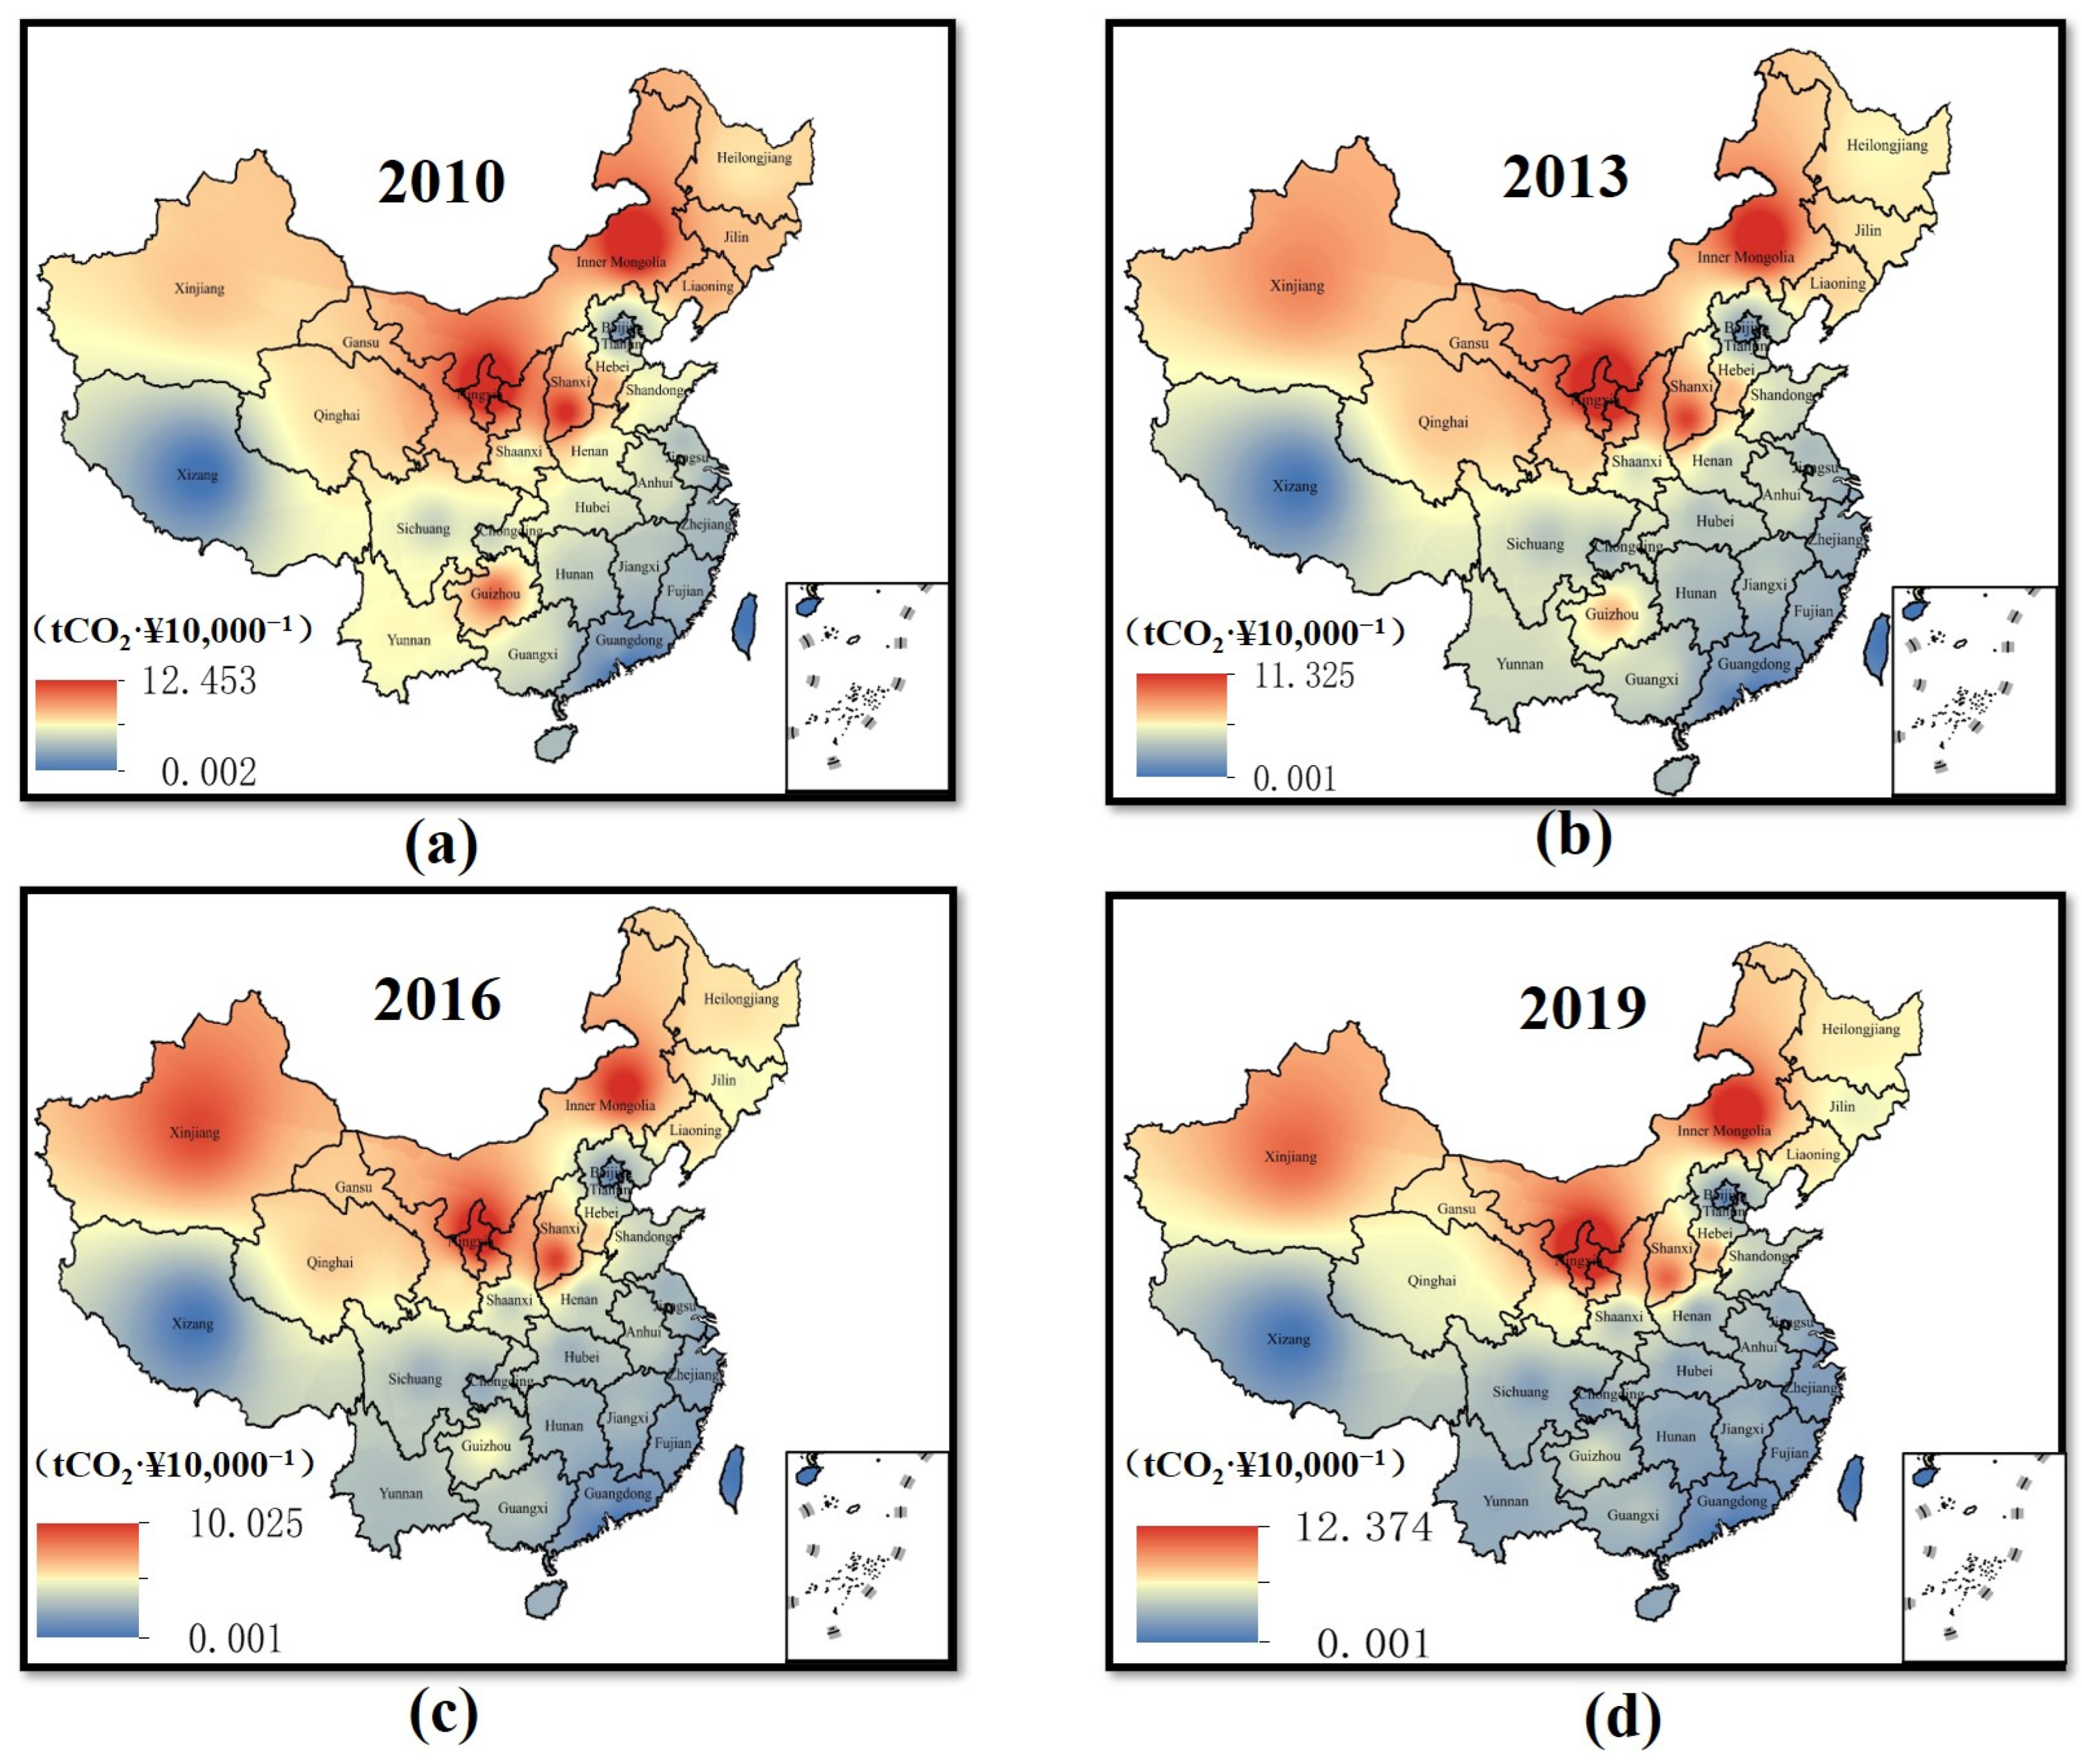
4.3. Differences in Provincial Carbon Emission Intensities

While regional carbon emissions serve as an absolute index, for multi-regional analyses and comparisons, this value is often incomparable because of underlying regional differences in economic levels, population sizes, historical development trends, and other factors. Accordingly, carbon emission intensity is often used as a standard for regional comparisons [40]. Here, carbon emission intensity was calculated as the ratio of carbon emissions to unit gross domestic product, and it was mapped using inverse distance interpolation (Figure 6).
Contrary to the upward trends in average carbon emissions among the regions, the average carbon emission intensity across the 30 study regions maintained a gradual downward trend from 2010 to 2019, decreasing from 5.069 t CO2·¥10,000−1 in 2010 to 3.084 t CO2·¥10,000−1 in 2019, indicating that the carbon use efficiency across China increased annually even though the spatial distribution structure of carbon emission intensity varied with time.
In 2010, the average carbon emission intensity of the 30 regions was 5.069 t CO2·¥10,000−1, with the average intensity in eastern China being notably low (3.218 t CO2·¥10,000−1), and with peak values occurring in Hebei and Shandong (average 5.697 t CO2·¥10,000−1). In central China, the average carbon emission intensity was 4.891 t CO2·¥10,000−1 with the highest peak value occurring in Shanxi province (9.951 t CO2·¥10,000−1). The average carbon emission intensity in western China was 6.562 t CO2·¥10,000−1, where Guizhou, Ningxia, and Inner Mongolia exhibited peak values with an average of 10.981 t CO2·¥10,000−1. The average carbon emission intensity of northeast China was 6.113 t CO2·¥10,000−1, with the peak value occurring in Liaoning province (6.603 t CO2·¥10,000−1).
By 2013, the average carbon emission intensity in eastern China had decreased to 2.587 t CO2·¥10,000−1, although the spatial structure of carbon emission intensity among different provinces did not change significantly compared with that of 2010. Hebei and Shandong in the north maintained higher-than-average carbon emission intensities. The average carbon emission intensities of the Anhui, Jiangxi, Henan, and Hubei provinces in central China gradually decreased to 2.983 t CO2·¥10,000−1, which was notably lower than the regional average of 3.801 t CO2·¥10,000−1. The average carbon emission intensity in the western region was 5.610 t CO2·¥10,000−1, with regional and national peak values (11.375 t CO2·¥10,000−1) observed in Ningxia and Inner Mongolia. Inner Mongolia is rich in coal, oil, and gas reserves, which facilitate the region’s power generation, and hence, its carbon emissions continue to increase, resulting in far higher per capita carbon emissions compared with the national average [41]. The Ningdong Energy and Chemical Base in Ningxia was delineated by the State Council to be a hub of thermal energy production and coal-based chemical industries. Carbon emissions associated with this base have a direct impact on the carbon emissions reduction target of the entire Ningxia region [42]. In northwest China, the average carbon emission intensity decreased to 4.824 t CO2·¥10,000−1, and Liaoning had the highest value in the region at 5.233 t CO2·¥10,000−1.
In 2016, the relatively high values of the eastern and central regions showed no significant changes compared with the values observed in 2013, with the average carbon emission intensity in these regions decreasing to 2.084 and 3.282 t CO2·¥10,000−1, respectively. The carbon emission intensity in the western region also decreased to 4.708 t CO2·¥10,000−1, presenting the greatest decrease among the three regions. Conversely, the high-value areas of carbon emission intensity in this region exhibited increases in Xinjiang, Ningxia, and Inner Mongolia, which had an average value of 8.864 t CO2·¥10,000−1. In northeast China, the carbon emission intensity decreased by 27.8% from 2010 to 2019, but it is noteworthy that the carbon emission intensity of Heilongjiang in this region increased between 2013 and 2016.
In 2019, the overall carbon emission intensity of eastern China reached the lowest level observed across all locations and years, at 1.850 t CO2·¥10,000−1. Furthermore, data patterns indicated that the gap of carbon emission intensities among provinces had narrowed. In central China, the average carbon emission intensity reduced to 2.598 t CO2·¥10,000−1, and corresponding low-value areas gradually shifted to Hebei, Anhui, and other provinces north of the Yangtze River. In western China, the average carbon emission intensity was 4.233 t CO2·¥10,000−1. Spatially, Xinjiang, Ningxia, and Inner Mongolia continued to have relatively high regional values, with an average value of 9.86 t CO2·¥10,000−1. In northwest China, the average carbon emission intensity was 3.958 t CO2·¥10,000−1. Liaoning province continued to be a relatively high-value area.

5. Conclusions

The findings of our study indicate that policies such as the Action Plan for Preventing and Controlling Air Pollution, in 2013, and the Three-Year Action Plan for Winning the Blue Sky War, in 2018, have yielded initial successes in reducing the concentrations of PM2.5. However, the official monitoring network of China revealed a national average concentration of PM2.5 of 33 μg·m3 in 2020, which is 3.3 times the World Health Organization’s guideline value (10 μg·m3), and therefore, PM2.5 continues to pose a serious threat to human health. Additionally, O3 pollution has become an increasingly significant problem over recent years, especially in major urban agglomerations, such as the Beijing–Tianjin–Hebei region, and its surrounding “2 + 26” cities, the Yangtze and Pearl River Deltas, and the Fenhe River Plain. Thus, to fundamentally improve air quality, China must strive to accelerate the optimization of its industrial and energy infrastructure. Many key regions (e.g., Ningxia and Inner Mongolia) and energy intensive projects are also exploring carbon peak and carbon neutral paths [43,44].
From 2010 to 2019, the total annual carbon emissions in the studied regions increased, with a pattern of gradual increase from the west to east, dependent on the distribution of provincial administrative regions with high carbon emissions. Conversely, carbon emission intensities showed a decreasing trend across the study regions during the research period. However, the magnitude of decrease varied spatially, and the western and central regions experienced the most significant decline in carbon emission intensities, with average reductions of 2.329 and 2.293 t CO2·¥10,000−1 from 2010 to 2019, respectively, followed by the northeastern region, which experienced a decrease of 2.155 t CO2·¥10,000−1. The eastern region had the lowest decrease of 1.454 t CO2·¥10,000−1. A comparison of the relatively high annual carbon emission intensities across four years revealed that the areas with peak values in the eastern regions north of the Qinling Mountains and Huaihe River gradually shifted toward the western regions. There was consistency in the spatial and temporal variability of the four indicators assessed in this study, indicating that China’s pollutant control measures have played a key role in improving air quality across the studied regions, and have helped in effectively offsetting the negative impact of increased energy consumption on air quality.
However, the carbon emission and intensity trends of high value areas were sub-optimal, as indicated by the variable evolutionary trends for the two indicators. This illustrates the range of energy efficiency and emission reduction observed across the analyzed provincial administrative regions. Accordingly, future carbon reduction policies must be optimized based on local regional factors.
Future policies should consider international reference standards on carbon neutral goals, which are driven by energy consumption, to improve air quality and allow climate change mitigation [45,46,47]. This will enable rapid and thorough transformations within industrial infrastructure, thereby reducing the emissions of carbon, PM2.5, and O3, and improving air quality.
With the extensive application of advanced terminal control technologies in major pollution sectors such as power and manufacturing, the benefits of air quality improvement through policy control mechanisms will gradually decline [48]. However, the long-term improvement of air quality in China is a challenge owing to the limited potential for end-of-pipe emission reductions control, and thus, more stringent low-carbon policies are urgently needed. China’s commitment to carbon neutrality will be the core driver of both national and international air quality improvements in the future. As discussed in this study, the contribution of low-carbon policies and pollution control measures toward such goals can serve as a valuable reference for other developing countries that face the challenges of air quality compliance, climate change mitigation, and economic development.

Author Contributions

Writing—original draft preparation, Y.S. and J.Z.; methodology, J.Z.; data curation, Q.Z.; writing—review and editing, Y.S. and C.H.; visualization, Y.S.; supervision, Q.Z. and Z.Z. All authors have read and agreed to the published version of the manuscript.

Funding

This research received no external funding.

Data Availability Statement

Not applicable.

Conflicts of Interest

The authors declare no conflict of interest.

References

  1. Murray, C.J.; Aravkin, A.Y.; Zheng, P.; Abbafati, C.; Abbas, K.M.; Abbasi-Kangevari, M.; Abd-Allah, F.; Abdelalim, A.; Abdollahi, M.; Abdollahpour, I.; et al. GBD 2019 Risk Factors Collaborators. Global burden of 87 risk factors in 204 countries and territories, 1990–2019: A systematic analysis for the Global Burden of Disease Study 2019. Lancet 2020, 396, 1223–1249. [Google Scholar] [CrossRef]
  2. Yang, X.; Teng, F.; Wang, G. Incorporating environmental co-benefits into climate policies: A regional study of the cement industry in China. Appl. Energy 2013, 112, 1446–1453. [Google Scholar] [CrossRef]
  3. Tian, Y.; Lin, Z.J. Spatial-temporal coupling relationship between agricultural carbon emissions and economic growth in the Yangtze River Economic Belt. J. China Agric. Univ. 2021, 26, 208–218. [Google Scholar]
  4. Zhang, Z.; Yu, Y.; Wang, D.; Kharrazi, A.; Ren, H.; Zhou, W.; Ma, T. Socio-economic drivers of rising CO2 emissions at the sectoral and sub-regional levels in the Yangtze River Economic Belt. J. Environ. Manag. 2021, 290, 112617. [Google Scholar] [CrossRef]
  5. Khairy, W.; Salem, M.; Saber, G. Analytical study of carbon dioxide equivalent emission from agricultural drain surfaces—A case study from Egypt. Irrig. Drain. 2021, 70, 719–731. [Google Scholar] [CrossRef]
  6. Blandford, D. We Should Focus on Food Consumption to Reduce Greenhouse Gas Emissions in Agriculture. EuroChoices 2021, 20, 18–22. [Google Scholar] [CrossRef]
  7. Ke, Y.Y. The Impact of Manufacturing Industrial Agglomeration on Urban Green Effect. Master’s Thesis, Shanghai University of Finance and Economics, Shanghai, China, 2020. [Google Scholar]
  8. Jiang, Z.R.; Jin, H.H.; Wang, C.J.; Ye, S.L.; Huang, Y.H. Carbon emission measurement and efficiency pattern of transportation in the Yangtze River Economic Belt. Environ. Sci. 2020, 41, 2972–2980. [Google Scholar]
  9. Katz-Rosene, R.M. A not-so-green choice? The high carbon footprint of long-distance passenger rail travel in Canada. Can. Geogr. Géographe Can. 2021, 65, 141–151. [Google Scholar] [CrossRef]
  10. Wang, Z.Y.; Wang, Z.F. Study on the spatial and temporal evolution and influencing factors of tourism industry efficiency under carbon emission constraint in the Yangtze River Economic Belt. Resour. Environ. Yangtze Basin 2021, 30, 280–289. [Google Scholar]
  11. Greening, L.A.; Ting, M.; Davis, W.B. Decomposition of aggregate carbon intensity for freight: Trends from 10 OECD countries for the period 1971–1993. Energy Econ. 1999, 21, 331–361. [Google Scholar] [CrossRef]
  12. Xia, S.Y.; Zhao, Y.; Xu, X.; Wen, Q.; Cui, P.P.; Tang, W.M. Regional differences, temporal and spatial patterns and dynamic evolution of agricultural carbon emission intensity in China in recent 20 years. Resour. Environ. Yangtze Basin 2020, 29, 596–608. [Google Scholar]
  13. Han, M.Y.; Liu, W.D.; Xie, Y.T.; Jiang, W.B. Regional differences and decoupling trend of carbon emissions in China. Resour. Sci. 2021, 43, 710–721. [Google Scholar]
  14. Qiang, W.; Han, X.Y.; Li, R.R. Does technical progress curb India’s carbon emissions? A novel approach of combining extended index decomposition analysis and production-theoretical decomposition analysis. Environ. Manag. 2022, 310, 114720. [Google Scholar]
  15. Zhu, X.-J.; Zhang, H.-Q.; Gao, Y.-N.; Yin, H.; Chen, Z.; Zhao, T.-H. Assessing the regional carbon sink with its forming processes—A case study of Liaoning province, China. Sci. Rep. 2018, 8, 15161. [Google Scholar] [CrossRef] [PubMed] [Green Version]
  16. Ghaffar, A.; Nathsuda, P.; Cui, S.H. Valuation and validation of carbon sources and sinks through land cover/use change analysis: The case of Bangkok metropolitan area. Land Use Policy 2018, 70, 471–478. [Google Scholar]
  17. Wu, J.Y.; Mao, Q.Q.; Dong, B.C. Research on the sustainable development of personal carbon accounts in the era of big data—Take Ant Financial as an example. Times Financ. 2019, 14, 103–107+111. [Google Scholar]
  18. Yu, B.L. Research on Greenhouse Gas, Haze Pollution Reduction Strategy and Synergistic Reduction Effect; China University of Mining and Technology: Beijing, China, 2019. [Google Scholar]
  19. Ministry of Ecology and Environment of the People’s Republic of China. Communiqué on the State of Ecological Environment in China. 2014–2019:7–9. Available online: https://www.mee.gov.cn/hjzl/sthjzk/zghjzkgb/ (accessed on 19 April 2022).
  20. Liu, Y.W.; Yang, C.; Cai, H.Y. Inter-provincial differences and factor decomposition of total carbon emissions and intensity in China. J. Hunan Univ. Technol. 2022, 36, 1–9. [Google Scholar]
  21. IPCC. Climate Change 2007: Mitigation: Contribution of Working Group III to the Fourth Assessment Report of the Intergovernmental Panel on Climate Change; Cambridge University Press: Cambridge, UK, 2007. [Google Scholar]
  22. IPCC. Climate Change 2001: Mitigation: Contribution of Working Group III to the Third Assessment Report of the Intergovernmental Panel on Climate Change; Cambridge University Press: Cambridge, UK, 2001. [Google Scholar]
  23. IPCC. Climate Change 2014: Mitigation of Climate Change: Contribution of Working Group III to the Fifth Assessment Report of the Intergovernmental Panel on Climate Change; Cambridge Un2 strengthening the global response to the threat of climate change, sustainable development, and efforts to eradicate poverty; Cambridge University Press: Cambridge, UK, 2018. [Google Scholar]
  24. Zhu, Q.A.; Zhang, W.C.; Yu, J.H. Research on spatial interpolation method based on GIS. J. Jiangxi Norm. Univ. 2004, 2, 183–188. [Google Scholar]
  25. Carbon Emission Accounts Datasets, China Energy Inventory1997–2019 and Energy Emission Inventory of 30 Provincial Administrative Regions 2010–2019. Available online: https://www.ceads.net.cn/data/nation/ (accessed on 20 March 2021).
  26. National Bureau of Statistics, Statistical Yearbook 2009–2019. Available online: https://data.stats.gov.cn/easyquery.htm?cn=C01 (accessed on 20 March 2021).
  27. Ministry of Ecology and Environment of the People’s Republic of China. Communiqué on the State of Ecological Environment in China 2012–2019. Available online: https://www.mee.gov.cn/hjzl/sthjzk/zghjzkgb/ (accessed on 20 March 2021).
  28. Central People’s Government of the People’s Republic of China. Thirteenth Five-Year Plan for Ecological Environmental Protection. Available online: http://www.gov.cn/xinwen/2016-12/05/content_5143464.htm (accessed on 19 April 2022).
  29. MEE. Ambient Air Quality Standards (GB 3095-2012) [Z]//CHINA M O E A E O T P S R O. Available online: https://www.mee.gov.cn/ywgz/fgbz/bz/bzwb/dqhjbh/dqhjzlbz/201203/t20120302_224165.shtml (accessed on 19 April 2022).
  30. Wang, F.Y. Health Effects of PM2.5 and O3 Air Pollution in Beijing-Tianjin-Hebei Region and the Reduction Response to Pollutants; North China Electric Power University: Beijing, China, 2021. [Google Scholar]
  31. Guo, X.P.; Song, H.K.; Liang, L.K.; Liu, P.F. Characteristics of spatial and temporal variation of ozone concentration in China from 2015–2017. Meteorol. Environ. Sci. 2020, 43, 41–50. [Google Scholar]
  32. Song, J.K.; Jiang, L.N.; Zhao, Z.H.; Zhang, Y.M.; Lv, G.T. Cointegration test of the relationship between energy consumption, air pollutant emissions and carbon intensity in China--based on data from 2000 to 2017. Environ. Prot. Sci. 2020, 46, 1–7. [Google Scholar]
  33. Xi, Y.L. Study on the synergistic reduction effect of greenhouse gases and air pollutants in Beijing-Tianjin-Hebei region. City 2021, 10, 49–61. [Google Scholar]
  34. Liu, Q.; Wang, S.; Zhang, W.; Li, J.; Kong, Y. Examining the effects of income inequality on CO2 emissions: Evidence from non-spatial and spatial perspectives. Appl. Energy 2018, 236, 163–171. [Google Scholar] [CrossRef]
  35. Gao, D.; Kong, G.; Ma, L.W.; Yan, X.H.; Zhang, H. Study on the current situation of regional energy and the focus of medium and long-term development strategies in China. China Eng. Sci. 2021, 23, 7–14. [Google Scholar] [CrossRef]
  36. Peters, G.P.; Andrew, R.M.; Boden, T.; Canadell, J.G.; Ciais, P.; Quere, C.L.; Marland, G.; Raupach, M.R.; Wilson, C. The challenge to keep global warming below 2 °C. Nat. Clim. Chang. 2012, 3, 4–6. [Google Scholar] [CrossRef]
  37. Gao, Z.F. Yangtze River Delta Urban Agglomeration of Carbon Emissions and Atmospheric Pollution Emissions of Collaborative Governance Research; Zhejiang University of Technology: Zhejiang, China, 2019. [Google Scholar]
  38. Mongabay Report “China Overtakes US as Top CO2 Emitter” 17 October 2007. Available online: https://cn.mongabay.com/ (accessed on 20 March 2021).
  39. Shi, H.D.; Gao, Q.X.; Zhang, S.H.; Chen, D.S.; Du, W.P.; Fu, J.F.; Bai, H.M. A Review of Research on Air Pollution Impacts and Feedbacks on Climate Change. Res. Environ. Sci. 2012, 25, 974–980. [Google Scholar]
  40. Wang, Z.H.; Yan, L. Indirect carbon emissions in household consumption: Evidence from the urban and rural area in China. J. Clean. Prod. 2014, 78, 94–103. [Google Scholar] [CrossRef]
  41. Zhao, L.Y.; Feng, L.Y. Research on energy efficiency and influencing factors in Inner Mongolia based on DEA model. J. Inn. Mong. Univ. Financ. Econ. 2017, 15, 32–35. [Google Scholar]
  42. Tian, D.Y.; Wang, Y. Research report on low-carbon development in Inner Mongolia and Ningxia Hui Autonomous Region. China Econ. Trade J. 2020, 2, 124–125. [Google Scholar]
  43. Wang, Z.H. Research on Temporal and Spatial Evolution Characteristics and Influencing Factors of Regional Carbon Emissions; Shandong Normal University: Shandong, China, 2021. [Google Scholar]
  44. Tian, Z.; Zhang, H.Y.; Niu, W.J. The Yangtze river economic belt of carbon emissions peak forecast and mitigation strategies. J. Resour. Ind. 2021, 23, 97–105. [Google Scholar]
  45. Liu, X.J. Spatial and Temporal Characteristics and Driving Factors of PM2.5 Pollution in the Yangtze River Economic Belt; Lanzhou University: Lanzhou, China, 2021. [Google Scholar]
  46. Qin, Y.Q. Temporal and Spatial Evolution Characteristics of Main Pollutant Emissions in the Yangtze River Economic Belt; Nanjing University: Nanjing, China, 2019. [Google Scholar]
  47. Wang, Y.X.; Yu, X.H.; Xiong, X. Study on spatial difference and influencing factors of pollutant emission intensity in the Yangtze river economic belt. West Forum 2019, 29, 104–114. [Google Scholar]
  48. Huang, C.; Chen, C.H.; Li, L.; Cheng, Z.; Wang, H.L.; Wang, Y.J.; Huang, H.Y.; Zhang, G.F.; Chen, Y.R. Characteristics of anthropogenic atmospheric pollutants in the Yangtze River Delta. J. Environ. Sci. 2011, 31, 1858–1871. [Google Scholar]
Figure 1. Study regions.
Sustainability 14 06200 g001
Figure 2. Spatial and temporal variations in pollutant concentrations. The first row represents PM2.5 and the second row represents O3.
Sustainability 14 06200 g002
Figure 3. Temporal variations of carbon emissions and carbon intensities for 30 provinces of China during 1997–2019.
Sustainability 14 06200 g003
Figure 4. Historical cumulative carbon emissions and carbon emission intensities of the 30 provinces during 2010–2019.
Sustainability 14 06200 g004
Figure 5. Carbon emissions of the 30 provinces, cities, and autonomous regions of China in (a) 2010, (b) 2013, (c) 2016, and (d) 2019.
Sustainability 14 06200 g005
Figure 6. Carbon emission intensities of the 30 provinces, cities, and autonomous regions of China in (a) 2010, (b) 2013, (c) 2016, and (d) 2019.
Sustainability 14 06200 g006
Table 1. Ranking of 30 provincial administrative regions of China based on their pollution and carbon emission data from 2010 to 2019.
Provincial DistrictsTotal Carbon EmissionsCarbon Emission IntensityPM2.5 ReductionsO3 Reductions
Mean
(10,000 Tons)
RankMean (Tons·¥10,000−1)RankMean
(μg·m−3)
RankMean
(μg·m−3)
Rank
Shanghai39,290.400231.605280.08615−0.00725
Yunnan39,905.000222.999170.045200.02522
Inner Mongolia126,317.100410.24820.000230.04917
Beijing18,610.800280.827290.095140.0896
Jilin42,554.900204.563110.031220.04718
Sichuan64,728.800132.291220.09913−0.00726
Tianjin30,632.300262.992180.059180.05016
Ningxia30,539.3002711.8271−0.031270.02123
Anhui70,776.900103.088140.15270.1035
Shanxi99,589.00078.20530.083160.06113
Shandong170,098.213.363120.080170.07510
Guangdong105,851.10051.509300.18550.1272
Guangxi42,606.200193.080150.23520.1641
Xinjiang65,285.800126.97340.000240.00024
Jiangsu141,792.00032.145250.116110.05215
Jiangxi40,732.200212.544190.14380.0867
Hebei160,470.50025.54150.108120.0848
Henan102,777.60063.00416////
Zhejiang75,880.00091.855270.19430.05814
Hainan7817.400302.269230.18840.1104
Hubei67,834.100112.506200.16760.1203
Hunan58,920.800142.29421////
Gansu30,822.600254.97080.00025−0.03127
Fujian47,706.200171.903260.14390.06811
Guizhou47,275.400185.28860.42110.06812
Liaoning98,918.10085.09570.050190.03321
Chongqing31,877.400242.256240.132100.04519
Shaanxi54,057.800153.23513−1.389280.03920
Qinghai9517.700294.95190.045210.0829
Heilongjiang53,155.900164.650100.00026−0.03928
Publisher’s Note: MDPI stays neutral with regard to jurisdictional claims in published maps and institutional affiliations.

