Article

Integrative Sustainability Analysis of European Pig Farms: Development of a Multi-Criteria Assessment Tool

1
Division of Livestock Sciences, Department of Sustainable Agricultural Systems, University of Natural Resources and Life Sciences, Gregor-Mendel-Str. 33, 1180 Vienna, Austria
2
Centro Ricerche Produzioni Animali—C.R.P.A. S.p.A., 42121 Reggio Emilia, Italy
3
Food and Rural Development, School of Agriculture, Newcastle University, Kings Road, Newcastle upon Tyne NE1 7RU, UK
4
Friedrich-Loeffler-Institut, Dörnbergstr. 25/27, 29223 Celle, Germany
5
Wageningen Economic Research, Wageningen University & Research, P.O. Box 35, 6700 AA Wageningen, The Netherlands
6
Professur für ökologischen Landbau, Justus-Liebig-Universität Gießen, Karl-Glöckner-Str. 21 C, 35394 Gießen, Germany
7
Institute of Economics and Finance, Warsaw University of Life Sciences, 02-787 Warsaw, Poland
8
Department of Production Animal Medicine, Faculty of Veterinary Medicine, University of Helsinki, P.O. Box 57, FI-00100 Helsinki, Finland
*
Authors to whom correspondence should be addressed.
These authors contributed equally to this work.
Sustainability 2022, 14(10), 5988; https://doi.org/10.3390/su14105988
Submission received: 25 March 2022 / Revised: 8 May 2022 / Accepted: 11 May 2022 / Published: 15 May 2022
(This article belongs to the Special Issue Sustainable Pig Production)

Abstract

:
Societal interest in all aspects of sustainability has increased. Therefore, pig farmers need to be aware of their strengths and weaknesses in all dimensions of sustainability: economy, environment, social wellbeing, and animal health and welfare. Our aim was to describe and critically discuss the development of a sustainability assessment tool for pig farms and to evaluate its suitability by applying it to 63 European pig farms (13 breeding, 27 breeding-to-finishing, and 23 finishing farms). The multi-criteria assessment tool was developed in several steps (the selection and scaling of indicators and their aggregation and weighting) in order to summarise the indicators into subtheme and theme scores. The indicators contributing the most to the subtheme/theme scores were identified and discussed in order to evaluate the procedure of the development. For example, some indicators, such as Ecological compensation area, Fairness of prices, and Tail docking, for which farms were scored low, were also identified as “real world problems” in other studies. For other sustainability aspects with low performance, the threshold might have been set too ambitiously, e.g., for Number of sows per annual working unit. Furthermore, to analyse the suitability of the tool, we assessed the best and worst median theme scores (good and poor performances) for each dimension, as well as the variability of the performances of the farms within the themes. Some themes were found to be moderate, such as Pig comfort, Biodiversity, or Resilience, whereas others were found to be good, e.g., Water and the Human–animal relationship, as well as several themes of the social wellbeing dimension. Overall, the sustainability tool provides a comprehensive assessment of the sustainability of pig production. Furthermore, this publication contributes to both the theory (development of a robust sustainability tool) and the practice (provision of a tool to assess and benchmark the sustainability on farms). As a next step, a sensitivity analysis should be performed, and the tool should be applied for further development.

Graphical Abstract

1. Introduction

Pig farming is an economically important livestock sector in Europe. It contributes 9.5% (2020) to the total EU-27 agricultural output, which is the highest share within the meat sector [1]. In 2019, 22.8 million tonnes of pork was produced in the EU [1]. The EU is the world’s top exporter of pig meat, with China as the main destination [2].
At the same time, sustainability has become a central goal for pig farming [3], as well as in agriculture in general [4,5]. It was added as one of the key objectives of the EU in the Amsterdam Treaty (1997) and was strengthened in 2001 by the publication of the EU Sustainable Development Strategy [6]. It is often defined as “the ability to make development sustainable to ensure that it meets the needs of the present without compromising the ability of future generations to meet their own needs” [7]. Sustainable agriculture is also one of the central steps of the Agenda 2030 [8]. Several United Nations Sustainable Development Goals (SDGs) address agricultural topics, such as the SDGs “#2 Zero Hunger”, “#12 Responsible Production & Consumption“, “#13 Climate Action“, “#14 Life below Water” or “#15 Life on Land”, as agriculture not only contributes to, but also impacts on the SDGs [8]. Therefore, the EU has clearly stated the need for a sustainable agriculture by launching the Green Deal and the Farm-to-Fork strategy [9], which covers a number of SDGs. These SDGs are also taken up in sustainability assessment tools to examine sustainable development with regard to these goals.
Pig farming in Europe, however, faces several problems in terms of sustainability. The negative impacts of pig production on the environment are strongly criticized. Pig farming is globally responsible for 668 megatons CO2-eq. annually, representing nine percent of the livestock sector emissions [10]. Feed production and manure management (storage, spreading) in particular, as well as land use change from soy production, have detrimental impacts on the environment [11]. Major changes in the food and agriculture system are needed if the goals of the Paris Agreement are to be met [12]. Furthermore, animal welfare has become a major concern of society [13,14]. Due to the focus on increasing efficiency on pig farms, housing systems (e.g., farrowing crates, fully slatted floors, and reduction in space allowance) have been developed, which do not meet the pigs’ needs regarding normal behaviour [15]. This has led to several animal welfare problems such as tail biting [16] and stereotypic behaviour [17]. Furthermore, the economic pressure on farmers has increased due to low and unstable pork prices [18]. Larger units are able to produce more cost-efficiently due to the economies of scale. Therefore, smaller units might have to give up their production. Consequently, current supply and consumer demand are higher than is sustainable and healthy. A globally sustainable diet entails a reduction in pork production by 85% [19]. Therefore, farmers face the challenge of meeting societal demands while producing economically to sustain their businesses and maintaining their own wellbeing.
Running a pig farm sustainably thus requires knowledge of all dimensions of sustainability. These commonly include economy (ECO), the environment (ENV), and social wellbeing (SOC) [8]. Animal health and welfare (AHW) is often included in the latter dimension; yet, due to the increased societal interest, it merits being a separate, fourth dimension [20]. All the dimensions are strongly interwoven, and all the parts need to be considered when farm management decisions are made. As pork is produced on a large variety of pig farms [21], there is not one solution to improve sustainability on all farms, and the measures should therefore be farm-specific.
Multi-criteria analysis (MCA) is an established method for assessing multidimensional problems such as sustainability in an integrated way [22]. It allows the combination of results from different methods, e.g., environmental life cycle assessment (LCA) and economic cost–benefit analysis [23].
Several MCA-based tools have been developed for assessing sustainability at the farm level, e.g., Response-Inducing Sustainability Evaluation (RISE), Sustainability Monitoring and Assessment RouTine (SMART), and Sustainability Assessment of Food and Agriculture Systems (SAFA) [24,25]. Some sustainability tools cover a broad range of different businesses, e.g., SAFA can be used for large as well as for small businesses, while other tools focus on more specific applications, e.g., RISE focuses on status quo assessment and recommendations to improve sustainability on farms [24,25,26,27]. Such indicator-based tools are generally structured hierarchically with dimensions as the highest and most general level. Themes and subthemes cover the intermediate levels. The lowest level is the indicators, which measure farm-specific performance [24]. Indicators of different units are then scaled and aggregated on the subtheme and theme level.
Some studies have applied these tools on livestock farms (e.g., RISE [28], SMART [25] and SAFA [29,30]). However, the results from different tools cannot be compared as they depend on the choice of indicators, scaling, and weighting procedures [24]. Therefore, transparency of the decisions made during the tool development is crucial to understanding and explaining the results to farmers so that decisions for improvement measures towards a sustainable development can be made.
For a tool to be successful, it should provide new and additional information to farmers and be user-friendly. To help farmers improve the sustainability of their farms, farm-specific recommendations are needed. Farmers might be more willing to use such a sustainability assessment tool if it focused on pig farm-specific indicators. In a study on four different tools (RISE, SAFA, PG and IDEA), the farmers perceived RISE as the most relevant tool as it is based on quantitative questions and uses a context-specific approach. However, the farmers also expressed hesitation in applying the outcomes of these four tools in their decision making and management [31].
Furthermore, in SMART and SAFA AHW is assessed as part of the ENV dimension, whereas in RISE AHW is an independent theme [24,25]. Moreover, AHW is only covered with a few questions, which focus on resource-based measures (e.g., space allowance) [32], whereas animal-based measures (e.g., prevalence of tail biting) are missing. However, animal-based measures have become an important part of the AHW assessment [33] and should therefore be included in a sustainability assessment tool.
Therefore, the Era-Net SusAn project SusPigSys developed an assessment and feedback tool specifically for pig farms, applying an MCA as the framework with AHW as a fourth dimension [34]. Such a tool may help to inform farmers about their sustainability performance, especially by providing feedback in the form of benchmarking with peers. It can give insights into the strengths and weaknesses of their farm and suggest measures to improve sustainability.
The overall aim of this paper was to critically assess this integrated on-farm sustainability assessment tool. Therefore, within two steps, our aims were:
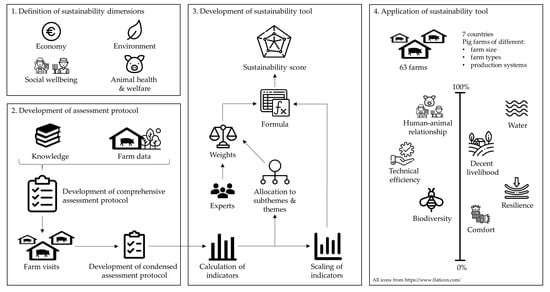
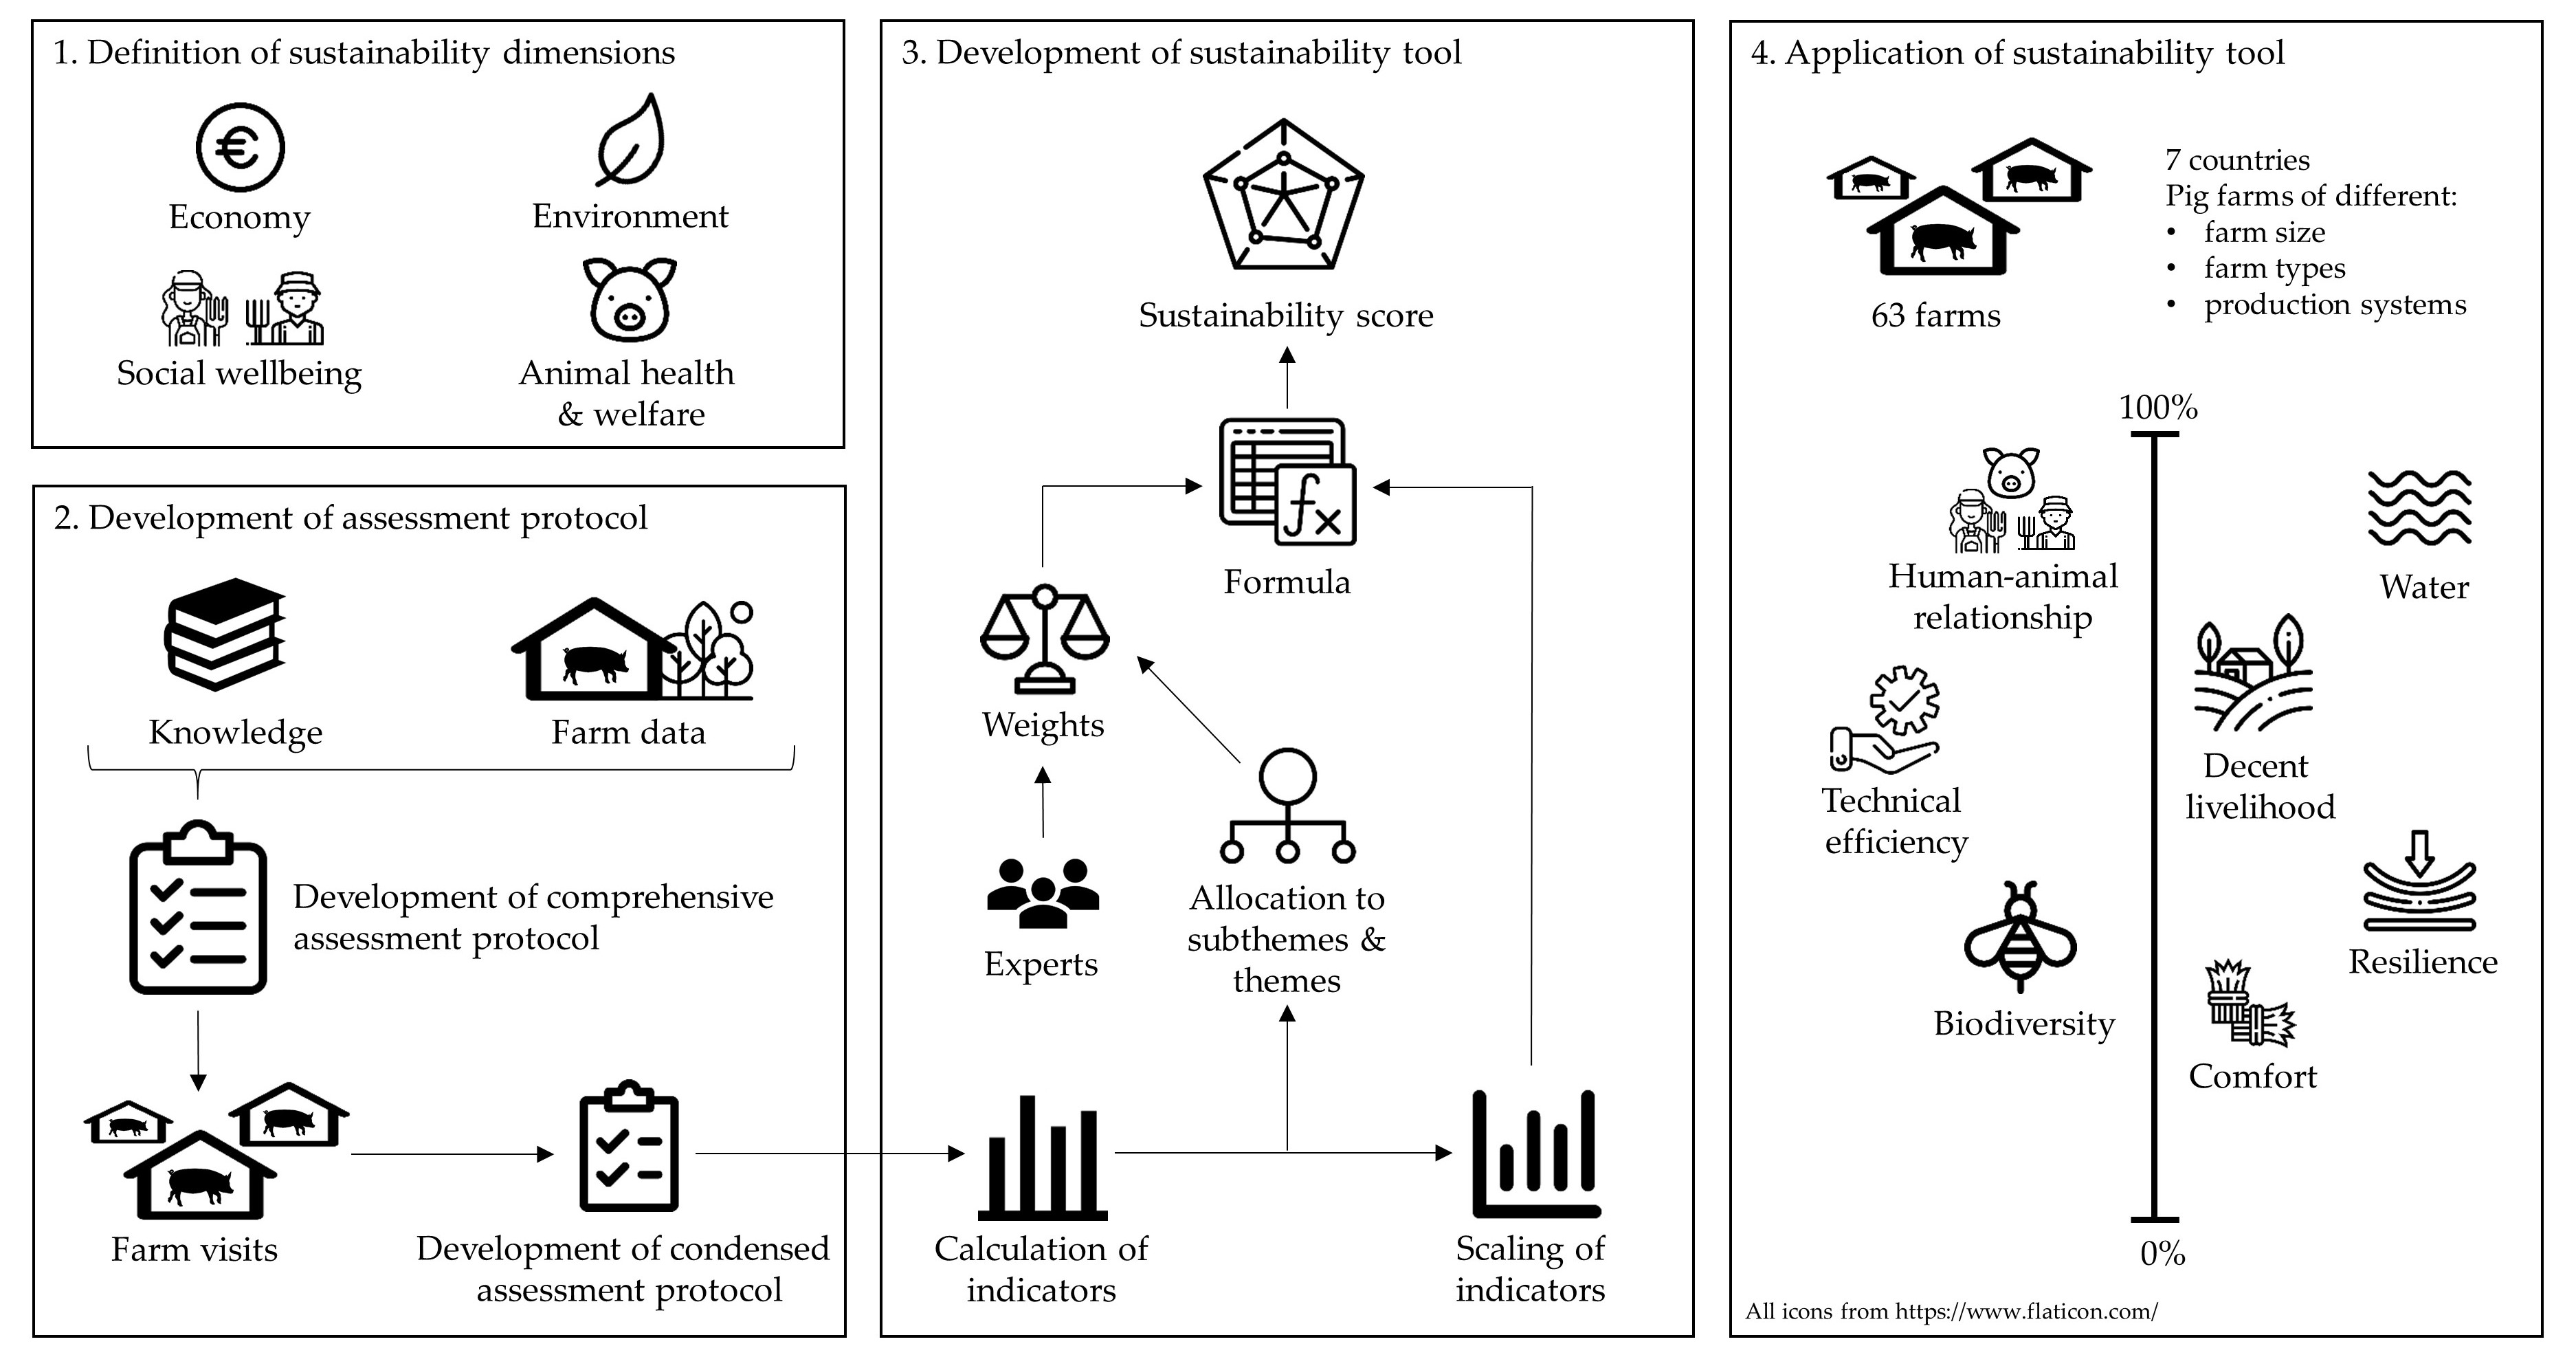
  • To describe the development of the SusPigSys sustainability assessment tool for pig farms and to critically discuss the different steps of the development.
  • To apply the tool on European pig farms to explore the suitability and ability of the tool to reflect actual sustainability challenges and to differentiate the sustainability performance of different pig farm characteristics. The specific objectives were:
    • At the indicator level: to identify the main challenges regarding sustainability (indicators with low median scores and a high contribution to the overall theme level).
    • At the theme level: to detect and discuss good and bad farm performance with regard to sustainability.
    • At the theme level: to analyse the variability (if all farms show the same score, the tool is not suitable for differentiating).

2. Materials and Methods

The SusPigSys sustainability assessment tool includes the four sustainability dimensions of economy (ECO), environment (ENV), social wellbeing (SOC), and animal health and welfare (AHW). It was developed in an iterative process and is available at [34]
The framework of the tool is an MCA, which summarises the data derived from specific indicators (e.g., Prevalence of tail lesions) into subtheme (e.g., Clinical findings) and theme (e.g., Absence of injuries and disease) scores in a process involving scaling and weighting. Figure 1 provides an overview of the MCA framework and the different steps of the development, which will be further described in the following.

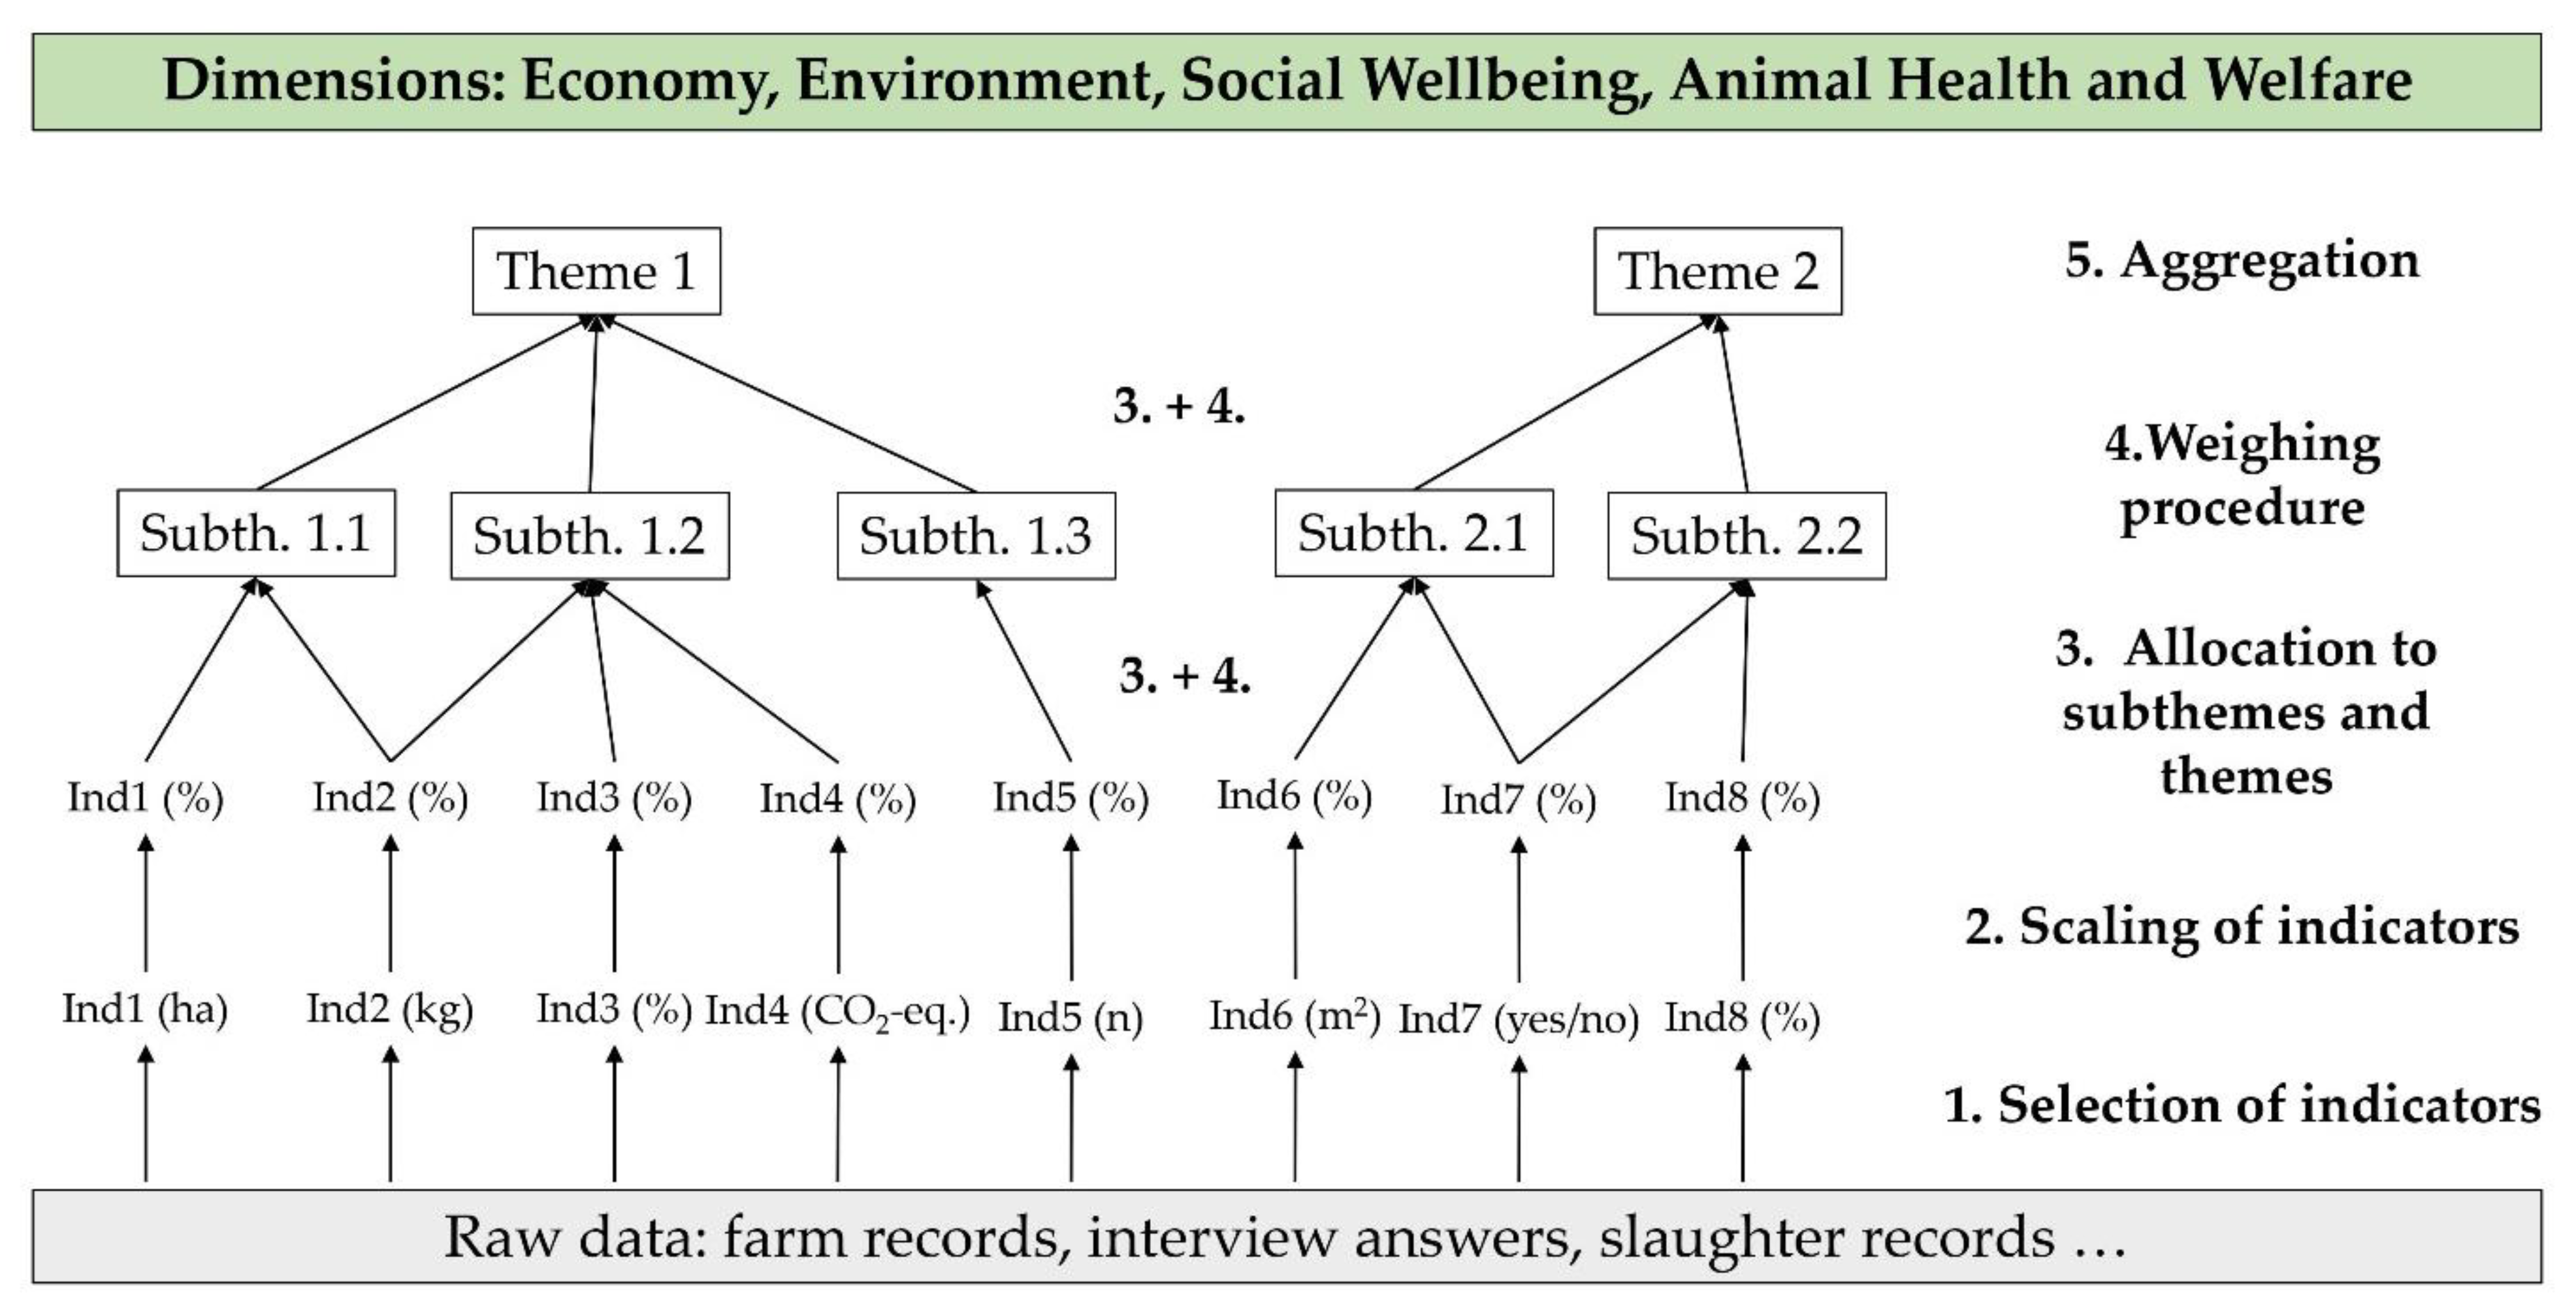
2.1. Selection of Indicators

The selection of indicators consisted of three successive steps (development of detailed assessment protocol, application, and condensation) [35]. First, we developed a detailed assessment protocol with a large number of indicators to cover all aspects of sustainability on pig farms [35]. The selection of indicators was based on the literature, the already existing protocols, and expert opinion (Table 1). We only included indicators which were relevant within the boundaries of the actual pig farm; so, indicators covering other steps of pig production, such as transportation and slaughtering were excluded, even though they are regarded as very important [36,37]. The ECO indicators were selected based on a literature review described in [38]. The ENV indicators were a combination of environmental LCA indicators, based on LCA studies, e.g., [39,40,41] and described in the study of [42], with the environmental key performance indicators selected from the SMART [25] and SAFA guidelines [26,32]. Moreover, the SOC indicators originated from the SAFA guidelines [26,32]. The AHW indicators were selected from previous projects, including ProPig [43] and Welfare Quality® [44]. The detailed protocol was refined in iterative discussions within the consortium and in stakeholder workshops, as well as by including pilot farm visit experiences [35].
The second step was the application of the detailed assessment protocol between May and October in 2018 on 63 commercial pig farms in seven European countries (Austria: 10, Germany: 9, Finland: 8, Italy: 10, the Netherlands: 9, Poland: 10, and the United Kingdom: 7). The farms were selected to represent the most common pig production systems within each country (conventional, organic, and other labels). The 63 farms consisted of 13 breeding, 23 finishing, and 27 breeding-to-finishing farms. The data collection included an interview with the farm manager, the use of farm records (e.g., reproductive performance), using 2017 as the reference year, and direct observations of the animals (e.g., occurrence of tail lesions). Before the start of the farm visits, two experienced pig researchers (CM, CL) trained two observers in performing direct observations (AR, JH). Before and after the visit, an interobserver reliability test was conducted. The outcomes of these trainings and the interobserver reliability test sessions are presented in Supplementary Material Table S13. Table 2 gives an overview of the characteristics of the visited farms, which differed in many aspects, such as size, productivity, and membership of labelling schemes. Overall, 23 farms were conventional, 9 farms were certified as organic, and 31 farms produced for other country-specific labels (e.g., higher animal-welfare standards or GMO-free feed).
The third step was to condense the detailed protocol based on the farm visit experiences [35]. Some indicators were excluded, some new indicators were added, and some were adapted due to data availability, validity, reliability, and feasibility. The final condensed protocol consisted of 16 ECO indicators, 42 ENV indicators, 42 SOC indicators and 76 AHW indicators (Table 1). The indicators included categorical (e.g., surgical castration of male piglets carried out or not), ordinal (e.g., thin, medium, or thick bedding), and continuous (e.g., post-weaning mortality rate) formats. The complete protocol can be applied in one day on a pig farm by the farmer or an external person.

2.2. Scaling of Indicators

All the indicators were scaled and transformed into scores ranging from 0 (minimum/worst) to 100 (maximum/best), in order to have a uniform scale across all the indicators. This was performed by attributing one value to each of the answers of the categorical indicators and likewise for the ordinal indicators (e.g., attribute 0, 50, and 100 to “no”, “partially”, and “yes”, respectively). For continuous indicators (e.g., mortality rate), the worst and best values were defined with a linear regression in between. The threshold as well as the scaling functions were defined by the SusPigSys consortium based on values derived from the literature and the SusPigSys data.

2.3. Allocation to Subthemes and Themes

In the next step, the themes were identified for each dimension (Table 1). The two ECO themes were defined by experts within the project consortium; the five ENV and the six SOC themes were based on the SAFA guidelines [26], whilst the six AHW themes were based on Welfare Quality® [44]. Furthermore, each theme was divided into several subthemes (see Supplementary Material Tables S1–S4). The indicators were then allocated to subthemes, whereby some indicators were allocated to several subthemes as required (e.g., tail lesions, ecological focus areas).

2.4. Weighting Procedure

The indicators were weighted for the calculation of the subtheme scores, and the subthemes were weighted for the calculation of the theme scores. The weights were determined with a Delphi-like approach [45], similar to the methodology of [46], using experts to evaluate the animal welfare indicators. The weighting process consisted of two rounds and was undertaken anonymously and included 36 experts (first round) and 26 experts (second round). The experts (external and from the consortium) were selected based on their field of research. In the first round, the experts (5 experts for ENV as well as SOC, 15 for AHW, and 11 for ECO) were asked to distribute 100% between the subthemes of each theme and 100% between the indicators within each subtheme. The median allocated values (weights) were then sent to the same experts again, and the experts were asked to either agree with the calculated median weights or to revise them. These results were then again collated, and the final weights were defined through calculating the median score.
The allocation of the ECO weights was different for each farm type in order to account for the indicators which could not be assessed on a certain farm type (e.g., number of weaned piglets on finishing farms). The same applied to AHW, for which the allocation differed between farm types as well as between farms with and without pasture. For this paper, due to the data quality aspects, we had to exclude five subthemes (see Supplementary Material Tables S1 and S4). As this exclusion took place after the expert survey had been undertaken, the weights for these subthemes/indicators were distributed across the remaining subthemes/indicators. The final weights used can be found in Supplementary Material Tables S1–S4.

2.5. Aggregation

The scores of the scaled indicators were multiplied with the expert weights, and the products were summed up to one value per subtheme and farm (subtheme score; Formula (1)).
S ( Subtheme ) = i = 1 n ( w i ( Indicator ) S i ( Indicator ) )
with S(Subtheme) = the respective subtheme score, wi(Indicator) = the weight of the respective indicator to a subtheme, and Si(Indicator) = the score of the respective indicator.
The subtheme scores were then multiplied with the expert weights for the subthemes, and the products were summed up to one value per theme and farm (theme score; Formula (2)).
S ( Theme ) = i = 1 n ( w i ( Subtheme ) S i ( Subtheme ) )
with S(Theme) = the respective theme score, wi(Subtheme) = the weight of the respective subtheme to a theme, and Si(Subtheme) = the score of the respective indicator.

2.6. Overall Contribution of Indicators to Sustainability Themes Scores

The overall contribution of each indicator to its respective theme was calculated with the following formula:
C(Indicator) = w(Indicator) ∗ w(Subtheme)
with C(Indicator) = the contribution of an indicator to the respective theme, w(Indicator) = the weight of the respective indicator to a subtheme, and w(Subtheme) = the weight of the respective subtheme to a theme. The indicators contributing to 10% or more than 10% of the overall theme score were summarised as median values in Table 3, Table 4, Table 5 and Table 6. The complete set of indicators with their contributions to the overall theme score can be found in the Supplementary Material Tables S9–S12. Sustainability challenges at the indicator level were selected when the indicator contribution was equal to or was more than 10% and if the indicator score was less than or equal to 25.

2.7. Statistics

Statistical analyses were undertaken in SAS 9.4 [47]. The mean absolute deviation from the median (MAD) was calculated as a measure for variation at the theme and subtheme level with the following formula:
MAD ( Theme ) = 1 n i = 1 n | S ( Theme ) M ( Theme ) |
with MAD(Theme) = the mean absolute deviation of a respective theme from the median within farm types, S(Theme) = the respective theme score, and M(Theme = the respective median score of a theme.

3. Results

In order to investigate the validity and suitability of the tool with respect to the reality of European pig production, we applied it to 63 farms. We first analysed which indicators had a high contribution to the overall theme scores (≥10%) as well as the performance of the farms for those indicators, in order to identify sustainability problems at the indicator level (indicator scores ≤ 25; Table 3, Table 4, Table 5 and Table 6). Then, we analysed the themes where the farms were performing best and worst (Figure 2 and Table 7). Lastly, we analysed the variability of the theme scores (Table 7).

3.1. Sustainability Challenges at Indicator Level

Table 3, Table 4, Table 5, Table 6 and Table 7 show all the indicators that contributed more than 10% to a theme score as well as the performance of the 63 farms at the indicator level. All the other indicators, with a contribution lower than 10%, can be found in Supplementary Material Tables S9–S12.

3.1.1. Economy

The ECO analysis was tailored to the farm types because not all the indicators were present on each, resulting in different numbers of indicators (Table 3). For ECO, each indicator contributed to one theme only.
Table 3, Table 4, Table 5, Table 6 and Table 7 can be read as follows (for example, with ECO1; Table 3): The theme ECO1 (Technical efficiency) consists of two to three subthemes and two to ten indicators depending on the farm type. On the breeding farms, the indicator Number of piglets weaned per sow and year had the highest contribution (25%) to the theme ECO1. The 13 breeding farms were scored on average (median) with 57. In contrast, on the breeding-to-finishing farms and on the finishing farms the indicator Feed conversion rate of finishing pigs contributed most to this theme (38% and 54%, respectively). Breeding-to-finishing and finishing farms had median scores of 56 and 49, respectively.
Within ECO2 (Economic resilience), the Percentage of family labour was most important on the finishing and breeding-to-finishing farms, with 38%, whereas on the breeding farms Number of sows per annual working unit contributed most to the outcome (43%).
The lowest median scores (performance of the pig farms) were found for the indicators Percentage of family labour (breeding farms: 0), Number of sows per annual working unit (breeding and breeding-to-finishing farms: 18, 11), Number of finishing pigs per annual working unit (0, 0), and kg of pig meat per annual working unit (3, 30).
Table 3. ECO indicators contributing highest to the respective ECO themes (indicator contribution in percentage) as well as median indicator scores (indicator scores on a scale from 0 = worst to 100 = best) by farm type (B = breeding farms, BF = breeding-to-finishing farms, F = finishing farms).
Theme and Indicators Contributing Highest to Theme ScoresIndictor ContributionsIndicator Scores (Median)
BBFFB (n = 13)BF (n = 27)F (n = 23)
ECO1 Technical efficiency (n subthemes/n indicators) *2/83/102/2
Feed conversion rate finishing pigs (FCR)0%38%54%-5649
Number of piglets weaned per sow and year25%16%0%5738-
Pre-weaning mortality rate21%10%0%4454-
Post-weaning mortality rate20%9%0%6770-
Sow mortality10%5%0%6898-
Finishing pigs mortality rate0%9%46%-7580
ECO2 Economic resilience (n subthemes/n indicators) *2/32/52/4
Percentage of family labour38%38%38%060100
Percentage of rented land19%19%19%4266100
Number of sows per annual working unit43%14%0%1811-
Number of finishing pigs per annual working unit0%8%12%-00
Kilo of pig meat per annual working unit0%21%31%-330
n = number. * Total number of subthemes and indicators with the respective theme. The complete list of subthemes and indicators can be found in Supplementary Material Table S1 and Supplementary Material Table S9.

3.1.2. Environment

The ENV themes consisted of two to three subthemes and 17 to 24 indicators (Table 4). Some ENV indicators contributed to several themes. In all the themes except for ENV5 (Material and energy), two to three indicators each contributed more than 10% to a theme.
The following indicators contributed most to the respective environmental themes (ENV1-5): ENV1 (Atmosphere): Techniques for reducing emissions (16%) and ENV2 (Water): Water-saving technology in the barn (17%). Within ENV3 (Soil), there were three indicators, which contributed similarly (10%): Arable land not ploughed, Conversion of permanent grassland into arable land, and Land use (ha per tonne of pig). Ecological compensation area (12%) and Woodland on farm contributed the most (12%) to ENV4 (Biodiversity), whereas for ENV5 (Material and energy), only 1 out of 19 indicators contributed more than 10%, namely Proportion of discarded inputs (27%). Farms (breeding, breeding-to-finishing, and finishing farms) performed the worst within the ENV dimensions for the following indicators: Techniques for reducing emissions (median scores: 0, 0, 0), Arable land not ploughed (10, 33, 0), Ecological compensation area (0, 0, 0), and Woodland on farm (16, 16, 15).
Table 4. ENV indicators contributing highest to the respective ENV themes (indicator contribution in percentage) as well as median indicator scores (indicator scores on a scale from 0 = worst to 100 = best) by farm type (B = breeding farms, BF = breeding-to-finishing farms, F = finishing farms).
Theme and Indicators Contributing Highest to Theme ScoresIndicator ContributionsIndicator Scores (Median)
AllB (n = 13)BF (n = 27)F (n = 23)
ENV1 Atmosphere (n subthemes/n indicators) *2/17
Techniques for reducing emissions16%000
Acidification potential expressed per kg BMG14%847774
Greenhouse gas emissions expressed per kg BMG13%636847
Greenhouse gas emissions expressed per area10%817869
ENV2 Water (n subthemes/n indicators) *2/24
Water-saving technology in the barn17%100100100
Sufficient water supply or storage capacities10%100100100
Water-saving technology for irrigation of fields (e.g., drip irrigation)10%100100100
ENV3 Soil (n subthemes/n indicators) *2/21
Arable land not ploughed10%10330
Conversion of permanent grassland into arable land10%100100100
Land use10%10088100
ENV4 Biodiversity (n subthemes/n indicators) *3/18
Ecological compensation area12%000
Woodland on farm12%161615
ENV5 Material and energy (n subthemes/n indicators) *3/20
Proportion of discarded inputs27%98100100
n = number. * Total number of subthemes and indicators with the respective theme. The complete list of subthemes and indicators can be found in Supplementary Material Table S2 and Supplementary Material Table S10.

3.1.3. Social Wellbeing

The SOC themes consisted of one to four subthemes and each indicator contributed to one theme only. Compared to the other dimensions, only a few indicators contributed to the different themes (four to six indicators per theme), except for SOC1 Decent livelihoods (19 indicators; Table 5). For SOC1 (Decent livelihoods), only 1 out of the 19 indicators contributed at least 10% to the overall theme score, namely Relevance/importance of succession (15%). In theme SOC2 (Fair trading practices), Fairness of prices/buyers paying was the most important (30%). In SOC3 (Labour rights), Sufficient number of workers (42%) and SOC4 (Gender equality) contributed the most (30%). SOC5 (Human health and safety) consisted of four indicators, which contributed equally (25%) to the theme score: Health and safety training provision for employees, Status of workplace (buildings, machinery, etc.), with regard to health and safety, Accident and injury rate on farm, and Provision of protective equipment to employees. Regarding SOC6 (Good governance), Responsibility for negative environmental impacts contributed the most (25%).
Within the SOC dimension, five indicators had a high contribution and at the same time a low median score: Fairness of prices throughout supply chain (breeding farms: 5); Fairness of contracts/agreements with input suppliers (breeding-to-finishing farms: 25); Clear rules/guidelines regarding non-discrimination (finishing farms: 0); Transparent/written non-discrimination rules (all farms: 0); and Communication of risks to others (all farm types: 0).
Table 5. SOC indicators contributing highest to the respective SOC themes (indicator contribution in percentage) as well as median indicator scores (indicator scores on a scale from 0 = worst to 100 = best) by farm type (B = breeding farms, BF = breeding-to-finishing farms, F = finishing farms).
Theme and Indicators Contributing Highest to Theme ScoresIndicator ContributionIndicator Scores (Median)
AllB (n = 13)BF (n = 27)F (n = 23)
SOC1 Decent livelihoods (n subthemes/n indicators) *4/19
Succession 15%100100100
SOC2 Fair trading practices (n subthemes/n indicators) *2/4
Fairness of prices (buyers pay)30%757575
Fairness of prices (throughout supply chain)25%255050
Fairness of contracts/agreements with input suppliers25%502550
Access to market information (e.g., price)20%100100100
SOC3 Labour Rights (n subthemes/n indicators) *2/4
Sufficient number of workers 42%100100100
Workers’ understanding of their rights28%100100100
Children (under 16) involved on farm work21%100100100
SOC4 Gender and equality (n subthemes/n indicators) *3/5
Gender equality 30%7510050
Vulnerable groups25%100100100
Equal access to training opportunities for all workers23%100100100
Clear rules/guidelines regarding non-discrimination11%1001000
Transparent/written non-discrimination rules11%000
SOC5 Human health and safety (n subthemes/n indicators) *1/4
Health and safety training provision for employees25%100100100
Status of workplace regarding health and safety 25%757575
Accident and injury rate on farm25%100100100
Provision of protective equipment to employees25%100100100
SOC6 Good governance (n subthemes/n indicators) *2/6
Responsibility for negative environmental impacts25%100100100
Positive contribution to local economy18%757575
Positive contribution to local environment18%755075
Positive contribution to local culture15%757575
Risk level of polluting/contaminating the environment15%100100100
Communication of risks to others (potentially affected) 10%000
n = number. * Total number of subthemes and indicators with the respective theme. The complete list of subthemes and indicators can be found in Supplementary Material Table S3 and Supplementary Material Table S11.

3.1.4. Animal Health and Welfare

The AHW analysis was also specific for each farm type and thus shows different numbers of indicators in Table 6. Each AHW theme consisted of three to eight subthemes and 5 to 26 indicators, whereby some indicators contributed to several themes.
Indicators with the highest contributions across all the farm types were: Quality of roughage (AHW1 Absence of hunger and thirst: 14 to 33%); Total indoor area per pig (AHW2 Comfort: 14 to 19% and AHW5 Possibility to perform appropriate behaviour: 12 to 15%); and Mortality (AHW3 Absence of injury and disease: 29%). Hospitalisation (20%) had the highest impact on AHW4 (Absence of pain by management) on breeding and breeding-to-finishing farms, whereas tail docking (33%) contributed the most on finishing farms. Within AHW6 (Human–animal relationship), the following four indicators contributed the most and equally (15%) to the overall theme score: Difficulty with moving of pigs; Nervousness of pigs; Influence of farmer’s wellbeing on welfare of pigs; and Good sow/pig welfare is directly linked to good overall farm performance.
The worst performance at the indicator level was found for Castration on breeding and breeding-to-finishing farms, with a median score of 25 for both, and Total indoor area per pig (14 and 29). Finishing farms performed poorly for Quality of roughage (median score: 0); Sufficient ratio of number of pigs per number of drinkers (0); Natural drinking behaviour (27); Suitable sick pen (0); Tail docking (0); and Ear lesions (0).
Table 6. AHW indicators contributing highest to the respective AHW themes (indicators contribution in percentage) as well as median indicator scores (indicator scores on a scale from 0 = worst to 100 = best) by farm type (B = breeding farms, BF = breeding-to-finishing farms, F = finishing farms).
Theme and Indicators Contributing Highest to Theme ScoresIndicator ContributionIndicator Scores (Median)
BBFFB (n = 13)BF (n = 27)F (n = 23)
AHW1 Absence of hunger and thirst (n subthemes/n indicators) *5/125/123/5
Quality of roughage14%14%33%40270
Sufficient ratio of number of pigs per number of drinkers8%8%23%50330
Natural drinking behaviour6%6%18%645527
Automatic drinking system5%5%5%100100100
Availability of drinkers, when feeding3%3%10%10059100
Shoulder lesions11%11% 8383-
Mortality (suckling piglets + weaners)11%11% 5463-
Age at weaning10%10% ---
AHW2 Pig comfort (n subthemes/n indicators) *8/178/175/11
Total indoor area per pig14%14%19%142946
Suitable sick pens12%12%16%50330
Proper creep area (suckling piglets + weaners)12%12% 5050.
Antibiotic respiratory disease treatment6%6%16%909090
AHW3 Absence of injuries and disease (n subthemes/n indicators) *6/216/216/14
Mortality29%29%29%5463-
Antibiotic respiratory disease treatment5%5%10%909090
AHW4 Absence of pain by management (n subthemes/n indicators) *4/114/114/6
Hospitalisation20%20%27%6789100
Tail docking 11%11%33%50500
Tail lesions9%9%14%675033
Ear lesions6%6%10%73500
Castration17%17% 2525-
Nose rings11%11% 100100-
AHW5 Possibility to perform appropriate behaviour (n subthemes/n indicators) *6/266/265/18
Total indoor area per pig12%12%15%142946
all
AHW6 Human–animal relationship (n subthemes/n indicators) * 3/8
Difficulty in moving pigs 15% 1007575
Nervousness of pigs 15% 1007575
Influence of farmer’s wellbeing on welfare of pigs 15% 507575
Good sow/pig welfare is directly linked to good overall farm performance. 15% 100100100
n = number. * Total number of subthemes and indicators with the respective theme. The complete list of subthemes and indicators can be found in Supplementary Material Table S4 and Supplementary Material Table S12.

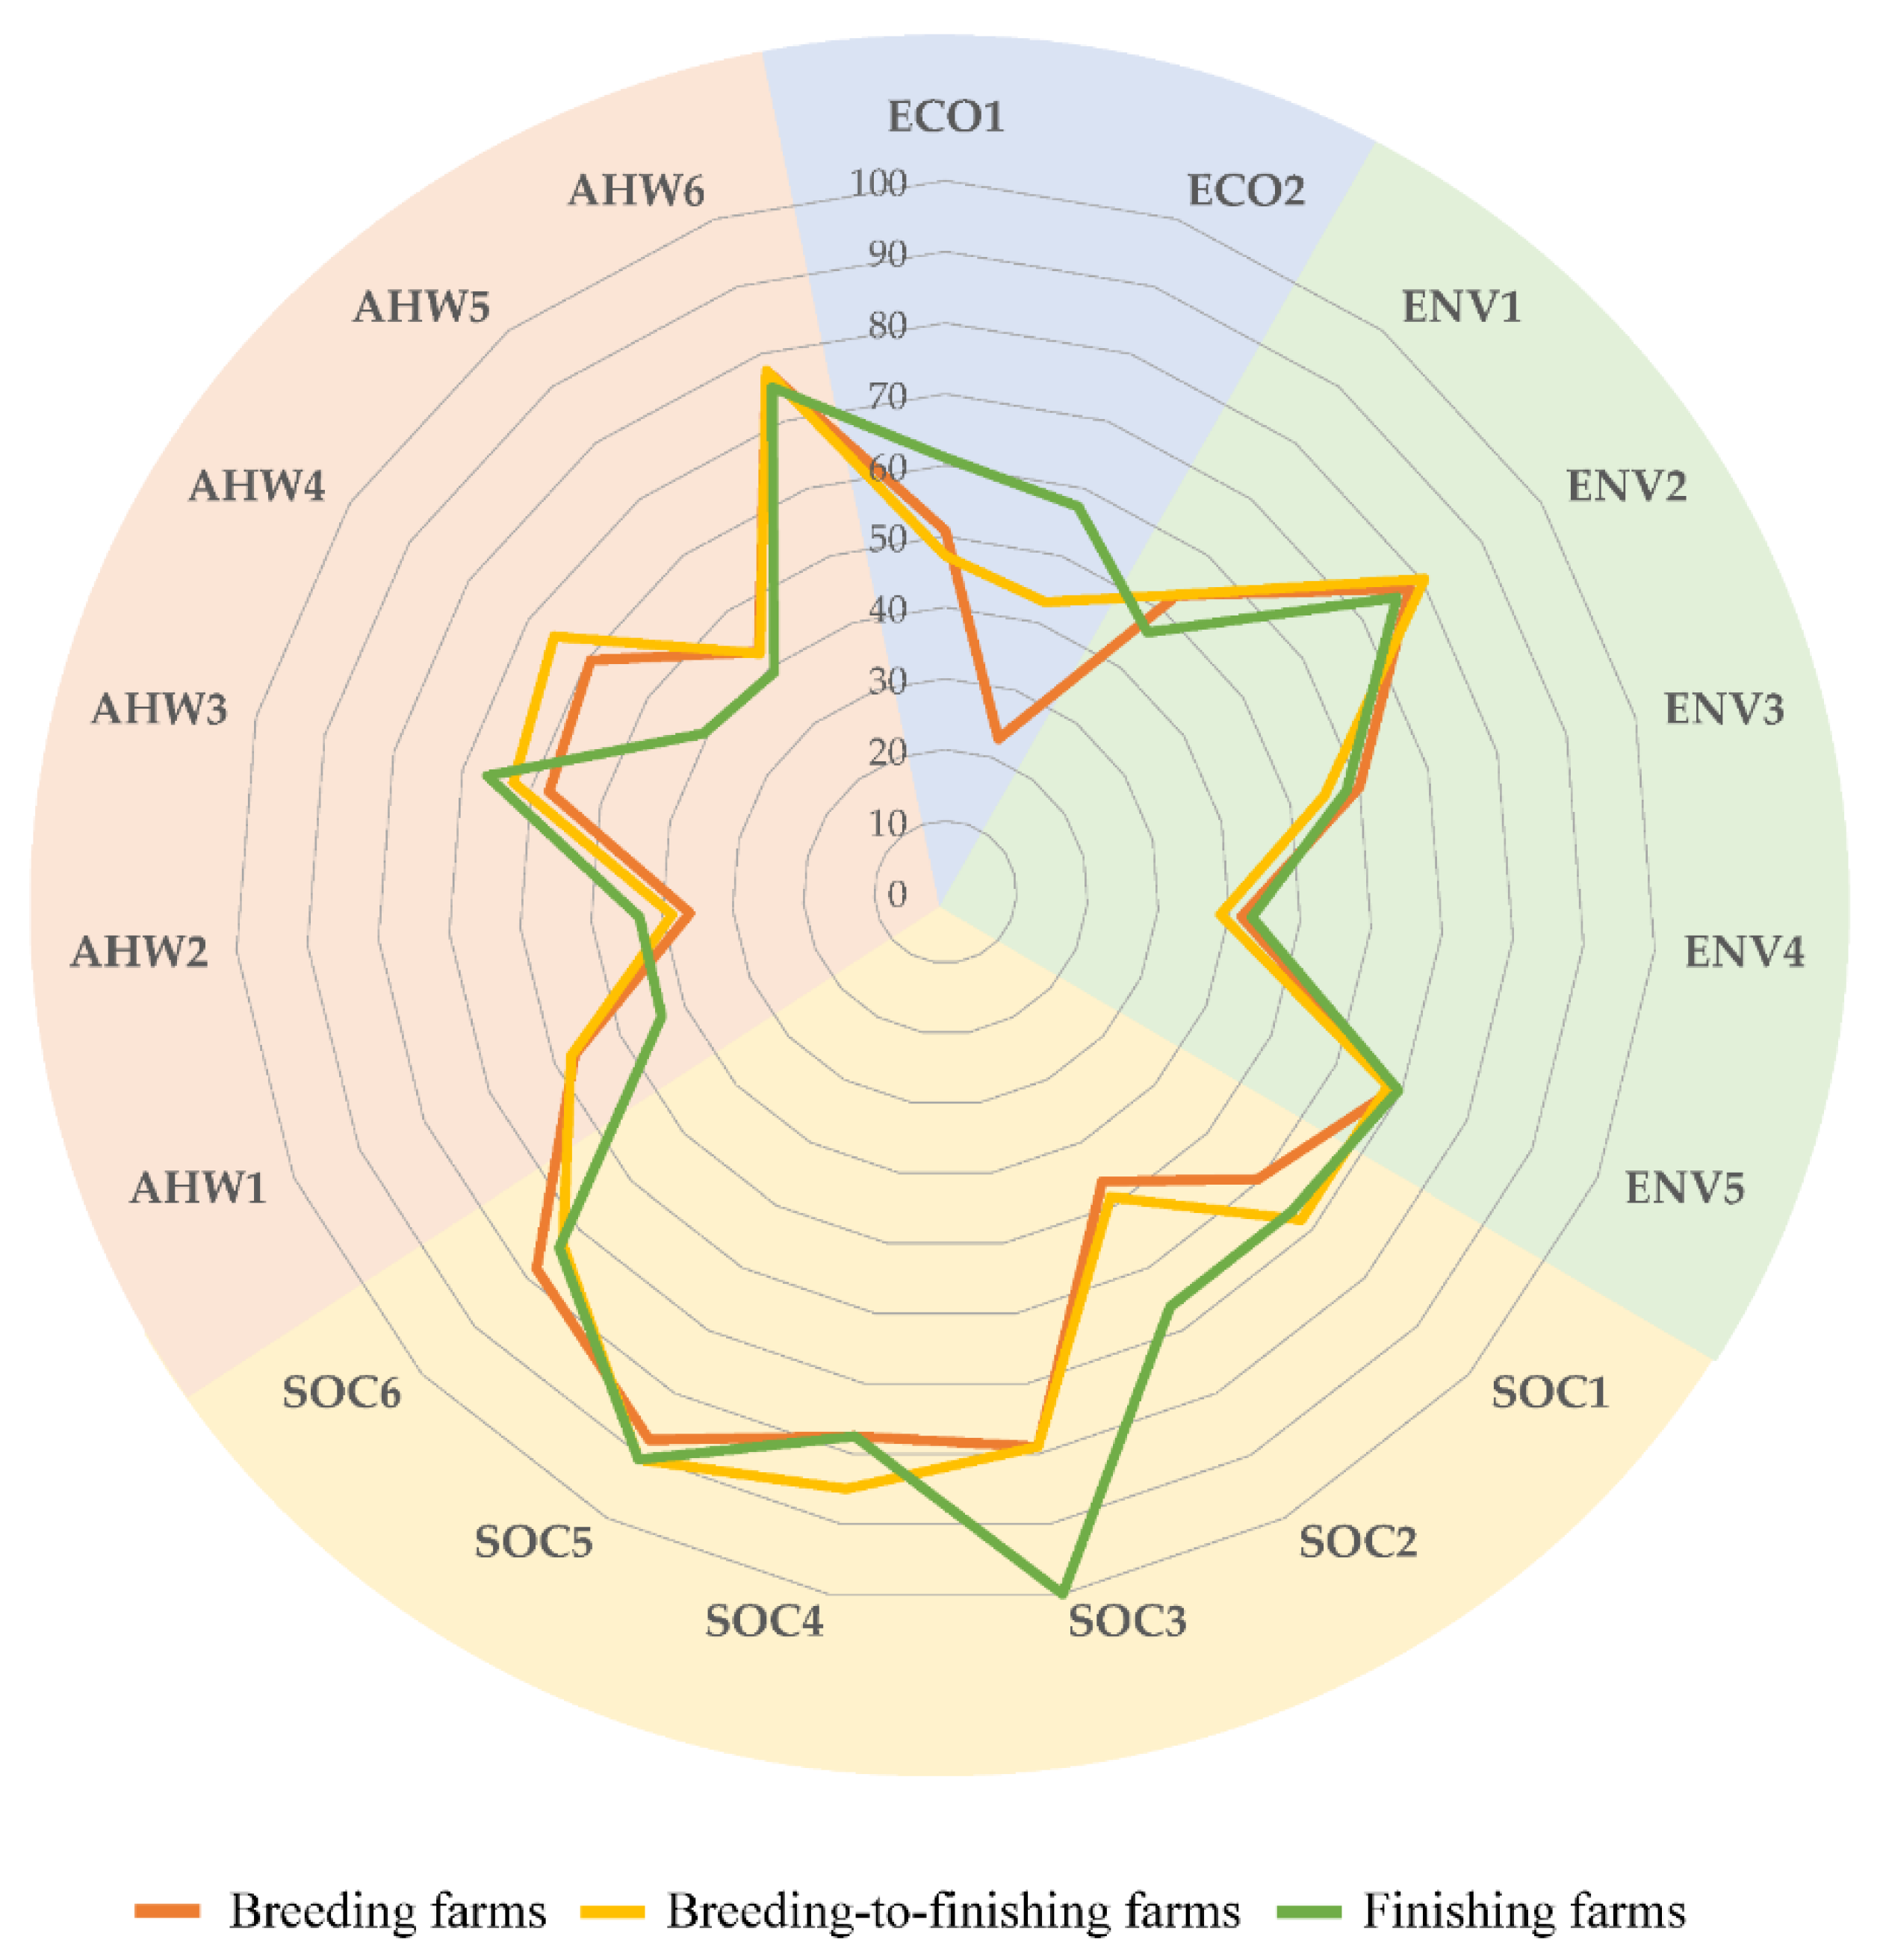
3.2. Themes with Best and Worst Sustainability Scores

Figure 2 and Table 7 show the sustainability results of the 63 assessed pig farms at the theme level. The relative importance of the different sustainability themes was not prioritised in any way. The results at the subtheme level can be found in Supplementary Material Table S5–S8. The themes with a low median score across all farm types were Comfort (AHW2; 36, 39, 43); Possibility to perform appropriate behaviour (AHW5; 43, 42, 39); and Biodiversity (ENV4; 42, 39, 43, for breeding farms, finishing farms, and breeding-to-finishing farms, respectively). The highest median scores across all farm types were found in Labour rights (SOC3; 79, 79, 100); Gender and equality (SOC4; 78, 85, 78); Human health and safety (SOC5; 88, 91, 91); Good governance (SOC6; 78, 73, 74), Human–animal relationship (AHW6: 78, 78, 75); and Water (ENV2; 78, 80, 76).
Table 7. Theme level sustainability scores by farm type. Scores of 0 represent worst and scores of 100 represent best sustainability.
Breeding FarmsBreeding-to-Finishing FarmsFinishing Farms
Dimension
Theme
MinMMaxMADMinMMaxMADMinMMaxMAD
Farms (n)132723
Economy
ECO128517610204775138619420
ECO27237518143701795710016
Environment
ENV1435367535537492946829
ENV2677886550808866576915
ENV3456071635557584258727
ENV4364270830396892843679
ENV5586975453688874869826
Social wellbeing
SOC1466079946688594766879
SOC2 04686211449881686610018
SOC3587910015587910014581001008
SOC4 40781001525851001148789312
SOC5 568810013389110012639110012
SOC6 4078100124873100105174939
Animal health and welfare
AHW1355768102957801120448716
AHW22136591018396272443699
AHW3445879737637672766838
AHW42960761224669790418016
AHW526435472942781016396410
AHW65078951051781008567510010
n = number, ECO1 (Technical efficiency), ECO2 (Economic resilience), ENV1 (Atmosphere), ENV2 (Water) ENV3 (Soil), ENV4 (Biodiversity), ENV5 (Material and energy), SOC1 (Decent livelihoods), SOC2 (Fair trading practices), SOC3 (Labour rights), SOC4 (Gender and equality), SOC5 (Human health and safety), SOC6 (Good governance), AHW1 (Absence of hunger and thirst), AHW2 (Pig comfort), AHW3 (Absence of injuries and disease), AHW4 (Absence of pain by management) AHW5 (Possibility to perform appropriate behaviour), AHW6 (Good human–animal relationship). Min = minimum, M = median, Max = maximum, MAD = mean absolute deviation from median: higher values mean higher deviation.

3.3. Sustainability Themes with Highest and Lowest Variability

The variability, calculated as the mean absolute deviation from the median (MAD), of Technical efficiency (ECO1) was highest on the finishing farms (MAD 20), whereas the breeding farms (MAD 10) and breeding-to-finishing farms (MAD 13) showed lower variability. Economic resilience had a high variability across all the farms (ECO2; MAD 16–18) compared to the other themes. The variability measures within the ENV themes were generally low in all the farm types (MAD 4 to 9; Table 7). The highest variability in the SOC dimension was found for the theme Fair trading practices (SOC2; MAD 16–21), and the lowest was for Decent livelihoods (SOC1; 9). Within the AHW dimension, the highest variability was found on the finishing farms for Absence of hunger and disease (AHW1; 16) and Absence of pain by management (AHW4; 16). The lowest variability was found across all the farms in Absence of injuries and disease (AHW3; MAD 7 to 8).

4. Discussion

The two general aims of this publication were (1) to describe and critically discuss the development of the sustainability assessment tool, which was based on an MCA framework, and (2) to apply the tool on 63 European pig farms in order to investigate the suitability and ability of the tool to reflect real sustainability problems. In the following sections, we first discuss the individual steps of the development; this is followed by a discussion of the application.

4.1. Development and Critical Discussion of the MCA Sustainability Assessment Tool

The way in which an MCA is framed is directly influenced by underlying definitions and the perceptions of the tool developers [48]. This should be kept in mind when interpreting the results and drawing conclusions. Transparency is a crucial aspect in developing a tool [24]. Therefore, in the following paragraphs we are going to analyse and critically discuss the development of our MCA sustainability assessment tool.

4.1.1. Selection and Characteristics of Indicators

The selection of indicators is the first challenge when setting up an MCA as the set of indicators needs to comprehensively and reliably represent the complexity of a pig production system. This plays a crucial role as this influences the extent and depth of the covered sustainability themes. At the same time, the set of indicators needs to be feasible for data collection and useful to farmers. That means that the indicators need to be understandable, and farmers should have the ability to influence them in order to actually improve the situation [49].
We used existing assessment protocols as a starting point (e.g., SAFA [26], SMART [50], and Welfare Quality® [44]) as they include a range of validated and repeatable indicators. However, as SAFA and SMART were not specifically developed for pig farms and Welfare Quality® was too detailed for the assessment of a pig farm in combination with the other dimensions, we had to compile a new protocol. This was carried out by selecting indicators based on literature research (e.g., acidification potential and ECO indicators) in order to select key indicators (e.g., the most important AHW indicators from Welfare Quality®) and adapt them to suit the purpose of our sustainability assessment tool.
The practicability, including data availability, was tested through farm visits. As a result, we excluded and adapted some indicators. For example, we removed Lameness in gestating sows from the AHW protocol as the layout of most gestating barns did not allow for a valid lameness assessment, even though sow lameness was considered as a highly relevant AHW indicator [51]. Another important aspect was the duration of the overall assessment as many farmers might have had limited time available. For a tool to be successful, its benefits for the farmer must exceed its costs, including the time invested for conducting the assessment [52]. Therefore, animal-based indicators were changed to a categorical assessment (e.g., tail lesions: 0%, ≤10% and >10% of affected pigs/pen) instead of calculating the true pen prevalence in percent.
Furthermore, the choice of the indicator type needs careful consideration. The ENV and the AHW dimensions included both categorical/ordinal and continuous indicators, whereas the SOC included only categorical/ordinal and the economy dimension only continuous indicators (Table 1). At a later stage, the ECO dimension was expanded with categorical indicators to address resilience in more detail [38]. Continuous indicators usually provide more room for differentiation between different farms.
For some aspects, however, it made more sense to use categorical/ordinal indicators for the assessment. One example is biodiversity, which was not assessed by outcome-based (continuous) indicators (e.g., counting numbers of different species) [49,53] or by calculating potential species losses [54,55] but by a key performance indicator assessment addressing all three subthemes of Habitat Diversity, Species Diversity, and Genetic diversity. The reason is that due to limited time, biodiversity could not be assessed comprehensively with continuous indicators. However, categorical/ordinal indicators still allowed us to include this topic as these indicators are less time-consuming but still provide an overview of the key areas of on-farm biodiversity. Therefore, we suggest using continuous indicators in combination with categorical/ordinal ones in order to cover different sustainability topics.

4.1.2. Scaling of Indicators

As the selected indicators have different units, the next step was “scaling”, i.e., transforming all the indicators into a uniform “currency” (0 = worst to 100 = best). This improves the comprehensibility for farmers, especially regarding the interpretation of values (e.g., kg CO2-eq per kg body mass net sold). We set thresholds (for interventions and goals) and scaling functions based on the literature and the preliminary results from the pig farm visits. However, for some thresholds this was difficult due to a lack of data. For such indicators, e.g., Space allowance (m2 per pig), we based the thresholds on expert opinion. Experts with different backgrounds from different countries and with experiences of the various husbandry systems are important in order to establish thresholds that are widely applicable. Thresholds have to be evaluated with real data in order to check whether it is possible to achieve scores from 0 to 100. One specific example of an indicator, namely Number of pigs per annual working unit, will be discussed later in order to demonstrate the impacts of the chosen thresholds.

4.1.3. Allocation of Indicators to Subthemes and Themes

The allocation of indicators to subthemes and themes also has an important impact on the outcome. If one indicator is repeatedly included in different subthemes, it receives a high total weight, and therefore, the poor/good performance of such an indicator has a high influence on the overall theme scores. The MCA framework differed for the four sustainability dimensions. In the AHW and ENV dimensions, some indicators contributed to several themes, whereas in ECO and SOC each indicator contributed only to one theme. Therefore, in AHW and ENV, if a farmer improves one of those indicators (e.g., ecological compensation area), he/she can improve the sustainability performance of different themes at the same time (e.g., ENV1 to ENV5; Supplementary Material Table S10). Additionally, it has to be pointed out that some indicators contributed to themes within different dimensions, such as Mortality with impacts within ECO (fewer pigs sold), ENV (waste of resources [56]), and AHW (high mortality is a health and welfare problem [57]), and therefore also had a very high overall contribution.

4.1.4. Weighting Procedure and Aggregation

In order to reduce the subjectivity of the weighting procedure [49], we established the weights for the MCA through a Delphi-like approach [45,46]; to establish consensus, we collected the experts’ opinion in two rounds. As we included only scientists as experts, it would be interesting to expand this procedure to other stakeholders, e.g., farmers and advisors, in order to base the weights on a broader expertise and to investigate differences between the stakeholder groups. We further recommend conducting a sensitivity analysis [58,59] in order to obtain additional information on the impacts of the different weights. For example, the weight of an indicator with a high contribution could be doubled or halved and the weights of the others adapted, respectively, in order to analyse the overall impact on the theme score.
As the weighting procedure was performed on two levels (indicators within subthemes and subthemes within themes), we recommend calculating the overall contribution of each indicator to the respective theme in order to evaluate and potentially adapt the importance of each indicator (Table 3, Table 4, Table 5 and Table 6). This could mean adapting the weights or the number of indicators per subtheme. This issue can be illustrated with the theme ENV2 (Water), which consisted of two subthemes: Water withdrawal and Water quality. Water withdrawal consisted of six indicators and Water quality included 18 indicators (Table 4). Both subthemes, however, were equally important and therefore both contributed 50% to the theme score. Therefore, the indicators from the subtheme Water withdrawal (such as Water saving technologies in the barn and Storage capacities) had the highest contribution to the overall theme score (Table 4), whereas other indicators, such as the LCA-based Eutrophication potential belonging to the second subtheme Water quality, had only a small contribution (see Supplementary Material Table S10). Even though at first glance this result seemed strange, the selection of different numbers of indicators for these two subthemes can be explained by the fact that water quality depends on many aspects (e.g., adapted fertilizing management and buffer zones), whereas the available water quantity depends on fewer indicators, of which only a few can be influenced by the farmer. The amount of available water depends largely on climate and precipitation, and the farmer can only ensure access to sufficient water and apply water-saving technologies.
A similar example to be discussed is the theme SOC1 (Decent livelihood). This theme consisted of four subthemes (Supplementary Material Table S3) with Quality of life having the highest weight (45%) and Succession having the lowest weight (15%). Therefore, it might be surprising that the indicator Succession belonging to the subtheme Succession had the highest contribution to this theme (Table 5), whereas other indicators (e.g., Job satisfaction, Leisure time with family, Workload) did not contribute an amount equal to or more than 10%. This can be explained by the fact that the subtheme Succession consisted of only one indicator, whereas the subtheme Quality of life consisted of 11 indicators. This imbalance overruled the subtheme weightings. Therefore, we suggest, that it would be important to present the contributions of the indicators to the experts in a third round in order to establish the final weight.

4.2. Application of the Tool on European Pig Farms

In the following paragraphs, we discuss the application of the tool on 63 European pig farms with regard to its reflection of “real farm” problems. This is a crucial part of examining the suitability of the tool. Therefore, first we focus on the indicators that were highly relevant for a good overall theme score, but for which the farms were performing poorly (Table 3, Table 4, Table 5 and Table 6). Second, we discuss the results at the theme level, focusing on the best and worst theme scores (Table 7). Finally, we discuss the variability found within themes (Table 7). If all the farms were scored similarly, then the tool was not suitable for differentiating between the farms.

4.2.1. Sustainability Challenges at Indicator Level

Within the ECO dimension, Number of sows, Number of finishing pigs, and Kilograms of pig meat per annual working unit were indicators with a high contribution and very low median scores, meaning poor sustainability (Table 3). One possible explanation is the inclusion of organic farms (Council Directives 2007/834/EC and 2008/889/EC) and farms with labels that include higher animal welfare requirements as they are usually more labour intensive [60], and the number of sows per annual working unit is usually lower compared to conventional farms. Furthermore, the predominance of family farms in Europe [61,62] might have had an impact as well because in many countries family farms are still small in order to cover the work within the family [63]. Therefore, the thresholds of these indicators (e.g., Number of sows per annual working unit: 0 points for ≤60 sows to 100 points for ≥250 sows per annual working unit) might not be suitable for the structure of all pig farms in Europe. It should therefore be discussed whether the tool should be adapted and made, e.g., country-specific in order to take different farm sizes and structures into account.
The ENV indicators with low sustainability scores in our study have also been identified as sustainability problems on other farms in Europe by other studies: Arable land not ploughed [64], Techniques to reduce emissions [65,66], Ecological focus areas [67], and Woodland on farm [68]. They are important for a clear atmosphere and healthy soil and to sustain biodiversity. Based on the literature, it seems justified that these indicators were given high weights in our assessment.
Out of 23 indicators, only 5 problematic SOC indicators contributing more than 10% to a respective theme were found within our farm sample: Fairness of prices throughout the supply chain (breeding farms), Fairness of contracts/agreements with input suppliers (breeding-to-finishing farms), Communication of risks to others that might be affected, Clear rules/guidelines regarding non-discrimination, and Transparent/written non-discrimination rules (Table 5). As the social indicators were about the perception of the farmer and assessed by pseudo-continuous indicators on a scale of 1 to 5 given by the farmer or by categorical indicators, one explanation for why most indicators were answered with a high score could be the “social desirability bias” [69]. This means that farmers might have felt obligated to answer, e.g., that they were having no negative impact on the environment in order to give a socially accepted correct answer. This could be improved by asking the questions ‘the other way round’ or in such a way that farmers perceive less clearly which answer is socially desirable [70]. It would also be interesting to add continuous indicators based on records (e.g., daily workhours). However, as a first step, we recommend letting farmers fill in the questionnaire by themselves, without an external assessor, to reduce potential social pressure.
Within the AHW dimension, the following indicators had a high contribution to AHW sustainability theme scores but mostly poor performance: Quality of roughage, Total indoor area, Sick pen, Tail docking, and Castration (Table 6). These results can be explained by the EU legal regulation setting minimum requirements only (Council Directive 2008/120/EC) and reflect the actual situation of many farms in Europe. Aspects such as provision of roughage [71], space allowance [72,73], and tail docking [74] have been identified as welfare problems.
When improving single indicators within a dimension, however, it is necessary to understand the impacts on all dimensions, whether there is a synergy, no effect, or a trade-off. This is highly relevant when seeking to make decisions affecting all the dimensions of sustainability. For example, as discussed above, animal welfare improvement measures such as providing straw might be good for pigs but connected with higher work input [60] or costs [75]. On the other hand, improving the Number of sows per annual working unit could risk the quality of the human–animal relationship as the amount of human–animal contact decreases [76]. We recommend that more emphasis should be placed on the potential for synergies/trade-offs in future sustainability assessment research as to date there is little scientific knowledge about these effects.

4.2.2. Themes with the Best and Worst Sustainability Scores

Median scores give information about the average performance of the sampled farms. The breeding farms, finishing farms, and breeding-to-finishing farms had a similar distribution of sustainability scores at the theme level (Figure 2).
Within the ECO dimension, the farms performed on average (median) moderately (around 50), except for breeding farms in ECO2 Economic resilience (23; Table 7). This was not surprising as the breeding farms were highly specialized and therefore had a high share of external labour, and at the same time, the Number of sows per annual working unit was rather low (see discussion above). However, it has to be kept in mind that the sample included only 13 breeding farms, in different production systems (e.g., organic), and therefore, the results might be case-specific.
Within the ENV theme, the farms performed best in ENV2 (Water) and worst in ENV4 (Biodiversity; Table 7). The good performance in the theme ENV2 (Water) is surprising considering the current European water quality status. A good ecological and chemical status was achieved only for around 40% of surface water in Europe and 75% of the ground water [77]. However, we can explain why the farms were scored with rather high scores; it was due to an imbalance of indicators contributing to two subthemes (see discussion above (4.1.4. Weighting Procedure and Aggregation).
ENV4 (Biodiversity) was the theme where the farms performed the worst within the ENV theme. This was in line with our expectation as for many years the focus of agriculture was on increasing the fields’ productivity. At the same time, biodiversity, which is highly relevant for food security (e.g., supporting populations of pollinators), has decreased rapidly in the last decades [78]. More about this topic can be found in one of our previous papers [42], in which we provide insights into the LCA and biodiversity performance of the same farms and show that combining different assessment methods leads to a comprehensive environmental sustainability assessment.
Overall, high median values were found for all the themes in the SOC dimension, except for the theme SOC2 (Fair trading practices). SOC2 was greatly influenced by the indicators which describe whether prices are perceived as fair or unfair, which reflects the financial pressure that farmers experience as many are forced by retailers to produce at very low cost [79]. Regarding other SOC themes, it was surprising that all scored rather high. For example, it is known that the breeding unit of a farm consists of periodical tasks and, compared to the finishing unit, is the most labour-intensive phase due to work associated with tasks such as insemination, farrowing assistance, and castration [80]. At the same time, the Number of sows per annual working unit has increased [80], and the agricultural sector is facing a substantial decline in employment [81]. Long working hours, precarious working conditions, and low wages are often unattractive, and thus, this sector relies on immigrants as the workforce [79]. However, SOC3 (Labour rights), which is highly influenced by the indicator Sufficient workers for the daily work (42%; Table 5), had a high median score across all farm types (100 in all farm types). This means that most farmers considered having a sufficient number of workers for their enterprise. One explanation might be the rather low Number of sows per annual working unit (see above).
When looking at Animal welfare, the majority of the farms performed rather poorly with regard to the theme AHW2 (Pig comfort). Intensification and financial pressure have led to the development of highly efficient pig farming systems (e.g., fully slatted floors and restricted spaces per pig). However, many of these systems do not fulfil the pigs’ needs and have negative impacts on the comfort, e.g., thermal or lying comfort. For example, fully slatted floors do not allow farmers to provide a bedded area where pigs can rest on a soft floor or root [82,83].
On the other hand, the farms performed well regarding the theme AHW6 (Human–animal relationship). This theme is about the farmers’ perception of, e.g., whether a farmer considers good animal welfare to be related to overall farm performance or not and whether it is important to avoid force when handling animals. This high score in this subtheme was unexpected as it is known that farmers have different perceptions of animal welfare. Some farmers see animal welfare as fulfilling the physiological needs of the animal, such by as providing an adequate diet, whereas others see animal welfare as the basis of the animals’ opportunity to express natural behaviour [84,85]. One explanation could again be the “social desirability bias” [69], where farmers feel morally obliged to answer that they consider a good human–animal relationship as important. Some studies have looked at the social desirability bias in consumers regarding sustainable food, as reviewed by [86], and some studies exist about the mismatch between the farmers’ answers regarding their animals‘ welfare and the direct observations made by an expert in the barn on, e.g., lameness in dairy cows [87]. Some studies have already investigated methods to reduce this bias (e.g., with the effect of indirect questioning and the information display matrix) [70,88]. However, it would be an interesting topic for further research to explore how the different ways of asking farmers influences their result. Moreover, similar to the SOC protocol, it would be interesting to complement these Human–Animal relationship themes with continuous indicators to complement this assessment with indicators that can provide a more detailed picture of the actual situation, e.g., the amount of time that is spent with pigs and the human approach test [44].

4.2.3. Variability at Theme Level

Variability, expressed as the mean absolute deviation from the median (MAD), gives information if the tool allows for differentiation. We included a large variety of farms in order to test the tool for different farming systems (Table 2). Pig farms are diverse with regard to management, the housing system, work, or animal performances [21,80]. This is an important strength of our study as it allows investigating whether the tool is able to show this variability.
Both ECO themes showed a high variability. However, none of the breeding or breeding-to-finishing farms were scored 100 (max 75), which would need an in-depth investigation on whether the thresholds were set at a level which was too ambitious (e.g., see the discussion above about the Number of sows per annual working unit).
On the other hand, the themes of the ENV dimension had a rather low variability across all themes and farm types. Some explanations for this might be the common legal requirements in EU countries and a comparable geographical situation (central parts of Europe except FI). Thus, the majority of farms in this study might follow, for example, just the legal standards regarding plant protection. In some aspects of sustainability, however, the standard might not be strict enough to achieve high levels of sustainability, e.g., a high biodiversity score. The ENV dimension in particular might lack incentives for farmers to do more than meet the minimum legal requirements. It is interesting to note that none of the farms was scored with 100 for any of the ENV themes. This reflects the multidimensionality of the themes whereby all the themes consisted of 17 to 24 indicators (Table 4), which made it very difficult to achieve a score of 100.
Within the SOC themes, interestingly, besides high median values, we also found a high variability. This means that even when the majority of the farms received high scores, some farms were scored rather poorly. The present study included small farms and large farms (17 to 1767 sows; Table 2) as well as family farms and farms with a high share of external labour (0 to 100% family internal workforce). Therefore, one explanation for the high median but large variability could be the difference in the size of the farms, the organisation, and the level of technology, as well as country/cultural differences. Another reason might be that different farmers also have very different expectations about quality of life in terms of leisure time, weekends, and preferences about daily work [80], which might have been reflected in their answers.
The variability of the AHW themes depended on the theme and farm type. Whilst some AHW themes did not show large variability, AHW1 Comfort and AHW4 Absence of pain by management displayed rather high variability in finishing farms. Similarly to the ENV themes, we explain the low variability in some themes (e.g., Pig comfort) by the fact that many farms followed only the minimal requirements (e.g., space allowance). In fact, for some sustainability indicators such as space allowance, we decided to set the thresholds more ambitiously than what might be found on real-world farms in order to give a hint for improvement. For example, in Austria, based on legal requirements a conventional lactating sows needs an indoor area of 4 m2 (BGBl. II Nr. 485/2004: 1. Tierhalteverordnung) and an organic lactating sow an indoor area of 7.5 m2 (Council Directives 2008/889/EC). However, we set the threshold for 100 points at 10 m2 as space allowance is a crucial factor for animal welfare [72,73]. This was similar for all the animal categories. The higher variability in AHW1 and AHW4 on the other hand might be due to the inclusion of farms with higher standards, e.g., organic regulation requiring, e.g., the provision of roughage and restricting mutilation. Similar to the ENV themes, most of the AHW themes consisted of several indicators (Table 6), which probably made it difficult for farms to achieve a composite score of 100.

4.3. Limitations, Further Research, and Applications

Compared to other sustainability assessment tools, such as RISE [28], SMART [25], and SAFA [29,30], the SusPigSys tool has advantages for pig farmers due to its specific focus on pig farming and the inclusion of a detailed AHW section. The tool can help pig farmers to improve farm management in an integrative way. However, one weakness of the tool could be the time needed to fill in the questionnaire. The calculation of a farm-specific LCA requires detailed data; additionally, the direct observation of pigs (e.g., tail lesions) is time-consuming. This might lead to questionnaires that are not completely filled in, and therefore, the analysis cannot be performed. However, both LCA and animal-based AHW analysis provide valuable information to pig farmers. This is clearly a trade-off between the time needed and the level of detail of the analysis, as also pointed out by [89]. We therefore suggest a study about the user-friendliness and the benefits for farmers similar to that of [31] in order to further develop the tool. In addition, it would be convenient to connect the app with already existing databases (e.g., productivity records and online slaughter data) to reduce the time spent with filling in the questionnaire. However, one problem could be data protection. Furthermore, the programming of such interfaces between databases and software applications needs the agreement from both parties and is usually difficult to organise, sometimes even impossible due to technical difficulties.
Another limitation of the tool is that it focuses mainly on most commercial farm types. For example, the number of indicators for pigs kept on pasture is rather small compared to the number of indicators for farms with pigs kept in barns. This would need further development of the indicators for pasture-based pig farms.
Further investigations could focus on the parameters, which were identified as responsible for high sustainability scores. This could help to identify iceberg-indicators in order to shorten the assessment. However, this also bears risks in that many details get lost, and the farm-specific feedback is less detailed. Therefore, such an assessment could be performed as a starting point in order to find out the weakest sustainability dimension of a farm, followed by further, more detailed analysis.
Another important aspect for further research is to analyse the farm and management characteristics to better understand why some farms perform better/worse than others with regard to the four dimensions. Furthermore, it would be interesting to investigate the farmers’ viewpoints on the motivational aspects of improving sustainability, in a manner similar to the study of [90], who conducted such a study on animal welfare.
Overall, the tool has not only benefits for pig farmers but also for other stakeholders. It could potentially be used in the future to examine whether the requirements for a specific label are met [91]. Furthermore, advisors could monitor the development of farms in terms of sustainability and focus their advice on the specific weaknesses of a farm or a group of producers. For further research, it would be interesting to apply the tool repeatedly, e.g., with the interval of one year in between, to monitor the effectiveness of the implemented sustainability measures.

5. Conclusions

This study has demonstrated that multi-criteria analysis is a suitable method for assessing the sustainability of pig farms as it allows the coverage of a wide range of topics relevant to sustainability. When setting up the MCA framework, however, each step is crucial for the outcome. For the selection of the indicators, we recommend including both categorical and continuous indicators in order to balance feasibility and the level of detail. The scaling should be based on the literature and should consider the variability of farms, including, e.g., outdoor farms. We recommend performing the weighting procedure with experts (scientists, advisors, and farmers) in several rounds. Furthermore, transparency is a key element of such an MCA, and all steps should be documented and communicated.
A crucial part of the development of a tool is the evaluation of its suitability for European pig farms. In several themes, our tool reflected the sustainability challenges of pig production, which are controversially discussed in society, e.g., pig comfort and biodiversity. However, we recommend that some themes and indicators (e.g., Number of sows per annual working unit, Succession) be considered in more depth as the low scores may have been influenced by our sample, choice of thresholds, and weighting procedure. In the next step, a sensitivity analysis should be performed in order to evaluate, for example, the expert weights. Furthermore, the validity of the tool should be investigated through comparing the output from the present sustainability tool with the already existing tools.
Overall, the sustainability assessment tool developed within the SusPigSys project provides a comprehensive view of a farm on the theme level so that the farmer receives a first insight about the farms strengths and weaknesses, i.e., a so called hot-spot analysis. This paper covers gaps within the literature of sustainable agriculture (e.g., by examining sustainability at the farm level through the lens of four dimensions, including AHW). It contributes to the development of a robust integrated sustainability framework which can be applied by researchers. Moreover, this tool allows pig farmers to assess, benchmark, and potentially improve their farm sustainability performance based on their results.

Supplementary Materials

The following are available online at https://www.mdpi.com/article/10.3390/su14105988/s1, Supplementary Material Table S1: allocated weights of subthemes within themes and the number of indicators per subtheme for the economic dimension and the three farm types, Supplementary Material Table S2: allocated weights of subthemes within themes and the number of indicators per subtheme for the environmental dimension. Weights were the same across all farm types, Supplementary Material Table S3: allocated weights of subthemes within themes and the number of indicators per subtheme for the social dimension. Weights were the same across all farm types, Supplementary Material Table S4: allocated weights of subthemes within themes and the number of indicators per subtheme for the animal health and welfare dimension. Weights were distinguished for farm type and farms with and without pasture access as well as mixed systems, Supplementary Material Table S5: economical sustainability performance (min, median, max) of breeding, finishing, and breeding-to-finishing farms on sub-theme level, Supplementary Material Table S6: environmental sustainability performance (min, median, max) of breeding, finishing, and breeding-to-finishing farms on theme and sub-theme level, Supplementary Material Table S7: social sustainability performance (min, median, max) of breeding, finishing, and breeding-to-finishing farms on theme and subtheme level, Supplementary Material Table S8: animal health and welfare sustainability performance (min, median, max) of breeding, finishing, and breeding-to-finishing farms on theme and subtheme level, Supplementary Material Table S9: contribution of all economic indicators to the respective themes in percentages, Supplementary Material Table S10: contribution of all environmental indicators to the respective themes in percentages, Supplementary Material Table S11: influence of all social indicators to the respective themes in percentages, Supplementary Material Table S12: Contribution of all animal health and welfare indicators to the respective themes in percentages (B = Breeding farms, F = Finishing farms, BF = Breeding-to-finishing farms). Part I, Supplementary Material Table S12: Contribution of animal health and welfare indicators to the respective themes in percentage. Part II, Supplementary Material Table S12: Contribution of animal health and welfare indicators to the respective themes in percentages (B = Breeding farms, F = Finishing farms, BF = Breeding-to-finishing farms). Part III, Supplementary Material Table S13: interobserver reliability test (IOR).

Author Contributions

Conceptualization, A.K.R. and S.J.H.; data curation, A.K.R., S.J.H., J.H. and A.M.-R.; formal analysis, A.K.R. and S.J.H.; funding acquisition, S.J.H., J.G., C.L., A.V. and S.D.; investigation, A.K.R. and J.H.; methodology, A.K.R., S.J.H., J.G., J.H., R.H., C.H., N.K., C.L., A.M.-R., A.V. and S.D.; project administration, S.D.; resources, A.M.-R. and S.D.; software, A.K.R., S.J.H. and A.M.-R.; supervision, S.J.H., C.L. and S.D.; validation, A.K.R. and S.J.H.; visualization, A.K.R.; writing—original draft, A.K.R. and S.J.H.; writing—review and editing, A.K.R., S.J.H., P.F., J.G., J.H., R.H., C.H., N.K., C.L., A.M.-R., A.V. and S.D. All authors have read and agreed to the published version of the manuscript.

Funding

This research was made possible by funding from SusAn, an ERA-Net co-funded under the European Union’s Horizon 2020 research and innovation programme (www.era-susan.eu, accessed on 13 May 2022), under Grant Agreement n°696231. Open access funding provided by the Friedrich-Loeffler-Institut.

Institutional Review Board Statement

Ethical review and approval were waived for this study, because farmer participation was informed and voluntary, and animal observations were non-invasive. Farmers were interviewed during farm visits, and farmers and other stakeholders took part in workshops. All participation was voluntary, and participants could choose to end the interview/visit/workshop at any time. Participants were made clearly aware of the aims and contents of workshops and farm visits and informed according to GDPR. All data were anonymised before storage on European servers. Only the national contact person knew the identity of a farm. During farm assessment, pigs were scored for validated animal-based indicators in their home pens. Only non-invasive animal-based measures were used. Observers were experienced with pigs and instructed to behave in a calm manner around the pigs. Observations in a group of pigs were cancelled if it became apparent that the group was stressed or agitated by the presence of the observer.

Informed Consent Statement

Informed consent was obtained from all subjects involved in the study.

Data Availability Statement

The data presented in this study are available on request from the corresponding author. The data are not publicly available due to privacy reasons.

Acknowledgments

Direct observation data were collected by Juliane Helmerichs (in DE, IT, NL, and UK) and Antonia Ruckli (in AT, FI, and PL). Interview data were collected by Rachel Chapman (UK), Paolo Ferrari (IT), Monika Gebska and Agata Malak-Rawlikowska (PL), Juliane Helmerichs (DE), Antonia Ruckli (AT), Kirsi Swan (FI), and Herman Vermeer (NL). Icons were made by Ahmad Roaayala, berkahicon, Eucalyp, Freepick, joalfa, Kiranshastry, kurdanfell, mikan933, Pixel perfect, Smashicons and Voysla from www.flaticon.com (accessed on 15 November 2021).

Conflicts of Interest

The authors declare no conflict of interest. The funders had no role in the design of the study, nor in the collection, analyses, or interpretation of data, nor in the writing of the manuscript or in the decision to publish the results.

References

  1. Eurostat. Agriculture, Forestry and Fishery Statistics—2020 Edition. Available online: https://ec.europa.eu/eurostat/documents/3217494/12069644/KS-FK-20-001-EN-N.pdf/a7439b01-671b-80ce-85e4-4d803c44340a?t=1608139005821 (accessed on 8 December 2021).
  2. Augère-Granier, M.-L. The EU Pig Meat Sector. Available online: https://www.europarl.europa.eu/RegData/etudes/BRIE/2020/652044/EPRS_BRI(2020)652044_EN.pdf (accessed on 23 November 2021).
  3. Schodl, K.; Klein, F.; Winckler, C. Mapping sustainability in pig farming research using keyword network analysis. Livest. Sci. 2017, 196, 28–35. [Google Scholar] [CrossRef]
  4. Tilman, D.; Cassman, K.G.; Matson, P.A.; Naylor, R.; Polasky, S. Agricultural sustainability and intensive production practices. Nature 2002, 418, 671–677. [Google Scholar] [CrossRef] [PubMed]
  5. Agovino, M.; Casaccia, M.; Ciommi, M.; Ferrara, M.; Marchesano, K. Agriculture, climate change and sustainability: The case of EU-28. Ecol. Indic. 2019, 105, 525–543. [Google Scholar] [CrossRef]
  6. European Commission. Communication from the Commission: A Sustainable Europe for a Better World: A European Union Strategy for ‘Sustainable Development’; European Commission: Brussels, Belgium, 2002; pp. 261–264. [Google Scholar]
  7. Brundtland, G.H. Our common future: (“The Brundtland Report”): World Commission on Environment and Development. In The Top 50 Sustainability Books; Routledge: London, UK, 1987; pp. 52–55. [Google Scholar] [CrossRef]
  8. United Nations. Transforming Our World: The 2030 Agenda for Sustainable Development. Available online: https://sdgs.un.org/2030agenda (accessed on 23 November 2021).
  9. European Union. Farm to Fork Strategy. For a Fair, Healthy and Environmentally-Friendly Food System; European Union: Brussels, Belgium, 2020. [Google Scholar]
  10. Gerber, P.J.; Steinfeld, H.; Henderson, B.; Mottet, A.; Opio, C.; Dijkman, J.; Falcucci, A.; Tempio, G. Tackling Climate Change through Livestock: A Global Assessment of Emissions and Mitigation Opportunities; Food and Agriculture Organization of the United Nations (FAO): Rome, Italy, 2013. [Google Scholar]
  11. MacLeod, M.; Gerber, P.; Mottet, A.; Tempio, G.; Falcucci, A.; Opio, C.; Vellinga, T.; Henderson, B.; Steinfeld, H. Greenhouse Gas Emissions from Pig and Chicken Supply chains—A Global Life Cycle Assessment; Food and Agriculture Organization of the United Nations (FAO): Rome, Italy, 2013; p. 171. [Google Scholar]
  12. Clark, M.A.; Domingo, N.G.; Colgan, K.; Thakrar, S.K.; Tilman, D.; Lynch, J.; Azevedo, I.L.; Hill, J.D. Global food system emissions could preclude achieving the 1.5 and 2 C climate change targets. Science 2020, 370, 705–708. [Google Scholar] [CrossRef]
  13. European Commission. Attitudes of Europeans towards animal welfare. Available online: https://webgate.ec.europa.eu/ebsm/api/public/deliverable/download?doc=true&deliverableId=54424 (accessed on 10 October 2021).
  14. Bozzo, G.; Barrasso, R.; Grimaldi, C.A.; Tantillo, G.; Roma, R. Consumer attitudes towards animal welfare and their willingness to pay. Vet. Ital. 2019, 55, 289–297. [Google Scholar] [CrossRef]
  15. Stolba, A.; Wood-Gush, D. The behaviour of pigs in a semi-natural environment. Anim. Sci. 1989, 48, 419–425. [Google Scholar] [CrossRef]
  16. Valros, A.; Heinonen, M. Save the pig tail. Porc. Health Manag. 2015, 1, 2. [Google Scholar] [CrossRef]
  17. Terlouw, E.; Lawrence, A.B.; Illius, A.W. Influences of feeding level and physical restriction on development of stereotypies in sows. Anim. Behav. 1991, 42, 981–991. [Google Scholar] [CrossRef]
  18. European Commission. Dg Agri Dashboard: Pigmeat; European Commission: Brussels, Belgium, 2021. [Google Scholar]
  19. Willett, W.; Rockström, J.; Loken, B.; Springmann, M.; Lang, T.; Vermeulen, S.; Garnett, T.; Tilman, D.; De Clerck, F.; Wood, A. Food in the Anthropocene: The EAT–Lancet Commission on healthy diets from sustainable food systems. Lancet 2019, 393, 447–492. [Google Scholar] [CrossRef]
  20. Gunnarsson, S.; Arvidsson Segerkvist, K.; Wallgren, T.; Hansson, H.; Sonesson, U. A Systematic Mapping of Research on Sustainability Dimensions at Farm-level in Pig Production. Sustainability 2020, 12, 4352. [Google Scholar] [CrossRef]
  21. Bonneau, M.; Antoine-Ilari, E.; Phatsara, C.; Brinkmann, D.; Hviid, M.; Christiansen, M.G.; Fàbrega, E.; Rodríguez, P.; Rydhmer, L.; Enting, I.; et al. Diversity of pig production systems at farm level in Europe. J. Chain Netw. Sci. 2011, 11, 115–135. [Google Scholar] [CrossRef]
  22. Diaz-Balteiro, L.; González-Pachón, J.; Romero, C. Measuring systems sustainability with multi-criteria methods: A critical review. Eur. J. Oper. Res. 2017, 258, 607–616. [Google Scholar] [CrossRef]
  23. De Luca, A.I.; Iofrida, N.; Leskinen, P.; Stillitano, T.; Falcone, G.; Strano, A.; Gulisano, G. Life cycle tools combined with multi-criteria and participatory methods for agricultural sustainability: Insights from a systematic and critical review. Sci. Total Environ. 2017, 595, 352–370. [Google Scholar] [CrossRef] [PubMed]
  24. de Olde, E.M.; Bokkers, E.A.M.; de Boer, I.J.M. The Choice of the Sustainability Assessment Tool Matters: Differences in Thematic Scope and Assessment Results. Ecol. Econ. 2017, 136, 77–85. [Google Scholar] [CrossRef]
  25. Schader, C.; Baumgart, L.; Landert, J.; Muller, A.; Ssebunya, B.; Blockeel, J.; Weisshaidinger, R.; Petrasek, R.; Mészáros, D.; Padel, S.; et al. Using the Sustainability Monitoring and Assessment Routine (SMART) for the Systematic Analysis of Trade-Offs and Synergies between Sustainability Dimensions and Themes at Farm Level. Sustainability 2016, 8, 274. [Google Scholar] [CrossRef] [Green Version]
  26. Food and Agriculture Organization (FAO). Sustainability Assessment of Food and Agriculture Systems (SAFA): Guidelines. Available online: https://www.fao.org/3/i3957e/i3957e.pdf (accessed on 20 July 2020).
  27. Häni, F.; Braga, F.; Stämpfli, A.; Keller, T.; Fischer, M.; Porsche, H. RISE, a Tool for Holistic Sustainability Assessment at the Farm Level. Int. Food Agribus. Manag. Rev. 2003, 6, 78–90. [Google Scholar] [CrossRef]
  28. de Olde, E.; Oudshoorn, F.; Bokkers, E.; Stubsgaard, A.; Sørensen, C.; de Boer, I. Assessing the Sustainability Performance of Organic Farms in Denmark. Sustainability 2016, 8, 957. [Google Scholar] [CrossRef] [Green Version]
  29. Cammarata, M.; Timpanaro, G.; Scuderi, A. Assessing Sustainability of Organic Livestock Farming in Sicily: A Case Study Using the FAO SAFA Framework. Agriculture 2021, 11, 274. [Google Scholar] [CrossRef]
  30. Gayatri, S.; Gasso-tortajada, V.; Vaarst, M. Assessing Sustainability of Smallholder Beef Cattle Farming in Indonesia: A Case Study Using the FAO SAFA Framework. J. Sustain. Dev. 2016, 9, 3. [Google Scholar] [CrossRef]
  31. de Olde, E.M.; Oudshoorn, F.W.; Sørensen, C.A.G.; Bokkers, E.A.M.; de Boer, I.J.M. Assessing sustainability at farm-level: Lessons learned from a comparison of tools in practice. Ecol. Indic. 2016, 66, 391–404. [Google Scholar] [CrossRef]
  32. Food and Agriculture Organisation (FAO). Sustainability Assessment of Food and Agriculture Systems (SAFA): Indicators. Available online: http://www.fao.org/fileadmin/templates/nr/sustainability_pathways/docs/SAFA_Indicators_final_19122013.pdf (accessed on 17 June 2021).
  33. EFSA. Scientific Opinion concerning a Multifactorial approach on the use of animal and non-animal-based measures to assess the welfare of pigs. EFSA J. 2014, 12, 3702. [Google Scholar] [CrossRef] [Green Version]
  34. Hörtenhuber, S.; Kasperczyk, N.; Ruckli, A.K. Deliverable 4.5: Report on SusPigSys Toolbox for Integrative System Analysis. 2021. Available online: https://scholar.google.co.jp/scholar?hl=zh-TW&as_sdt=0%2C5&q=Deliverable+4.5%3A+Report+on+SusPigSys+Toolbox+for+Integrative+System+Analysis&btnG= (accessed on 23 July 2021). [CrossRef]
  35. Munsterhjelm, C.; de Roest, K.; Dippel, S.; Guy, J.; Hörtenhuber, S.; Hubbard, C.; Kasperczyk, N.; Leeb, C.; Ruckli, A.; Valros, A.; et al. Sustainable Pig Production Systems Deliverable 2.1 Report on the Development of the Detailed and Condensed SusPigSys Protocols. Available online: https://www.researchgate.net/publication/348606780_Sustainable_Pig_Production_Systems_Deliverable_21_Report_on_the_development_of_the_detailed_and_condensed_SusPigSys_protocols (accessed on 23 July 2021).
  36. Warriss, P. The welfare of slaughter pigs during transport. Anim. Welf. 1998, 7, 365–381. [Google Scholar]
  37. EFSA. Welfare of pigs at slaughter. EFSA J. 2020, 18, e06148. [Google Scholar]
  38. Malak-Rawlikowska, A.; Gębska, M.; Hoste, R.; Leeb, C.; Montanari, C.; Wallace, M.; de Roest, K. Developing a Methodology for Aggregated Assessment of the Economic Sustainability of Pig Farms. Energies 2021, 14, 1760. [Google Scholar] [CrossRef]
  39. de Vries, M.; de Boer, I.J.M. Comparing environmental impacts for livestock products: A review of life cycle assessments. Livest. Sci. 2010, 128, 1–11. [Google Scholar] [CrossRef]
  40. Dourmad, J.Y.; Ryschawy, J.; Trousson, T.; Bonneau, M.; Gonzalez, J.; Houwers, H.W.J.; Hviid, M.; Zimmer, C.; Nguyen, T.L.T.; Morgensen, L. Evaluating environmental impacts of contrasting pig farming systems with life cycle assessment. Animal 2014, 8, 2027–2037. [Google Scholar] [CrossRef] [Green Version]
  41. Rudolph, G.; Hörtenhuber, S.; Bochicchio, D.; Butler, G.; Brandhofer, R.; Dippel, S.; Dourmad, J.; Edwards, S.; Früh, B.; Meier, M. Effect of Three Husbandry Systems on Environmental Impact of Organic Pigs. Sustainability 2018, 10, 3796. [Google Scholar] [CrossRef] [Green Version]
  42. Ruckli, A.K.; Dippel, S.; Durec, N.; Gebska, M.; Guy, J.; Helmerichs, J.; Leeb, C.; Vermeer, H.; Hörtenhuber, S. Environmental Sustainability Assessment of Pig Farms in Selected European Countries: Combining LCA and Key Performance Indicators for Biodiversity Assessment. Sustainability 2021, 13, 1230. [Google Scholar] [CrossRef]
  43. Leeb, C.; Butler, G.; Bochicchio, D.; Früh, B.; Illmann, G.; Prunier, A.; Rousing, T.; Urban, J.; Dippel, S. ProPIG—Farm Specific Strategies to Reduce Environmental Impact by Improving Health, Welfare and Nutrition of Organic Pigs—Final Project Report. Available online: https://orgprints.org/id/eprint/29937/ (accessed on 6 October 2021).
  44. Welfare Quality®. Assessment Protocol for Pigs (Sows and Piglets, Growing and Finishing Pigs); Welfare Quality® Consortium: Lelystad, The Netherlands, 2009. [Google Scholar]
  45. Mukherjee, N.; Hugé, J.; Sutherland, W.J.; McNeill, J.; Van Opstal, M.; Dahdouh-Guebas, F.; Koedam, N.; Anderson, B. The Delphi technique in ecology and biological conservation: Applications and guidelines. Methods Ecol. Evol. 2015, 6, 1097–1109. [Google Scholar] [CrossRef] [Green Version]
  46. Averos, X.; Aparicio, M.A.; Ferrari, P.; Guy, J.H.; Hubbard, C.; Schmid, O.; Ilieski, V.; Spoolder, H.A. The Effect of Steps to Promote Higher Levels of Farm Animal Welfare across the EU. Societal versus Animal Scientists’ Perceptions of Animal Welfare. Animals 2013, 3, 786–807. [Google Scholar] [CrossRef]
  47. SAS Institute Inc. SAS, 9.4; SAS Institute Inc.: Cary, NC, USA, 2016. [Google Scholar]
  48. Janeiro, L.; Patel, M.K. Choosing sustainable technologies. Implications of the underlying sustainability paradigm in the decision-making process. J. Clean. Prod. 2015, 105, 438–446. [Google Scholar] [CrossRef]
  49. Lebacq, T.; Baret, P.V.; Stilmant, D. Sustainability indicators for livestock farming. A review. Agron. Sustain. Dev. 2012, 33, 311–327. [Google Scholar] [CrossRef]
  50. Forschungsinstitut für Biologischen Landbau (FiBL). SMART in Detail—Features and Functions. Available online: https://www.fibl.org/en/themes/smart-en/smart-details-en (accessed on 13 October 2021).
  51. Heinonen, M.; Peltoniemi, O.; Valros, A. Impact of lameness and claw lesions in sows on welfare, health and production. Livest. Sci. 2013, 156, 2–9. [Google Scholar] [CrossRef]
  52. Pannell, D.J.; Glenn, N.A. A framework for the economic evaluation and selection of sustainability indicators in agriculture. Ecol. Econ. 2000, 33, 135–149. [Google Scholar] [CrossRef]
  53. Bockstaller, C.; Lasserre-Joulin, F.; Slezack-Deschaumes, S.; Piutti, S.; Villerd, J.; Amiaud, B.; Plantureux, S. Assessing biodiversity in arable farmland by means of indicators: An overview. Oléagineux Corps Gras Lipides 2011, 18, 137–144. [Google Scholar] [CrossRef] [Green Version]
  54. Chaudhary, A.; Brooks, T.M. Land Use Intensity-Specific Global Characterization Factors to Assess Product Biodiversity Footprints. Environ. Sci. Technol. 2018, 52, 5094–5104. [Google Scholar] [CrossRef]
  55. Knudsen, M.T.; Hermansen, J.E.; Cederberg, C.; Herzog, F.; Vale, J.; Jeanneret, P.; Sarthou, J.P.; Friedel, J.K.; Balazs, K.; Fjellstad, W.; et al. Characterization factors for land use impacts on biodiversity in life cycle assessment based on direct measures of plant species richness in European farmland in the ‘Temperate Broadleaf and Mixed Forest’ biome. Sci. Total Environ. 2017, 580, 358–366. [Google Scholar] [CrossRef]
  56. McAuliffe, G.A.; Takahashi, T.; Mogensen, L.; Hermansen, J.E.; Sage, C.L.; Chapman, D.V.; Lee, M.R.F. Environmental trade-offs of pig production systems under varied operational efficiencies. J. Clean. Prod. 2017, 165, 1163–1173. [Google Scholar] [CrossRef]
  57. Muns, R.; Nuntapaitoon, M.; Tummaruk, P. Non-infectious causes of pre-weaning mortality in piglets. Livest. Sci. 2016, 184, 46–57. [Google Scholar] [CrossRef]
  58. Hermann, B.G.; Kroeze, C.; Jawjit, W. Assessing environmental performance by combining life cycle assessment, multi-criteria analysis and environmental performance indicators. J. Clean. Prod. 2007, 15, 1787–1796. [Google Scholar] [CrossRef] [Green Version]
  59. Chatzimouratidis, A.I.; Pilavachi, P.A. Sensitivity analysis of technological, economic and sustainability evaluation of power plants using the analytic hierarchy process. Energy Policy 2009, 37, 788–798. [Google Scholar] [CrossRef]
  60. Tuyttens, F.A.M. The importance of straw for pig and cattle welfare: A review. Appl. Anim. Behav. Sci. 2005, 92, 261–282. [Google Scholar] [CrossRef]
  61. Eurostat—Statistics Explained. Farmers and the Agricultural Labour Force—Statistics. Available online: https://ec.europa.eu/eurostat/statistics-explained/index.php?title=Farmers_and_the_agricultural_labour_force_-_statistics#Farming_remains_a_predominantly_family_activity (accessed on 20 October 2021).
  62. European Commission. How Many People Work in Agriculture in the European Union? Available online: https://ec.europa.eu/info/sites/default/files/food-farming-fisheries/farming/documents/agri-economics-brief-08_en.pdf (accessed on 20 October 2021).
  63. Hill, B. The ‘myth’ of the family farm: Defining the family farm and assessing its importance in the European Community. J. Rural Stud. 1993, 9, 359–370. [Google Scholar] [CrossRef]
  64. Holland, J.M. The environmental consequences of adopting conservation tillage in Europe: Reviewing the evidence. Agric. Ecosyst. Environ. 2004, 103, 1–25. [Google Scholar] [CrossRef]
  65. Philippe, F.X.; Nicks, B. Review on greenhouse gas emissions from pig houses: Production of carbon dioxide, methane and nitrous oxide by animals and manure. Agric. Ecosyst. Environ. 2015, 199, 10–25. [Google Scholar] [CrossRef] [Green Version]
  66. Philippe, F.-X.; Cabaraux, J.-F.; Nicks, B. Ammonia emissions from pig houses: Influencing factors and mitigation techniques. Agric. Ecosyst. Environ. 2011, 141, 245–260. [Google Scholar] [CrossRef]
  67. Pe’er, G.; Zinngrebe, Y.; Hauck, J.; Schindler, S.; Dittrich, A.; Zingg, S.; Tscharntke, T.; Oppermann, R.; Sutcliffe, L.M.E.; Sirami, C.; et al. Adding Some Green to the Greening: Improving the EU’s Ecological Focus Areas for Biodiversity and Farmers. Conserv. Lett. 2017, 10, 517–530. [Google Scholar] [CrossRef]
  68. Bengtsson, J.; Nilsson, S.G.; Franc, A.; Menozzi, P. Biodiversity, disturbances, ecosystem function and management of European forests. For. Ecol. Manag. 2000, 132, 39–50. [Google Scholar] [CrossRef]
  69. King, M.F.; Bruner, G.C. Social desirability bias: A neglected aspect of validity testing. Psychol. Mark. 2000, 17, 79–103. [Google Scholar] [CrossRef]
  70. Lusk, J.L.; Norwood, F.B. Direct Versus Indirect Questioning: An Application to the Well-Being of Farm Animals. Soc. Indic. Res. 2009, 96, 551–565. [Google Scholar] [CrossRef]
  71. Høøk Presto, M.; Algers, B.; Persson, E.; Andersson, H.K. Different roughages to organic growing/finishing pigs—Influence on activity behaviour and social interactions. Livest. Sci. 2009, 123, 55–62. [Google Scholar] [CrossRef]
  72. Averós, X.; Brossard, L.; Dourmad, J.Y.; de Greef, K.H.; Edge, H.L.; Edwards, S.A.; Meunier-Salaun, M.C. Quantitative assessment of the effects of space allowance, group size and floor characteristics on the lying behaviour of growing-finishing pigs. Animal 2010, 4, 777–783. [Google Scholar] [CrossRef] [PubMed] [Green Version]
  73. Hemsworth, P.H.; Rice, M.; Nash, J.; Giri, K.; Butler, K.L.; Tilbrook, A.J.; Morrison, R. Effects of group size and floor space allowance on grouped sows: Aggression, stress, skin injuries, and reproductive performance. J. Anim. Sci. 2013, 91, 4953–4964. [Google Scholar] [CrossRef]
  74. De Briyne, N.; Berg, C.; Blaha, T.; Palzer, A.; Temple, D. ‘Phasing out pig tail docking in the EU—Present state, challenges and possibilities’. Porc. Health Manag. 2018, 4, 27. [Google Scholar] [CrossRef] [PubMed] [Green Version]
  75. Baxter, E.M.; Lawrence, A.B.; Edwards, S.A. Alternative farrowing accommodation: Welfare and economic aspects of existing farrowing and lactation systems for pigs. Animal 2012, 6, 96–117. [Google Scholar] [CrossRef] [Green Version]
  76. Boivin, X.; Lensink, J.; Tallet, C.; Veissier, I. Stockmanship and farm animal welfare. Anim. Welf.-Potters Bar Wheathampstead- 2003, 12, 479–492. [Google Scholar]
  77. European Environment Agency. European Waters Assessment of Status and Pressures. 2018. Available online: https://www.eea.europa.eu/publications/state-of-water/ (accessed on 21 October 2021).
  78. Cardinale, B.J.; Duffy, J.E.; Gonzalez, A.; Hooper, D.U.; Perrings, C.; Venail, P.; Narwani, A.; Mace, G.M.; Tilman, D.; Wardle, D.A.; et al. Biodiversity loss and its impact on humanity. Nature 2012, 486, 59–67. [Google Scholar] [CrossRef] [PubMed]
  79. Hurst, P.; Termine, P.; Karl, M. Agricultural workers and their contribution to sustainable agriculture and rural development. Available online: https://www.fao.org/3/af164e/af164e00.htm (accessed on 18 January 2022).
  80. Martel, G.; Dourmad, J.Y.; Dedieu, B. Do labour productivity and preferences about work load distribution affect reproduction management and performance in pig farms. Livest. Sci. 2008, 116, 96–107. [Google Scholar] [CrossRef]
  81. The World Bank. Employment in Agriculture (% of Total Employment) (Modeled ILO Estimate). Available online: https://data.worldbank.org/indicator/SL.AGR.EMPL.ZS?contextual=employment-by-sector&end=2019&start=1991&view=chart (accessed on 19 October 2021).
  82. EFSA. Scientific Opinion of the Panel on Animal Health and Welfare on a request from the Commission on Animal health and welfare in fattening pigs in relation to housing and husbandry. EFSA J. 2007, 564, 1–14. [Google Scholar]
  83. EFSA. Scientific Opinion of the Panel on Animal Health and Welfare on a request from the Commission on Animal health and welfare aspects of different housing and husbandry systems for adult breeding boars, pregnant, farrowing sows and unweaned piglets. EFSA J. 2007, 572, 1–13. [Google Scholar]
  84. Bock, B.B.; van Huik, M.M.; Prutzer, M.; Eveillard, F.K.; Dockes, A. Famers’ relationship with different animals: The importance of getting close to the animals. Case studies of French, Swedish and Dutch cattle, pig and poultry farmers. Int. J. Sociol. Agric. Food 2007, 15, 108–125. [Google Scholar]
  85. Fraser, D. Understanding animal welfare. Acta Vet Scand 2008, 50 (Suppl. S1), S1–S12. [Google Scholar] [CrossRef] [PubMed] [Green Version]
  86. Cerri, J.; Thøgersen, J.; Testa, F. Social desirability and sustainable food research: A systematic literature review. Food Qual. Prefer. 2019, 71, 136–140. [Google Scholar] [CrossRef]
  87. Leach, K.A.; Whay, H.R.; Maggs, C.M.; Barker, Z.E.; Paul, E.S.; Bell, A.K.; Main, D.C. Working towards a reduction in cattle lameness: 1. Understanding barriers to lameness control on dairy farms. Res. Vet. Sci. 2010, 89, 311–317. [Google Scholar] [CrossRef]
  88. Zander, K.; Hamm, U. Consumer preferences for additional ethical attributes of organic food. Food Qual. Prefer. 2010, 21, 495–503. [Google Scholar] [CrossRef]
  89. Schader, C.; Grenz, J.; Meier, M.S.; Stolze, M. Scope and precision of sustainability assessment approaches to food systems. Ecol. Soc. 2014, 19, 3. [Google Scholar] [CrossRef]
  90. Maurer, L.; Schenkenfelder, J.; Winckler, C. Resource, Collaborator, or Individual Cow? Applying Q Methodology to Investigate Austrian Farmers’ Viewpoints on Motivational Aspects of Improving Animal Welfare. Front. Vet. Sci. 2020, 7, 607925. [Google Scholar] [CrossRef]
  91. Curran, M.; Lazzarini, G.; Baumgart, L.; Gabel, V.; Blockeel, J.; Epple, R.; Stolze, M.; Schader, C. Representative Farm-Based Sustainability Assessment of the Organic Sector in Switzerland Using the SMART-Farm Tool. Front. Sustain. Food Syst. 2020, 4, 208. [Google Scholar] [CrossRef]
Figure 1. Framework of the multi-criteria analysis tool, illustrating the integration process for using two of the 19 themes in the project as an example. Ind = Indicator, Subth = Subtheme.
Sustainability 14 05988 g001
Figure 2. Median sustainability scores (0 = worst, 100 = best) at theme level by farm type. Economy themes: ECO1 (Technical efficiency), ECO2 (Economic resilience). Environment themes: ENV1 (Atmosphere), ENV2 (Water), ENV3 (Soil), ENV4 (Biodiversity), ENV5 (Material and energy). Social wellbeing themes: SOC1 (Decent livelihoods), SOC2 (Fair trading practices), SOC3 (Labour rights), SOC4 (Gender and equality), SOC5 (Human health and safety), SOC6 (Good governance). Animal health and welfare themes: AHW1 (Absence of hunger and thirst), AHW2 (Pig comfort), AHW3 (Absence of injuries and disease), AHW4 (Absence of pain by management) AHW5 (Possibility to perform appropriate behaviour), AHW6 (Good human–animal relationship).
Sustainability 14 05988 g002
Table 1. Summary of the indicator selection and themes within each sustainability dimension (ECO, ENV, SOC, AHW).
DimensionsECOENVSOCAHW
Indicators based onLiterature
Existing protocols
Discussions within the consortium
Stakeholder workshops
External experts
Pilot farm visit
n indicators included in the protocol 16424276
Indicator typescontinuouscategorical
ordinal
continuous
categorical
ordinal
categorical
ordinal
continuous
Themes
-
Technical efficiency
-
Economic resilience
-
Atmosphere
-
Water
-
Soil
-
Biodiversity
-
Material and Energy
-
Decent Livelihood
-
Fair trading practices
-
Labour rights
-
Gender and equality
-
Human safety and health
-
Good governance
-
Absence of hunger and thirst
-
Pig comfort
-
Absence of injuries and disease
-
Absence of pain by management
-
Possibility to perform appropriate behaviour
-
Good human–animal relationship
Table 2. Size and productivity data of 63 pig farms in Austria (10 farms), Finland (8), Germany (9), Italy (10), the Netherlands (9), the United Kingdom (7), and Poland (10).
Breeding FarmsBreeding-to-Finishing FarmsFinishing Farms
Q25MQ75Q25MQ75Q25MQ75
Farms (n)132723
Size
Sows in production (n)29141994658150287
Finishers sold for slaughter year−1 (n) 106128675284150040356411
Number of sows per AWU31931733180263
Number of finishers per AWU 647103602798529504
Family labour (%)0381000501000100100
Rented land (%)04010004290022100
Productivity
Litters sow−1 y−1 (n)2.22.42.42.12.32.3
Piglets weaned sow−1 y−1 (n)252830212529
Lactation length (d)242828272833
Mortality suckling piglets (%)11.215.116.89.613.416.7
Mortality weaners (%)1.83.03.81.72.94.8
Mortality finishers (%) 1.22.03.01.51.82.3
Live weight at slaughter (kg) 111118122118127168
Daily gain finishers (g day−1) 7008108557808461000
Feed
FCR BU (kg feed kg−1 BM−1)2.83.03.73.03.64.6
FCR FU (kg feed kg−1 BM−1) 2.72.93.72.83.03.8
Home-grown feed BU (% of FW)001102133
Home-grown feed FU (% of FW) 016430020
n = number; M = median, Q25 = lower quartile; Q75 = upper quartile. FCR = feed conversion ratio, BU = breeding unit, FU = finishing unit, BM = body mass, FW = fresh weight, AWU = annual working unit, i.e., per farm worker.
Publisher’s Note: MDPI stays neutral with regard to jurisdictional claims in published maps and institutional affiliations.

