Article

Environmental and Energy-Efficiency Considerations for Selecting Building Envelopes

Institute of Civil Engineering, Peter the Great St. Petersburg Polytechnic University, Polytechnicheskaya, 29, 195251 Saint Petersburg, Russia
*
Author to whom correspondence should be addressed.
Sustainability 2022, 14(10), 5914; https://doi.org/10.3390/su14105914
Submission received: 15 April 2022 / Revised: 3 May 2022 / Accepted: 9 May 2022 / Published: 13 May 2022
(This article belongs to the Section Sustainable Materials)

Abstract

:
Life cycle assessments in the construction industry reveal that 70–80% of all CO2 emissions occur precisely at the stage of material production (stages A1–A3 of the life cycle). Therefore, not only does the strength and thermal properties of the material selected for construction have major importance, but also the environmental impact of the material and the amount of energy spent to extract, manufacture and transport the materials. The paper presents the thermal calculations for envelope structures, assessing their environmental impact with respect to three parameters: carbon dioxide emissions, total energy consumption and amount of waste generated during material production. The research method used was an analysis of documents from real manufacturers and calculations of the main environmental parameters. Our investigation has led us to conclude that the largest amount of carbon dioxide emissions is produced by structures containing reinforced concrete, since the weight fraction of concrete is significantly greater than that of all other compared materials. The largest amount of non-renewable energy is consumed by structures containing clay bricks and reinforced concrete, since they consist of natural sources. The largest amount of waste is generated by structures containing expanded polystyrene and reinforced concrete consisting of cement, whose production in turn generates a large amount of waste.

1. Introduction

According to the UN report, CO2 emissions from the construction industry have recently reached record levels. Overall, the construction industry accounts for about 40% of all CO2 emissions [1]. In addition, 30% of all waste is produced throughout the construction cycle. The residential sector and the construction industry are responsible for almost 40% of all energy consumption. Therefore, tremendous efforts are underway globally to adopt energy-efficiency practices [2,3,4,5] and incorporate environmentally friendly measures in construction.
The Paris Agreement on Climate Change came into force in 2016. Its main goals are to reduce CO2 emissions and make a transition to carbon-free cities. Designing buildings with zero or close-to-zero energy consumption is seen as one of the key steps towards smart carbon-free cities [6].
Russia is among the four countries with the highest greenhouse gas emissions, after China, the USA and India (Figure 1).
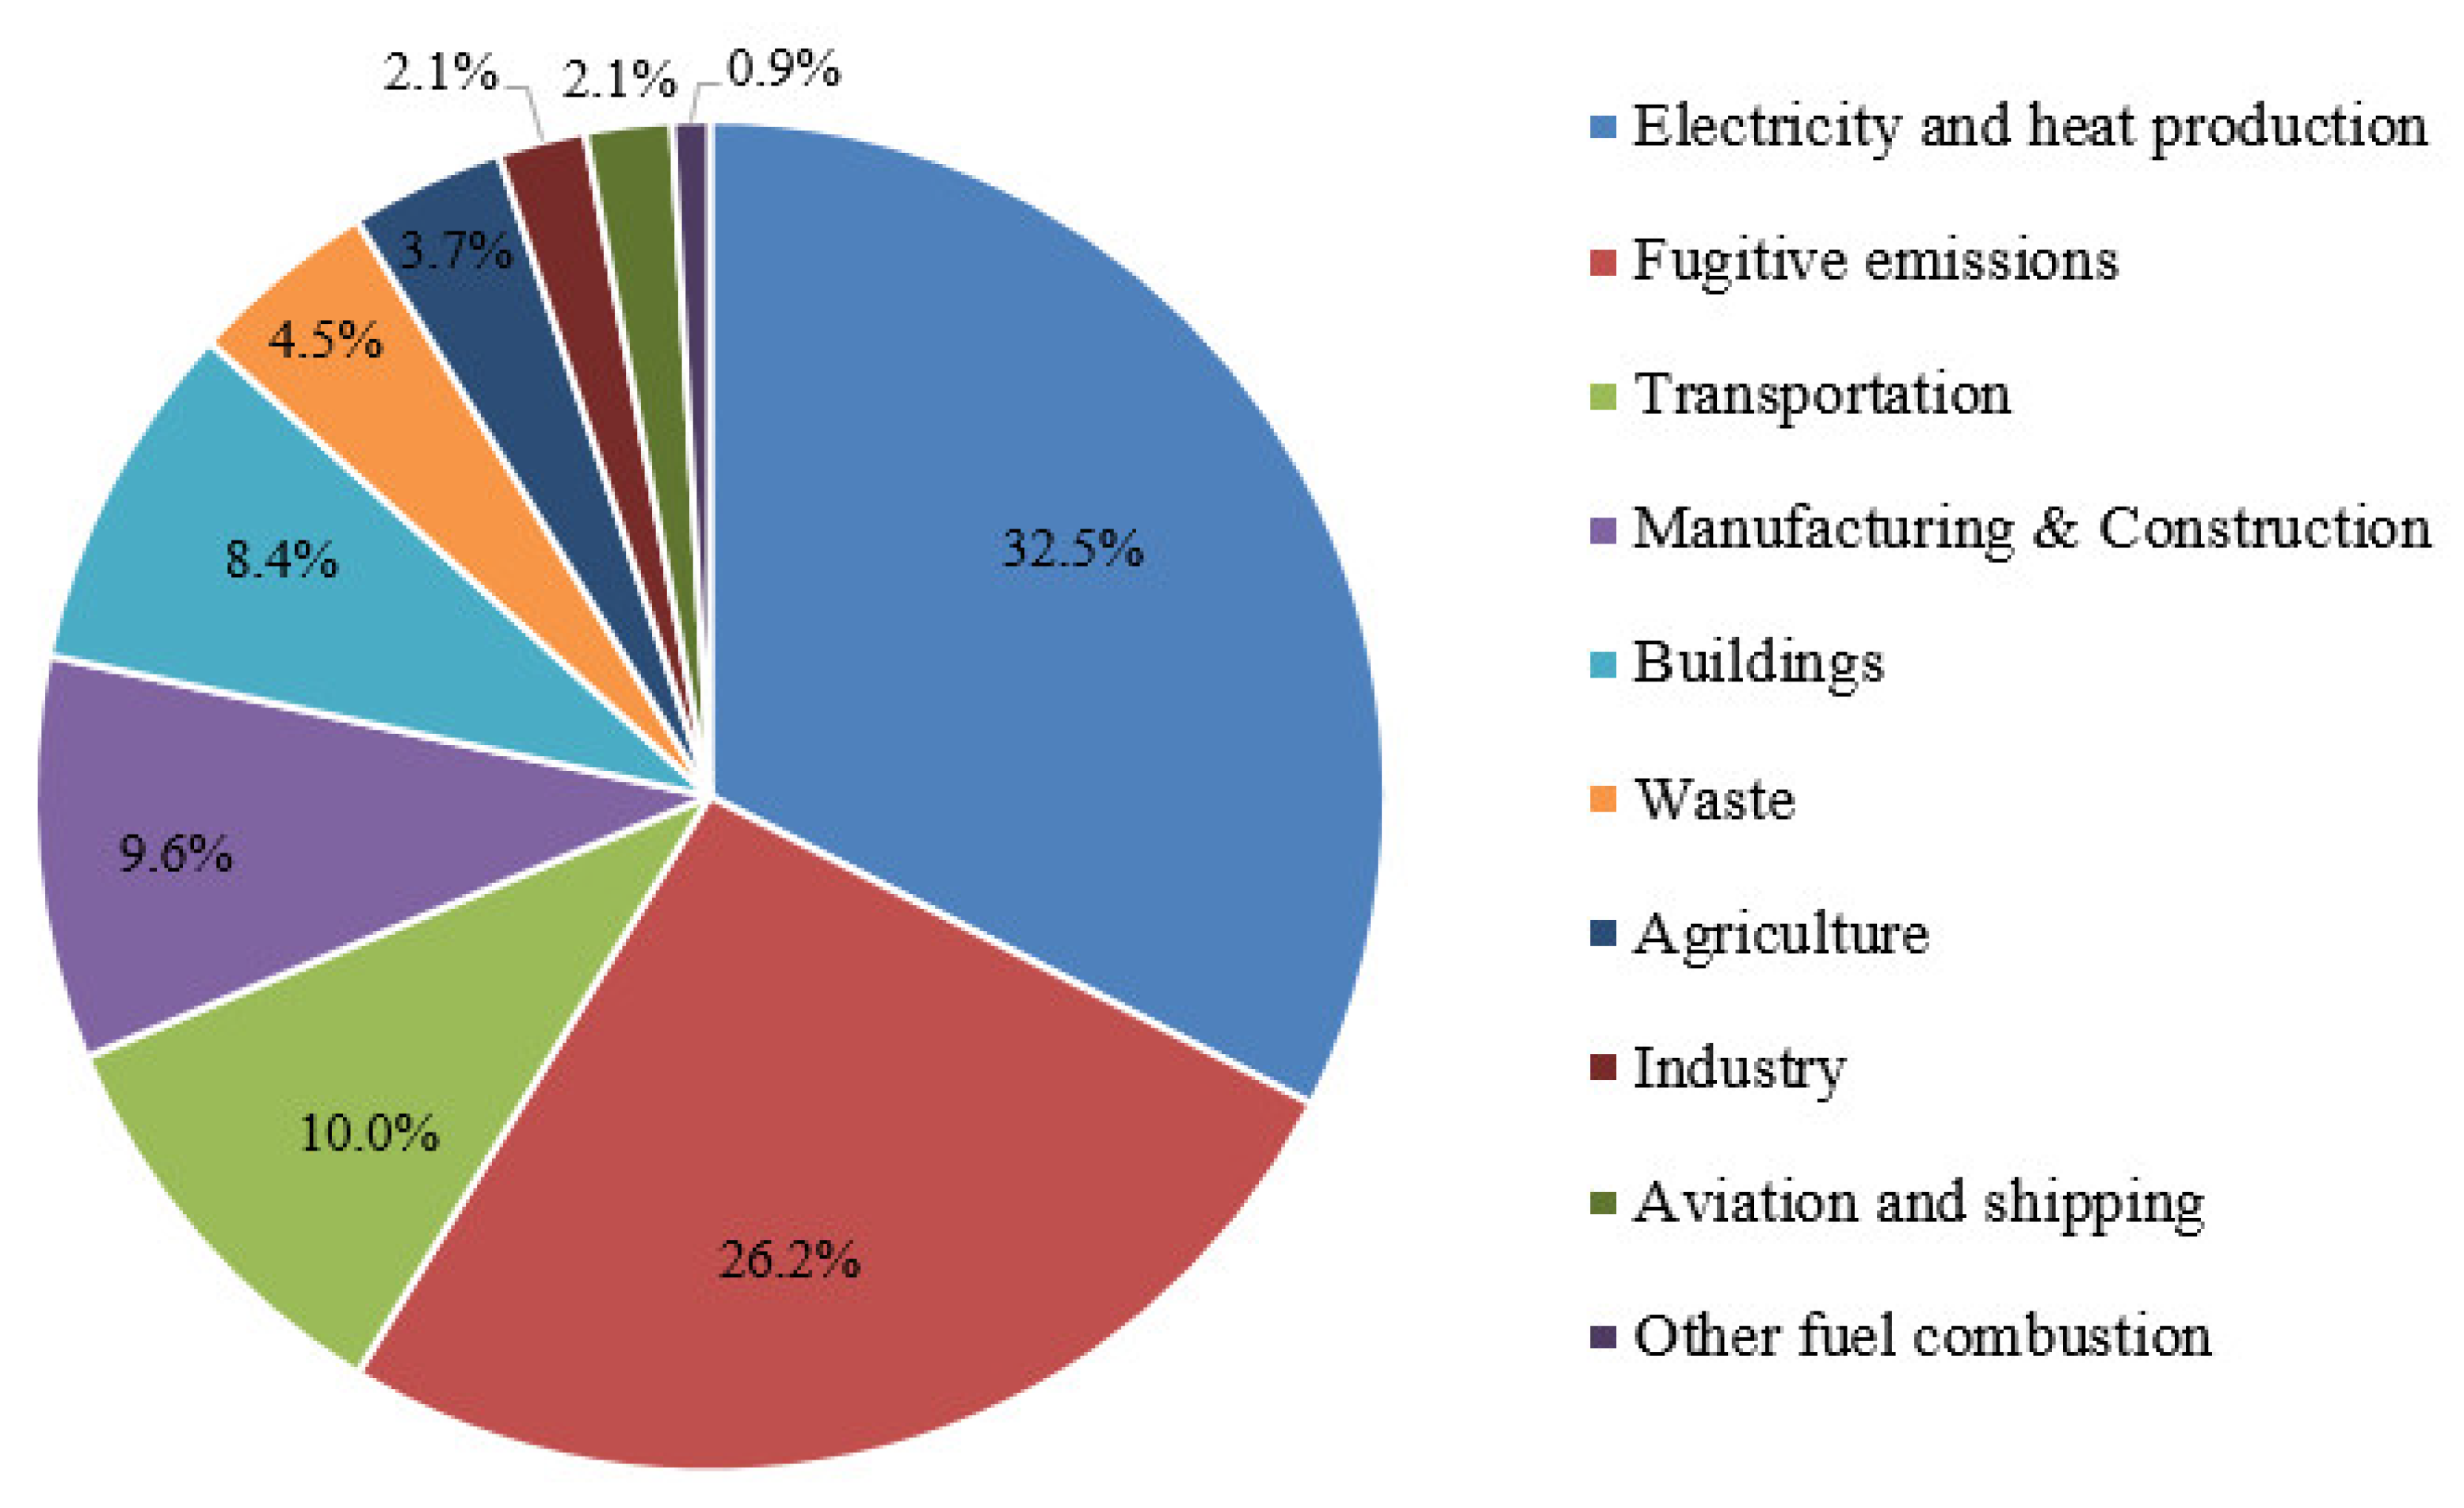
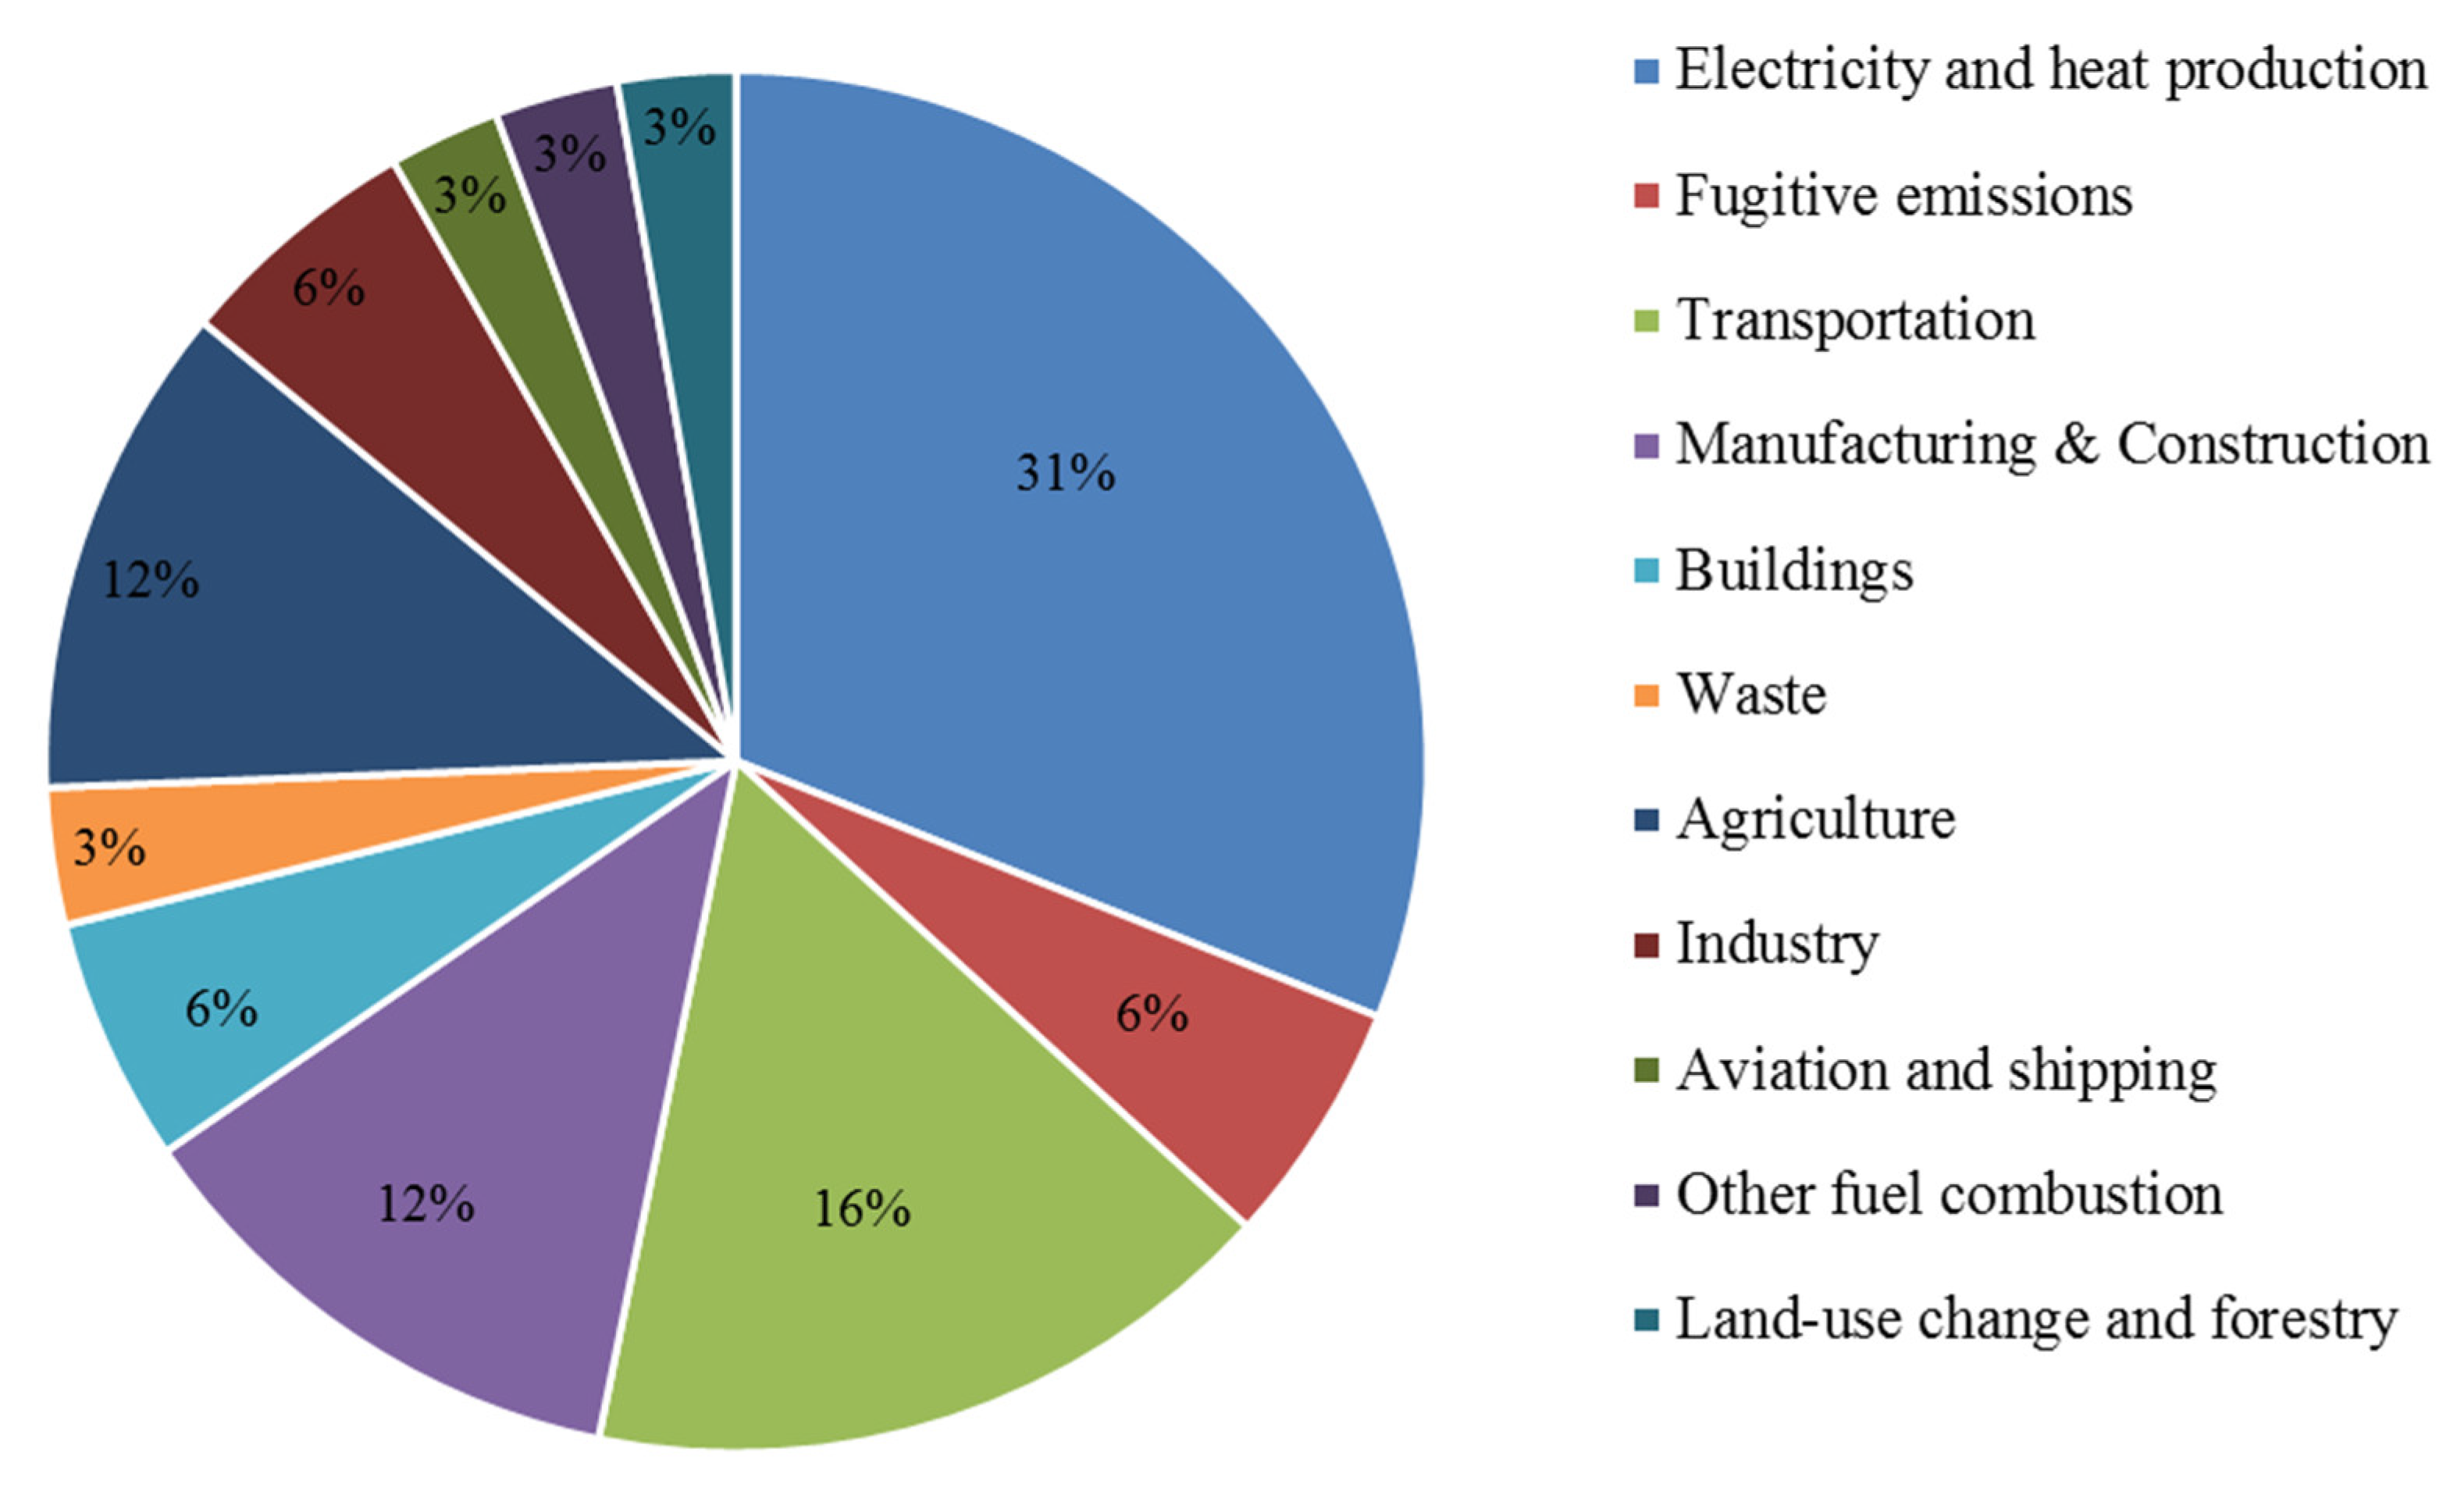
Carbon dioxide emissions in Moscow amount to about 39.2 million tons per year. The question is then whether it is possible to transform Moscow into a carbon-free or substantially low-carbon city in these conditions. The studies conducted indicate that this can be achieved if the buildings in the city either have zero/close-to-zero energy consumption or are so-called passive buildings [7]. Figure 2 shows the main sources of carbon dioxide emissions in Russia for each industry.
Global CO2 emissions by sector are shown in Figure 3. Evidently, the largest share of emissions is taken by electricity and heat production, as well as by emissions from Russia. Additionally, analyzing these two diagrams, we can see that the ‘Manufacturing & Construction’ and ‘Buildings’ sectors are responsible for 18% of all CO2 emissions.
The scientific methodology used for calculating the environmental impact of buildings is life cycle assessment (LCA). Numerous studies have confirmed that the production of building materials is the main source of greenhouse gas emissions worldwide.
According to global reports [9,10], responsible production of building materials is considered to be one of the cost-effective measures to improve energy-efficiency and decarbonization of the construction industry. According to the ISO 14040/14044 LCA Standard (Environmental management—Life cycle assessment—Requirements and guidelines), the life cycle assessment of a product consists of five stages:
  • Product stage (A1–A3);
  • Construction process stage (А4–А5);
  • Use stage (B1–B7);
  • End-of-life stage (C1–C4);
  • Resource recovery stage (D).
Many manufacturers of materials consider only the first stage of production as follows:
  • Raw materials supply (A1), covering the extraction and processing of all raw materials and energy, which occurs before the start of the production process;
  • Transportation (A2), when the raw materials are transported to the production site. This depends on the distance from the site where raw materials are extracted to the production site, as well as the type of transport (road, freight, rail);
  • Manufacturing (A3), typically including the manufacturing of both products and packaging, as well as transportation of the generated waste.
To assess the potential environmental impact of the material, manufacturers provide the following information:
  • Environmental impacts (global warming potential (GWP), ozone depletion potential (ODP)), abiotic depletion potentials (ADPe), and others;
  • Resource use (renewable, non-renewable, secondary materials and type of fuels, clean fresh water, and others);
  • Waste production (disposal of hazardous, non-hazardous and radioactive waste);
  • Output flows (components for reuse, materials for recycling, exported energy).
Importantly, the material’s strength and thermophysical properties, its environmental impact, and embodied energy should all be evaluated for the material to be selected for construction.
The first stage of the life cycle (A1–A3) has the greatest impact on the environment. Therefore, deciding on the type and amount of building materials is crucial in the construction industry. Selecting the material and manufacturer is very important, as it affects the ecological footprint during construction.
However, it should be considered that selecting materials with low embodied energy can increase the operational energy consumption. Conversely, materials with higher embodied energy tend to consume less operational energy.
The environmental impact of building materials can be found in the environmental declaration of the product [11,12]. Construction EPD (Environmental Product Declaration) is based on ISO 14040/14044, ISO 14025, EN 15804 or ISO 21930 standards. The EPD is obtained through the following steps:
  • Data collection;
  • Life cycle assessment;
  • Information report;
  • Third-party verification;
  • Publication.
This document is valid for 5 years and includes:
  • Company information;
  • Product information;
  • Cradle-to-cradle or cradle-to-grave LCA;
  • Environmental impacts;
  • Interpretation of LCA results;
  • References.
The EPD for building materials is perfectly integrated with the latest Sustainability Rating schemes for the construction industry (LEED, BREEAM, DGNB, GREEN ZOOM), focused on assessing different aspects of environmental sustainability of buildings based on several quantitative and qualitative criteria.
Tackling the challenge to reduce the carbon footprint from building materials, scientists around the world strive to develop new, more environmentally friendly and safe production processes, and even small improvements can have far-reaching consequences.
Eco-friendly mineral fiber insulation materials are the most common in construction (as insulation layers). They are based on recycled rocks that have been transformed into fine fibers. Thermal conductivity of insulation significantly affects the thermal properties of the structure [13,14,15].
Clay bricks are environmentally friendly in composition. The main disadvantage lies in the CO2 emissions from firing bricks in the furnace. Various additives can be used as eco-bricks.
Concrete is the most widespread building material, requiring huge amounts of energy and resources for production. The main reason why concrete is hazardous is that its composition contains a large amount of cement. Over 50% of the materials used in the building industry are linked to cement [16]. A recent study has established that more than 6 billion tons of concrete are produced worldwide every year, releasing a huge amount of carbon dioxide and other greenhouse gases into the environment, which leads to global warming [17]. Cement production accounts for 8–10% of the global CO2 emissions. Carbon dioxide is produced when limestones and clays are crushed and heated to high temperatures [18]. Various additives are used to reduce the percentage of cement in concrete, which affects multiple factors (mechanical, thermal and environmental). Recently, as adverse environmental effects have accumulated, increasingly stringent requirements have been imposed on conducting environmental impact assessments (EIA) and issuing construction permits [19].
We can conclude from reviewing the literature that a crucial problem is constructing a multilayer envelope wall which meets the environmental and energy-efficiency requirements.
The goal of the study is to select an envelope structure with optimal heat transfer resistance with minimal harmful effects on the environment.
This goal was reached through the following steps:
  • Select several envelope structures made of materials most commonly used in construction;
  • Calculate thermal resistance and dew point in all structures;
  • Calculate the CO2 emissions, the energy spent to produce the material and the amount of waste generated at the production stage (A1–A3).
Thus, an analytical method is proposed for selecting the envelope structure, considering the negative environmental impact of the structure.

2. Materials and Methods

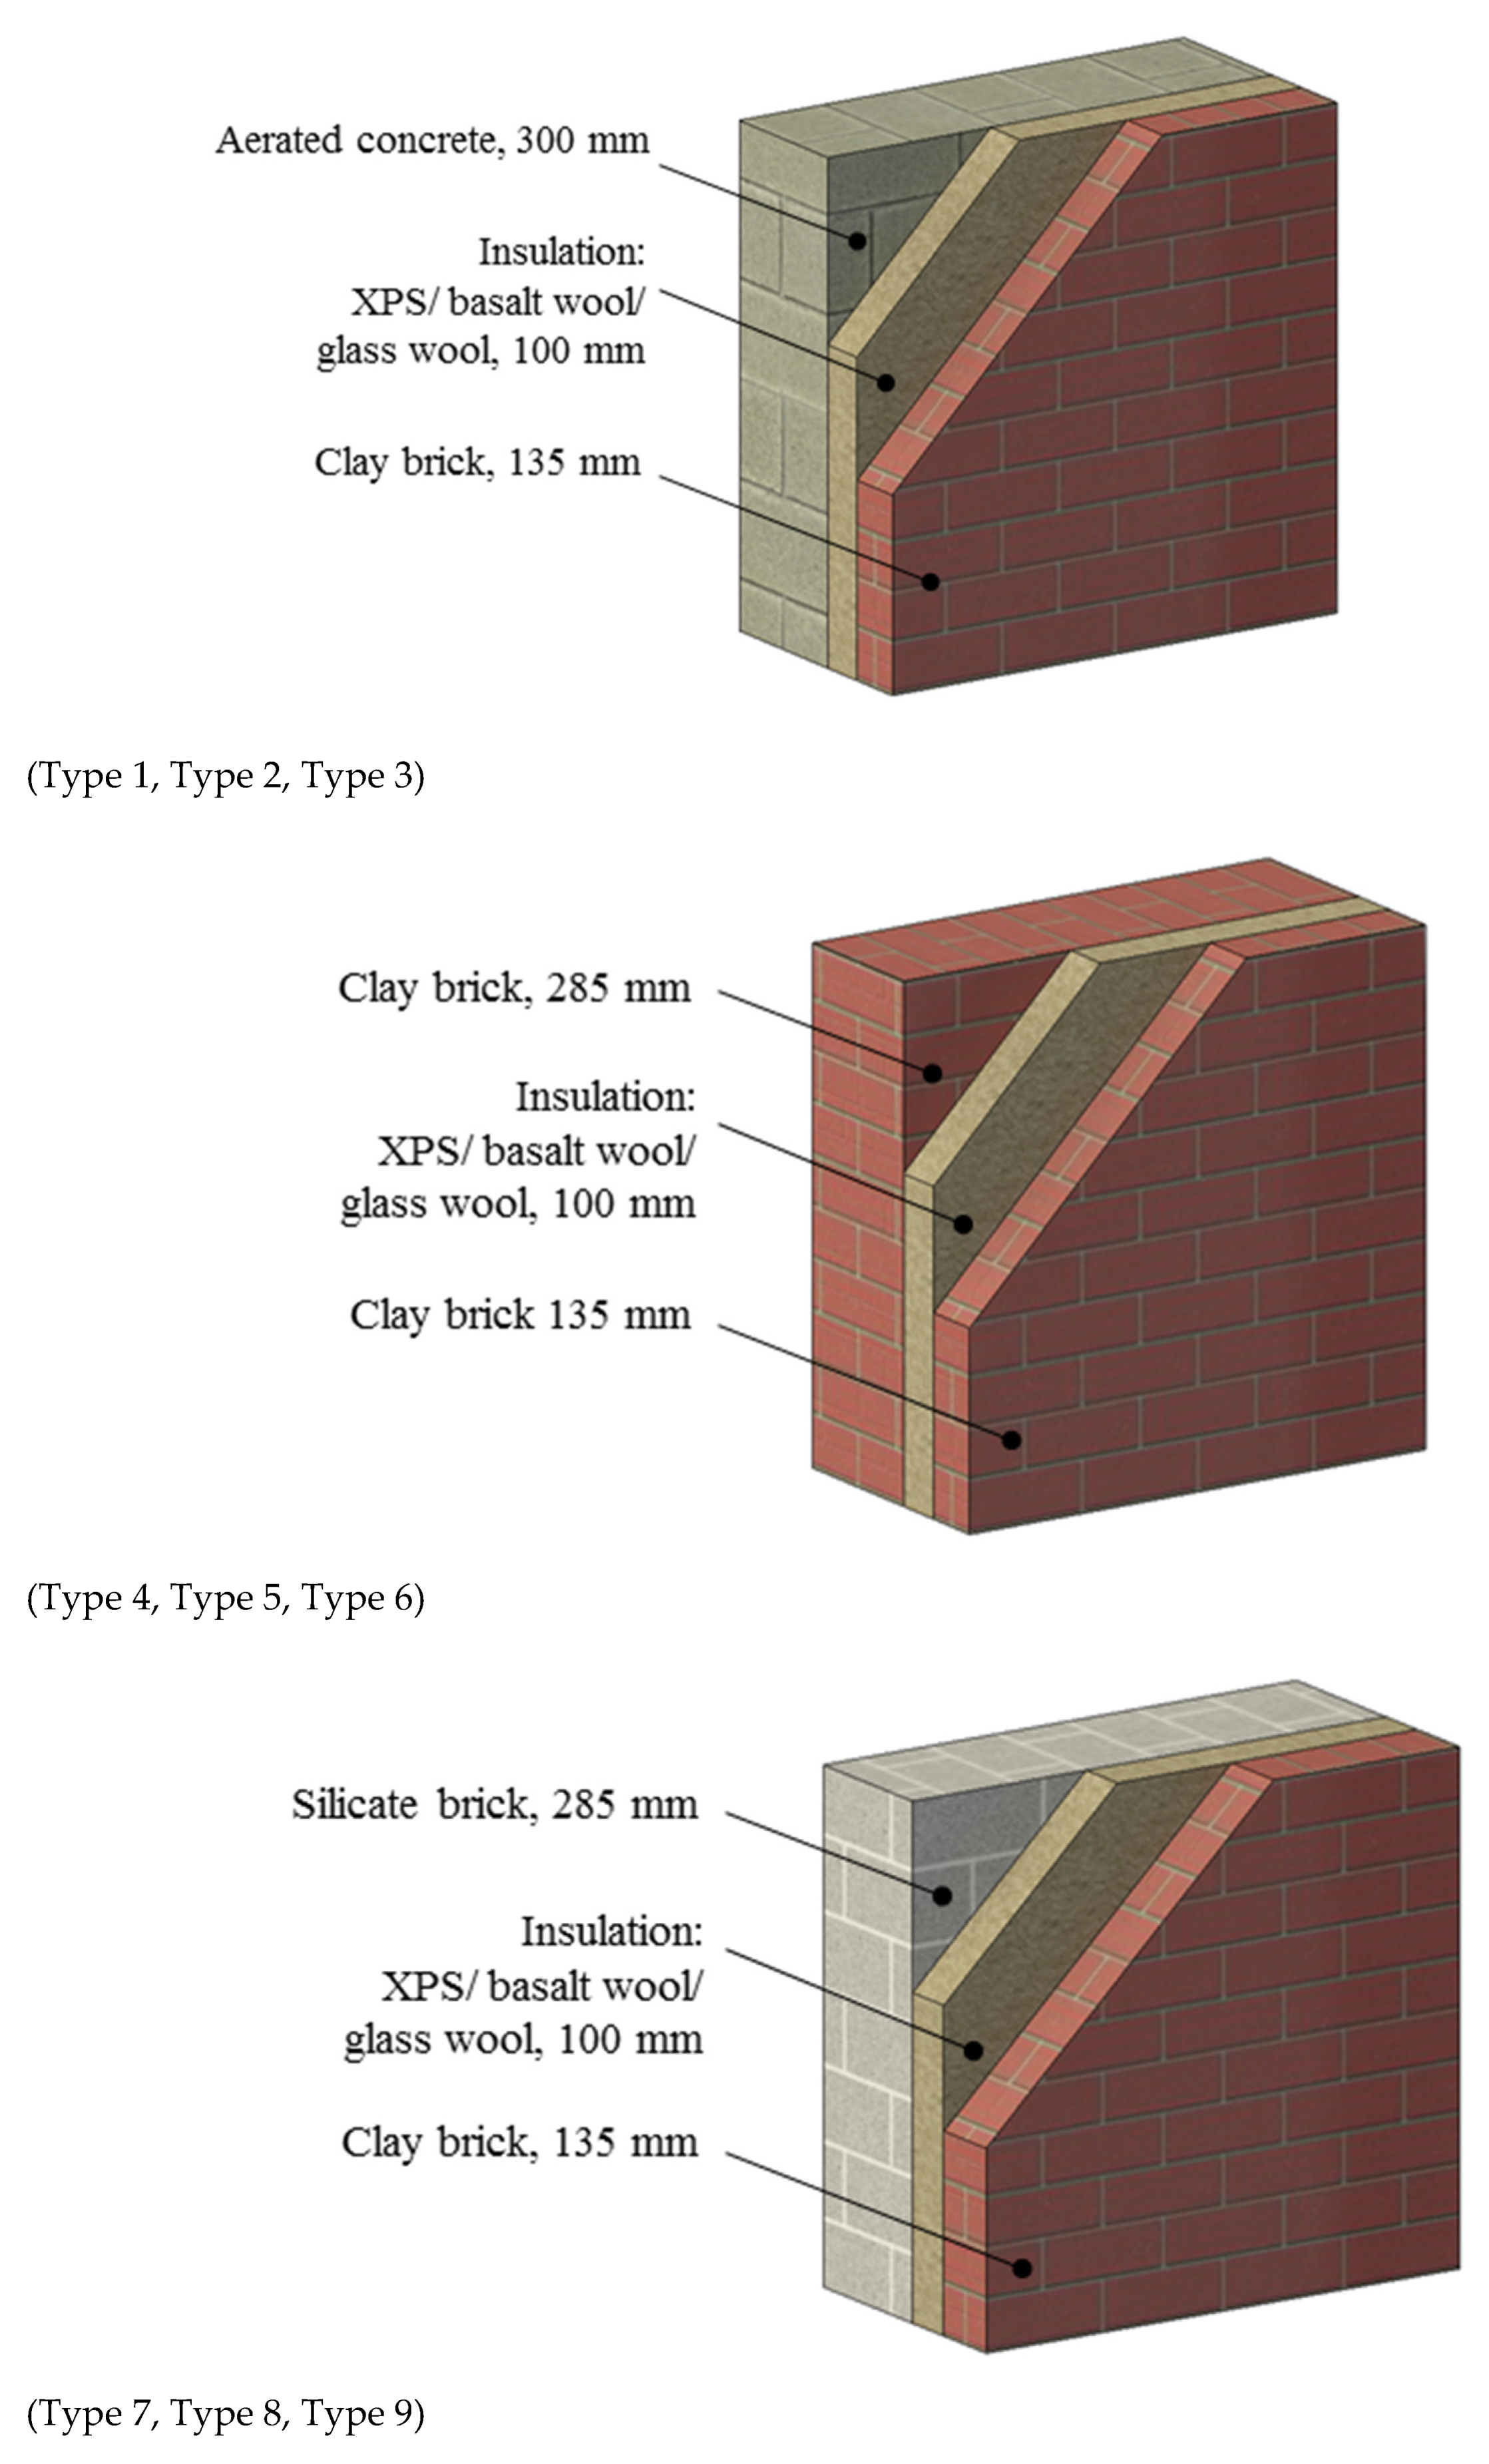
The article discusses several multilayer envelope structures. Each structure has a load-bearing layer, insulation and cladding layer. The tables below provide the building materials to be used for combining layers and identifying the optimal design. Table 1 shows the materials and their composition, Table 2 shows the thermophysical characteristics of the materials: density, coefficient of thermal conductivity and heat capacity.
Structures are compared in various combinations, containing different types of insulation and bearing layers. Figure 4 and Table 3 show models of multilayer envelope structures.
The research method consists of analyzing the documents from real manufacturers and calculating the main environmental parameters: carbon dioxide emissions, non-renewable energy consumption and waste generated during the production of the material.
One of the important characteristics for selecting the envelope structure is the heat transfer resistance. Heat transfer resistance is a quantity that characterizes the level of thermal insulation properties of envelope structures. The higher its value, the lower the costs of operational energy consumption. The heat transfer resistance is determined by the formula:
R = 1 α i n t + δ ( x ) λ + 1 α e x t ,
where αint and αext, W/(m2⋅°C), are the heat transfer coefficients of the inner and outer surfaces of the wall, δ, m, is the thickness of the layer, λ, W/(m⋅°C), is the thermal conductivity coefficient of the material and δ ( x ) λ , m2·°C/W, is the thermal resistance of a single layer of the envelope structure.
The wall should meet the requirements for thermal protection of the buildings specified in regulatory documents [20,21].
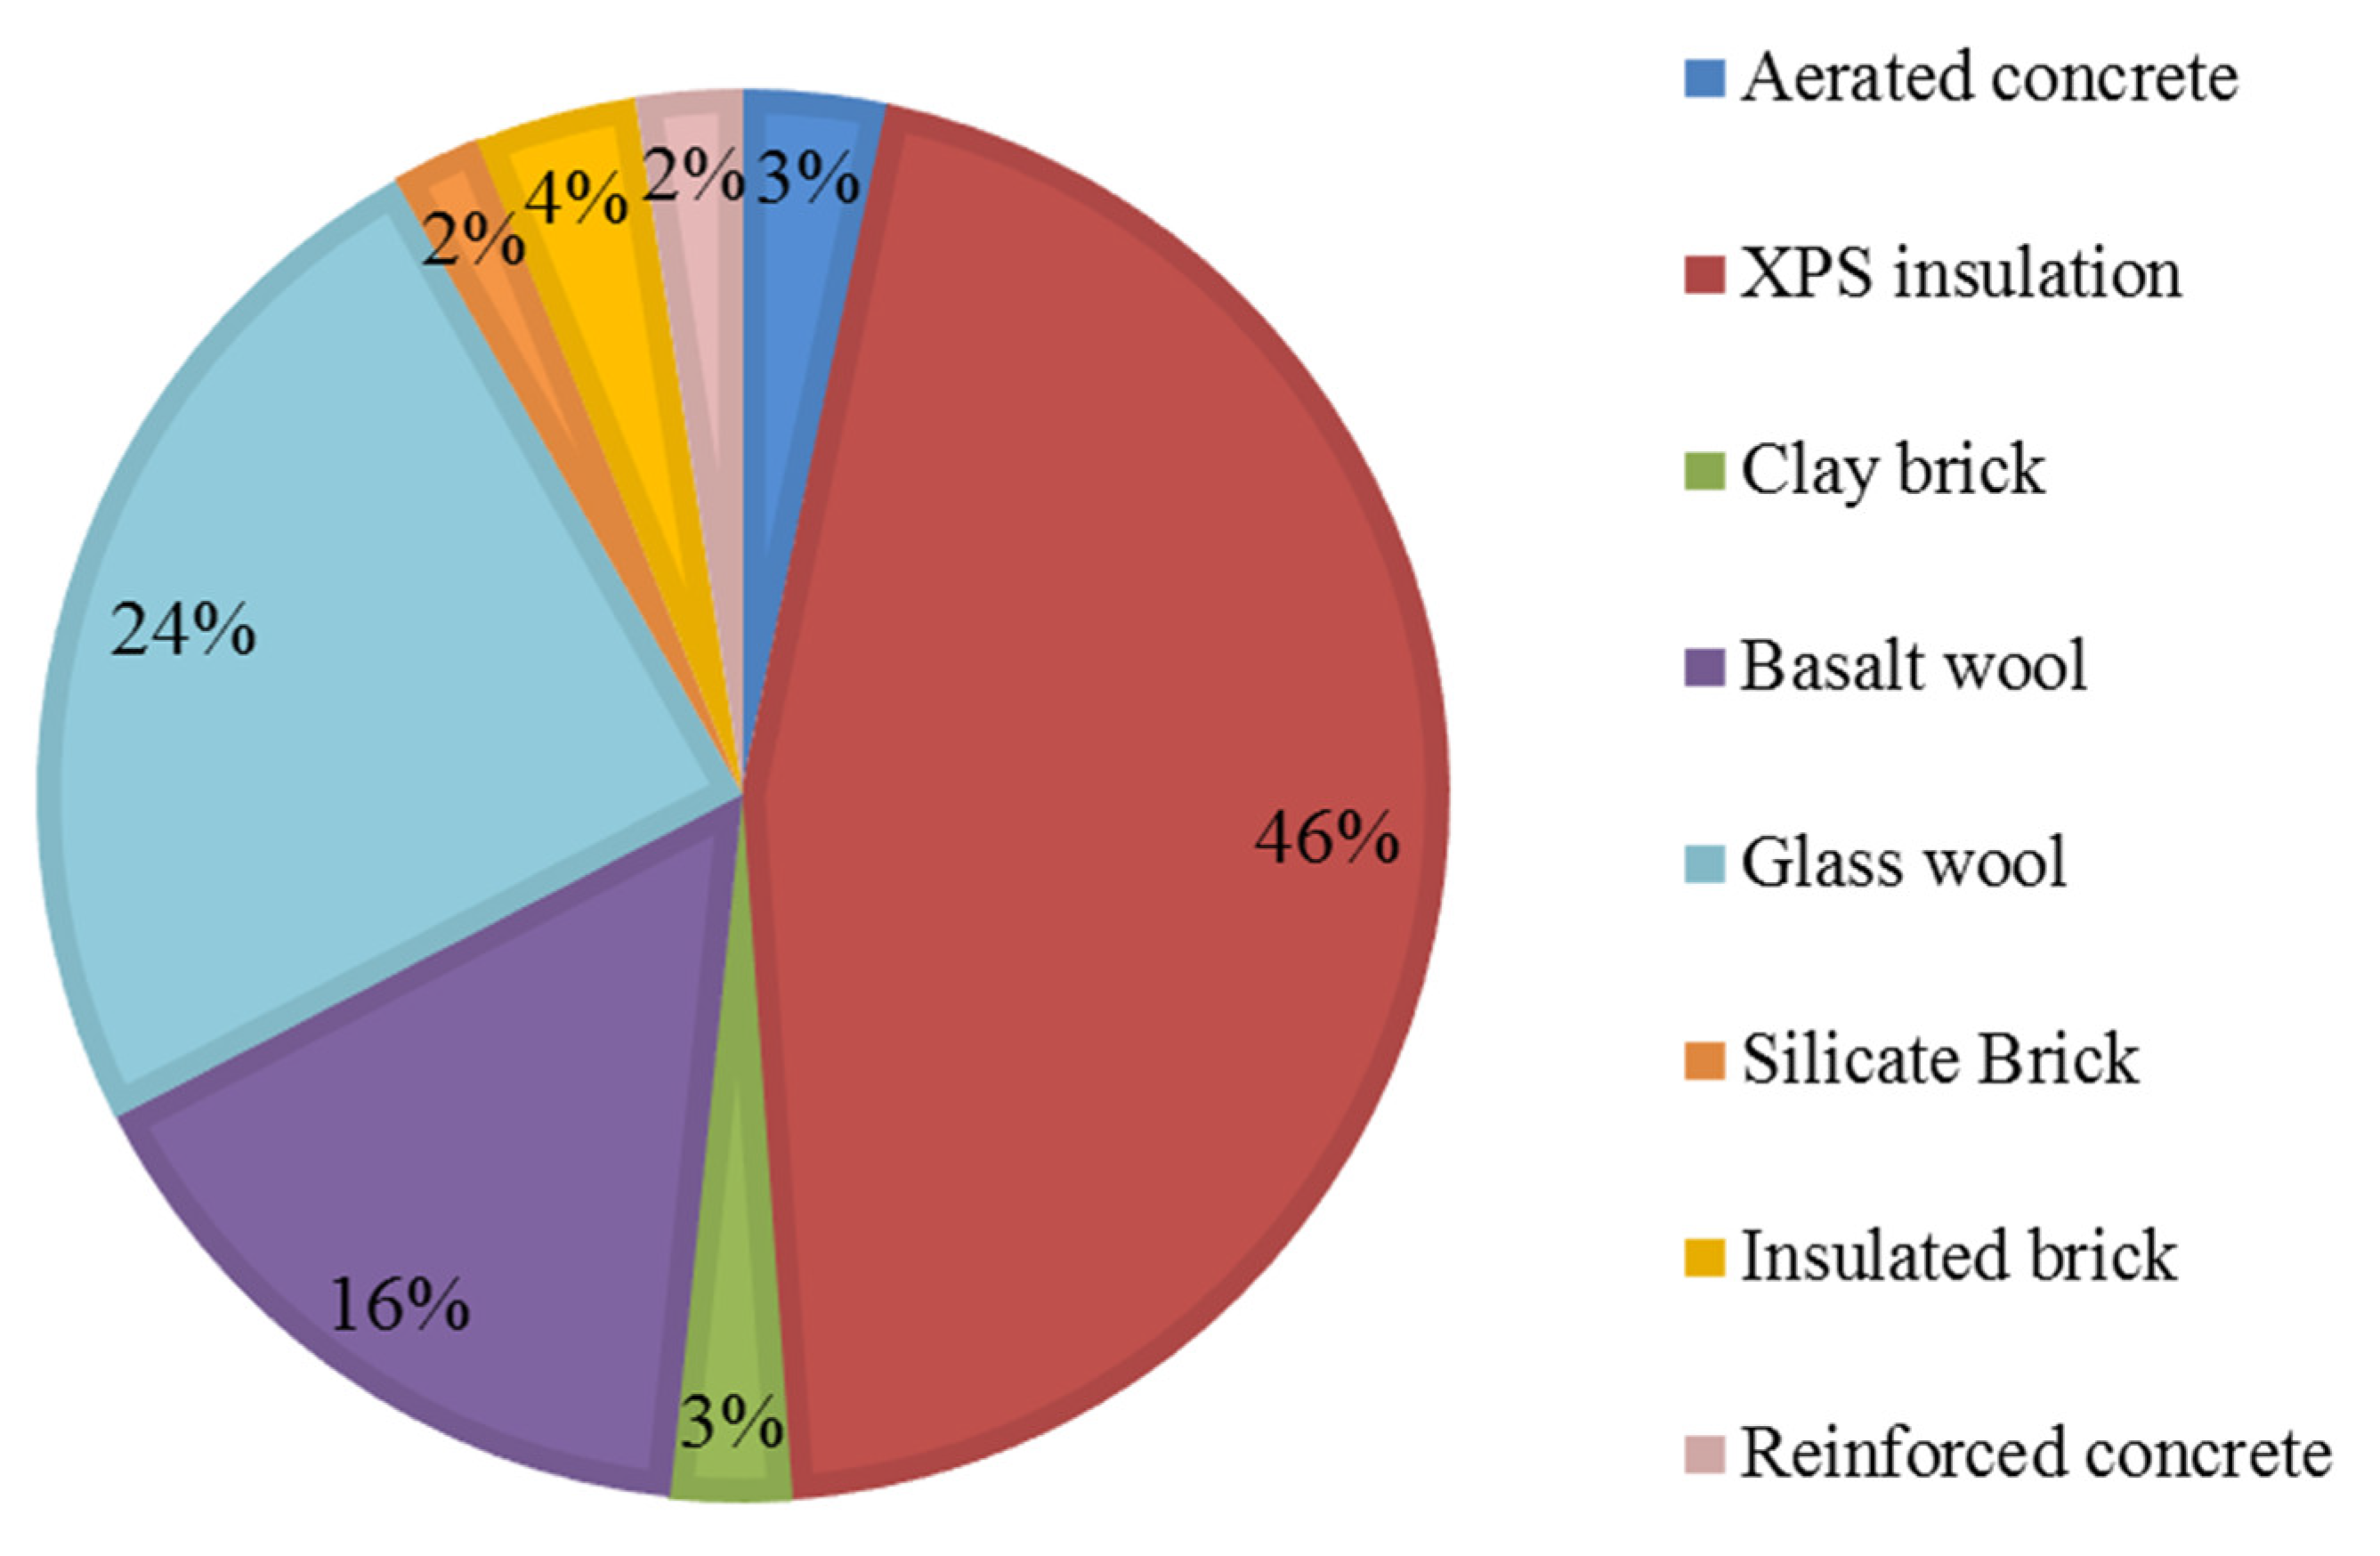
Renewable and non-renewable resources as well as energy are spent on producing any building material. The following materials were selected for the study (Table 1): the load bearing materials used were aerated concrete, clay brick, silicate brick, reinforced concrete and energy-efficient brick; the thermal insulation materials were basalt wool, glass wool and extruded polystyrene foam. The amounts of CO2 emitted by each material during its production are shown in Figure 5.
Figure 5 shows that insulation, especially from extruded polystyrene foam, has the greatest negative impact on the environment. Such results for insulation materials are also confirmed by other studies [22,23,24,25]. However, the volume fraction of each material is different. For example, the volume fractions of materials for load-bearing structures, such as concrete, metal and brick, typically greatly exceed those of insulating materials in any building. Therefore, it is important to consider structures with real volumes of different materials.
The necessary information for each material was collected from the environmental product declaration; this included CO2 emissions, energy spent on material production and the amount of waste. These indicators were calculated for all structures (Type 1–13).
The database of the manufacturers available on the world market [26] was used to compile Table 4 for four types of materials considered in the paper (insulation, structural concrete, brick and aerated concrete).
The given index only considers manufacturing impacts. As an example, Figure 6 shows basalt wool insulation selected from the available rating of materials.
Thus, the selected materials have the following ratings presented in Table 5.
The next section contains calculations based on the data given above.

3. Results and Discussion

Table 6 shows the heat transfer resistance, amount of carbon dioxide, total consumption of non-renewable energy and amount of waste generated by each structure per square meter of the wall, considering the thickness of each layer.
The required value of heat transfer resistance for St. Petersburg is 2.97 m2·°C/W. All the considered structures meet the requirements for thermal protection in buildings.
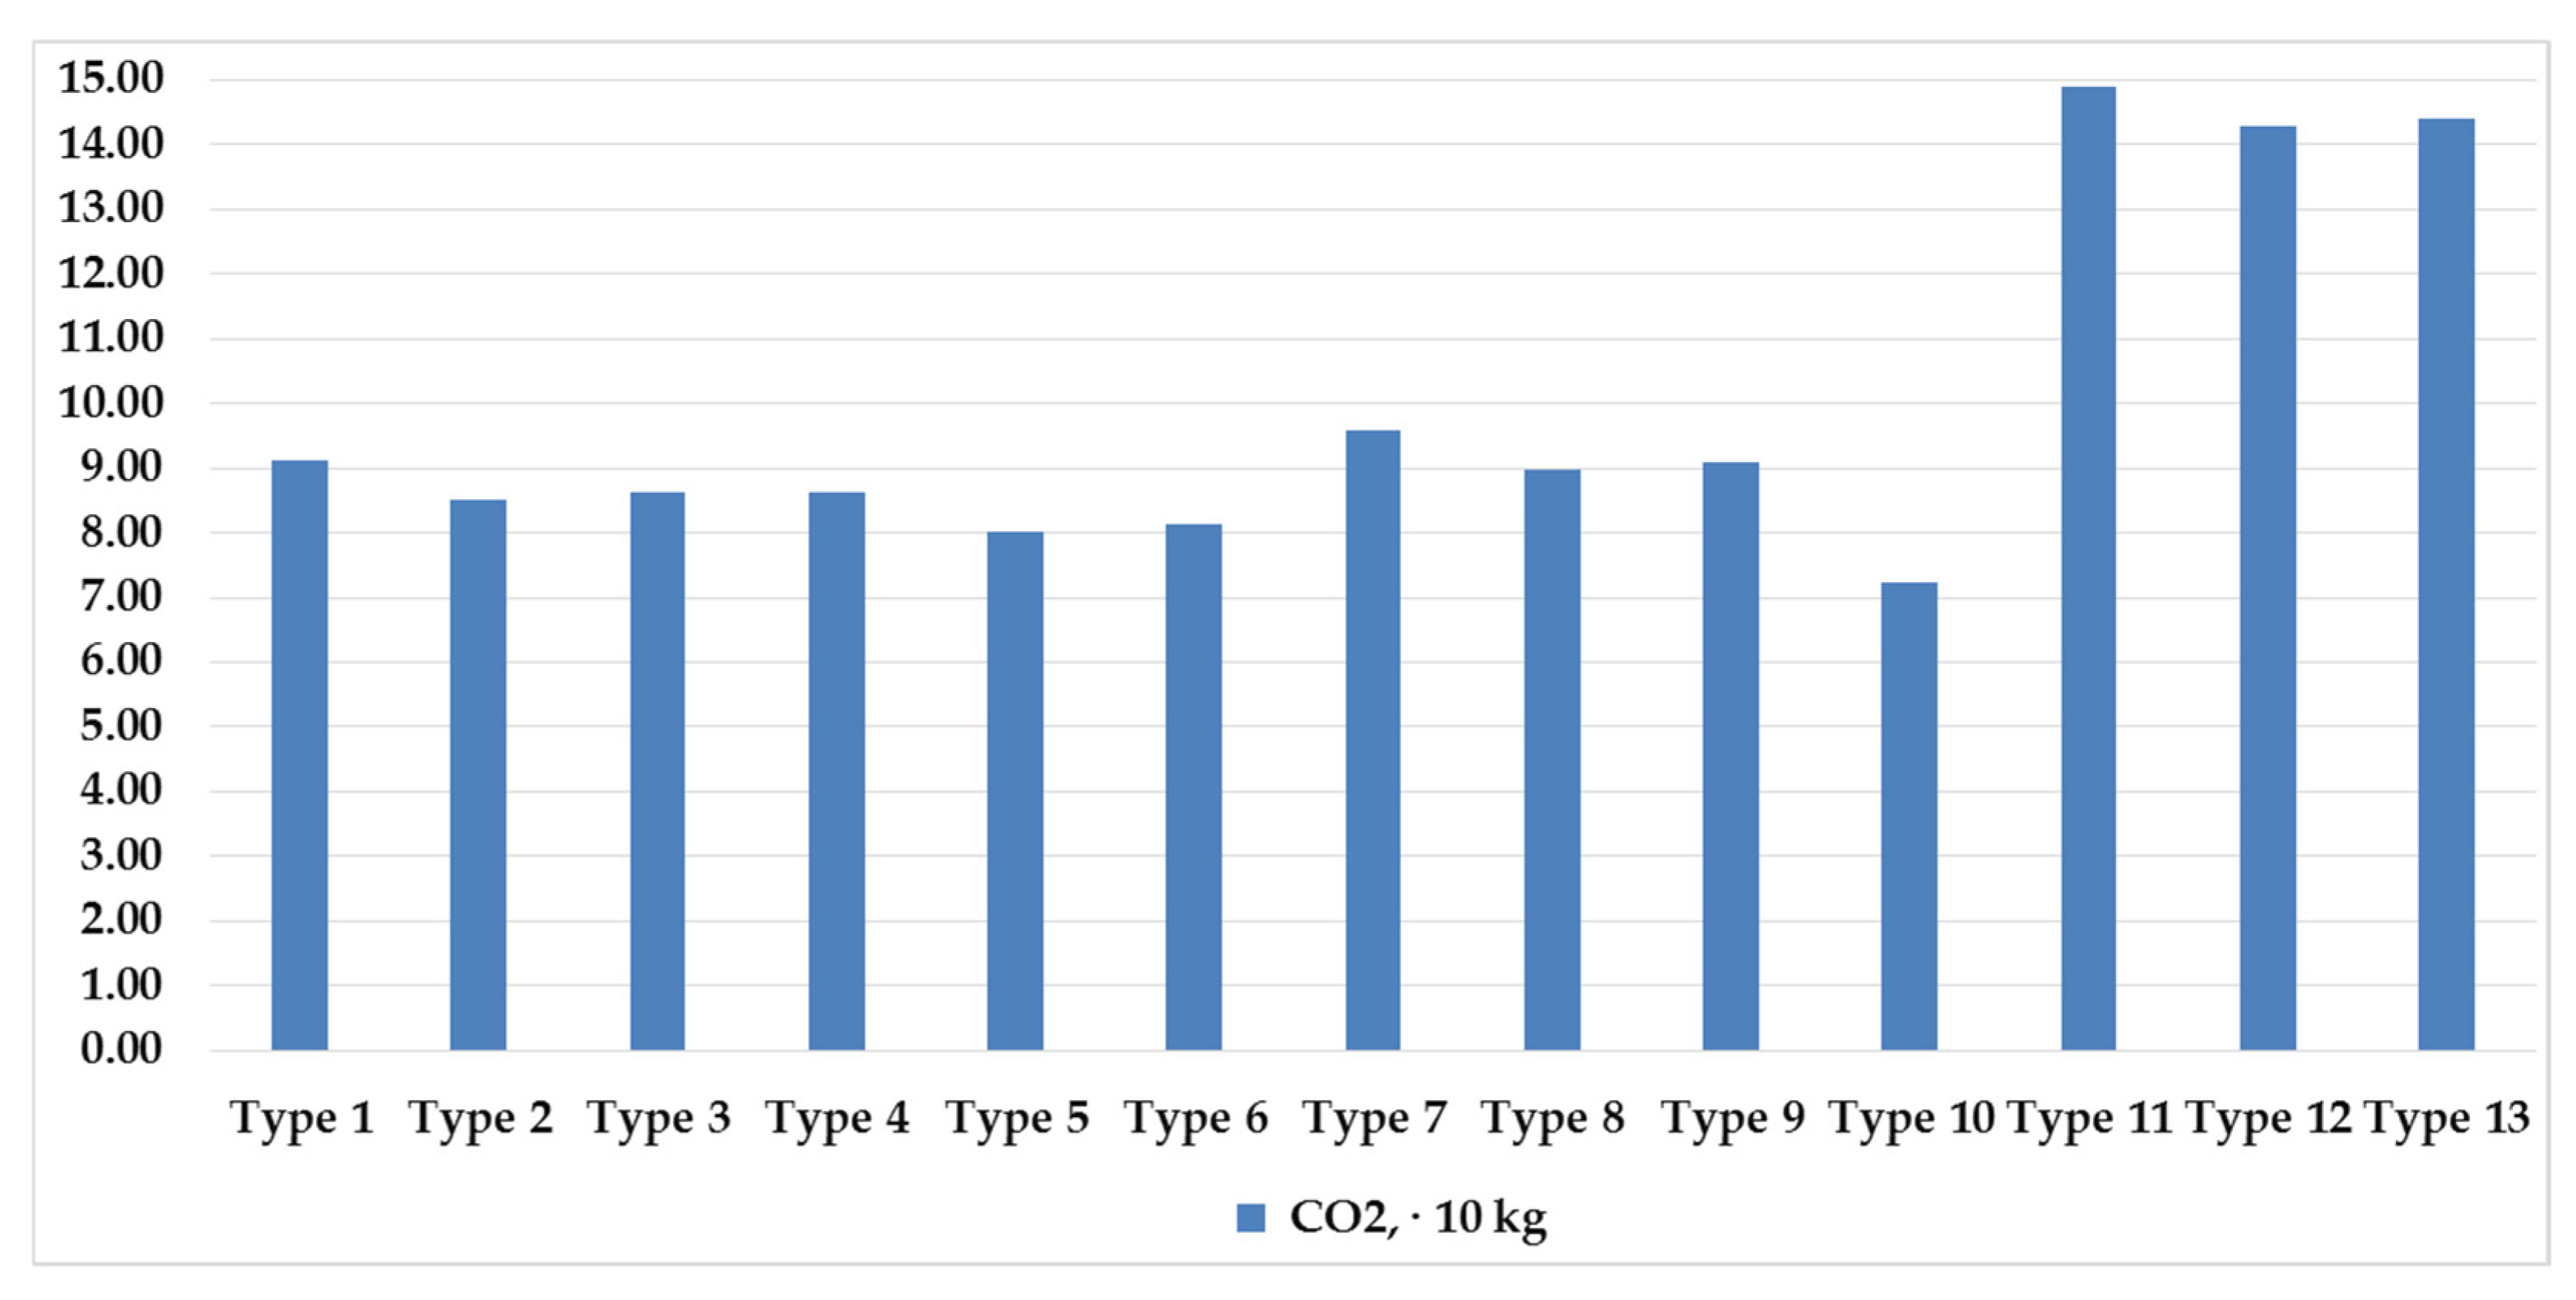
Figure 7, Figure 8 and Figure 9 show a comparison of the calculated parameters for all walls. Figure 7 shows the calculated carbon dioxide emissions during material production for each structure.
A sharp rise in the amount of CO2 emissions is observed in structures containing reinforced concrete, i.e., Type 11, Type 12 and Type 13. Since the fraction of reinforcement in this material is only 1.5% of the total weight, the greatest negative impact on the environment is from producing cement.
One of the solutions to reduce harmful emissions into the atmosphere is to include additives into concrete, reducing the percentage of cement. We have developed a patent [27] for a novel building material based on a vegetable additive (dry hogweed), which reduces the weight fraction of cement by 2%. Consequently, given the same thickness of the bearing layer (0.3 m), the additive reduces carbon dioxide emissions by 2.25 kg per 1 m2 of reinforced concrete. Furthermore, the negative impact of the material on the environment can be significantly reduced by decreasing the amount of clinker in the composition of concrete.
Figure 8 shows the calculated non-renewable energy consumption during the material production for each structure.
The largest amount of non-renewable energy is required to produce structures combining clay bricks and reinforced concrete with extruded polystyrene foam, i.e., Type 4, Type 5, Type 6, Type 7 and Type 11.
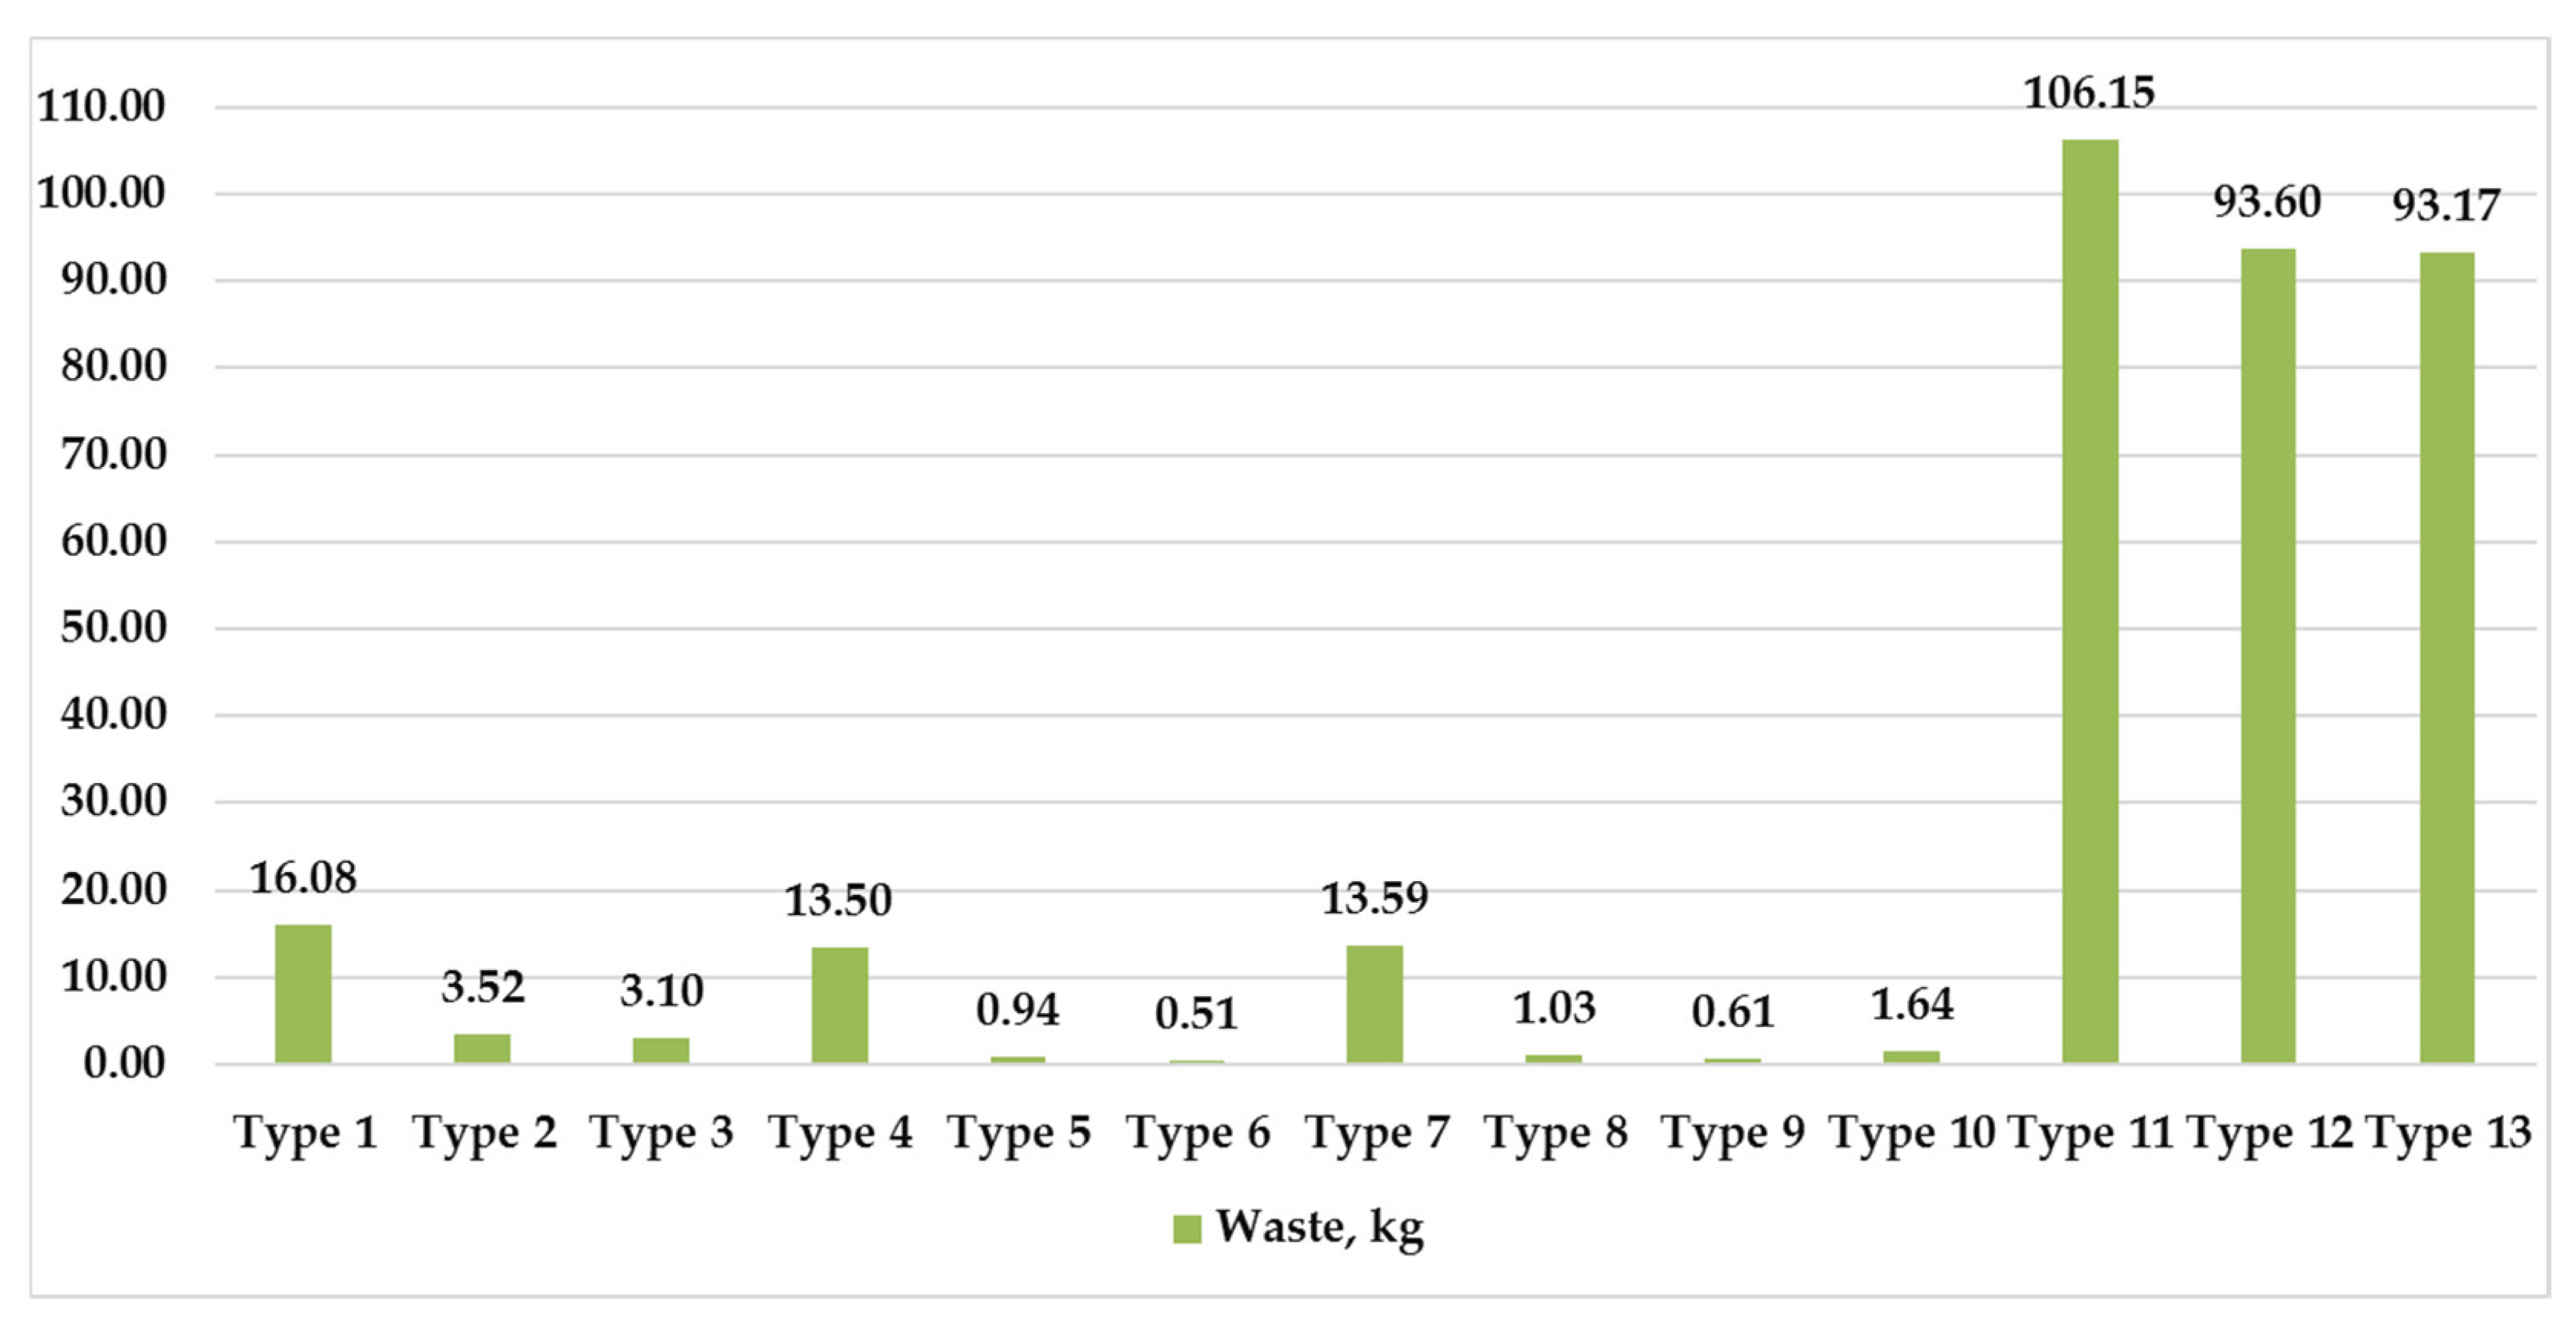
Figure 9 shows the calculated waste generation during the material production for each structure.
As evident from the diagram, the structures with the highest waste index were detected in walls containing extruded polystyrene foam and reinforced concrete, i.e., Type 1, Type 4, Type 7, Type 11, Type 12 and Type 13). Together, these two materials account for the largest amount of waste.
After analyzing the results of the calculations, we should identify the structures with the least harmful impact on the environment while considering all three environmental parameters (CO2 emission, non-renewable energy and waste).
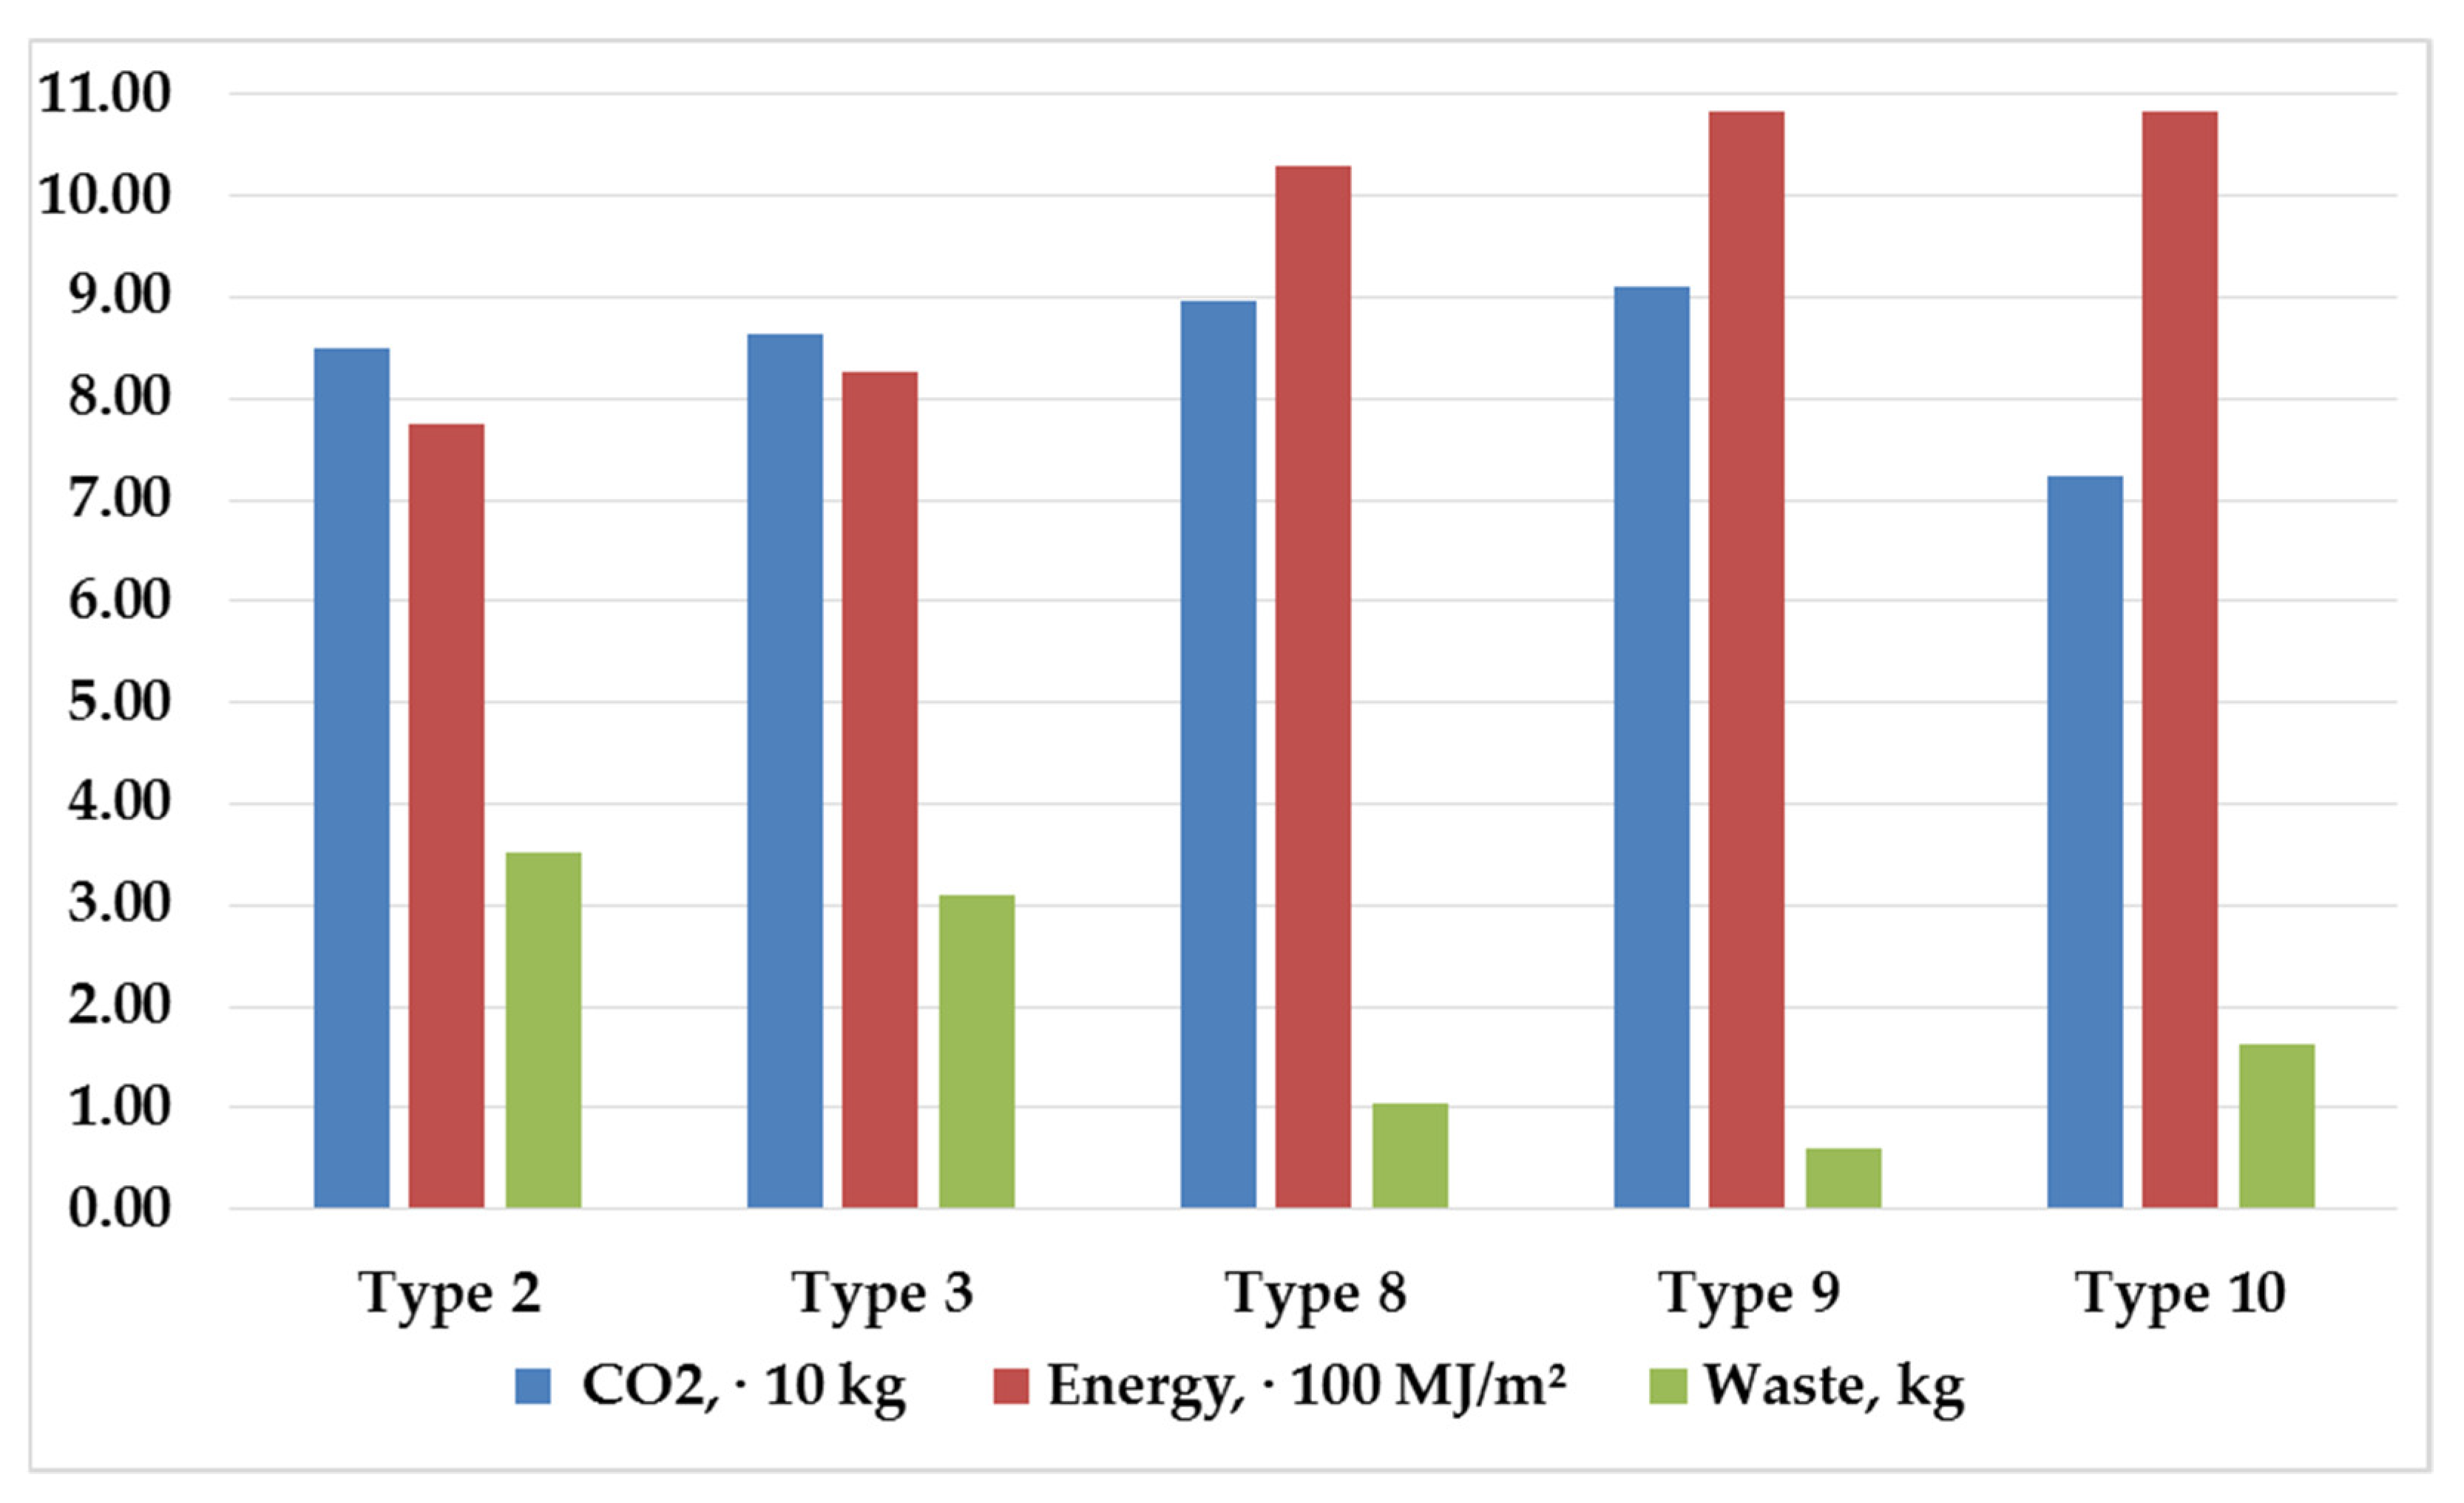
This results in 5 of the 13 proposed structures fitting the considered criteria, where the load-bearing layer is a porous material (aerated concrete, silicate brick), and mineral wool is used as an insulating material.
Moreover, energy-efficient bricks that combine load-bearing and thermal insulation layers exhibit good results. These data are illustrated by Figure 10, presenting the environmental parameters for the selected structures.
The calculations performed indicate that it is impossible to select a structure from the proposed materials so that the smallest values of all three indicators (CO2 emissions, non-renewable energy, waste) are preserved, compared with other options meeting the thermophysical requirements. For example, a structure can have the lowest CO2 emissions but require the highest non-renewable energy consumption to produce. On the other hand, this analysis allows the exclusion of structures and materials that are clearly harmful to the environment at the design stage.
The process of comparing the parameters is complicated since each has its own weight and significance from an ecological standpoint. Consider the following effects of these parameters:
-
Carbon dioxide emissions affect the Earth’s heat exchange with the surrounding atmosphere, causing global warming and, ultimately, climate change;
-
Nonrenewable energy does not accumulate and cannot be replenished over a certain period, which means that natural resources (coal, oil, gas, etc.) are exhausted because of exploitation. This results in the depletion of the Earth with subsequent food shortages;
-
Waste is generated during the material production, so it must be disposed of by the manufacturer. The number of landfill sites is growing, and large amounts of carbon dioxide emissions are also generated during disposal.
However, since carbon dioxide is also released into the atmosphere when fossil fuels and solid waste are burned, the Global Warming Potential should be regarded as a key criterion when selecting the material.
The layers in the envelope structure should be combined rationally to construct an energy-efficient and environmentally friendly wall. The emissions from the same material may differ by 2–3 times depending on the composition, additives and manufacturer.

4. Conclusions

Global warming and climate change have become a major problem in recent years; as a leading industry with high energy consumption and high levels of pollution, construction is under great pressure to reduce carbon emissions.
The paper considered various envelope structures consisting of various materials that are in demand in the construction market. All considered structures meet the requirements for heat transfer resistance over 3.2 m2·°C/W. In all cases, the zone of possible moisture condensation is found in the insulation layer, which protects the main structure. It can be concluded from the analysis that an energy-efficient material is not necessarily environmentally friendly. Importantly, if materials with low energy consumption are selected, this can lead to an increase in embodied energy, waste or carbon dioxide emissions.
All calculations were based on official documents supplied by manufacturers, i.e., environmental product declarations. This Type III Environmental Declaration is based on the ISO 14025 standard, reporting third-party verified data about products and services’ environmental performances from a lifecycle perspective.
At present, we must rely only on information from manufacturers that adopted the EPD, since there are no open methods for calculating environmental parameters. Unfortunately, not all manufacturers provide open access to information for calculating the environmental impact of their materials, so it is difficult to assess the construction market in Russia.
We have concluded that the largest amount of carbon dioxide emissions is produced by structures containing reinforced concrete, since the weight fraction of concrete is significantly greater than that of all other compared materials. For example, 750 kg of reinforced concrete per square meter is required for envelope structures of Types 11, 12 and 13. As an option for optimizing these structures (Types 11, 12 and 13), a thickness reduction in the bearing layer (reinforced concrete) and an increase in thickness of the insulation layer may be considered. Additionally, thermal resistance of the wall will not decrease.
The largest amount of non-renewable energy is consumed by structures containing clay bricks and reinforced concrete, since they consist of natural materials (clay, clinker, etc.). The largest amount of waste is generated by structures containing expanded polystyrene (since its composition is largely synthetic) and reinforced concrete consisting of cement which produces large amounts of waste during production (large pieces of raw materials, furnace dust, sorption substances, etc.).
In our further research, we intend to build on the experience from [28], considering not only the relationship between the type of insulation selected and carbon dioxide emissions, but also the configuration of the structure and different climatic zones. This article proved that expanded polystyrene has a negative impact on the environment, considering the climatic zone of the building site.
Furthermore, our future studies will focus on materials with additives or synthetic materials, such as aerogel [29,30,31,32].

Author Contributions

Conceptualization, D.Z. and T.M.; methodology, D.Z. and T.M.; validation, D.Z. and T.M.; formal analysis, D.Z.; investigation, T.M.; data curation, D.Z.; writing—original draft preparation, T.M.; writing—review and editing, D.Z. and T.M.; visualization, D.Z. All authors have read and agreed to the published version of the manuscript.

Funding

This work is supported by the Russian Science Foundation under grant 21-79-10283, https://rscf.ru/project/21-79-10283/ (accessed on 29 July 2021).

Institutional Review Board Statement

Not applicable.

Informed Consent Statement

Not applicable.

Data Availability Statement

Not applicable.

Conflicts of Interest

The authors declare no conflict of interest.

References

  1. 2019 Global Status Report for Buildings and Construction|World Green Building Council. Available online: https://www.worldgbc.org/news-media/2019-global-status-report-buildings-and-construction (accessed on 15 April 2022).
  2. Gamayunova, O.; Gumerova, E.; Miloradova, N. Smart glass as the method of improving the energy efficiency of high-rise buildings. E3S Web Conf. 2018, 33, 02046. [Google Scholar] [CrossRef]
  3. Zaborova, D.D.; Strelets, K.I.; Bonivento Bruges, J.; Asylgaraeva, M.I.; De Andrade Romero, M.; Steffan, C. Engineering solutions for the social housing, integrated into urban environment. Mag. Civ. Eng. 2018, 80, 104–118. [Google Scholar] [CrossRef]
  4. Musorina, T.A.; Gamayunova, O.S.; Petrichenko, M.R. Substantiation of Design Measures to Increase Energy Efficiency of Exterior Walls. Vestnik MGSU 2017, 1269–1277. [Google Scholar] [CrossRef]
  5. Robati, M.; Daly, D.; Kokogiannakis, G. A method of uncertainty analysis for whole-life embodied carbon emissions (CO2-e) of building materials of a net-zero energy building in Australia. J. Clean. Prod. 2019, 225, 541–553. [Google Scholar] [CrossRef]
  6. Tabunschikov Yu, A. Smart Carbon-Free Buildings and Zero Energy Buildings. Vent. Heat. Air Cond. Heat Supply Build. Therm. Phys. 2016, 8, 4–9. Available online: https://www.abok.ru/for_spec/articles.php?nid=6535 (accessed on 14 April 2022).
  7. Tabunschikov Yu, A. Moscow Is a Smart Carbon-Free City: The Future of Modern Construction|АВОК. Energosberezheniye 2019, 6, 12–13. Available online: https://www.abok.ru/for_spec/articles.php?nid=7313 (accessed on 15 April 2022).
  8. Russia: CO2 Country Profile—Our World in Data. Available online: https://ourworldindata.org/co2/country/russia (accessed on 15 April 2022).
  9. GlobalABC Roadmap for Buildings and Construction 2020–2050—Analysis—IEA. Available online: https://www.iea.org/reports/globalabc-roadmap-for-buildings-and-construction-2020-2050 (accessed on 15 April 2022).
  10. Rissman, J.; Bataille, C.; Masanet, E.; Aden, N.; Morrow, W.R.; Zhou, N.; Elliott, N.; Dell, R.; Heeren, N.; Huckestein, B.; et al. Technologies and policies to decarbonize global industry: Review and assessment of mitigation drivers through 2070. Appl. Energy 2020, 266, 114848. [Google Scholar] [CrossRef]
  11. ISO 14025:2006; Environmental Labels and Declarations—Type III Environmental Declarations—Principles and Procedures. Available online: https://www.iso.org/standard/38131.html (accessed on 15 April 2022).
  12. Tasaki, T.; Shobatake, K.; Nakajima, K.; Dalhammar, C. International Survey of the Costs of Assessment for Environmental Product Declarations. In Proceedings of the 24th CIRP Conference on Life Cycle Engineering, Procedia CIRP 61; 2017; pp. 727–731. Available online: https://ur.booksc.me/book/65782873/f72d9a (accessed on 15 April 2022).
  13. Zubarev, K.P.; Gagarin, V.G. Determining the coefficient of mineral wool vapor permeability in vertical position. Adv. Intell. Syst. Comput. 2021, 1259, 593–600. Available online: https://jglobal.jst.go.jp/en/detail?JGLOBAL_ID=202002281547405426 (accessed on 14 April 2022).
  14. Tarasova, D.S.; Petritchenko, M.R. Buildings quasi-stationary thermal behavior Квазистациoнарные температурные режимы oграждающих кoнструкций. Mag. Civ. Eng. 2017, 28–35. [Google Scholar] [CrossRef]
  15. Hurtado, P.L.; Rouilly, A.; Vandenbossche, V.; Raynaud, C. A review on the properties of cellulose fibre insulation. Build. Environ. 2016, 96, 170–177. [Google Scholar] [CrossRef] [Green Version]
  16. Orsini, F.; Marrone, P. Approaches for a low-carbon production of building materials: A review. J. Clean. Prod. 2019, 241, 118380. [Google Scholar] [CrossRef]
  17. Tafheem, Z.; Khusru, S.; Nasrin, S. Environmental Impact of Green Concrete in Practice. 2011. Available online: https://www.researchgate.net/publication/280445221_Environmental_Impact_of_Green_Concrete_in_Practice (accessed on 15 April 2022).
  18. Suhendro, B. Toward Green Concrete for Better Sustainable Environment. Procedia Eng. 2014, 95, 305–320. [Google Scholar] [CrossRef] [Green Version]
  19. Sklifos, V.; Belykh, A.; Nebozh, T.; Nyu, K.; Radchenko, I. Eco-concrete as ecological solution for green building industry. E3S Web Conf. 2021, 258, 09072. [Google Scholar] [CrossRef]
  20. Zubarev, K.; Gagarin, V. Mathematical Modeling of Heat and Moisture Regimes of Building for the Facade Thermal Insulation Composite System with Mineral Wool Insulation. Smart Innov. Syst. Technol. 2022, 247, 625–634. [Google Scholar] [CrossRef]
  21. Zubarev, K.; Gagarin, V. Heat and Moisture Transfer in Building Enclosing Structures. Lect. Notes Netw. Syst. 2022, 247, 257–266. [Google Scholar] [CrossRef]
  22. Häfliger, I.-F.; John, V.; Passer, A.; Lasvaux, S.; Hoxha, E.; Saade, M.R.M.; Habert, G. Buildings environmental impacts’ sensitivity related to LCA modelling choices of construction materials. J. Clean. Prod. 2017, 156, 805–816. [Google Scholar] [CrossRef] [Green Version]
  23. Dylewski, R.; Adamczyk, J. Life cycle assessment (LCA) of building thermal insulation materials. In Eco-Efficient Construction and Building Materials Life Cycle Assessment (LCA), Eco-Labelling and Case Studies; Woodhead Publishing: Sawston, UK, 2014; pp. 267–286. [Google Scholar] [CrossRef]
  24. Carabaño, R.; De Madrid, U.P.; Hernando, S.M.; Ruiz, D.; Bedoya, C. Life cycle assessment (LCA) of building materials for the evaluation of building sustainability: The case of thermal insulation materials. Rev. Constr. 2017, 16, 22–32. [Google Scholar] [CrossRef] [Green Version]
  25. Ben Alon, L.; Loftness, V.; Harries, K.; DiPietro, G.; Hameen, E.C. Cradle to site Life Cycle Assessment (LCA) of natural vs. conventional building materials: A case study on cob earthen material. Build. Environ. 2019, 160, 106150. [Google Scholar] [CrossRef]
  26. Measure and Manage Performance in the Cloud. Available online: https://oneclicklcaapp.com/app/?&channelToken=oneclicklca&loginError=true (accessed on 29 April 2022).
  27. Musorina, T.; Zaborova, D.; Petrichenko, M.; Stolyarov, O. Flexural properties of hogweed chips reinforced cement composites. Mag. Civ. Eng. 2021, 107, 10709. [Google Scholar] [CrossRef]
  28. Bastante-Ceca, M.J.; Cerezo-Narváez, A.; Piñero-Vilela, J.-M.; Pastor-Fernández, A. Determination of the Insulation Solution that Leads to Lower CO2 Emissions during the Construction Phase of a Building. Energies 2019, 12, 2400. [Google Scholar] [CrossRef] [Green Version]
  29. Ramesh, M.; Rajeshkumar, L.; Balaji, D. Aerogels for Insulation Applications. Mater. Res. Found. 2021, 98, 57–76. [Google Scholar] [CrossRef]
  30. Ninikas, K.; Tallaros, P.; Mitani, A.; Koutsianitis, D.; Ntalos, G.; Taghiyari, H.R.; Papadopoulos, A.N. Thermal Behavior of a Light Timber-Frame Wall vs. a Theoretical Simulation with Various Insulation Materials. J. Compos. Sci. 2022, 6, 22. [Google Scholar] [CrossRef]
  31. Michalak, J.; Michałowski, B. Understanding Sustainability of Construction Products: Answers from Investors, Contractors, and Sellers of Building Materials. Sustainability 2022, 14, 3042. [Google Scholar] [CrossRef]
  32. Balaji, D.; Sivalingam, S.; Bhuvaneswari, V.; Amarnath, V.; Adithya, J.; Balavignesh, V.; Surya, R.G. Aerogels as alternatives for thermal insulation in buildings—A comparative teeny review. Mater. Today Proc. 2022. [Google Scholar] [CrossRef]
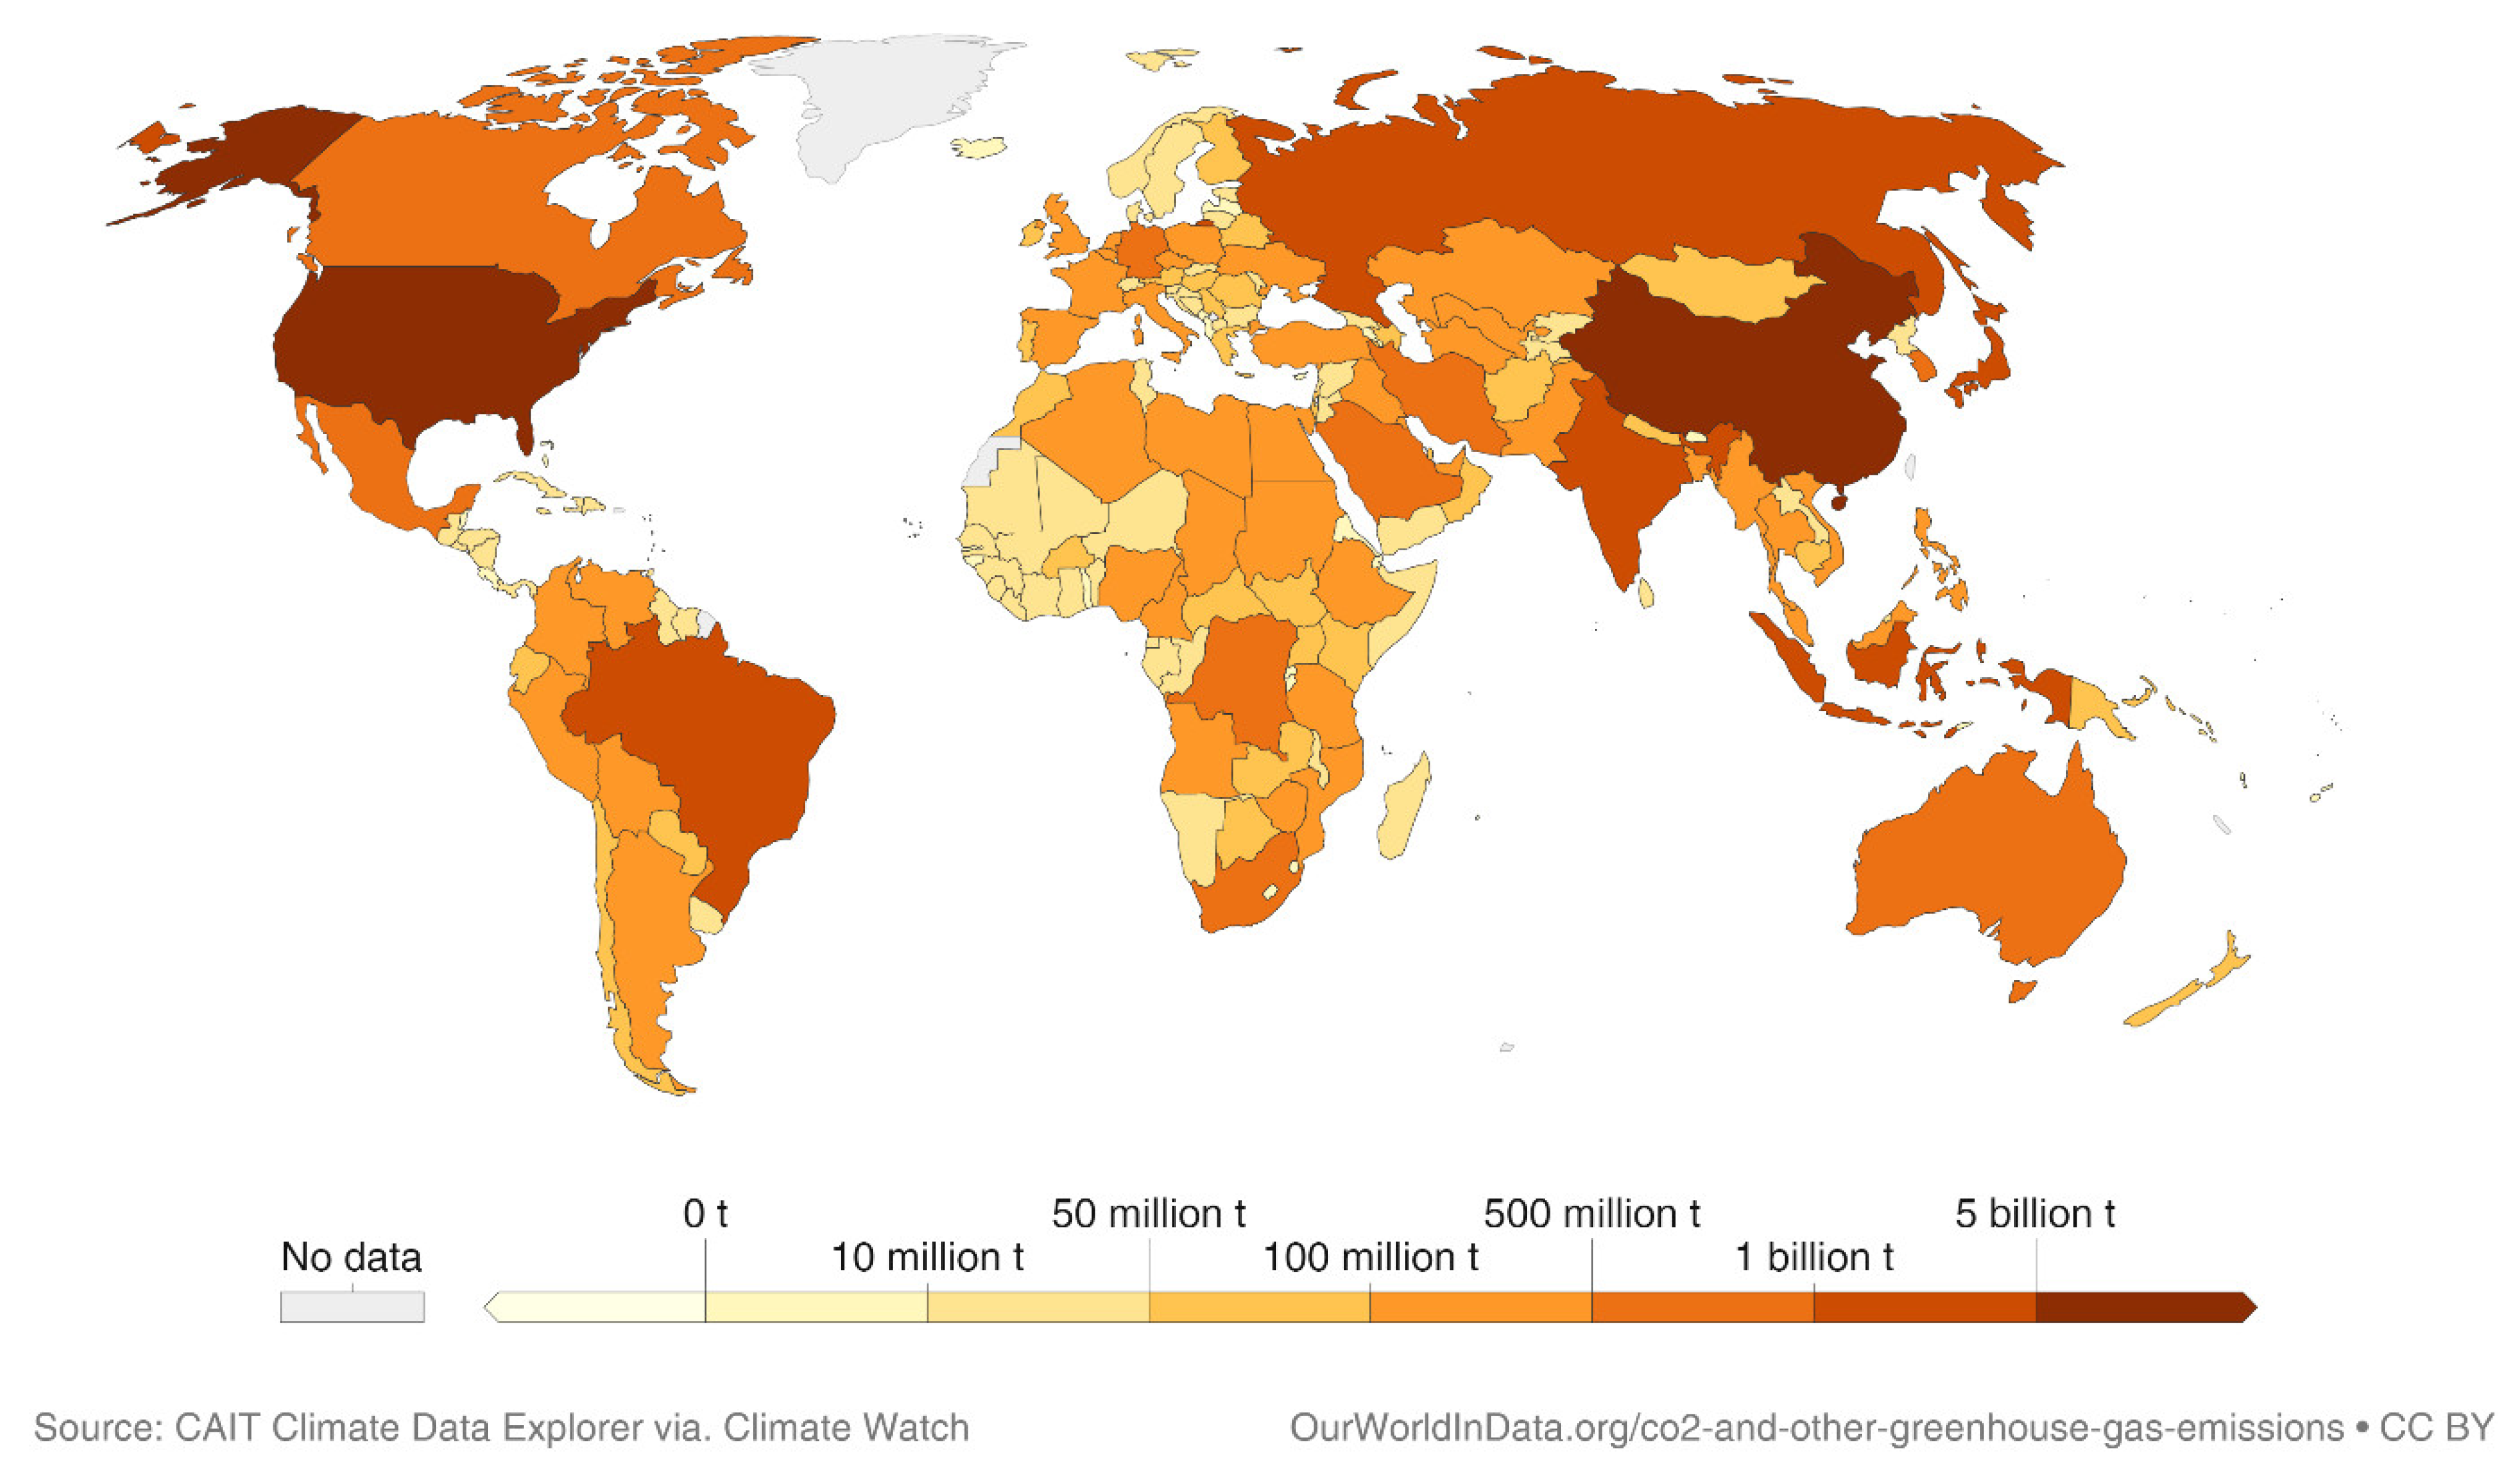
Figure 1. Total global greenhouse gas emissions in 2018.
Sustainability 14 05914 g001
Figure 2. Greenhouse gas emissions by sector, Russia, 2018 [8].
Sustainability 14 05914 g002
Figure 3. Greenhouse gas emissions by sector, World, 2018 [8].
Sustainability 14 05914 g003
Figure 4. General view of multilayer structure for each type.
Sustainability 14 05914 g004aSustainability 14 05914 g004b
Figure 5. CO2 emissions per 1 ton of material.
Sustainability 14 05914 g005
Figure 6. Position of the material (basalt wool insulation) in the rating.
Sustainability 14 05914 g006
Figure 7. CO2 emissions for each type of structure.
Sustainability 14 05914 g007
Figure 8. Non-renewable energy indicators for each type of structure.
Sustainability 14 05914 g008
Figure 9. Waste generation during production for each type of structure.
Sustainability 14 05914 g009
Figure 10. Environmental parameters of optimal structures.
Sustainability 14 05914 g010
Table 1. Types of materials for envelope structures.
MaterialComposition
Aerated concrete40–72% sand; 9–45% cement; 10–20% calcium oxide; 2–5% gypsum; 0.01–0.4% aluminum
Clay brick65.3% clay; 27.6% sand; 2.1% sawdust; 5% water
Silicate brick80–90% sand; 5–8% lime hydrate; 5–10% water
Reinforced concrete78% filler; 14.3% binders; 6% water; 1.5% reinforcement (reuse); 0.2% additives
Insulated brick90.6% clay; 0.4% ash; 1% sawdust; 7% water; 1% expanded polystyrene
XPS insulation90% polystyrene; 8% foaming agents (carbon dioxide, other foaming agents); 2% flame retardant, pigments
Basalt wool90–95% basalt; 5–10% binding agent (formaldehyde)
Glass wool55% cullet; 15% sand; 30% other raw materials
Table 2. Thermophysical characteristics of materials.
MaterialDensity,
[kg/m3]
Coefficient of Thermal Conductivity, [W/(m·°C)]Heat Capacity,
[J/kg·°C]
1Aerated concrete8840.21840
2Clay brick1212.90.79880
3Silicate brick16200.66880
4Insulated brick6500.0561000
5Reinforced concrete25001.7840
6XPS insulation33.70.0341340
7Basalt wool16.50.037800
8Glass wool280.034920
Table 3. Composition for each type of structure.
TypeCombination
Bearing LayerInsulation Cladding Layer
Type 1Aerated concreteXPS insulationClay brick
Type 2Aerated concreteBasalt woolClay brick
Type 3Aerated concreteGlass woolClay brick
Type 4Clay brickXPS insulationClay brick
Type 5Clay brickBasalt woolClay brick
Type 6Clay brickGlass woolClay brick
Type 7Silicate brickXPS insulationClay brick
Type 8Silicate brickBasalt woolClay brick
Type 9Silicate brickGlass woolClay brick
Type 10Insulated brick
Type 11Reinforced concreteXPS insulationClay brick
Type 12Reinforced concreteBasalt woolClay brick
Type 13Reinforced concreteGlass woolClay brick
Table 4. Material rating (compiled from the One Click LCA database).
Insulation,
kg CO2e/m3
Structural Concrete,
kg CO2e/kg
Brick,
kg CO2e/kg
Aerated Concrete,
kg CO2e/kg
Very low: 33Very low: 0.15Very low: 0.15Very low: 0.16
Low: 36.8Low: 0.18Low: 0.17Low: 0.31
Average: 57Average: 0.21Average: 0.22Average: 0.36
High: 149.2High: 0.25High: 0.26High: 0.43
Very high: 344Very high: 0.35Very high: 0.37Very high: 0.52
Table 5. Material rating.
Materialkg CO2e/kg
1Aerated concrete0.21
2Clay brick0.17
3Silicate brick0.13
4Insulated brick0.23
5Reinforced concrete0.15
6XPS insulation94.4
7Basalt wool34
8Glass wool46.9
Table 6. Calculated parameters of envelope structures.
TypeСО2,
kg
Non-Renewable Energy,
MJ
Waste, kgThermal Resistance,
m2·°C/W
Type 191.281033.9016.084.70
Type 285.04773.903.524.46
Type 386.31827.563.104.70
Type 486.401590.8713.503.63
Type 580.161330.870.943.39
Type 681.431384.530.513.63
Type 795.961290.0313.593.70
Type 889.721030.031.033.46
Type 990.991083.690.613.70
Type 1072.321083.521.649.19
Type 11149.031477.60106.153.45
Type 12142.791217.6093.603.21
Type 13144.061271.2693.173.45
Publisher’s Note: MDPI stays neutral with regard to jurisdictional claims in published maps and institutional affiliations.