Abstract
The green supply chain (GSC) has become a major trend that advocates for the sustainability of supply chains. To seek optimal strategies for the GSC, the competition between green and nongreen supply chains (NGSCs), along with the impacts of government subsidies and tax policies and the green preferences of consumers, are discussed in this study. A pricing-strategy model of an NGSC and a GSC was conducted by considering the cross-price effects. The equilibrium strategies (the optimal green-technology level, the pricing, and the profits) were achieved and were comparatively analyzed with backward induction. For more in-depth research, a robust sensitivity analysis was conducted, and the Taguchi method was used to identify the main factors that affect the revenues of NGSCs and GSCs. The results show that the vertical collaboration between manufacturers and retailers can help to improve the greenness of products and bring more benefits to consumers. The government interventions have an effect, and when the government sets a premeditated threshold for subsidies and taxation, GSC members can earn more, and the green products obtain more competitiveness. The green preferences of consumers are the primarily conducive factor to the sustainability and profit increases of GSCs. However, the green-technology-investment cost will not have a significant influence on the equilibrium strategies.
1. Introduction
In recent years, the intensification of greenhouse-gas emissions and the increasing seriousness of environmental pollution have attracted worldwide attention [1,2]. The concept of sustainable development has been broadly recognized and accepted. The green supply chain (GSC) is considered to be a major trend in the current research, and the future development direction of sustainable supply chains (SCs) for the manufacturing industry [3]. In this regard, it is of considerable academic and practical value to study the GSC in a competitive environment.
As the administrative subject of social governance, the government has to make a series of interventions in order to promote green production for the mitigation of environmental pollution. Therefore, governments in many countries and regions have utilized legislation and policies to exert pressure on the core manufacturers in SCs to develop green products [4]. One of the most common ways is the pollution-tax mechanism, which is primarily used to charge the unit product for enterprises that exceed the corresponding technical or ecological standards [5]. This mechanism has been applied and implemented in a lot of countries, such as in the United Kingdom and Germany [6], and in Australia and British Columbia [7]. Another way is the incentive policy, which means that the company that manufactures green products will be rewarded with subsidies. This is beneficial for the production and consumption of green products, and, finally, it promotes the progress of products in a sustainable direction [8].
There are also flexible strategies that have been adopted in numerous areas to enhance the environmental awareness of companies and consumers via advocacy and guidance [9]. For illustration, enterprises should be encouraged to take corporate social responsibility (CSR) by setting environmental goals [10]. Meanwhile, this will increase consumer trust and build good green images for companies through the disclosure of their environmental information (e.g., the carbon emissions of products). Hence, they will increase their investments in green technologies voluntarily [11,12]. For consumers, the promotion of the advantages of green products and daily environmental education are conducive to increasing consumer interests in green products. Surveys show that consumers today are willing to pay more for environmentally friendly products [13,14]. The stronger the environmental awareness of the consumers, the higher the price that they are willing to pay for green products [15,16].
At present, although green products are increasingly friendly to the environment, they are still at a disadvantage in competitive markets. There are some restrictive factors in the production and promotion of green products [17]. This is mainly manifested in two aspects. First, the development of green products is still in its infancy, and the green publicity of products by enterprises is not enough. This has resulted in a low degree of consumer understanding and preferences for green products. As one of the important factors that impacts consumer purchasing decisions, the reduction in green preferences leads to a decrease in the willingness of consumers to buy green products, which thus puts these products at a competitive disadvantage in the market. Secondly, since most green products cost enterprises a lot in terms of design and research and development (R&D), they place heavy investment burdens on corporations [18]. This not only influences the incentives of companies to implement green production, but it also leads many enterprises to set higher sales prices when pricing green products. Thereby, the willingness of consumers to purchase is reduced, and this presents some obstacles to the development of green products [19].
However, a large number of nongreen products, which are produced in nongreen supply chains (NGSCs), exist in the market, and they have created fierce competition with the green products in GSCs. In the current circumstance of economic globalization, the competitive environments of various industries are evolving from competition between independent companies to competition between SCs [20,21]. In this case, it is essential to study the competition between GSCs and NGSCs in order to improve the competitiveness of green products, and to promote the sustainable development of the environment.
As the green concept continues to gain popularity, the Chinese government, as the main body of market regulation, is gradually transforming its market management from a traditional management model to a green management model [22]. In recent years, the Chinese government has paid increasing attention to environmental issues in an effort to determine the best policies to protect the environment, while maintaining economic growth [23]. For the sake of stimulating the development of green products, the Chinese government has introduced a large number of subsidy policies. For example, the Chinese Ministry of Commerce and other departments issued the “Implementation Measures for Trade-In Home Appliances (Revised Draft)” in 2010 to encourage qualified regions to provide subsidies for the phasing out of old home appliances and furniture, and for the purchasing of green smart-home appliances and environmentally friendly furniture. Since 2009, the Chinese government has subsidized the promotion and application of new energy vehicles. Up to now, the cumulative subsidies for new energy vehicles in China have reached CNY 47.8 billion, and the sales of new energy vehicles have increased by more than 260 times. (Economic Observer. Focus: ”National ledger” of nearly CNY 150 billion of new energy vehicle subsidies in 12 years [EB/OL]. (2021-12-03). https://baijiahao.baidu.com/s?id=1718136079880214871&wfr=spider&for=pc (accessed on 5 May 2022).
It is clear that the Chinese government’s financial policy for green products has been in existence for a long time. The implementation of these interventions, on the one hand, strengthens the competitiveness of green products in the market, and, on the other hand, greatly stimulates the sustainable development of the environment and becomes an effective measure to support green production [24]. Meanwhile, the implementation of the government interventions has had a greater impact on the pricing of green products as well. Since the government subsidizes certain green products, their pricing will change accordingly on the grounds of the amount of government subsidies and the different subsidy subjects. To put it another way, the appropriate taxation on enterprises that do not manufacture green products will promote the gradual transformation from nongreen production to green production, from an economic perspective. When green and nongreen producers exist at the same time, the government subsidizes green production and levies taxes on nongreen production. In such circumstances, the ways in which their respective SC entities conduct product pricing and optimal decision making is a problem that is worthy of in-depth study.
Consumers have differences in their willingness to purchase and pay for green products, which are due to personal habits, psychological factors, economic income, education levels, and other factors [25]. Consumers are willing to pay more for some green products, on the basis of the UK Carbon Trust. According to the “Report on the Status Quo of Public Green Consumption in China (2019)”, 83.34% of the respondents expressed support for green consumption [26]. This shows that most consumers have green preferences, but that the degrees of the preferences vary. This variation in consumer preferences will inevitably influence the market demand for green products, as well as the competition between green and nongreen products.
Therefore, on the basis of the actual current situation of Chinese enterprises, we constructed the product-market-demand function on the basis of the consumer-preference coefficient and the green-technology level of the product. Subsequently, game theory was used to study the influence of the government’s financial policy on the competition decisions of a GSC and an NGSC, so as to seek out the optimal strategies (i.e., the green-technology level, pricing, and profits) for green production in the competitive situation. We also expected to find the most important influencing factors that affect the development of GSCs, as well as an effective way to improve the competitiveness of green products, and to ultimately enhance the sustainability of products (we define sustainable products as products that do not harm the environment or the ecology, and that do not cause pollution). The main research questions that are addressed in this study are as follows:
- How do the NGSC and the GSC interact with each other in the centralized and decentralized decision models? Which decision model is more beneficial for GSCs?
- How do the preferences of consumers for green products affect the product pricing and the profits of NGSCs and GSCs?
- What is the impact of government subsidies for green products and taxes for nongreen products on the pricing and profits of NGSCs and GSCs? Will it improve the competitiveness of GSCs?
- Given the coexistence of various factors (parameters), which factors have the most significant effects on the profits of NGSCs and GSCs?
The innovation of this paper is as follows: (i) We comprehensively consider the influence of the government’s financial interventions and consumer environmental preferences on the competitive decision making of a GSC and an NGSC, which is close to the real situation of Chinese enterprises. (ii) Sensitivity analyses of a single parameter and multiparameter changes (the Taguchi method) are comprehensively applied, which not only reflect the effect of a single parameter change on the optimal decision making of each participant in the NGSC and the GSC, but also discovers the most important factors in the optimal decision making. This can provide better references for enhancing the competitiveness of green products.
The remaining part of the paper proceeds as follows. Section 2 reviews the relevant literature. Section 3 describes the problems in detail and presents some assumptions. Section 4 establishes and compares the mathematical models of an NGSC and a GSC in the centralized and decentralized decision models. Section 5 makes a numerical simulation and a sensitivity analysis of the related parameters in order to illustrate the models and the theoretical results. Section 6 presents the conclusions, as well as several directions for future research.
2. Literature Review
This study is largely apprehensive, with three branches: the competition of the supply chain, government interventions in the supply chain, and the influence of consumer preferences.
2.1. Competition of Supply Chain
Ample research has been conducted on the competition of SCs, which can be divided into two kinds: competition within a single supply chain, and competition among multiple supply chains. The former primarily occurs in one-to-multiplayer structures (one supplier and multiple retailers), multiplayer-to-one structures (multiple suppliers and one retailer), and multiplayer-to-multiplayer structures (multiple suppliers and multiple retailers) in SCs. Mohammaditabar et al. [27] analyzed the decision-making problem of a two-stage SC under the competition of multiple suppliers, and they discuss its cost and profit by using cooperative and noncooperative game theory. Li and Chen [28] developed an SC model that is based on one retailer and two brand manufacturers, with differentiated and competitive products, and they discuss the effect of channel integration on the price and quality competition between the two brands. Qi et al. [29] studied the pricing problem of a duopoly SC that was composed of one supplier and two suppliers under the carbon-cap policy, and they analyzed the impact of multiple business strategies on the SC decisions under the price competition and cooperation of two retailers. Bai et al. [30] discussed the competition and cooperation between two homogeneous retailers with vendor-managed inventory (VMI) in a perishable-product SC. Mahmoudi and Rasti-Barzoki [31] investigated the impact of government tariffs on the competition of producer groups and retailer groups in a specific industry, and they applied the model to the Indian textile industry for specific research. Seyedhosseini et al. [32] studied a two-level competitive SC game model that consisted of a monopoly manufacturer and two duopoly retailers, and they propose that the self-pricing and the cross-price sensitivity of consumers depended on the manufacturer’s CSR efforts. Sana [33] discusses the issue of price competition between green and nongreen producers under the influence of corporate social responsibility.
The competition among multiple SCs principally appears in the market where the industry competes, since the competition of the industry is moving from independent enterprises to SCs [34]. Zhang et al. [35] constructed an SC multiproduct newsstand model for the production and sales of green (environmental) and nongreen (traditional) products, and they compared the effects of competition and cooperation on SCs under centralized and decentralized decision scenarios. Li and Li [36] developed a game-theory model to describe the competition between two sustainable SCs. They argue that an equilibrium solution could only be achieved when the two sustainable SCs were independent of each other. Yang et al. [37] discuss the competition between two SCs under the cap-and-trade mechanism from the vertical and horizontal directions, and they made a comparison of the emission-reduction decisions and the other equilibrium solutions of SCs with different structures. Saha and Nielsen [38] explored the pricing decisions in terms of alternative products in the case of competition between two SCs, and they found that, when online channels are opened, cooperation between two competing manufacturers can produce higher SC profits. Hafezalkotob and Hadi [39] modeled the competitive behavior of closed-loop supply chains (CLSCs) and ordinary SCs, and they achieved the optimal retail and wholesale prices of their products under government intervention policies. Hafezalkotob [40] established a price-competition model of a GSC and a normal SC under the impact of government tariffs. Hadi et al. [41] studied the competition between CLSCs and normal SCs, and they considered the situation where nongreen and green products could substitute for each other. Yazdanpanah et al. [42] considered the formation of a cartel between green and ordinary manufacturers in a certain product market, and they discuss the competition between the two SCs, who intend to maximize their social welfare and profitability in the SC system. Nielsen et al. [43] discussed the optimal pricing and investment decisions of two competing GSCs. The results show that the two competing manufacturers could produce at high levels if they were vertically integrated with their retailers. Hafezalkotob [44] established a set of production competition models for GSCs and NGSCs, and they considered the effect of two modes of government interventions: direct tariffs (DTs) and tradable licenses (TPs). On the basis of the work of Hafezalkotob [44] and Yazdanpanah et al. [42], we explored the competition between a GSC and an NGSC under government intervention policies, and the research object was the same as Hafezalkotob [44]. The disparity is that both Hafezalkotob [44] and Yazdanpanah et al. [42] regard the government as the participator and leader in the Stackelberg game, while our study only takes on the government as an external influencing factor when discussing the competition between the GSC and the NGSC. The work was performed from the point within the SC market.
2.2. Government Interventions in Supply Chain
The government interventions in SCs are chiefly manifested in the form of policies or legislation that impact the behavior of the enterprises in the SC [45]. These policy instruments are usually divided into quantity-based and price-based instruments [44,46]. The former mainly refers to the control policy that is adopted by the government for a certain behavior or transaction quantity, such as cap-and-trade and tradable-permit schemas, and many scholars have conducted relevant research. Xu et al. [47] investigated the production and emission decisions of an SC under the circumstance that manufacturers adopt green technologies based on cap-and-trade rules. The results reveal that the SC coordination could be achieved through wholesale-price and cost-sharing contracts. Wang et al. [48] established a carbon-emission-reduction game model that is based on manufacturers and retailers, and they believe that cost-sharing and wholesale-price-premium contracts could achieve the emission reduction goal. Sabzevar et al. [49] conducted the Cournot-competitive-game model between two companies under the cap-and-trade scheme. They thought that it was unnecessary to increase the market shares of the enterprises with the lowest carbon emissions. Xu et al. [50] considered the impact of cap-and-trade rules on supply-chain production and pricing, and they found that emissions trading prices had a strong impact on the optimal decisions of manufacturers and retailers.
Price-based schemas mean that the government adopts financial ways to realize their control, such as taxes and subsidy schemas. Some scholars have researched the impacts of these government interventions on SCs. Safarzadeh and Rasti-Barzoki [51] discuss the effect of government strategies on the energy-efficiency program for home appliances in sustainable SCs, and they found that government subsidies on manufacturers had the most significant impact on energy-efficiency improvements. He et al. [52] investigated the influence of government subsidies on the choices of manufacturers when new products competed with remanufactured products in a dual-channel CLSC. The former could encourage the latter to select an ideal channel structure by setting appropriate levels of subsidies. Nielsen et al. [53] studied CLSC decision making and the effect of government policies. They found that government subsidies that are directly given to consumers could bring more profits to each player, and could create more social welfare. Niu et al. [54] discuss the impacts of two widely used government regulations: penalties and subsidies, on procurement management in sustainable-fashion SCs. Li and Liu [55] considered the impact of government interventions on the optimal decision making of a two-level GSC under fuzzy uncertainty. The result shows that strong government interventions could not only reconcile the conflict between the price and green-level decisions, but they could also relieve the contradiction between consumers and suppliers. Hafezalkotob et al. [45] built on a three-tier distributed planning problem and discussed the impact of the government, which is a Stackelberg leader, in deciding on subsidy and tax strategies for GSCs and normal SCs. On the basis of Hafezalkotob et al. [45], this paper studies the competition between a GSC and an NGSC under the government’s financial interventions. The difference is that Hafezalkotob et al. [45] conducted their research from the perspective of the government, which participates in the SC as the Stackelberg leader. However, we consider the government’s intervention policy as an external influencing factor, and we discuss the optimal decision-making problem of GSC and NGSC competition when the manufacturer is the Stackelberg leader.
2.3. Influence of Consumer Preferences
Consumer preferences are personalized preferences that reflect consumers’ interests in different products and services. They are an important factor that influences the market demand. With the increasing attention to environmental issues, consumers have gradually developed certain preferences for green products. Bask et al. [56] found that some consumers were willing to pay a premium for sustainable products, and that their values are gradually being oriented towards sustainable products and services. Kim et al. [57] explored the relationship between corporate GSC management and the consumer preferences for their products through a survey of more than 300 consumers. The results show that the consumers preferred these products when they believed that corporations had adopted green management systems, practiced resource recycling, and had adopted a socially responsible approach. This research has prompted some scholars to study the impact of consumer preferences on the SC. Zhang et al. [35] discussed the impact of consumer environmental awareness on the order quantity and channel coordination in a two-tier SC. Yu et al. [58] considered the different green preferences of consumers, and they studied the decision-making problems of manufacturers in green production under government subsidies. Sun et al. [59] studied the effect of the low-carbon preferences of consumers on the carbon-emissions-transfer and emission-reduction strategies among enterprises in an SC. Ghosh et al. [60] discussed the influence of government-mandated cap-and-trade controls and the low-carbon preferences of consumers on a two-level dual-channel SC. Zhang et al. [61] investigated the impact of the channel preferences of consumers on the pricing and service decisions in dual-channel SCs. Meng et al. [22] comprehensively considered that consumers have two types of preferences, which are, namely, green preferences and channel preferences, and they discuss the coordinated pricing policy of products under a dual-channel GSC under the conditions of government subsidies. Feng et al. [26] studied the different preferences of consumers for purchasing remanufactured products, and the impact of government tariffs on the decision making and coordination in the CLSC. Similar to Yu et al. [58] and Meng et al. [22], this article also considers the green preferences of consumers and government interventions, but we mainly research the effect of the green preferences of consumers on the optimal decisions of each participator in the competition between the GSC and the NGSC. This is not limited to only one SC.
2.4. Research Gap
This study is closely related to the work of Hafezalkotob [44], Hafezalkotob et al. [45], and Yazdanpanah et al. [42] (see Table 1). They all studied the competition between NGSCs and GSCs under government interventions. However, the three articles all incorporated the government into the game in the role of the leader, while this research regards the government as a bystander and studies the impact of its financial policies on the behavior of the participators in the NGSC and the GSC. In addition, the three articles only discuss the impact of government interventions, without considering that consumers have their own preferences as purchasers. This study takes consumer preferences as an influencing factor, and it discusses the optimal strategies of each player in the competition between NGSCs and GSCs under the dual influences of government interventions and consumer preferences.

Table 1.
Articles related to our paper.
Therefore, the main contributions of this article, in terms of bridging the research gap, are as follows: (i) We consider government subsidies and tax policies as external interventions in SC competition, rather than as actors (leaders), and we discuss the effects of different tariffs on the competitive decisions between a GSC and an NGSC, where the manufacturers are the leaders. (ii) We take the consumer preferences towards the environment as an external factor, and we explore the impacts of their different preferences on the decision making of the GSC and the NGSC in competition. (iii) On the basis of the sensitivity analysis of a single parameter, we adopted a robust sensitivity analysis of the multiparameter changes (the Taguchi method) in order to compare and analyze multiple variables, such as government subsidies, taxes, green-level coefficients, and consumer-preference coefficients. Finally, we can discover the most important factors that affect the profits of manufacturers and retailers in the NGSC and the GSC, and we provide references for enhancing the competitiveness of green products.
3. Problem Description
In this study, two SCs in a specific industry are considered in a competitive market, and each one is composed of one manufacturer and one retailer. One of the SCs practices green technology to make green products, and its retailer is responsible for selling them. We call it a GSC, in which the manufacturer and the retailer are a green manufacturer and a green retailer, respectively. The other SC makes nongreen products without green technology. Thus, we call it an NGSC, and it has a nongreen manufacturer and a nongreen retailer, respectively, for its manufacturer and retailer. On account of the difference in the green technology that was invested in the production, we deem that the two SCs are independent and without mutual interferences. In other words, the manufacturer only makes green products and the retailer only sells green products in the GSC, while the manufacturer and the retailer in the NGSC only produce and sell nongreen products. This means that there is no cooperation between the NGSC and the GSC. However, for any single supply chains (NGSC or GSC), a partnership can appear between the manufacturer and the retailer in the vertical direction. This assumption is reasonable, according to the actual production and actual life. Here, we take new energy vehicles and traditional vehicles in the automotive industry as an example. We know that new energy vehicles have the advantages of energy saving and environmental protection, and therefore they belong to green products. On the contrary, traditional cars are nongreen products. Because of the difference in the technical input between new energy vehicles and traditional vehicles, they have independent production chains. For example, Tesla only produces new energy vehicles, and it has its own brand sellers in the sales channels. Therefore, we think that the two chains of the GSC and the NGSC do not interfere with each other.
The products that are manufactured in the NGSC and the GSC are oriented towards the same consumer market. We assume that green products can be known to consumers through labelling or by green certification. This can be achieved in the actual market. For example, new energy vehicles are easy for consumers to identify and distinguish from traditional vehicles. Moreover, many industry associations in the world have started to implement carbon markings on products. For illustration, marking the carbon footprint of the entire production chain on the final product is required in garment production [63]. Thereby, consumers can obtain information as to whether it is a green product or not, depending on the product label, and they can then make purchase decisions.
The government, as the external supervisor of the market, needs to steer enterprises towards the achievement of the environmental protection goals, and, consequently, they have to interfere in the production of SCs. In reality, the intervention is primarily manifested in two policies: incentive and punishment [6]. “Incentive” refers to the government’s positive interventions into green manufacturers to encourage them to produce more green products in the manner of subsidies. “Punishment” denotes that the government levies taxes onto nongreen manufacturers to inhibit the production of nongreen products. It is assumed that the subsidy rate for green products is , and that the tax rate on nongreen products is .
Without a loss of generality in this work, we assume that the manufacturer adopts a “make-to-order” policy, and that the retailer will not make replenishments until the products are sold out. This elucidates that the production quantity of the manufacturer and the order quantity of the retailer are both in accordance with the market demand [64]. The members of GSCs and NGSCs are information symmetric and are completely rational. They all make decisions on the basis of their profit-maximization principles.
The structure of the two SCs that are studied in this paper is shown in Figure 1. In this model, the GSC and the NGSC are two independent SCs that exist in the market at the same time, and that constitute a competitive relationship. Each SC has two participants: a manufacturer and a retailer. In addition to the competitive relationship, the behaviors of two other subjects (i.e., the government and consumers) have an impact on the decisions of GSCs and NGSCs. The government’s influence is through financial interventions; that is, the subsidizing of green manufacturers and the taxing of nongreen manufacturers. As a purchaser, the consumer is unfettered in choosing green or nongreen products. Because of the distinction in their cognitive levels and consumption concepts, their preferences for green products are different. This will influence the demand for green and nongreen products, and it will ultimately affect the pricing of the products. The operating modes of GSCs and NGSCs are as follows. In GSCs, the green manufacturer invests in green production technology to make green products, and it sells them to the green retailer at the wholesale price of . Consumers buy the green products from the green retailer at the sales price of . In NGSCs, there exists almost the same process; however, the green production technology is not involved. After the production, the products will be wholesaled at the price of to the nongreen retailer, and they will be sold in the market at the price of . The related parameters and notations that are involved in this paper are shown in Abbreviations.
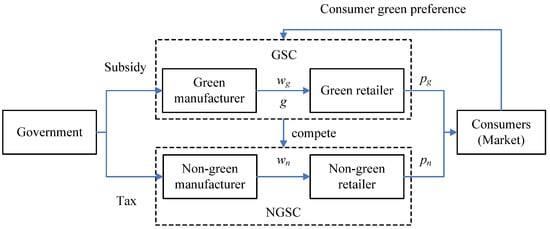
Figure 1.
The structures of the NGSC and the GSC.
On the basis of the research of some scholars, we find that most of the current studies adopt the direct demand function [7]. Therefore, by referring to Ghosh and Shah [65], Hafezalkotob [40], and Wang and Choi [64], we conduct a linear demand function that is based on the sales price (), the green-technology level (), and the consumer-green-preference coefficient (). The demand function decreases with its own sales price, and it increases with the competitors’ sales prices and the green-technology level. The demand functions of the NGSC and the GSC are as follows:
In Equations (1) and (2), represents the base market demand (); refers to the consumer-green-preference coefficient; and , denote the price-elasticity coefficient and the cross-price-elasticity coefficient, respectively. In the demand market, the retailer’s price is more sensitive to the prices of its competitors [30,66], and so we assume that . indicates the elasticity coefficient of the green-technology level (), and refers to the green-technology level (.
In this study, we believe that the higher the green-technology level, the greener and more sustainable are the products. When the green-technology level is , this implies that the GSC does not invest in green technology (i.e., its manufactured products are nongreen products). At this time, the GSC turns into the NGSC, and the competition in the market is between two conventional SCs, which is similar to the study of Li et al. [67]. If is a parameter, it can be merged with , and its demand-function form is similar to that of Hafezalkotob [40].
For the consumer-green-preference coefficient, if , this means that consumers have no preferences for green products, and that they will not buy green products at all. Under the circumstances, there are only nongreen products on the market, and the NGSC will monopolize the market, whereas indicates that consumers are really fond of green products. All consumers will choose to buy green products, and no one will charge for nongreen products. Then, the GSC will be a monopolizer. Both of the above cases exist in the real market. Hence, the value range should be . Moreover, represents that consumers have the same amounts of interest in green and nongreen products (i.e., the probability of purchasing two kinds of products is the same). A denotes that the probability of consumers choosing green products is less than the probability of them choosing nongreen products, and a has the inverse meaning. Therefore, as the main body of consumption in the market, the consumer preferences for green products directly determine the demand structure of the market.
The superiority of the demand-function model that we conduct is shown in the following aspects: (i) It not only adopts the common factor, which is, namely, the sales price of the green product, but it also adopts the cross-price elasticity to represent the cross-influence of the sales price of nongreen products on the demand, which is in line with actual life. (ii) The inputting of the green-technology level into this can reflect the effect of the green degree of the product on the demand in real time. (iii) The consumer-green-preference coefficient is incorporated into the function, which can truly reflect the influence of the different green preferences of consumers on the market demand. This is close to the actual situation.
In order to develop green technology, it is necessary for green manufacturers to invest in R&D in order to carry out technological innovation [12]. However, the manufacturing of green products does not affect the marginal costs of traditional suppliers [7,68,69]. Therefore, according to Dong, Shen, Chow, Yang and Ng [63], Chan et al. [70], and Tong, Mu, Zhao, Mendis and Sutherland [2], we adopt a quadratic function to express the unit cost of the green technology (i.e., ), and denotes the green-technology-investment-cost coefficient of the manufacturer ().
Since the demand must satisfy the nonnegative constraints, it is necessary to satisfy , , , . For the sake of the manufacturers in NGSCs and GSCs, , needs to be realized. Consequently, we have , . To ensure the smooth research of this work, the constraints and must be met as well (see Appendix A for the reasons).
4. The Model Formulation
There is only one scenario—competition between the NGSC and the GSC—according to the aforementioned problem description. However, for each SC, between its manufacturer and retailer, there are two decision-making structures: the centralized decision model and the decentralized decision model. The former denotes that the manufacturer and the retailer cooperate in the vertical direction and make decisions as a whole. The latter is the scenario where the manufacturer and the retailer are mutually independent in the vertical direction, and each member makes individual decisions. Furthermore, the manufacturer and the retailer make up a Stackelberg game model, with the manufacturer as the leader in both the NGSC and the GSC, which can be evaluated by the backward-induction method.
The advantages of the model that we established are shown in the following: (i) According to the condition of whether the participators of the SC cooperate or not, it is divided into two models: the centralized decision model and the decentralized decision model, which can reflect the different scenarios in the actual market comprehensively. (ii) The Stackelberg game model that we adopt can accurately reflect the game procedure of each player, and the changes in each variable in the competition process of the two SCs, which lays the groundwork for the detailed comparative analysis and sensitivity analysis in the following paragraphs.
In this section, the competition between the NGSC and the GSC with the influences of the government interventions and the green preferences of consumers in the centralized decision model in Section 4.1 is analyzed first. Then, the competition among the manufacturers and the retailers in the NGSC and the GSC in the decentralized decision model in Section 4.2 is discussed. After that, we make comparisons between the centralized and decentralized decision models in Section 4.3, and comparisons between the NGSC and the GSC in Section 4.4.
4.1. Centralized Decision Model
In the centralized decision model, the wholesale price is an endogenous variable. The manufacturer and the retailer are a whole, and they become one decisionmaker in each SC. Therefore, the competitions in the market are between the whole SCs (NGSC and GSC), and they make decisions at the same time. At this point, the two SCs formed a Nash game, with the goal of pursuing their maximum profits for the whole SC. The profits of the NGSC and the GSC are as follows:
Equation (3) presents the overall profits of the NGSC, which consist of the sales revenue, the production cost, and the taxes that were imposed by the government on the nongreen products. Equation (4) denotes the overall profits of the GSC, which are composed of the sales income, the production cost, government subsidies, and the investment cost of the green technology by the green manufacturer. Therein, the subsidies for green products are positively related to the level of the green technology (i.e., the higher the green-technology-investment level, the higher the unit subsidy rate).
From Equations (3) and (4), we have the following theorem.
Theorem 1.
For the concentrated decision model, when the NGSC and the GSC compete for the sales price, there exists a unique Nash equilibrium, where:
in which,and.
Theorem 1 reveals the optimal decisions in the green-technology level and the sales prices in the NGSC and the GSC under the centralized decision model. It proves the uniqueness of the Nash equilibrium between the NGSC and the GSC under the centralized decision model. The proofs of all the theorems and corollaries are presented in Appendix A. From Equations (5)–(7), we can obtain Theorem 2.
Theorem 2.
For the concentrated decision model, the optimal profits of the NGSC and the GSC are, respectively:
4.2. Decentralized Decision Model
In the decentralized decision model, each member of the NGSC and the GSC is an independent individual who can make decisions on his/her own, and who pursues the maximum profit. For the GSC, the sequence of events is as follows: the green manufacturer, as the leader of the Stackelberg game, determines the wholesale price and green-technology level of the green products, while the green retailer, as the follower of the Stackelberg game, determines the sales prices of the green products. For the NGSC, the nongreen manufacturer is the leader of the Stackelberg game, and the nongreen retailer is the follower. The nongreen retailer determines the wholesale price and the sales price of the nongreen products in succession. The players in each SC game model are evaluated by the backward-induction method. The sequences of the decisions of the NGSC and the GSC are shown in Figure 2. Therefore, the profit functions of the retailers and the manufacturers of the NGSC and the GSC are:
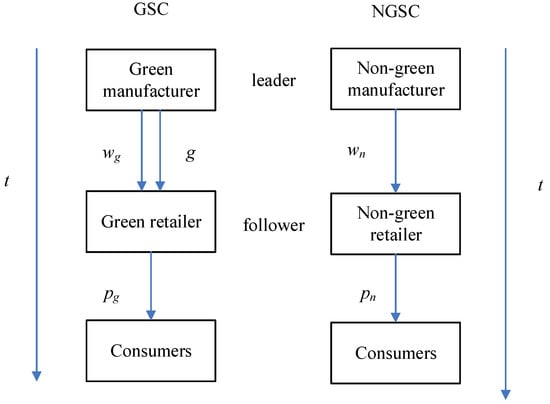
Figure 2.
The sequences of the decisions of the NGSC and the GSC.
Equation (10) is the profit of the nongreen retailer, which is composed of the sales income and the purchase cost. Equation (11) represents the profit of the nongreen manufacturer, which includes the sales income, the production cost, and the government taxation fee for nongreen products. Equation (12) donates the profit of the green retailer, which includes the sales revenue and the purchase cost. Equation (13) states the profits of the green manufacturer, which consists of four parts: the sales income, the production cost, the government subsidies for green products, and the investment expense for the green technology.
With the backward-induction method, we can find the equilibrium strategy under the competition between the manufacturers and the retailers in the NGSC and the GSC. According to Equations (10)–(13), we can obtain the following theorem.
Theorem 3.
For the decentralized decision model, the following conclusions exist. (i) When nongreen retailers and green retailers are competing in terms of the sales price, there exists a unique Nash equilibrium(,), where:
(ii) In the Stackelberg game, with the manufacturers as the leader, the optimal responses of the nongreen and green manufacturers to the sales prices of the nongreen and green retailers is (,,), where:
in which.
Theorem 3 implies the optimal decisions in terms of the green-technology level and the prices of the manufacturers and retailers in the NGSC and the GSC under the decentralized scenario. This proves the existence and uniqueness of the Nash equilibrium between the nongreen and green retailers, and the Stackelberg equilibrium between the nongreen manufacturer and retailer, and the green manufacturer and retailer, respectively. On the basis of Equations (14)–(18), the following theorem can be obtained.
Theorem 4.
For the decentralized decision model, the optimal profits of manufacturers and retailers in the NGSC and the GSC are, respectively:
From Equations (19)–(22), we can draw the following corollary.
Corollary 1.
For the decentralized decision model, the optimal profits of the manufacturers and retailers in the NGSC and the GSC satisfy the following relationship: (i); (ii).
Corollary 1 suggests that the optimal profit of the manufacturer is higher than that of the retailer in both the NGSC and the GSC. Moreover, the former is twice as much as the latter in the NGSC. This demonstrates sufficiently that the manufacturer, as the leader of the Stackelberg game, has a first-mover advantage, and that it can obtain more profits than the retailer because it has the ability to gain more power by expanding production and by upgrading technology. This conclusion was also confirmed by the studies of Yang and Xiao [62], Luo et al. [71], and Huang et al. [72]. Unlike the NGSC, the optimal profit of the manufacturer in the GSC is less than twice of the retailer’s optimal profit, for the reason that the green manufacturer needs to bear the extra cost of the green-technology investment.
4.3. Comparisons of Centralized and Decentralized Decision Models
According to Equations (5)–(7) and Equations (14)–(18), we compared and analyzed the indicators, including the optimal green-technology level, the sales price, the wholesale price, and the profits of the manufacturers and retailers and the whole SC in the NGSC and the GSC under the centralized and decentralized decision models. The following corollary can be drawn.
Corollary 2.
For the centralized and decentralized decision models, the optimal green-technology levels and the sales prices of products in the NGSC and the GSC have the following relationships: (i); (ii),.
Corollary 2 reveals that, with the intervention of government policies in the centralized scenario, the optimal green-technology level of the GSC is higher, while the sales prices of the NGSC and the GSC are lower. This is due to the double marginalization that occurred in the decentralized scenario; that is, the manufacturers and retailers set the selling prices of products to maximize their respective revenues on the principle of more than the marginal cost of production. However, in the centralized decision model, the manufacturers and retailers in the NGSC and the GSC cooperate to eliminate the double marginalization. Moreover, the manufacturer can take advantage of the retailer’s marketing ability to increase its market share, enhance the greenness of the product, and lay a foundation to gain advantages in the market competition. Meanwhile, the retailer can make use of the manufacturer’s brand effect to expand its business, increase its sources of income, and improve its competitiveness. For consumers, the reduction in the sales price will bring more benefits to consumers, in keeping with Chen et al. [73]. Hence, the vertical cooperation of the SCs is beneficial to improving consumer welfare and the sustainability of products.
In conjunction with Corollary 2, we can study further to obtain Corollary 3.
Corollary 3.
For the centralized and decentralized decision models, the profits of the NGSC and the GSC satisfy the following relations:
- (i)
- When, , otherwise;
- (ii)
- When, , otherwise.
Corollary 3 implies that, when the government subsidy and tax rates, as well as the consumer-green-preference coefficient, meet a certain constraint, there will be a situation in which the overall profits of the SC under the cooperative mode (the centralized decision model) is less than that under the independent mode (the decentralized decision model). However, according to the research of Dong, Shen, Chow, Yang and Ng [63], Xu et al. [74], Giri and Bardhan [75], and Zhou et al. [76], there will be more revenue for the SC in the centralized scenario than in the decentralized scenario, with no coordination mechanisms in the case of no government interventions and no consumer green preferences. Double marginalization, as well, can be the best explanation for that. The government interventions (e.g., the provision of subsidies and the levying of taxes) will change the pricing strategy and will have a certain effect on the double marginalization, which gives rise to Corollary 3. Therefore, the government interventions have an impact on the profits and the optimal decisions of the SCs, for the reason that they will change the original market equilibrium.
4.4. Comparisons of the NGSC and the GSC
By comparing the optimal sales prices, the wholesale prices, and the profits of the manufacturers and retailers in the NGSC and the GSC under the centralized and decentralized decision models, the following corollaries can be drawn.
Corollary 4.
For the centralized decision model, the optimal sales prices and the profits of the NGSC and the GSC have the following relationships:
- (i)
- When,, otherwise;
- (ii)
- When,, otherwise.
Corollary 5.
For the decentralized decision model, the optimal sales prices, the wholesale prices, and the profits in the NGSC and the GSC have the following relationships:
- (i)
- When,, otherwise;
- (ii)
- When,, otherwise;
- (iii)
- When,, otherwise;
- (iv)
- When,, otherwise;
- (v)
- When,, otherwise.
Corollary 4 and Corollary 5 imply that the magnitude relationship between the sales prices, the wholesale prices, and the profits of the manufacturers and retailers between the NGSC and the GSC, under the influence of government interventions and consumer green preferences in the centralized and decentralized scenarios, is uncertain. That is to say, only when the subsidy and the tax rate and the consumer-green-preference coefficient are within the specific threshold will the sales prices of green products be lower and will the profits of the members in the GSC be higher. Consequently, the green products will be more popular and will have an increasing market share, which indicates the stronger competitiveness of the GSC.
From Corollary 4 and Corollary 5, we can find an upper limit for and : namely, there is an upper limit on the combination of the subsidy rate (), the tax rate (), and the consumer-green-preference coefficient (), which can be further explained as follows:
- Consumer green preferences. In the actual market, the consumer environmental awareness is poor at the beginning, and thus consumers show less interest in green products, and they are more likely to purchase nongreen products on the basis of their consumption habits, which leads to an increase in the market demand for nongreen products. As a result, the sales prices of nongreen products go up (i.e., their marginal revenues increase), and then the entire profit of the NGSC grows. Nevertheless, the sales quantities of green products are relatively small. In order to improve their market competitiveness, the green manufacturer has to sell green products at a lower price than nongreen products. Meanwhile, the GSC needs to bear the investment costs of the green technology as well. All of these factors will result in less profit for the entire GSC. As the consumer awareness of environmental protection rises, consumer preferences for green products will increase, and, thus, the market demand for green products will accelerate. However, nongreen products have to be sold at lower prices to seize the market. Accordingly, there comes a reduction in the marginal revenues of nongreen products, and shrinkage in the profits of the entire NGSC;
- Government interventions. Under the condition that the subsidy rates for green products are high, there will be some subsidies that will be transferred to consumers eventually (i.e., the sales prices of green products will fall), whereas the sales prices of nongreen products will still be kept unaltered because of the lack of subsidies. Thus, there will be a situation in which the sales prices of the NGSC are lower than those of the GSC. In the case that the government imposes higher tax rates on nongreen products, the nongreen manufacturer will have to raise the sales prices to maintain profitability so as to compensate for the losses that are caused by the taxation, which means that the tax will finally be transferred to the consumers, while the sales prices of the green products will not be increased because of the absence of additional tax costs. Hence, they are lower than the sales prices of nongreen products. This is in accordance with the famous Porter hypothesis, which states that appropriate environmental regulations can stimulate firms to carry out green-technology innovation so as to build a competitive advantage in the market [77]. To conclude, the government subsidies and taxes on products pertain to forms of environmental regulations, and they can encourage green manufacturers to implement eco-innovation actively in order to enhance the market competitiveness of green products.
In a word, the improvement in the consumer environmental awareness, the subsidy rates of green products, and the tax rates of nongreen products can boost more competitiveness for the GSC than the NGSC in the market.
5. Sensitivity Analysis
For the purpose of verifying the validity of the derived theorems and corollaries in Section 4, we chose to make a numerical simulation in this subsection. In combination with the research of Xu, Chen and Bai [74] and Madani and Rasti-Barzoki [7], the values of the parameters are as follows: = 20, = 30, = 500, = 0.8, = 0.3, = 0.4, = 0.5, = 25, = 2, and = 10. In this section, the sensitivity analysis of a single parameter and the robust sensitivity analysis of multiparameter are conducted on the basis of the above values of the parameters. The former refers to a situation in which only one parameter varies, and the other parameters are kept constant, which leads to the question: How will the optimal decisions of the NGSC and the GSC respond? The latter refers to the variations in the competitions between the NGSC and the GSC when multiple parameters change simultaneously.
5.1. Sensitivity Analysis of a Single Parameter
This subsection focuses on the sensitivity analysis of the variation trends in the optimal green-technology levels, the sale prices, and the profits of the NGSC and the GSC as only one of the parameters (, , , ) varies.
5.1.1. Consumer-Green-Preference Coefficient
In the centralized and decentralized decision models, the optimal green-technology levels, the sales prices, and the wholesale prices of green products are all positively correlated to the consumer-green-preference coefficient (), while those of nongreen products present the opposite trend (Figure 3 and Figure 4). As consumers are increasingly favored with green products (i.e., the rises), the green-technology level becomes high, and the market demand, cumulatively, becomes large. To enhance the competitiveness of nongreen products in the market, the manufacturers and retailers in the NGSC have to cut down the sales prices and wholesale prices so that the unit net profits ( decline. Nevertheless, the green manufacturer has to make more investments because the increases. The enlarged production costs drive the extension of the wholesale price, and the sales price will also increase so as to make a profit; thus, the unit net profit of the GSC ( is elevated. With a comparison of the sales prices in the four cases, Corollary 2 and Corollary 4 can be verified.
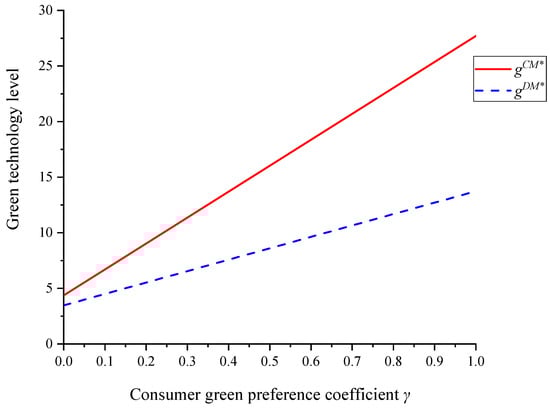
Figure 3.
The effects of the on the green-technology levels of the NGSC and the GSC in two scenarios.
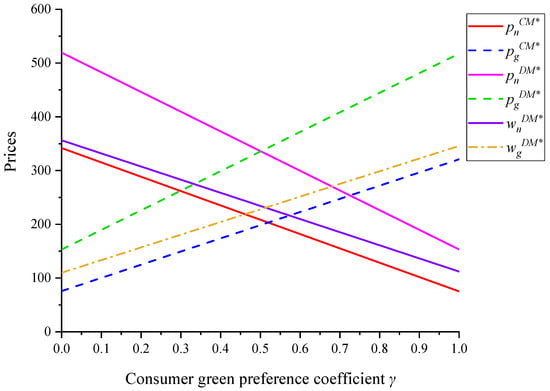
Figure 4.
The effects of the on the prices of the NGSC and the GSC in two scenarios.
As is shown in Figure 5, it is obvious that the trends for the profits in the NGSC and the GSC are consistent with those for the sales prices (see Figure 4), which indicates that the increased interest of consumers in green products will increase the profits of all of the stakeholders in the GSC, and vice versa. This is compatible with the competition rules in the real market. The more popular the product is, the higher the market share of the product will be, the more the revenue will be, and, subsequently, other alternative products will gradually withdraw from the market. Therefore, at , the profits of the manufacturer, the retailer, and the whole in the NGSC are close to zero, while, at , the contrary situation occurs. Figure 5 also validates Corollary 1 and Corollary 3.
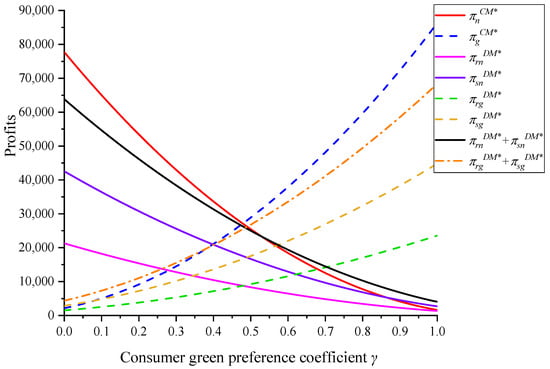
Figure 5.
The effects of the on the profits of the NGSC and the GSC in two scenarios.
5.1.2. Government Subsidy Rate for Green Products
As the subsidy rate () increases in the two scenarios, the optimal green-technology level () rises, while the sales and wholesale prices of the NGSC and the GSC all decrease; however, the GSC is more sensitive (Figure 6 and Figure 7), whereas the net profit () does not vary significantly. This phenomenon reveals that the more mightily the government supports green products, the higher the level of green technology that the manufacturer will invest in, and the more sustainable are the products. For the subsidies, one part is used to cover the increased expense that is caused by the rising of the , and the other is transferred to the green retailer ( falls), and finally to the consumers who pay for the green products ( and fall). This is similar to the study of Yang and Xiao [62]. This elucidates that the government subsidies for green products can not only improve the greenness of products and increase the enthusiasm of manufacturers to make environmentally friendly products, but it can also bring more benefits to consumers. This situation is compatible with the actual commodity market. To support the development of a certain industry or product, the powerful regulator—the government—has to provide financial subsidies to inspire enterprises to progress in this direction. For instance, the Chinese government promoted the project “Energy-Saving Products for the Benefits of the People” in 2009 to proceed with the work of energy conservation and consumption reduction, and it implemented financial subsidies for energy-efficient air conditioners. By the end of the policy, in 2011, a total of 10 billion KWH in energy savings were achieved, and the market share of energy-efficient air conditioners had extended from 5% to over 70%. Furthermore, the price of the air conditioner from RMB 3000–4000 before the promotion falls to about RMB 2000 (Ministry of Finance: the “Energy-Saving Products Huimin Project” has achieved remarkable results: http://www.gov.cn/gzdt/2013-07/12/content_2445751.htm, (accessed on 1 December 2021). Figure 5 and Figure 6 also validate Corollary 2 and Corollary 4.
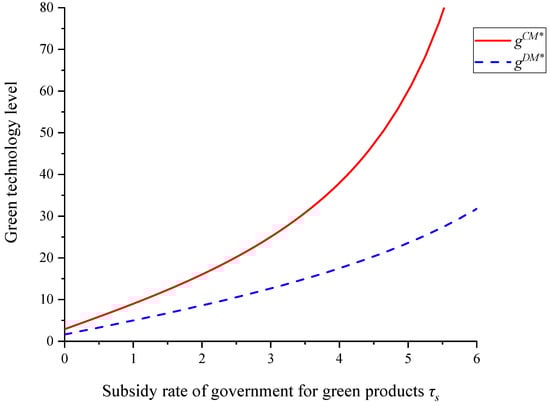
Figure 6.
The effects of the on the green-technology levels of the NGSC and the GSC in two scenarios.
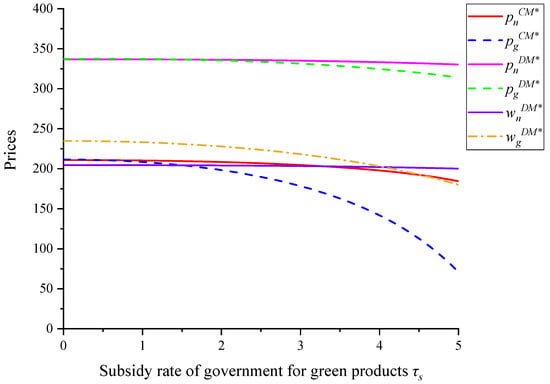
Figure 7.
The effects of the on the prices of the NGSC and the GSC in two scenarios.
The profits of the NGSC and the GSC are equal when there are no subsidies for green products given by the government (i.e., ) (see Figure 8). With the increase in the subsidy rate (), the profits of the manufacturer, the retailer, and the entire GSC grow significantly, while the NGSC is insensitive, and especially in the decentralized scenario. This case demonstrates that strengthening the government support for green products will enhance the profits of each stakeholder in the GSC, and that it will prompt the further production of green products. However, the strong competitiveness of green products, and the reduction in the profits of the NGSC, will cause a progressive decline in the production and consumption of nongreen products so that they will leave the market in the end, which is in line with the findings of Hafezalkotob, Alavi and Makui [45]. Figure 8 further verifies Corollary 1 and Corollary 3.
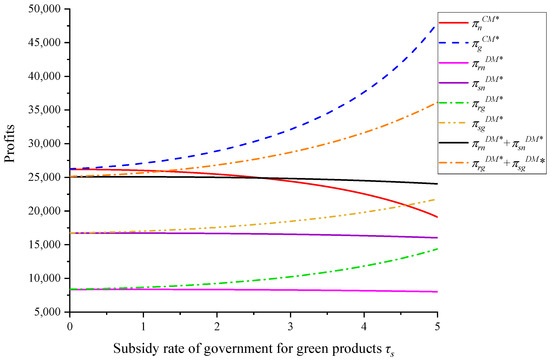
Figure 8.
The effects of the on the profits of the NGSC and the GSC in two scenarios.
5.1.3. Government Tax Rate for Nongreen Products
As is shown in Figure 9 and Figure 10, with the tax rates for nongreen products () rising in the two scenarios, the optimal green-technology level () increases extremely slowly (the slope of the steeper line is 0.0086), and the wholesale prices and the sales prices of nongreen products increase significantly, whereas the unit net profit () is almost insensitive to the , and so are the wholesale prices, the sales prices, and the unit net profits of green products. We can deduce that the penalty that is reinforced by the government on nongreen manufacturers cannot improve the greenness and sustainability of products. The levies on nongreen products will cause the nongreen manufacturer to add on an additional portion of the tax cost on the basis of the original production expenses, which generates an increase in the wholesale price. For the sake of maintaining the invariability in the unit net profit, the nongreen retailer has to increase the sales price. The research results of Yang and Xiao [62] also confirm this. In reality, the government taxation on nongreen products is finally partially transferred to consumers. Hence, the government should comprehensively consider the influence on the market prices of products when they levy.

Figure 9.
The effects of the on the green-technology levels of the NGSC and the GSC in two scenarios.
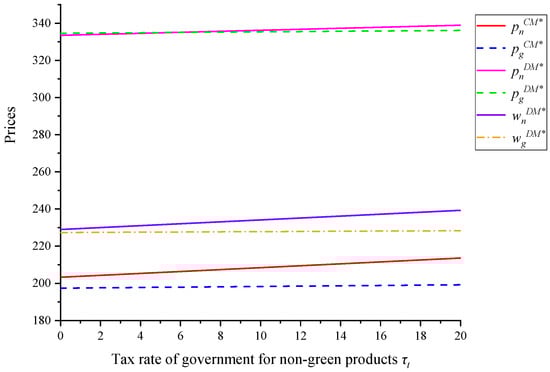
Figure 10.
The effects of the on the prices of the NGSC and the GSC in two scenarios.
In the two decision models, the profits of the manufacturer, the retailer, and the entire NGSC all decrease significantly with the enhancement of the tax rate (), while those of the GSC are almost insensitive to it (see Figure 11). Combined with Figure 10, this reveals that, since the government imposes severe punishment on nongreen products, the sales prices of nongreen products increase, which generates a decrease in the market demand and a decline in profits in turn. This is in accordance with the studies of Hafezalkotob [40] and Yang and Chen [12], and it is true in reality as well. To curb the development of certain industries or products, the government, as a powerful regulatory agency, will have to take punitive measures (e.g., taxation) to exert pressure on enterprises, and to gradually inhibit the progress of the products.
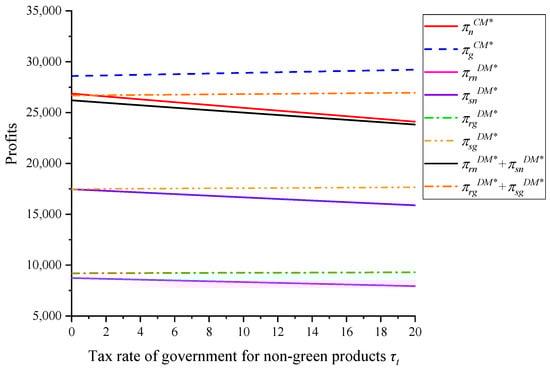
Figure 11.
The effects of the on the profits of the NGSC and the GSC in two scenarios.
5.1.4. Green-Technology-Investment-Cost Coefficient
From the expressions of the optimal green-technology levels ( and in Section 4.1 and Section 4.2), it can be seen that the is negatively correlated with the , and then we mainly discuss the influence of the on the prices, demands, and profits of the NGSC and GSC products.
It can be seen from Figure 12 that the green-technology-investment-cost coefficient () has little effect on the sales prices of the NGSC and the GSC in the decentralized scenario. When the is in a small value range, it is positively correlated with the sales prices of the NGSC and the GSC in the centralized scenario. With the gradual increase in the , its influence on the sales prices becomes weaker and weaker, and it finally reaches a state of almost no impact. The competition between the NGSC and the GSC in the centralized scenario is the competition of the entire supply chain. When the is small, the tiny changes will be reflected in the equilibrium. With the increasing at a certain level, regardless of whether it increases or not, the sales prices under the equilibrium state of the NGSC and the GSC will not be affected.
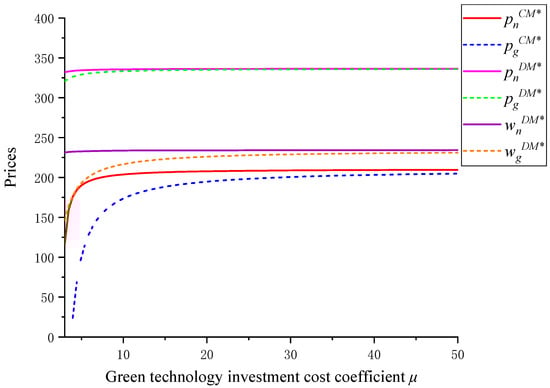
Figure 12.
The effects of the on the prices of the NGSC and the GSC in two scenarios.
As in Figure 13, the green-technology-investment-cost coefficient () has a weak impact on the profits of each player in the NGSC and the GSC under the decentralized scenario. Specifically, when the is in a small value range, the profits of the retailers and manufacturers in the GSC will increase with the decrease in the , while the participators in the NGSC, and its overall profits, are hardly affected. Obviously, the profits of the NGSC and the GSC in the decentralized scenario decrease sharply with the increase in the . The downward trend is more moderate until the increases to a certain value.
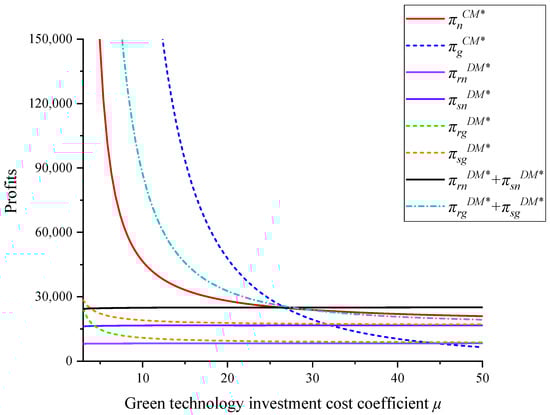
Figure 13.
The effect of the on the profits of the NGSC and the GSC in two scenarios.
We can hardly see the impact of the green-technology-investment-cost coefficient () on the demands of green and nongreen products under the decentralized scenario in Figure 14. When the is within a small value range, its influence on the demands for the NGSC and GSC products in the centralized scenario is apparent. Specifically, as the increases, the demands for nongreen products in the centralized scenario gradually increase, while the demands for green products gradually decrease; the growth speed of the former is lower than that of the latter. This shows that, when the green-investment cost is in a small range, it has a strong inhibitory effect on the sales of green products, which weakens the competitiveness and the social benefits of the GSC. When the reaches a certain value, its influence is also weak.
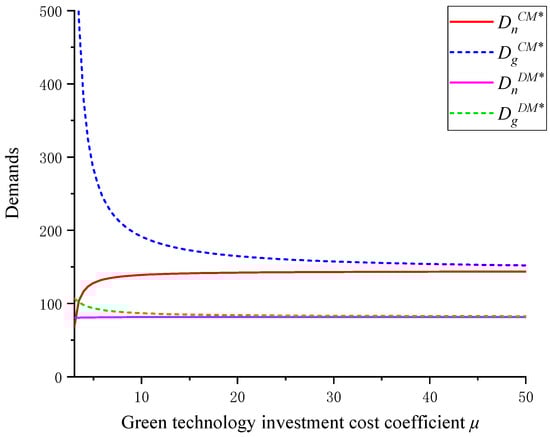
Figure 14.
The effects of the on the demands of the NGSC and the GSC in two scenarios.
On the basis of the above analysis, we can derive the following managerial insights:
- For the government that wants to intervene in the market and enhance the sustainability of products, it needs to impose taxes on nongreen products when providing subsidies for green products (i.e., the two policies should be carried out at the same time). Then, they will really work in short order under the conditions of the market economy;
- The manufacturers in the GSC need to continue to invest more in the R&D of green production for the purposes of obtaining greater competitiveness and more benefits. Moreover, they do not need to worry about the situation that their profits will be greatly reduced because of the increase in the green-technology-investment costs;
- The enterprises in the GSC need to put lots of effort into improving consumer cognition and the consumption consciousness of green products. They can achieve that through the power of the market and through some media resources, such as sustainability reporting, green advertising, and green branding [78,79].
5.2. Robust Sensitivity Analysis of Multiple Parameters
In this subsection, we primarily explore the profit variations of the manufacturers and retailers in the NGSC and the GSC when multiple parameters change synchronously. The Taguchi method is used to discuss the effects on the robustness of the optimal decisions of the NGSC and the GSC with the changes in the , , , , , and .
The Taguchi method intends to make the designed product stable in quality, low in volatility, and insensitive to the various noises in the production process [80]. Currently, it is being widely applied to the robustness of multiple parameter variations [30,81,82].
According to reality, the and the are controlled by the government, and so we set them as uncontrollable factors in this study. The other four factors (, , , ) are set as controllable factors for their controllability. In compliance with the Taguchi method, the L8 (24) orthogonal table is used to allocate the , , , and , and the L4 (22) orthogonal table is used to allocate the and . In this work, two levels were chosen: Level 1 and Level 2 (Level 1 and Level 2 represent parameter changes of −20 and +20%, respectively). Grounded in the distribution results of the orthogonal table, the profits of the manufacturers and retailers in the NGSC and the GSC are calculated, as is shown in Table 2.
Table 2.
The S/N ratios of the profits of manufacturers and retailers in the NGSC and the GSC.
On the basis of the design of the Taguchi method, the signal-to-noise (SN) ratio is the core indicator for analyzing the improvement in the targets and the evaluating schemes [82]. According to the expected output metric characteristics of experiments, there are three types of SN ratios: (i) larger is better; (ii) nominal is best; and (iii) smaller is better [83]. Seeing that this study aims to seek a combination of parameters for the profit maximization of the manufacturers and retailers in the NGSC and the GSC, we make evaluations that are grounded in the principle that larger is better. The calculation formula of the S/N ratio is:
where represents the total number of iterations of each test, and represents the profit value of the manufacturer or retailer under the repeated test ().
From Equation (23), we can obtain the S/N ratios of the profits of the manufacturers and retailers in the NGSC and the GSC that correspond to the factor levels in each group. The experimental results are shown in Table 2 and Figure 15, and the following conclusions can be drawn.
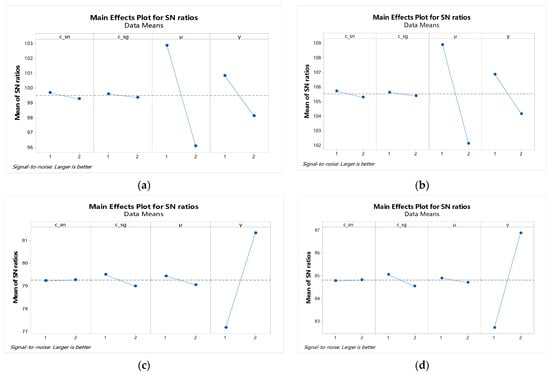
Figure 15.
Main-effects plot for S/N ratios of the profits of members in the NGSC and the GSC: (a) main-effects plot for S/N ratios of ; (b) main-effects plot for S/N ratios of ; (c) main-effects plot for S/N ratios of ; (d) main-effects plot for S/N ratios of .
- When the parameters of the ,,, and are all at Level 1, the profit that corresponds to the manufacturer and the retailer in the NGSC in the decentralized scenario is the largest;
- When the parameters of the ,,, and are at Level 2, Level 1, Level 1, and Level 2, respectively, the largest profit response to the manufacturer and the retailer in the GSC under the decentralized decision model can be obtained;
- Figure 15a,b indicates that the most favorable conditions for the manufacturer and the retailer in the NGSC are when the , , , and are all at Level 1, which helps them to gain more revenue. The and the have lower effects on their profits, while the has the greatest effect, followed by the ;
- Figure 15c,d depicts that the most advantageous conditions for the manufacturer and the retailer in the GSC are the at Level 2, the at Level 1, the at Level 1, and the at Level 2. In this state, the green manufacturer and the retailer easily obtain more revenues. For the green retailer, the has a lower influence, and the , , and have greater influences. Contrary to this, for the green manufacturer, the has a lower effect. Among the four factors, the plays the most important role in the profits of the manufacturer and the retailer in the GSC.
In a word, to gain the optimal profit, the manufacturer and retailer in the NGSC should focus on increasing the and decreasing the , and the manufacturer and the retailer in the GSC should pay attention to the enhancement of the . Moreover, we can obtain the following managerial insights:
- In the competitive market, the manufacturers and retailers in the GSC should focus on the green preferences of consumers, and they should enhance the green awareness of consumers by way of encouraging them to learn more about the advantages and environmental attributes of green products through publicity;
- The manufacturers in the GSC should cut down the investment expense of the green-technology level in order to boost competitiveness. For the manufacturers and retailers in the NGSC, the only way to have a place in the market is to reduce the production costs.
6. Conclusions
This paper chiefly studies the competition between an NGSC and a GSC under the influence of government interventions and the green preferences of consumers. Both the NGSC and the GSC are two-tier SCs that consist of one manufacturer and one retailer, and they constitute a manufacturer-led Stackelberg-game model in the vertical direction. According to the cooperation or not between the manufacturer and the retailer, there can be two scenarios: the centralized and decentralized decision models. At first, we conduct a pricing-strategy model of an NGSC and a GSC while considering the impact of government subsidies and tax policies, as well as the green preferences of consumers. By maximizing the profits of each player, the equilibrium strategies (optimal green-technology level, pricing, and profits) are achieved. Comparisons and analyses were made of the two scenarios. Subsequently, the theorems and the corollaries that were derived and that are described in the previous section are verified by numerical simulation. In addition, sensitivity analyses for single variables (i.e., the consumer-green-preference coefficient, the subsidy rate for green products, and the tax rate for nongreen products) were carried out. For the other key parameters, the Taguchi method was adopted to identify the main factors that affect the profits of the NGSC and the GSC. The main findings of this investigation are as follows:
- (i)
- The higher the government subsidy rate for green products, the more revenue the GSC obtains. The lower the tax rate for nongreen products, the more profits the NGSC obtains. When the two measures are implemented at the same time, the effect is more obvious. Therefore, it is necessary for the government to implement intervention policies for green and nongreen products simultaneously, so as to enhance the competitiveness of green products more rapidly and effectively;
- (ii)
- In the centralized and decentralized decision models, when the parameters (i.e., the subsidy rate, the tax rate, and the consumer-green-preference coefficient) meet the premeditated threshold, the sales prices and the wholesale prices of the GSC will be lower, and its members will gain more benefits (namely, the GSC will become more competitive than the NGSC);
- (iii)
- Under the influence of government interventions and the green preferences of consumers in the centralized scenario, the green-technology level is higher and the sales price is lower; that is, it is conducive to improving the greenness and the sustainability of products, and to bringing more benefits to consumers. However, there will be a situation where the overall profits of the NGSC and the GSC in the centralized scenario are less than those in the decentralized scenario; that is, the cooperation between the manufacturers and retailers does not necessarily increase the total profits of the NGSC and the GSC in this case;
- (iv)
- The consumer-green-product-preference coefficient is the most important factor for the profits of GSCs. The green-technology-investment-cost coefficient shows a significant impact on the profits of the NGSC. As a consequence, the strengthening of the consumer awareness of environmental protection and cutting down green investment costs will help to improve the sustainability of products in a rapid amount of time.
There is still some work that can be conducted in the future. First, the cooperation between the members in the NGSC and the GSC can be considered (e.g., green and nongreen manufacturers can join together to develop green technologies, or green and nongreen retailers can take joint responsibility for green and nongreen products), which can be the next step to be researched after this article. Secondly, in this study, we assume that the manufacturer and the retailer are risk neutral. In the future, the impact of the risk attitude of each member in the SC towards the decisions of the NGSC or the GSC can also be considered, which will also be an interesting topic.
Author Contributions
Conceptualization, W.C. and Q.W.; methodology, W.C.; software, F.Y.; validation, Q.L.; formal analysis, F.Y.; data curation, W.C.; writing—original draft preparation, W.C.; writing—review and editing, Q.W.; visualization, W.C.; supervision, Q.L.; funding acquisition, Q.L. All authors have read and agreed to the published version of the manuscript.
Funding
This research was funded by National Social Science Foundation of China, grant number 19CGL004.
Institutional Review Board Statement
The study was conducted in accordance with the Declaration of Helsinki, and it was approved by the Institutional Review Board of Chang’an University (protocol codes 20.1138 and 02/04/2022.)
Informed Consent Statement
Not applicable.
Data Availability Statement
Not applicable.
Conflicts of Interest
The authors declare no conflict of interest.
Abbreviations
The related parameters and notations involved in this paper. Note: “” and “” represent nongreen and green products, respectively. The superscript “CM” and “DM” in the text represent the “centralized decision model” and the “decentralized decision model”, respectively. And the superscript “CM*” and “DM*” represent the corresponding optimal values.
| Parameters | |
| Unit manufacturing cost of product (, ) | |
| Consumer demand for product (, ) | |
| Market base demand | |
| Price-elasticity parameter of demand | |
| Cross-price-elasticity parameter of demand | |
| Green-technology-level elasticity parameter of demand | |
| Consumer-green-preference coefficient | |
| Green-technology-investment-cost coefficient of the manufacturer | |
| Subsidy rate for the unit green product given by the government | |
| Tax rate for the unit nongreen product levied by the government | |
| Decision variables | |
| Unit retail price of product (, ) | |
| Unit wholesale price of product () from the manufacturer to the retailer () | |
| Green-technology level of the manufacturer | |
| Objective functions | |
| Total profit for the product () system in the centralized decision model () | |
| Total profit for the retailer () in the decentralized decision model () | |
| Total profit for the supplier () in the decentralized decision model () | |
Appendix A
Proofs for Theorem 1 and Theorem 2.
The profits of the NGSC and the GSC can be written as follows:
For and , the second derivative for and , respectively, is and , which means that and are concave functions of the sale price ( and , respectively). However, the second derivative of for is when , are concave functions of . Thus, we can obtain the optimal value of , , and when the first derivatives are , , and . That is:
By solving Equations (A3)–(A5), we can obtain:
where , , and .
By substituting Equations (A6)–(A8) into Equations (A1) and (A2), we obtain the optimal profits of the NGSC and the GSC as:
□
Proofs of Theorem 3 and Theorem 4.
The profit functions of the retailers and manufacturers of the NGSC and the GSC are:
For , the second derivative for is , which means that is concave in . When the first derivative we can obtain:
By substituting Equation (A15) into Equation (A12), we have:
From Equation (A16), the second derivative of for is , which means that is concave in . When the first derivative , we can obtain:
From Equation (A13), the second derivative of for is , which means that is concave in . When the first derivative , we can obtain:
By substituting Equation (A18) into Equation (A14), we have:
From Equation (A16), the second derivatives of for and are and , respectively, when . This means that is concave in and When the first derivatives are and , we can obtain:
By uniting Equations (A15), (A17), (A18), (A20), and (A21), we have the optimal values:
where .
By substituting Equations (A22)–(A26) into Equations (A11)–(A14), we can obtain the optimal profits:
Proof of Corollary 1.
Based on Equations (A27) and (A28), we can have
.
Based on Equations (A29) and (A30), we can have
Therefore . □
Proof of Corollary 2.
On the basis of Equations (A8) and (A26), we can have , while .
Since , we have , and then:
Therefore, (i.e.,).
On the basis of Equations (A6) and (A22), we can have , while .
Since , we have , and then:
Therefore, , and then .
By the same way, we can have . □
Proofs of Corollary 3, Corollary 4, and Corollary 5.
On the basis of Equations (A9), (A27) and (A28), we can have .
If , then . Since and , we can obtain (i.e., ), and vice versa.
By the same method, Corollary 3(ii), Corollary 4, and Corollary 5 can be testified to. □
References
- Toptal, A.; Çetinkaya, B. How supply chain coordination affects the environment: A carbon footprint perspective. Ann. Oper. Res. 2017, 250, 487–519. [Google Scholar] [CrossRef] [Green Version]
- Tong, W.; Mu, D.; Zhao, F.; Mendis, G.P.; Sutherland, J.W. The impact of cap-and-trade mechanism and consumers’ environmental preferences on a retailer-led supply Chain. Resour. Conserv. Recycl. 2019, 142, 88–100. [Google Scholar] [CrossRef]
- Liu, P.; Yi, S.P. Pricing policies of green supply chain considering targeted advertising and product green degree in the Big Data environment. J. Clean. Prod. 2017, 164, 1614–1622. [Google Scholar] [CrossRef]
- Seuring, S. A review of modeling approaches for sustainable supply chain management. Decis. Support Syst. 2013, 54, 1513–1520. [Google Scholar] [CrossRef]
- Pizer, W.A. Combining price and quantity controls to mitigate global climate change. J. Public Econ. 2002, 85, 409–434. [Google Scholar] [CrossRef]
- Hafezalkotob, A. Competition of domestic manufacturer and foreign supplier under sustainable development objectives of government. Appl. Math. Comput. 2017, 292, 294–308. [Google Scholar] [CrossRef]
- Madani, S.R.; Rasti-Barzoki, M. Sustainable supply chain management with pricing, greening and governmental tariffs determining strategies: A game-theoretic approach. Comput. Ind. Eng. 2017, 105, 287–298. [Google Scholar] [CrossRef]
- Luke, E. Firms get help in tracking EU green legislation. China Dly. 2005, 2, 2. [Google Scholar]
- Hall, J. Environmental supply chain dynamics. J. Clean. Prod. 2000, 8, 455–471. [Google Scholar] [CrossRef]
- Pujari, D. Eco-innovation and new product development: Understanding the influences on market performance. Technovation 2006, 26, 76–85. [Google Scholar] [CrossRef]
- Jabali, O.; Van Woensel, T.; De Kok, A.G. Analysis of Travel Times and CO2 Emissions in Time-Dependent Vehicle Routing. Prod. Oper. Manag. 2012, 21, 1060–1074. [Google Scholar] [CrossRef]
- Yang, H.; Chen, W. Retailer-driven carbon emission abatement with consumer environmental awareness and carbon tax: Revenue-sharing versus Cost-sharing. Omega 2018, 78, 179–191. [Google Scholar] [CrossRef]
- Bull, J. Loads of green washing—can behavioural economics increase willingness-to-pay for efficient washing machines in the UK? Energy Policy 2012, 50, 242–252. [Google Scholar] [CrossRef]
- Grimmer, M.; Bingham, T. Company environmental performance and consumer purchase intentions. J. Bus. Res. 2013, 66, 1945–1953. [Google Scholar] [CrossRef]
- Amacher, G.S.; Koskela, E.; Ollikainen, M. Environmental quality competition and eco-labeling. J. Environ. Econ. Manag. 2004, 47, 284–306. [Google Scholar] [CrossRef] [Green Version]
- Ibanez, L.; Grolleau, G. Can Ecolabeling Schemes Preserve the Environment? Environ. Resour. Econ. 2008, 40, 233–249. [Google Scholar] [CrossRef]
- Zhao, L.; Chen, Y. Optimal Subsidies for Green Products: A Maximal Policy Benefit Perspective. Symmetry 2019, 11, 63. [Google Scholar] [CrossRef] [Green Version]
- Lou, G.; Lai, Z.; Ma, H.; Fan, T. Coordination in a composite green-product supply chain under different power structures. Ind. Manag. Data Syst. 2020, 120, 1101–1123. [Google Scholar] [CrossRef]
- de Oliveira, U.R.; Espindola, L.S.; da Silva, I.R.; da Silva, I.N.; Rocha, H.M. A systematic literature review on green supply chain management: Research implications and future perspectives. J. Clean. Prod. 2018, 187, 537–561. [Google Scholar] [CrossRef]
- Hafezalkotob, A. Competition, cooperation, and coopetition of green supply chains under regulations on energy saving levels. Transp. Res. Part E: Logist. Transp. Rev. 2017, 97, 228–250. [Google Scholar] [CrossRef]
- Xiao, T.; Yang, D. Price and service competition of supply chains with risk-averse retailers under demand uncertainty. Int. J. Prod. Econ. 2008, 114, 187–200. [Google Scholar] [CrossRef]
- Meng, Q.; Li, M.; Liu, W.; Li, Z.; Zhang, J. Pricing policies of dual-channel green supply chain: Considering government subsidies and consumers’ dual preferences. Sustain. Prod. Consum. 2021, 26, 1021–1030. [Google Scholar] [CrossRef]
- Gao, J.; Xiao, Z.; Wei, H.; Zhou, G. Dual-channel green supply chain management with eco-label policy: A perspective of two types of green products. Comput. Ind. Eng. 2020, 146, 106613. [Google Scholar] [CrossRef]
- Stucki, T.; Woerter, M.; Arvanitis, S.; Peneder, M.; Rammer, C. How different policy instruments affect green product innovation: A differentiated perspective. Energy Policy 2018, 114, 245–261. [Google Scholar] [CrossRef]
- Xu, X.P.; Li, Y.; Luo, M.M.; Peng, Q. Recent progress towards fluorinated copolymers for efficient photovoltaic applications. Chin. Chem. Lett. 2016, 27, 1241–1249. [Google Scholar] [CrossRef]
- Feng, Y.; Xia, X.; Yin, X.; Wang, L.; Zhang, Z. Pricing and Coordination of Remanufacturing Supply Chain with Government Participation considering Consumers’ Preferences and Quality of Recycled Products. Complexity 2022, 2022, 8378639. [Google Scholar] [CrossRef]
- Mohammaditabar, D.; Ghodsypour, S.H.; Hafezalkotob, A. A game theoretic analysis in capacity-constrained supplier-selection and cooperation by considering the total supply chain inventory costs. Int. J. Prod. Econ. 2016, 181, 87–97. [Google Scholar] [CrossRef]
- Li, W.; Chen, J. Backward integration strategy in a retailer Stackelberg supply chain. Omega 2018, 75, 118–130. [Google Scholar] [CrossRef]
- Qi, Q.; Wang, J.; Bai, Q. Pricing decision of a two-echelon supply chain with one supplier and two retailers under a carbon cap regulation. J. Clean. Prod. 2017, 151, 286–302. [Google Scholar] [CrossRef]
- Bai, Q.; Jin, M.; Xu, X. Effects of carbon emission reduction on supply chain coordination with vendor-managed deteriorating product inventory. Int. J. Prod. Econ. 2019, 208, 83–99. [Google Scholar] [CrossRef]
- Mahmoudi, R.; Rasti-Barzoki, M. Sustainable supply chains under government intervention with a real-world case study: An evolutionary game theoretic approach. Comput. Ind. Eng. 2018, 116, 130–143. [Google Scholar] [CrossRef]
- Seyedhosseini, S.M.; Hosseini-Motlagh, S.M.; Johari, M.; Jazinaninejad, M. Social price-sensitivity of demand for competitive supply chain coordination. Comput. Ind. Eng. 2019, 135, 1103–1126. [Google Scholar] [CrossRef]
- Sana, S.S. Price competition between green and non green products under corporate social responsible firm. J. Retail. Consum. Serv. 2020, 55, 102118. [Google Scholar] [CrossRef]
- Nagurney, A.; Yu, M. Sustainable fashion supply chain management under oligopolistic competition and brand differentiation. Int. J. Prod. Econ. 2012, 135, 532–540. [Google Scholar] [CrossRef]
- Zhang, L.; Wang, J.; You, J. Consumer environmental awareness and channel coordination with two substitutable products. Eur. J. Oper. Res. 2015, 241, 63–73. [Google Scholar] [CrossRef]
- Li, X.; Li, Y. Chain-to-chain competition on product sustainability. J. Clean. Prod. 2016, 112, 2058–2065. [Google Scholar] [CrossRef]
- Yang, L.; Zhang, Q.; Ji, J. Pricing and carbon emission reduction decisions in supply chains with vertical and horizontal cooperation. Int. J. Prod. Econ. 2017, 191, 286–297. [Google Scholar] [CrossRef]
- Saha, S.; Nielsen, I. Strategic Integration Decision under Supply Chain Competition in the Presence of Online Channel. Symmetry 2020, 13, 58. [Google Scholar] [CrossRef]
- Hafezalkotob, A.; Hadi, T. Impact of government’s policies on competition of two closed-loop and regular supply chains. J. Ind. Syst. Eng. 2015, 8, 87–105. [Google Scholar]
- Hafezalkotob, A. Competition of two green and regular supply chains under environmental protection and revenue seeking policies of government. Comput. Ind. Eng. 2015, 82, 103–114. [Google Scholar] [CrossRef]
- Hadi, T.; Sheikhmohammady, M.; Chaharsooghi, S.K.; Hafezalkotob, A. Competition between regular and closed-loop supply chains under financial intervention of government; a game theory approach. J. Ind. Syst. Eng. 2021, 13, 179–199. [Google Scholar]
- Yazdanpanah, A.H.; Akbari, A.A.; Mozafari, M. A Game Theoretical Approach to Optimize Policies of Government Under the Cartel of Two Green and Non-Green Supply Chains. J. Optim. Ind. Eng. 2020, 12, 189–197. [Google Scholar]
- Nielsen, I.; Majumder, S.; Szwarc, E.; Saha, S. Impact of Strategic Cooperation under Competition on Green Product Manufacturing. Sustainability 2020, 12, 10248. [Google Scholar] [CrossRef]
- Hafezalkotob, A. Direct and indirect intervention schemas of government in the competition between green and non-green supply chains. J. Clean. Prod. 2018, 170, 753–772. [Google Scholar] [CrossRef]
- Hafezalkotob, A.; Alavi, A.; Makui, A. Government financial intervention in green and regular supply chains: Multi-level game theory approach. Int. J. Manag. Sci. Eng. Manag. 2016, 11, 167–177. [Google Scholar] [CrossRef]
- Hepburn, C. Regulation by Prices, Quantities, or Both: A Review of Instrument Choice. Oxf. Rev. Econ. Policy 2006, 22, 226–247. [Google Scholar] [CrossRef]
- Xu, X.; He, P.; Xu, H.; Zhang, Q. Supply chain coordination with green technology under cap-and-trade regulation. Int. J. Prod. Econ. 2017, 183, 433–442. [Google Scholar] [CrossRef]
- Wang, Q.; Zhao, D.; He, L. Contracting emission reduction for supply chains considering market low-carbon preference. J. Clean. Prod. 2016, 120, 72–84. [Google Scholar] [CrossRef]
- Sabzevar, N.; Enns, S.T.; Bergerson, J.; Kettunen, J. Modeling competitive firms’ performance under price-sensitive demand and cap-and-trade emissions constraints. Int. J. Prod. Econ. 2017, 184, 193–209. [Google Scholar] [CrossRef]
- Xu, X.; Zhang, W.; He, P.; Xu, X. Production and pricing problems in make-to-order supply chain with cap-and-trade regulation. Omega 2017, 66, 248–257. [Google Scholar] [CrossRef]
- Safarzadeh, S.; Rasti-Barzoki, M. A game theoretic approach for assessing residential energy-efficiency program considering rebound, consumer behavior, and government policies. Appl. Energy 2019, 233–234, 44–61. [Google Scholar] [CrossRef]
- He, P.; He, Y.; Xu, H. Channel structure and pricing in a dual-channel closed-loop supply chain with government subsidy. Int. J. Prod. Econ. 2019, 213, 108–123. [Google Scholar] [CrossRef]
- Nielsen, I.E.; Majumder, S.; Saha, S. Game-Theoretic Analysis to Examine How Government Subsidy Policies Affect a Closed-Loop Supply Chain Decision. Appl. Sci. 2019, 10, 145. [Google Scholar] [CrossRef] [Green Version]
- Niu, B.; Chen, L.; Zhang, J. Punishing or subsidizing? Regulation analysis of sustainable fashion procurement strategies. Transp. Res. Part E: Logist. Transp. Rev. 2017, 107, 81–96. [Google Scholar] [CrossRef]
- Li, J.; Liu, P. Modeling green supply chain games with governmental interventions and risk preferences under fuzzy uncertainties. Math. Comput. Simul. 2022, 192, 182–200. [Google Scholar] [CrossRef]
- Bask, A.; Halme, M.; Kallio, M.; Kuula, M. Consumer preferences for sustainability and their impact on supply chain management. Int. J. Phys. Distrib. Logist. Manag. 2013, 43, 380–406. [Google Scholar] [CrossRef]
- Kim, B.; Park, K.; Swink, M. Consumers’ preferences for facets of green supply chain management. Int. J. Serv. Oper. Manag. 2014, 18, 74–98. [Google Scholar] [CrossRef]
- Yu, Y.; Han, X.; Hu, G. Optimal production for manufacturers considering consumer environmental awareness and green subsidies. Int. J. Prod. Econ. 2016, 182, 397–408. [Google Scholar] [CrossRef] [Green Version]
- Sun, L.; Cao, X.; Alharthi, M.; Zhang, J.; Taghizadeh-Hesary, F.; Mohsin, M. Carbon emission transfer strategies in supply chain with lag time of emission reduction technologies and low-carbon preference of consumers. J. Clean. Prod. 2020, 264, 121664. [Google Scholar] [CrossRef]
- Ghosh, S.K.; Seikh, M.R.; Chakrabortty, M. Analyzing a stochastic dual-channel supply chain under consumers’ low carbon preferences and cap-and-trade regulation. Comput. Ind. Eng. 2020, 149, 106765. [Google Scholar] [CrossRef]
- Zhang, G.; Dai, G.; Sun, H.; Zhang, G.; Yang, Z. Equilibrium in supply chain network with competition and service level between channels considering consumers’ channel preferences. J. Retail. Consum. Serv. 2020, 57, 102199. [Google Scholar] [CrossRef]
- Yang, D.; Xiao, T. Pricing and green level decisions of a green supply chain with governmental interventions under fuzzy uncertainties. J. Clean. Prod. 2017, 149, 1174–1187. [Google Scholar] [CrossRef]
- Dong, C.; Shen, B.; Chow, P.S.; Yang, L.; Ng, C.T. Sustainability investment under cap-and-trade regulation. Ann. Oper. Res. 2016, 240, 509–531. [Google Scholar] [CrossRef]
- Wang, X.J.; Choi, S.H. Impacts of carbon emission reduction mechanisms on uncertain make-to-order manufacturing. Int. J. Prod. Res. 2016, 54, 3311–3328. [Google Scholar] [CrossRef]
- Ghosh, D.; Shah, J. Supply chain analysis under green sensitive consumer demand and cost sharing contract. Int. J. Prod. Econ. 2015, 164, 319–329. [Google Scholar] [CrossRef]
- Chen, X.; Hao, G. Sustainable pricing and production policies for two competing firms with carbon emissions tax. Int. J. Prod. Res. 2015, 53, 6408–6420. [Google Scholar] [CrossRef]
- Li, J.; Wang, S.; Cheng, T.E. Competition and cooperation in a single-retailer two-supplier supply chain with supply disruption. Int. J. Prod. Econ. 2010, 124, 137–150. [Google Scholar] [CrossRef]
- Swami, S.; Shah, J. Channel coordination in green supply chain management. J. Oper. Res. Soc. 2013, 64, 336–351. [Google Scholar] [CrossRef]
- Ghosh, D.; Shah, J. A comparative analysis of greening policies across supply chain structures. Int. J. Prod. Econ. 2012, 135, 568–583. [Google Scholar] [CrossRef]
- Chan, H.L.; Shen, B.; Cai, Y. Quick response strategy with cleaner technology in a supply chain: Coordination and win-win situation analysis. Int. J. Prod. Res. 2018, 56, 3397–3408. [Google Scholar] [CrossRef] [Green Version]
- Luo, Z.; Chen, X.; Chen, J.; Wang, X. Optimal pricing policies for differentiated brands under different supply chain power structures. Eur. J. Oper. Res. 2017, 259, 437–451. [Google Scholar] [CrossRef] [Green Version]
- Huang, H.; Ke, H.; Wang, L. Equilibrium analysis of pricing competition and cooperation in supply chain with one common manufacturer and duopoly retailers. Int. J. Prod. Econ. 2016, 178, 12–21. [Google Scholar] [CrossRef]
- Chen, L.; Peng, J.; Liu, Z.; Zhao, R. Pricing and effort decisions for a supply chain with uncertain information. Int. J. Prod. Res. 2017, 55, 264–284. [Google Scholar] [CrossRef]
- Xu, J.; Chen, Y.; Bai, Q. A two-echelon sustainable supply chain coordination under cap-and-trade regulation. J. Clean. Prod. 2016, 135, 42–56. [Google Scholar] [CrossRef]
- Giri, B.C.; Bardhan, S. Sub-supply chain coordination in a three-layer chain under demand uncertainty and random yield in production. Int. J. Prod. Econ. 2017, 191, 66–73. [Google Scholar] [CrossRef]
- Zhou, Y.W.; Li, J.; Zhong, Y. Cooperative advertising and ordering policies in a two-echelon supply chain with risk-averse agents. Omega 2018, 75, 97–117. [Google Scholar] [CrossRef]
- Porter, M.E. Towards a dynamic theory of strategy. Strateg. Manag. J. 1991, 12, 95–117. [Google Scholar] [CrossRef]
- De Giovanni, P. Environmental collaboration in a closed-loop supply chain with a reverse revenue sharing contract. Ann. Oper. Res. 2014, 220, 135–157. [Google Scholar] [CrossRef]
- Yusof, J.M.; Musa, R.; Rahman, S.A. The Effects of Green Image of Retailers on Shopping Value and Store Loyalty. Procedia Soc. Behav. Sci. 2012, 50, 710–721. [Google Scholar] [CrossRef] [Green Version]
- Taguchi, G. System of Experimental Design: Engineering Methods to Optimize Quality and Minimize Costs; UNIPUB/Kraus International Publications: Millwood, NY, USA, 1987. [Google Scholar]
- Tsui, K.-L. An overview of Taguchi method and newly developed statistical methods for robust design. IIE Trans. 1992, 24, 44–57. [Google Scholar] [CrossRef]
- Pundir, R.; Chary, G.H.; Dastidar, M.G. Application of Taguchi method for optimizing the process parameters for the removal of copper and nickel by growing Aspergillus sp. Water Resour. Ind. 2018, 20, 83–92. [Google Scholar] [CrossRef] [Green Version]
- Atil, H.; Unver, Y. A different approach of experimental design: Taguchi method. Pak. J. Biol. Sci. 2000, 3, 1538–1540. [Google Scholar]
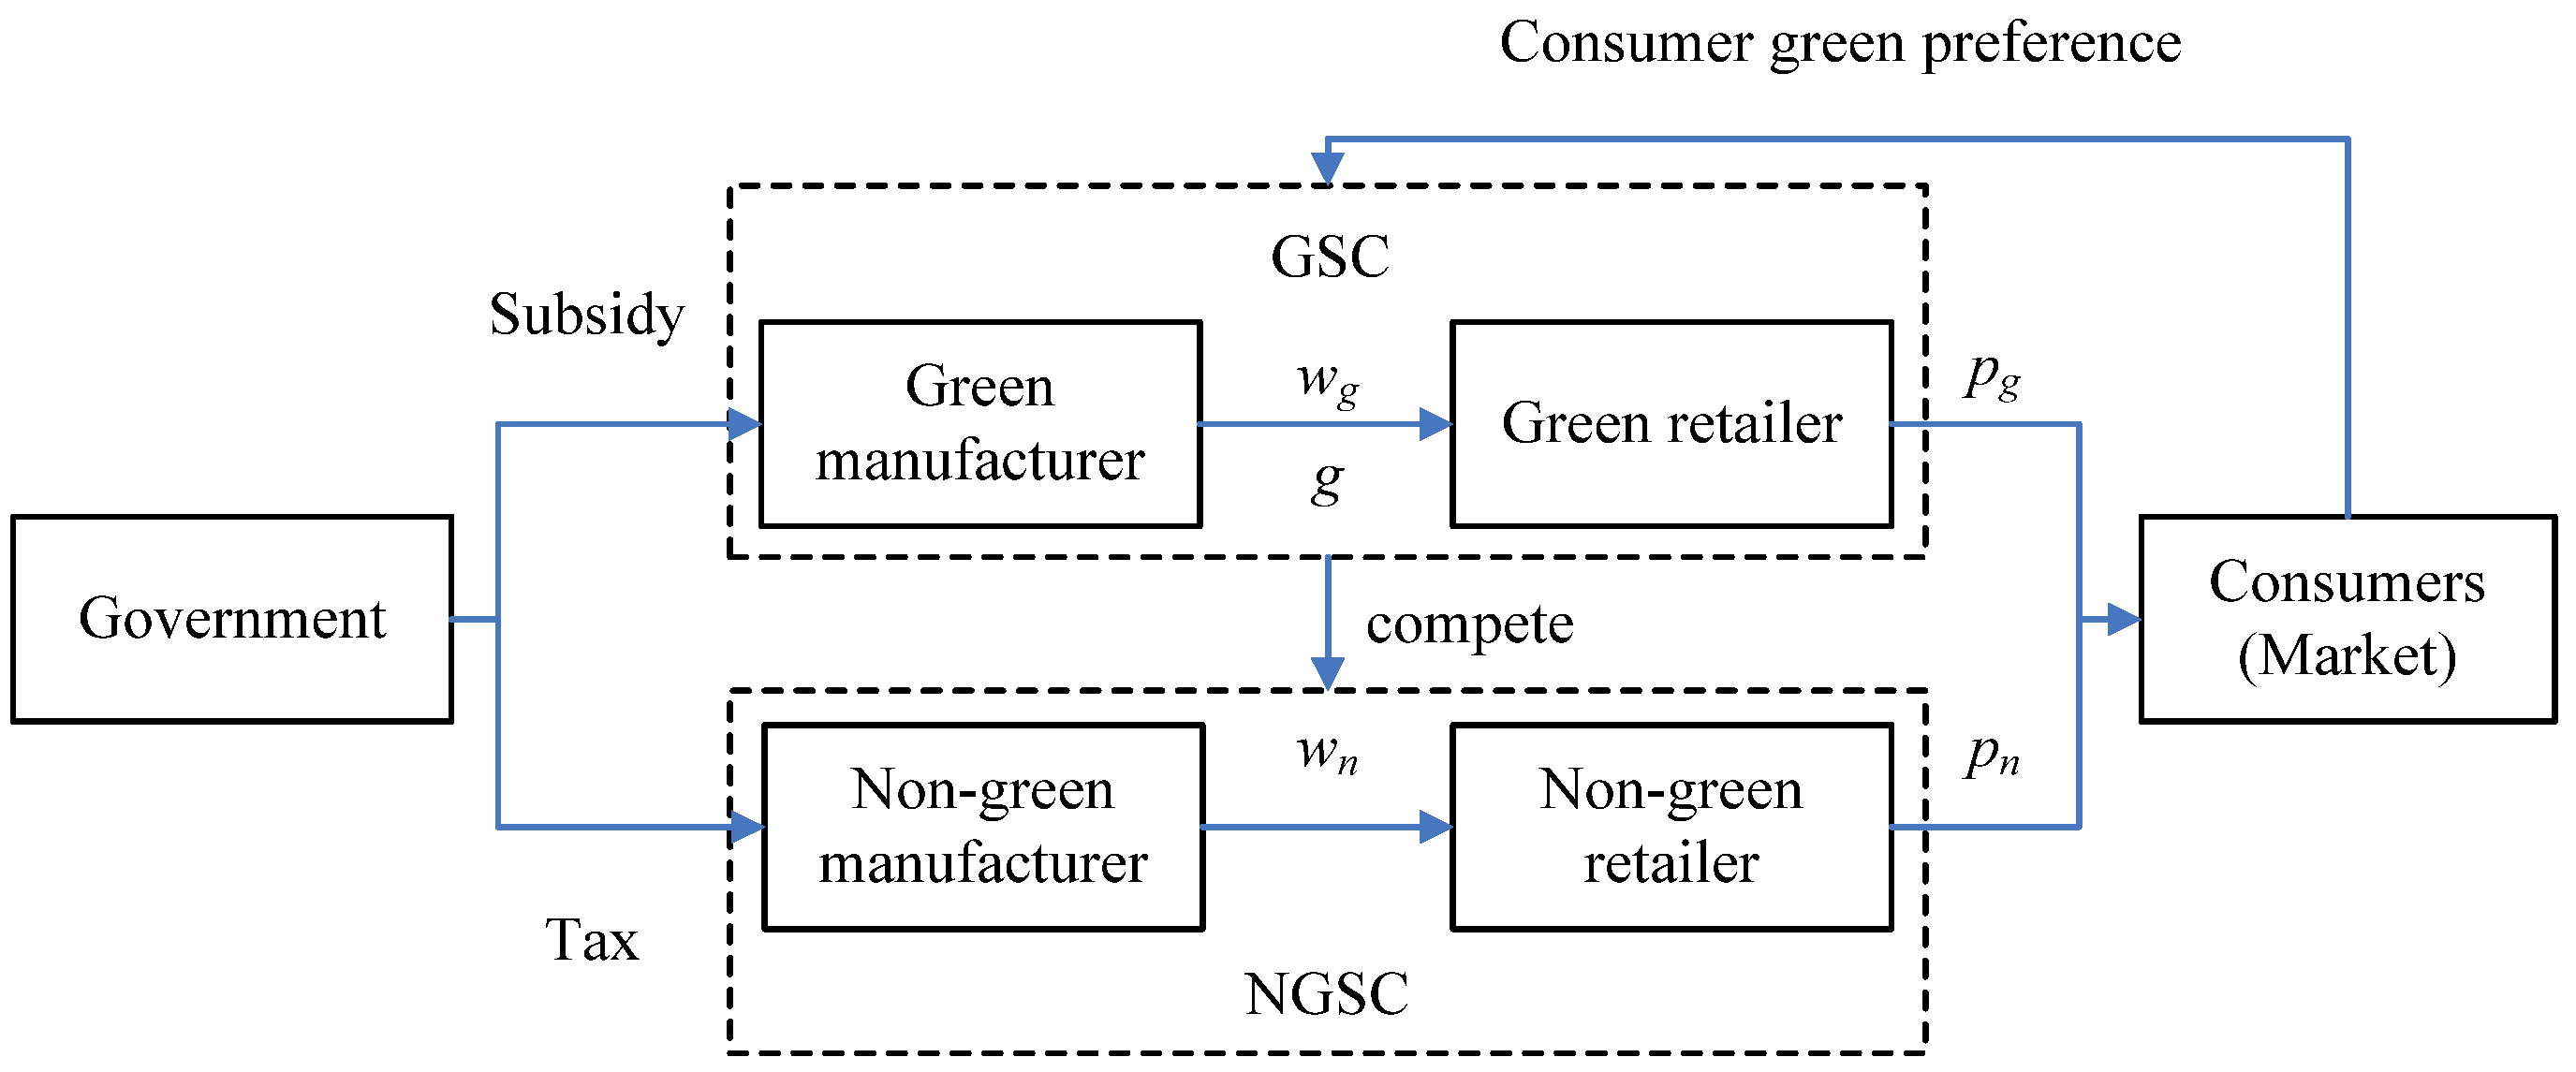
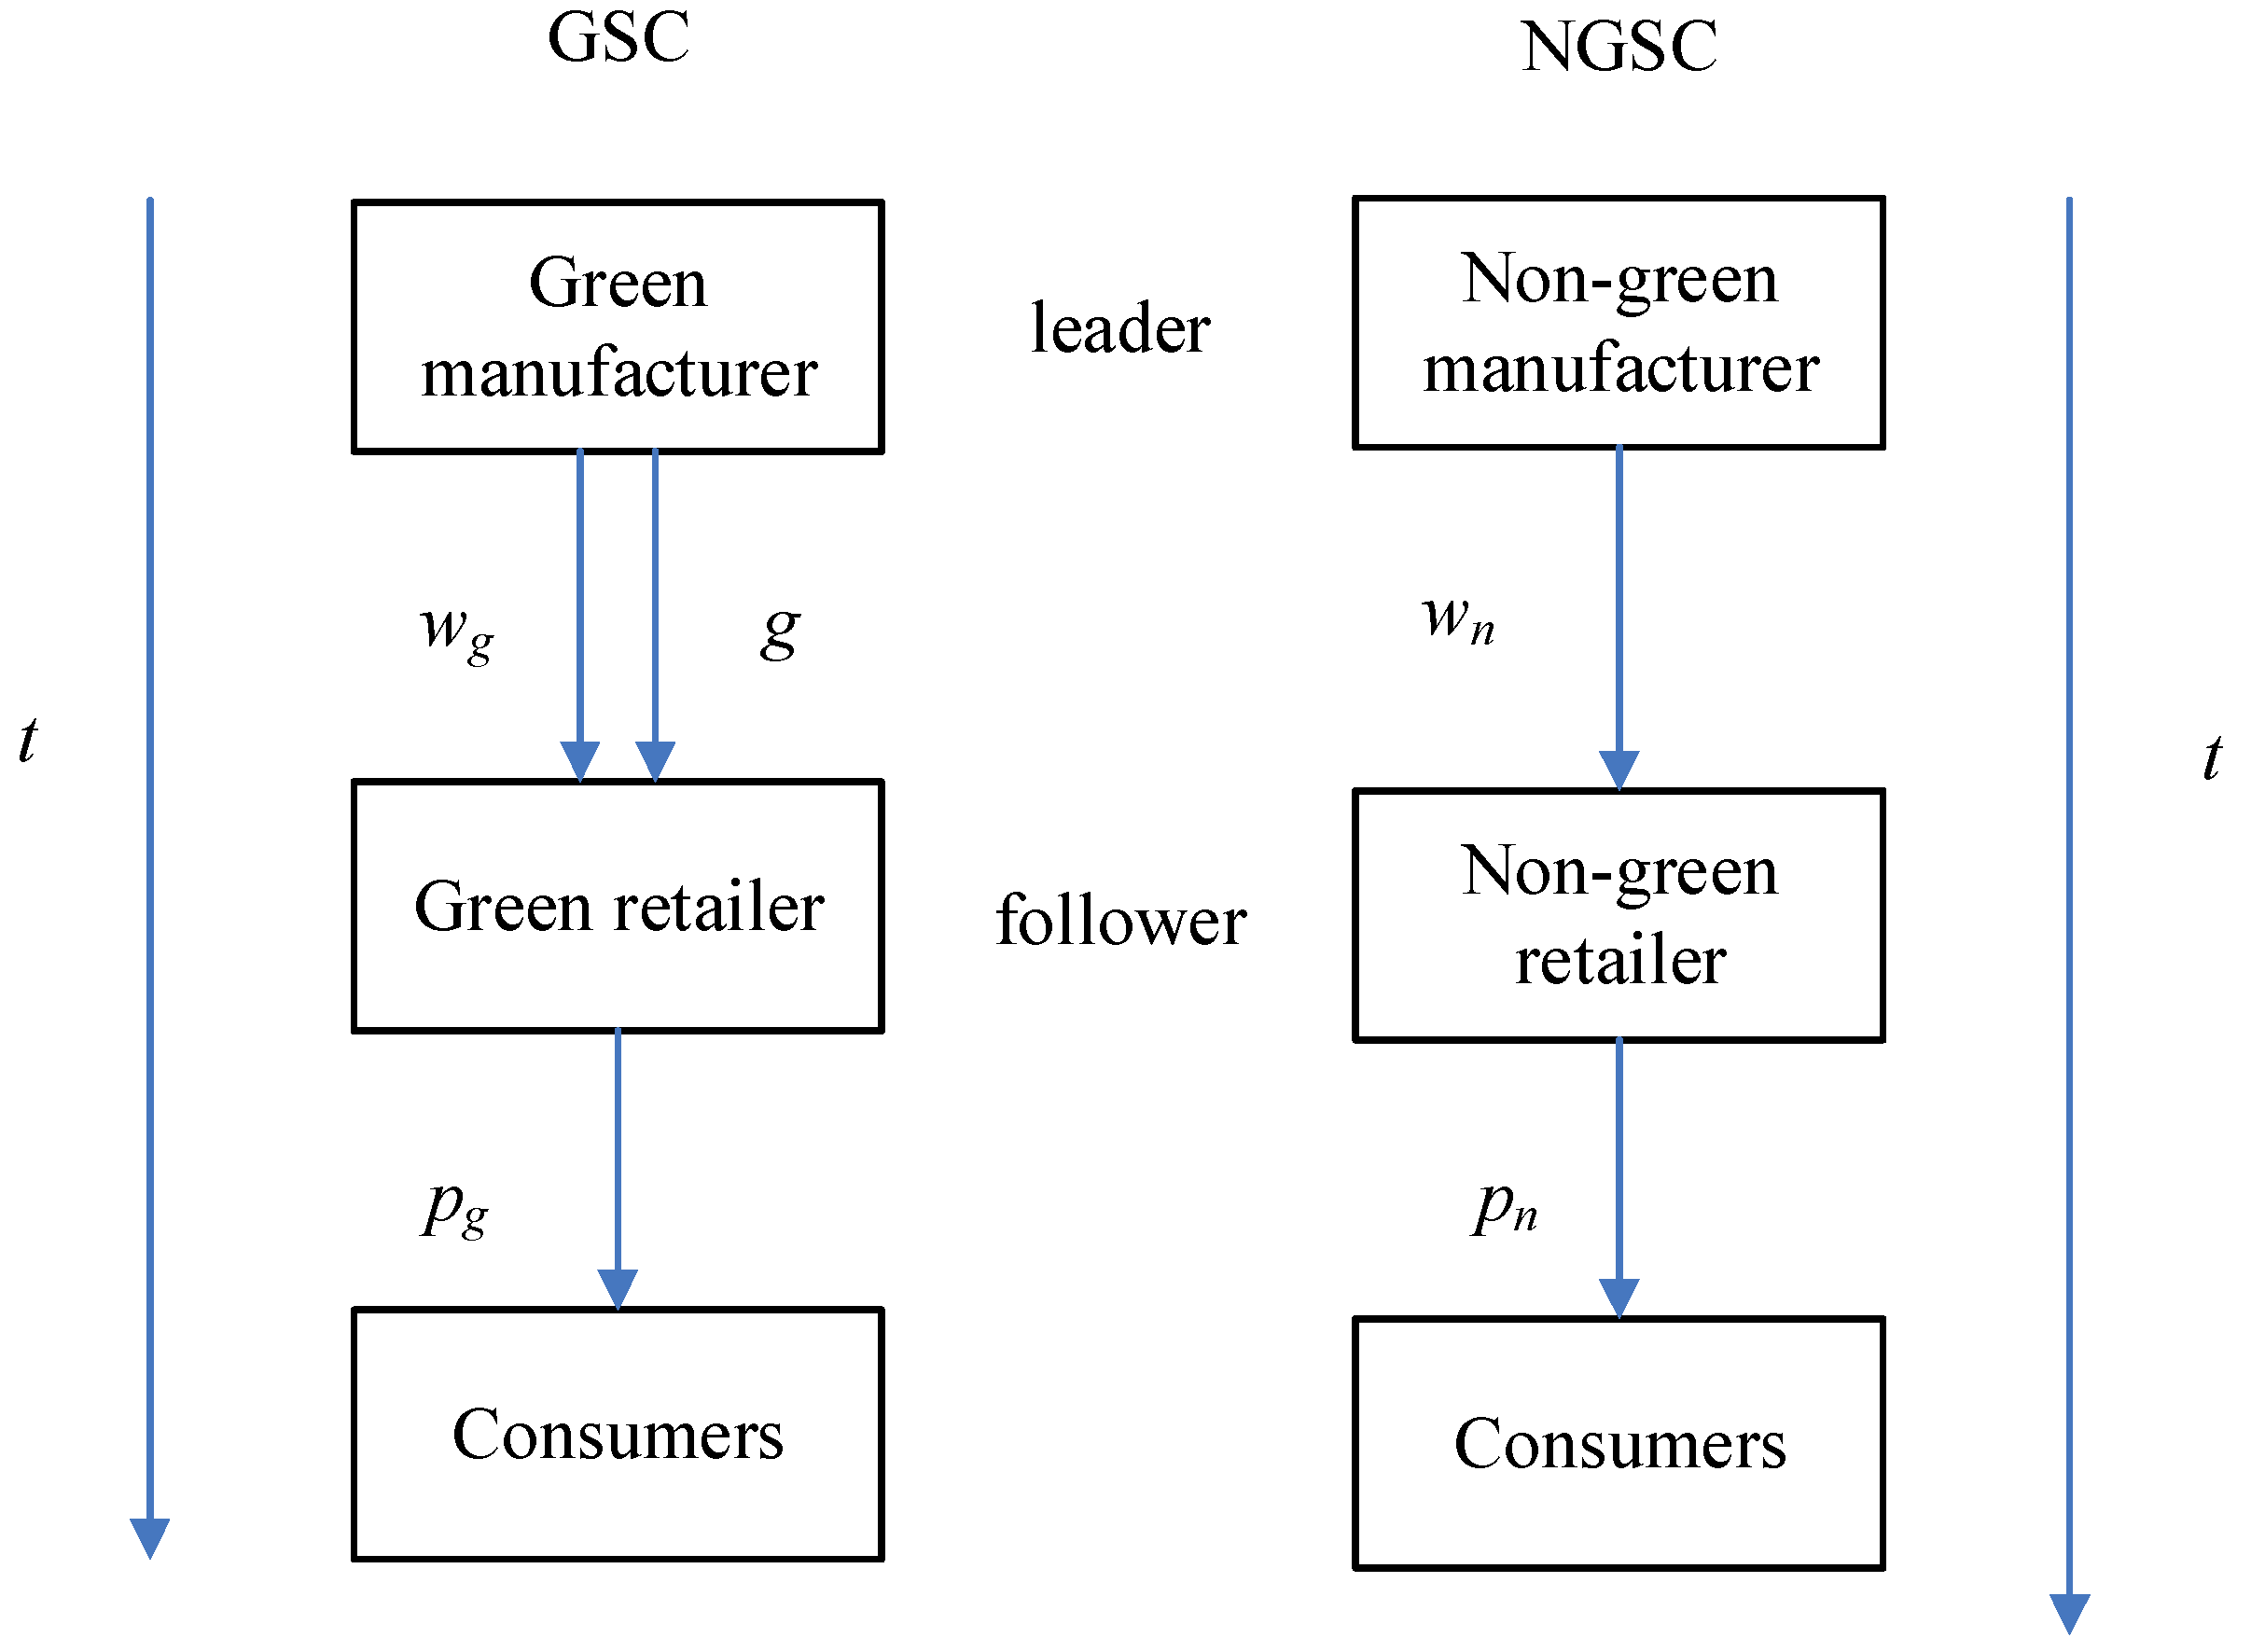
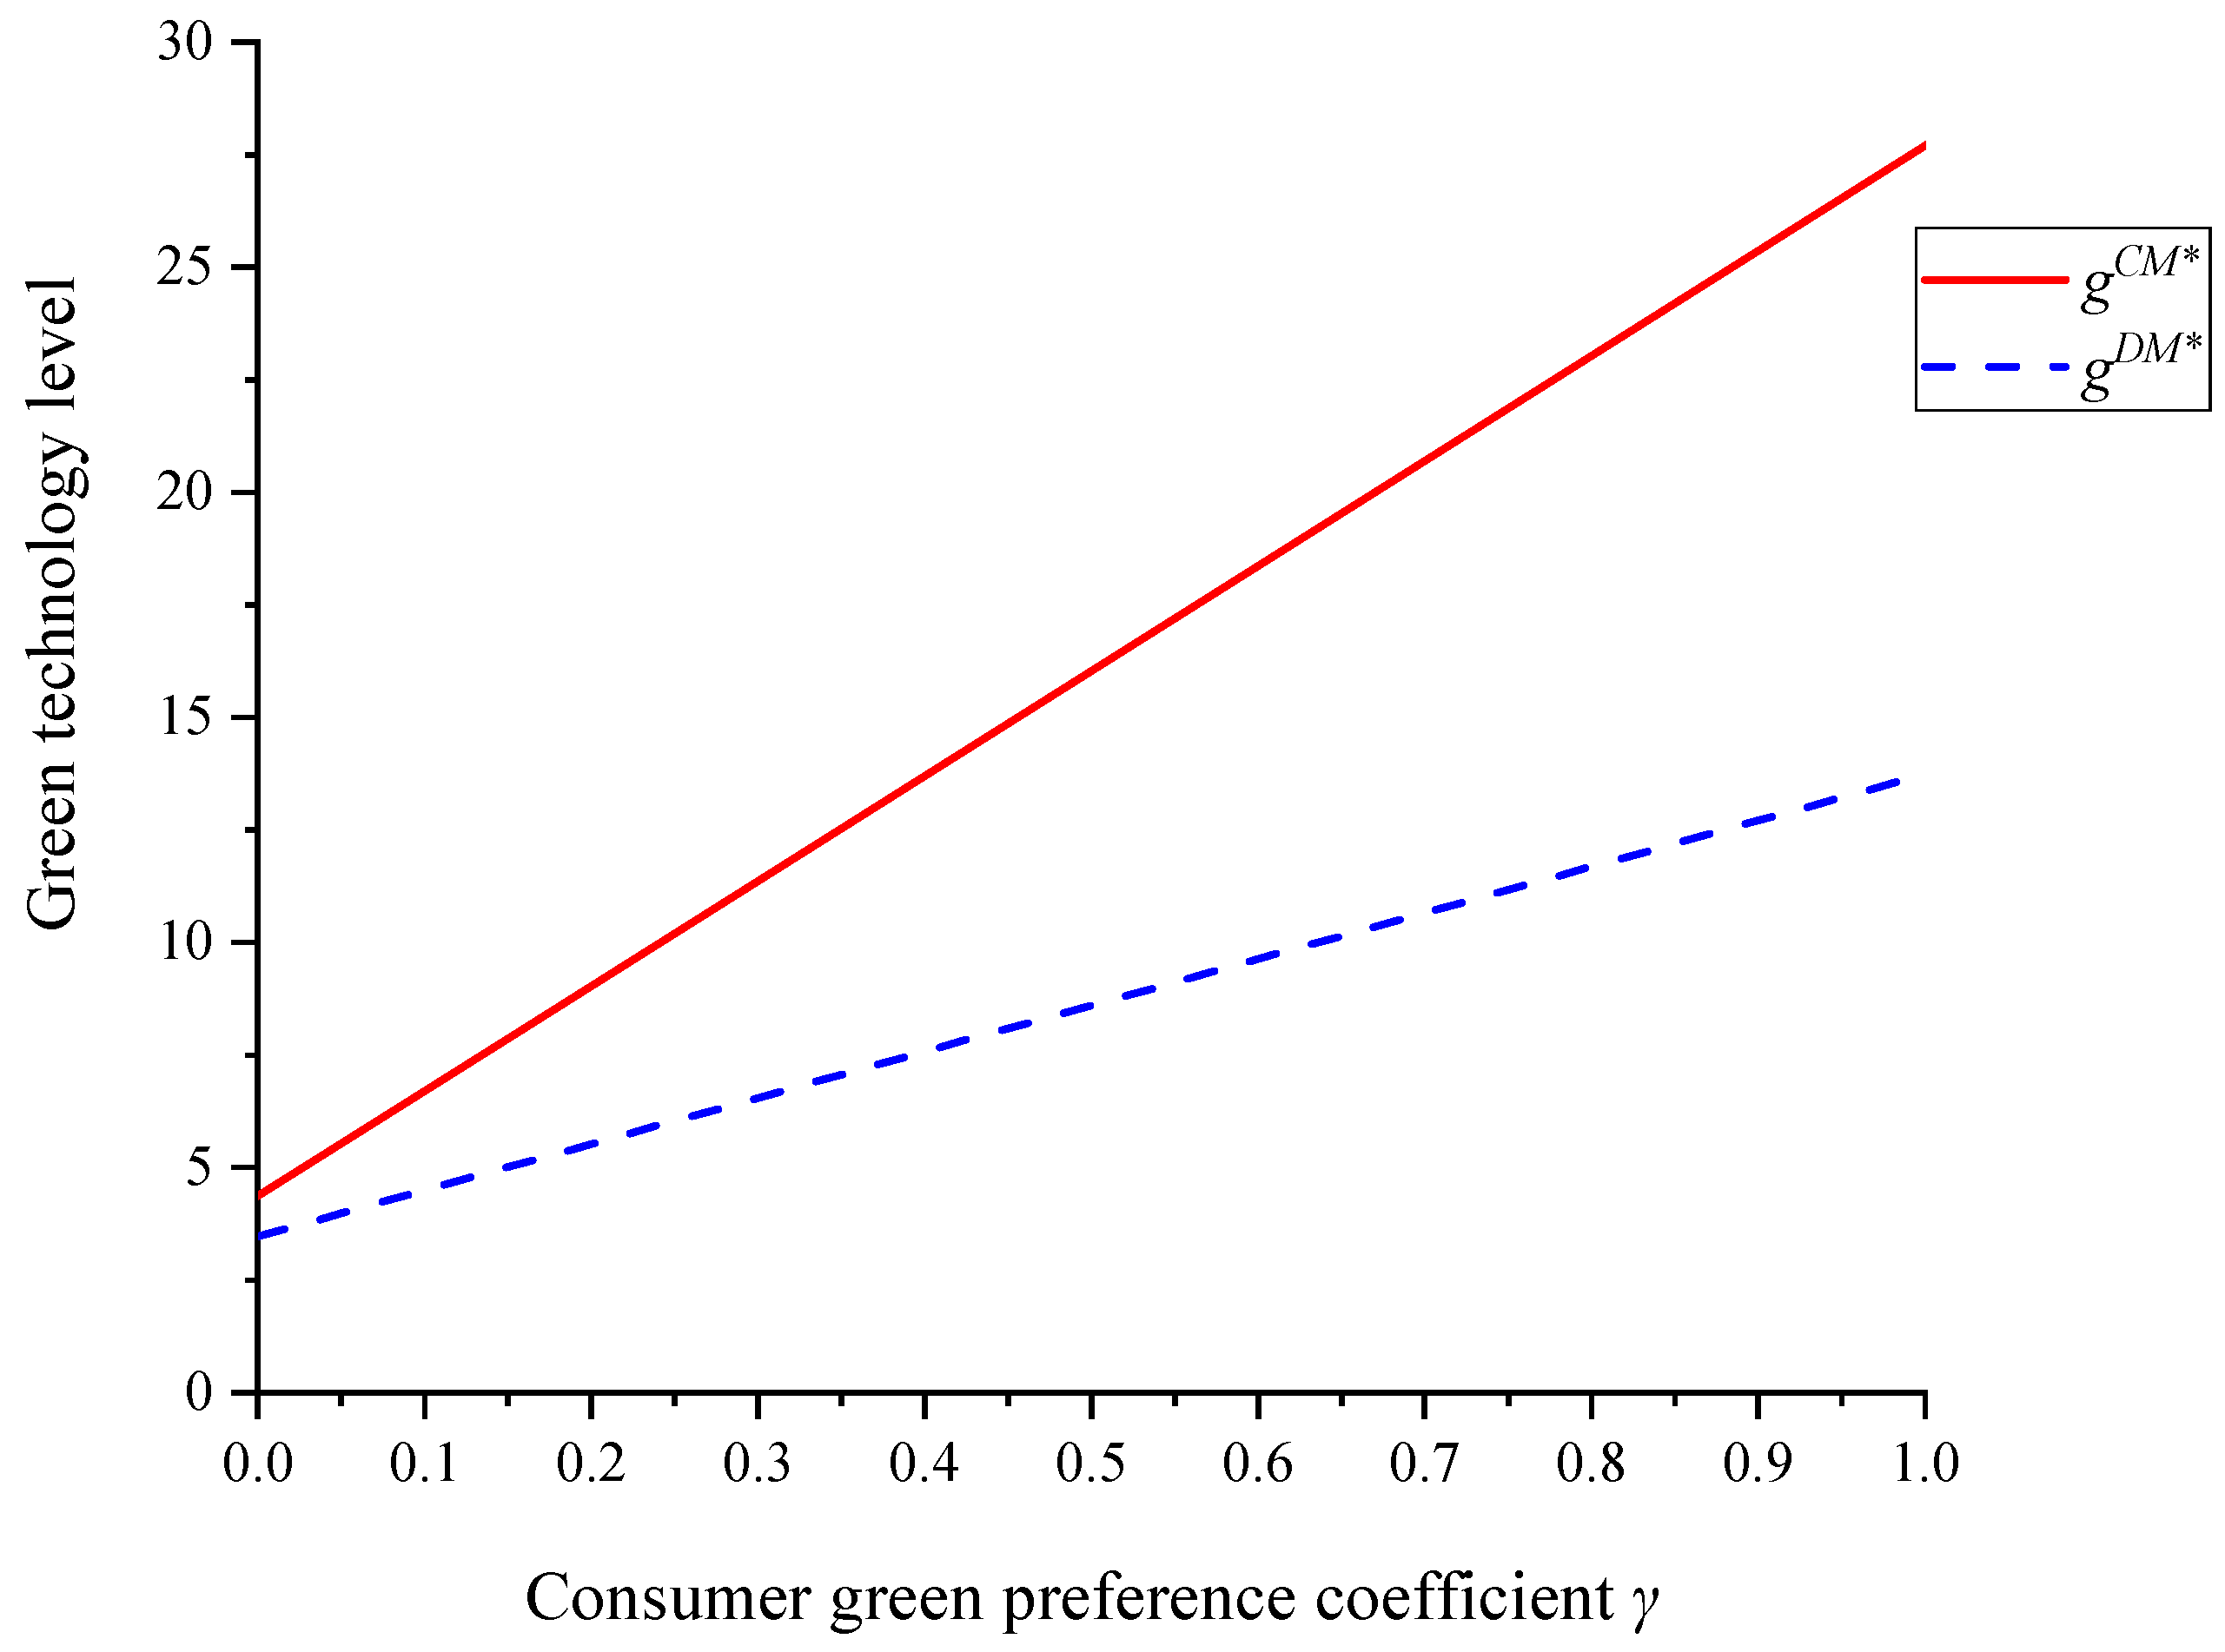
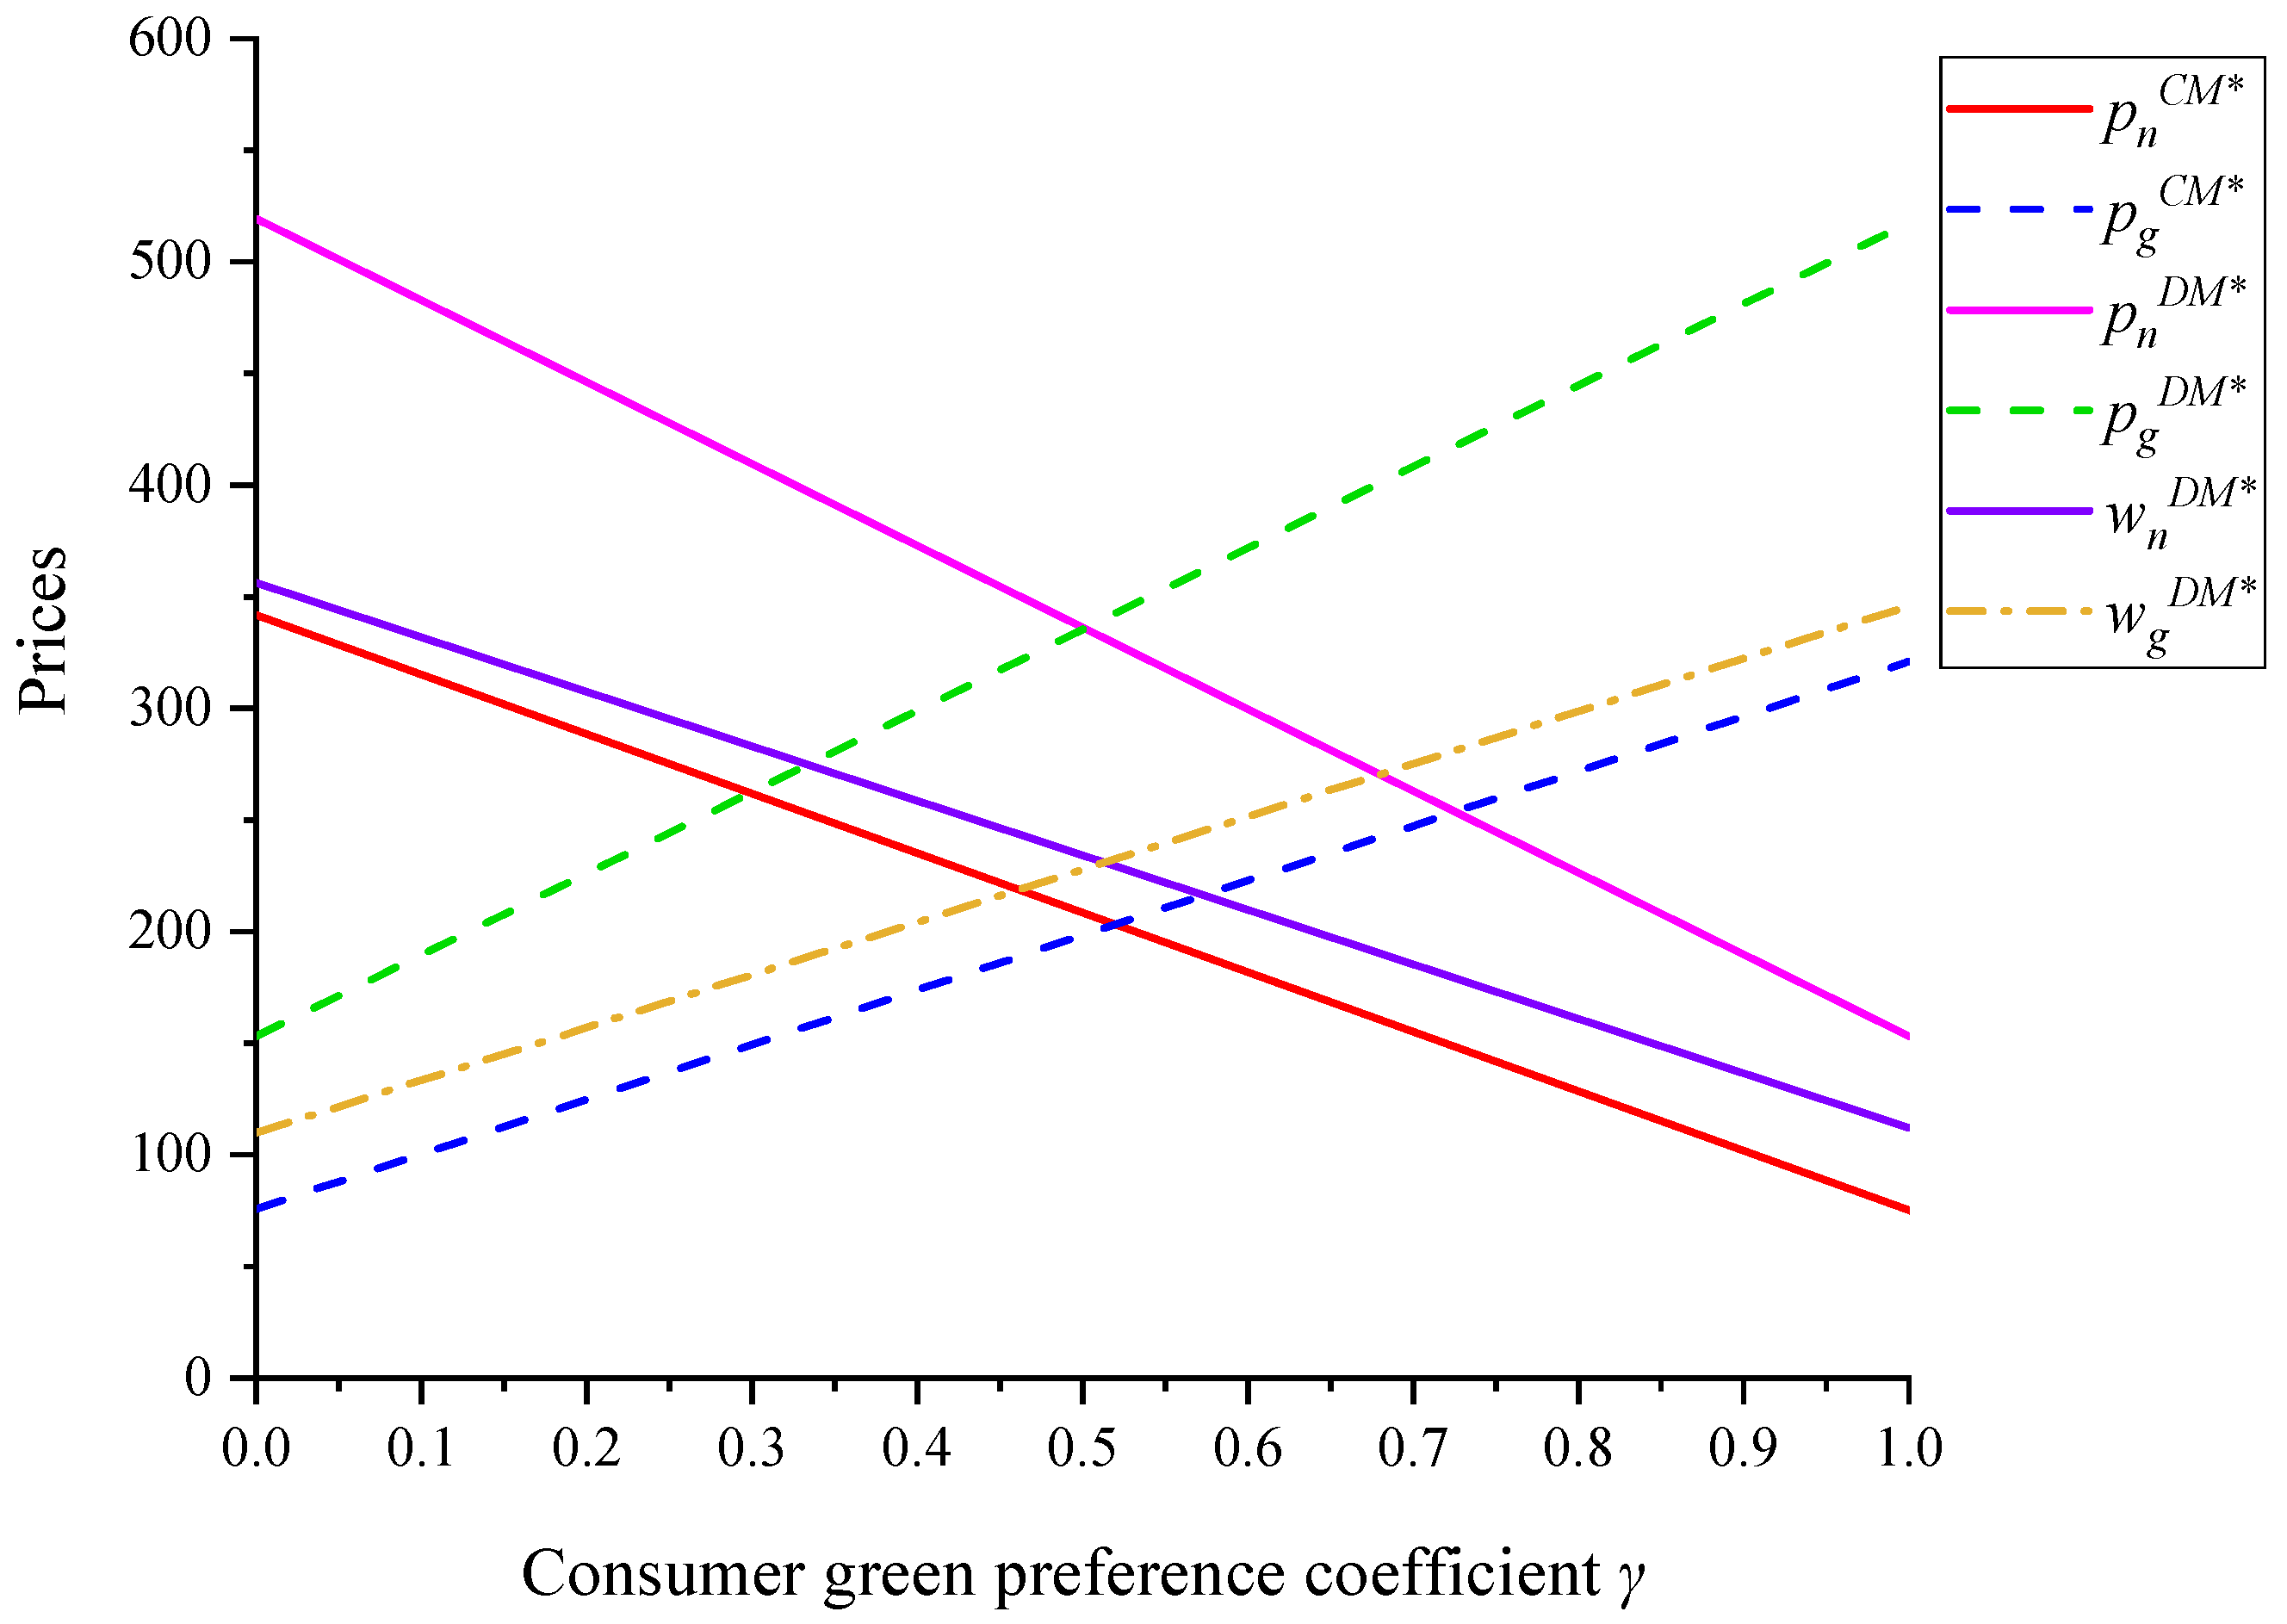
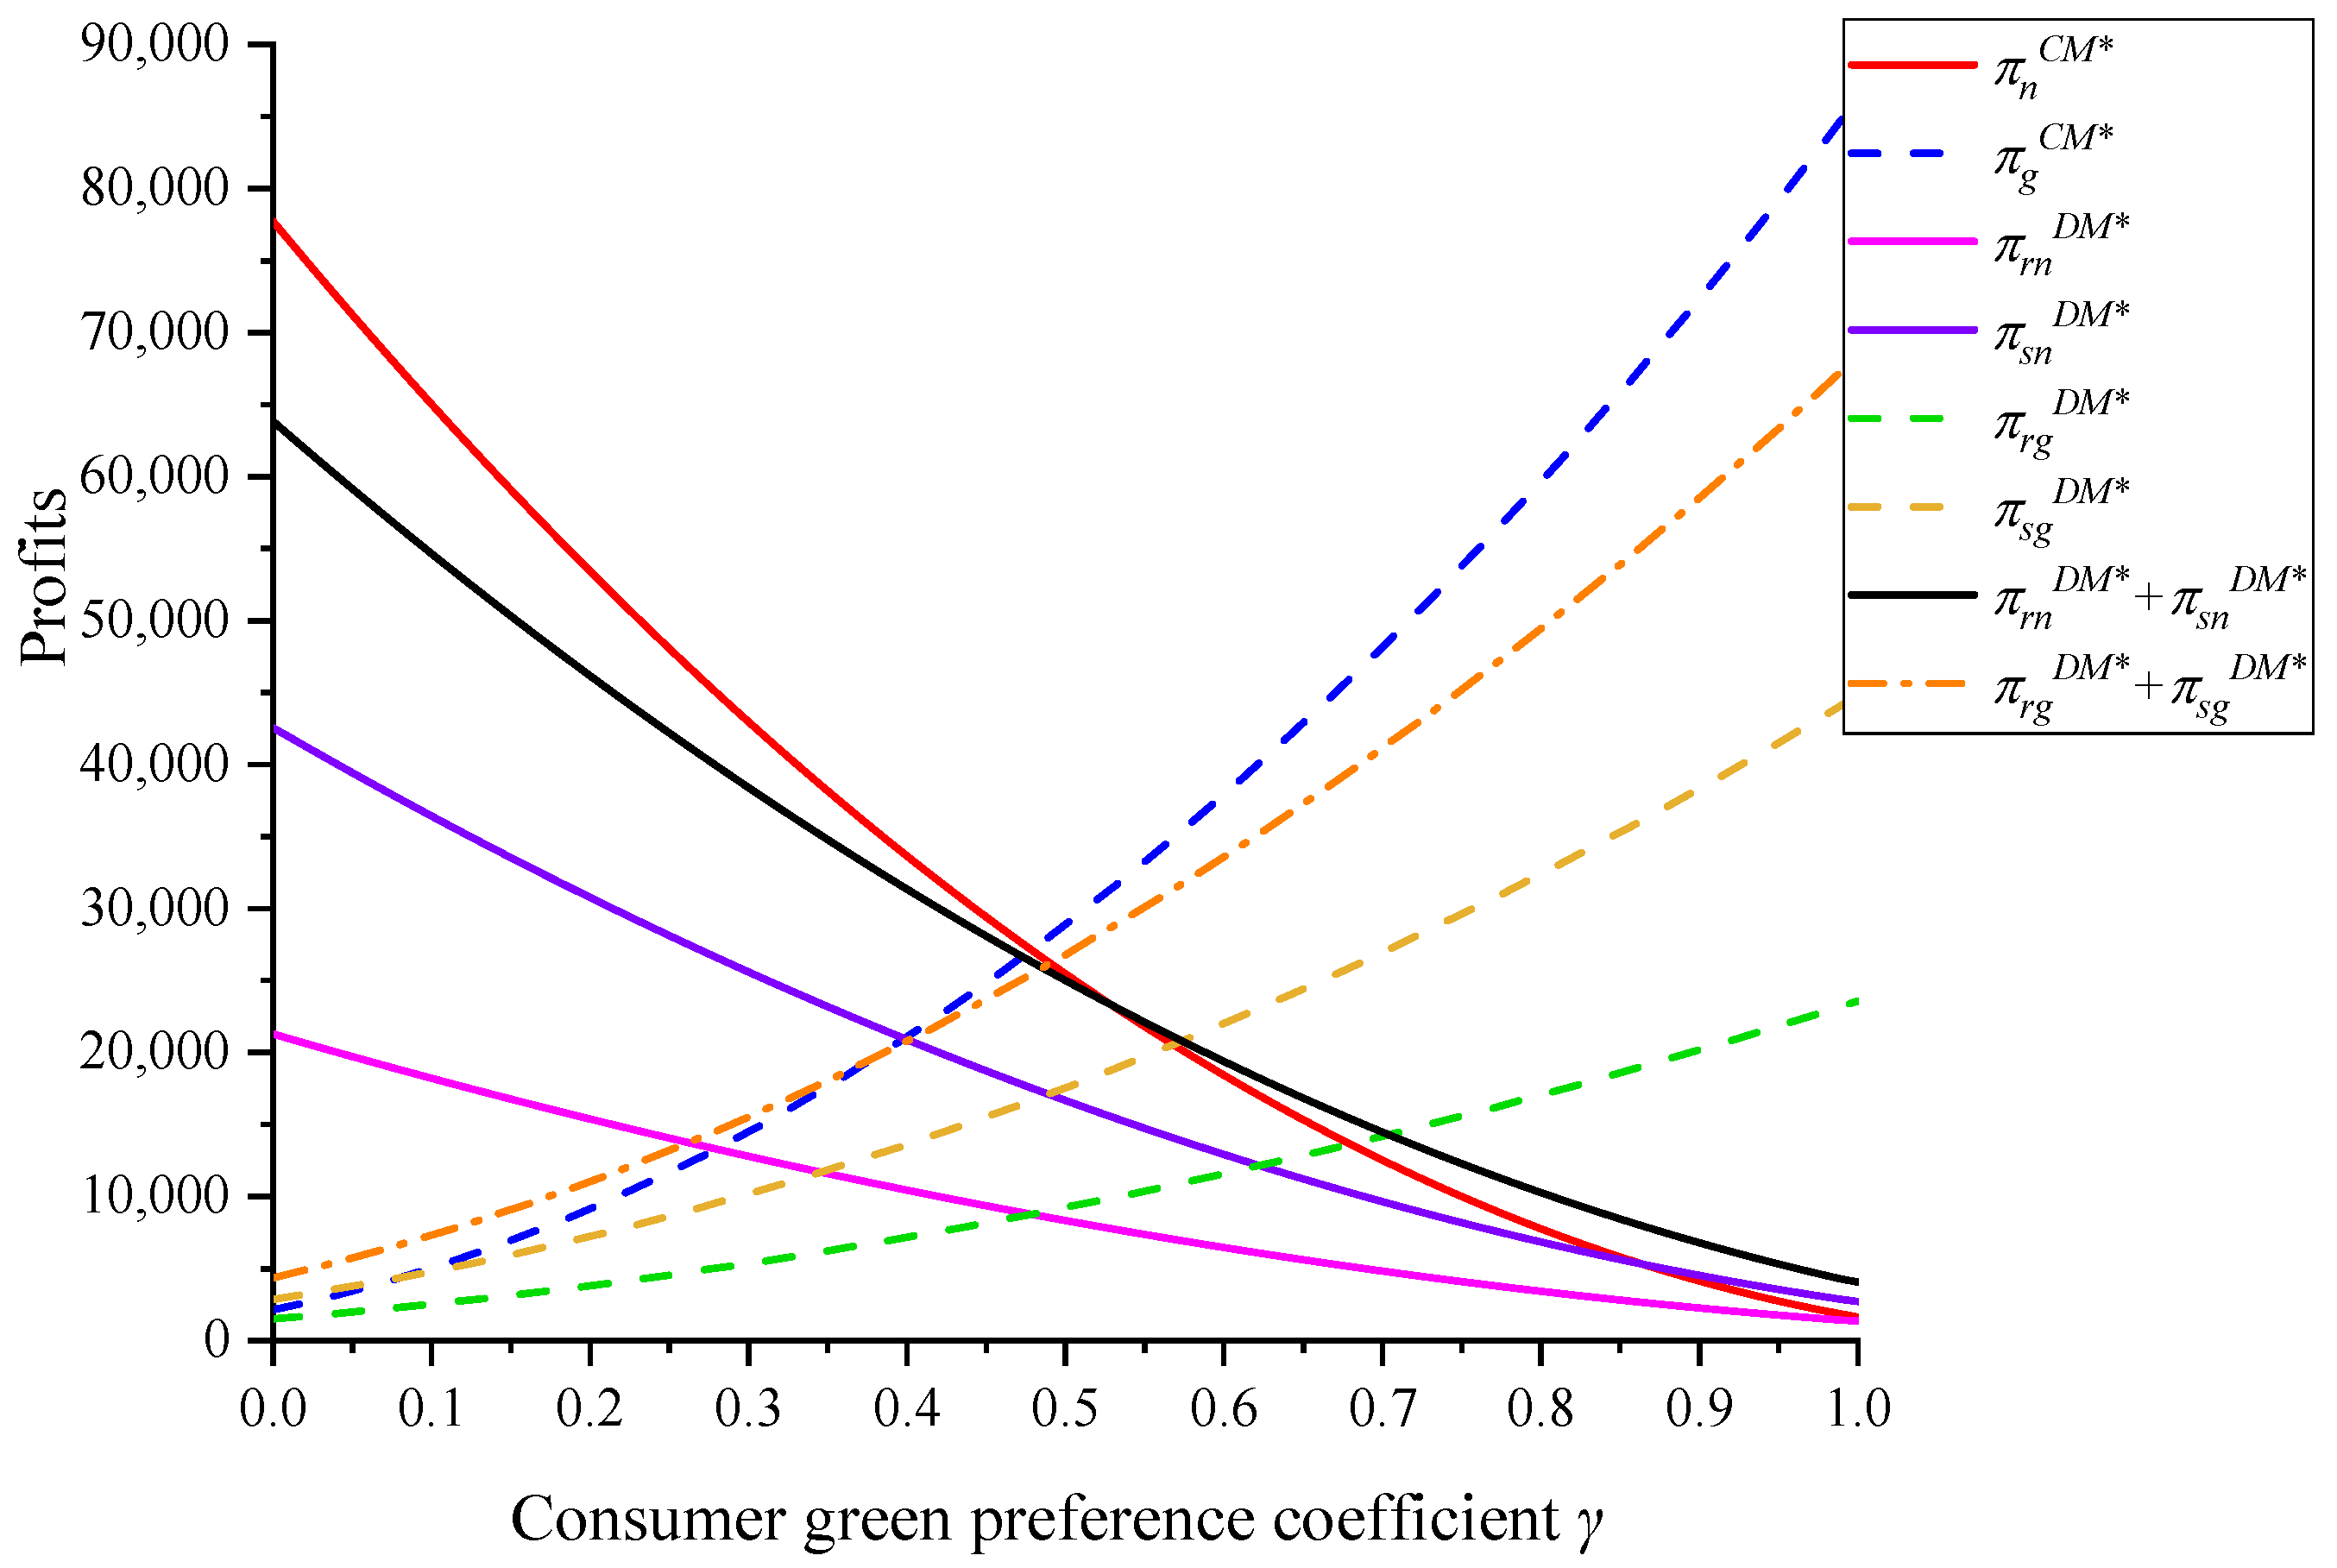

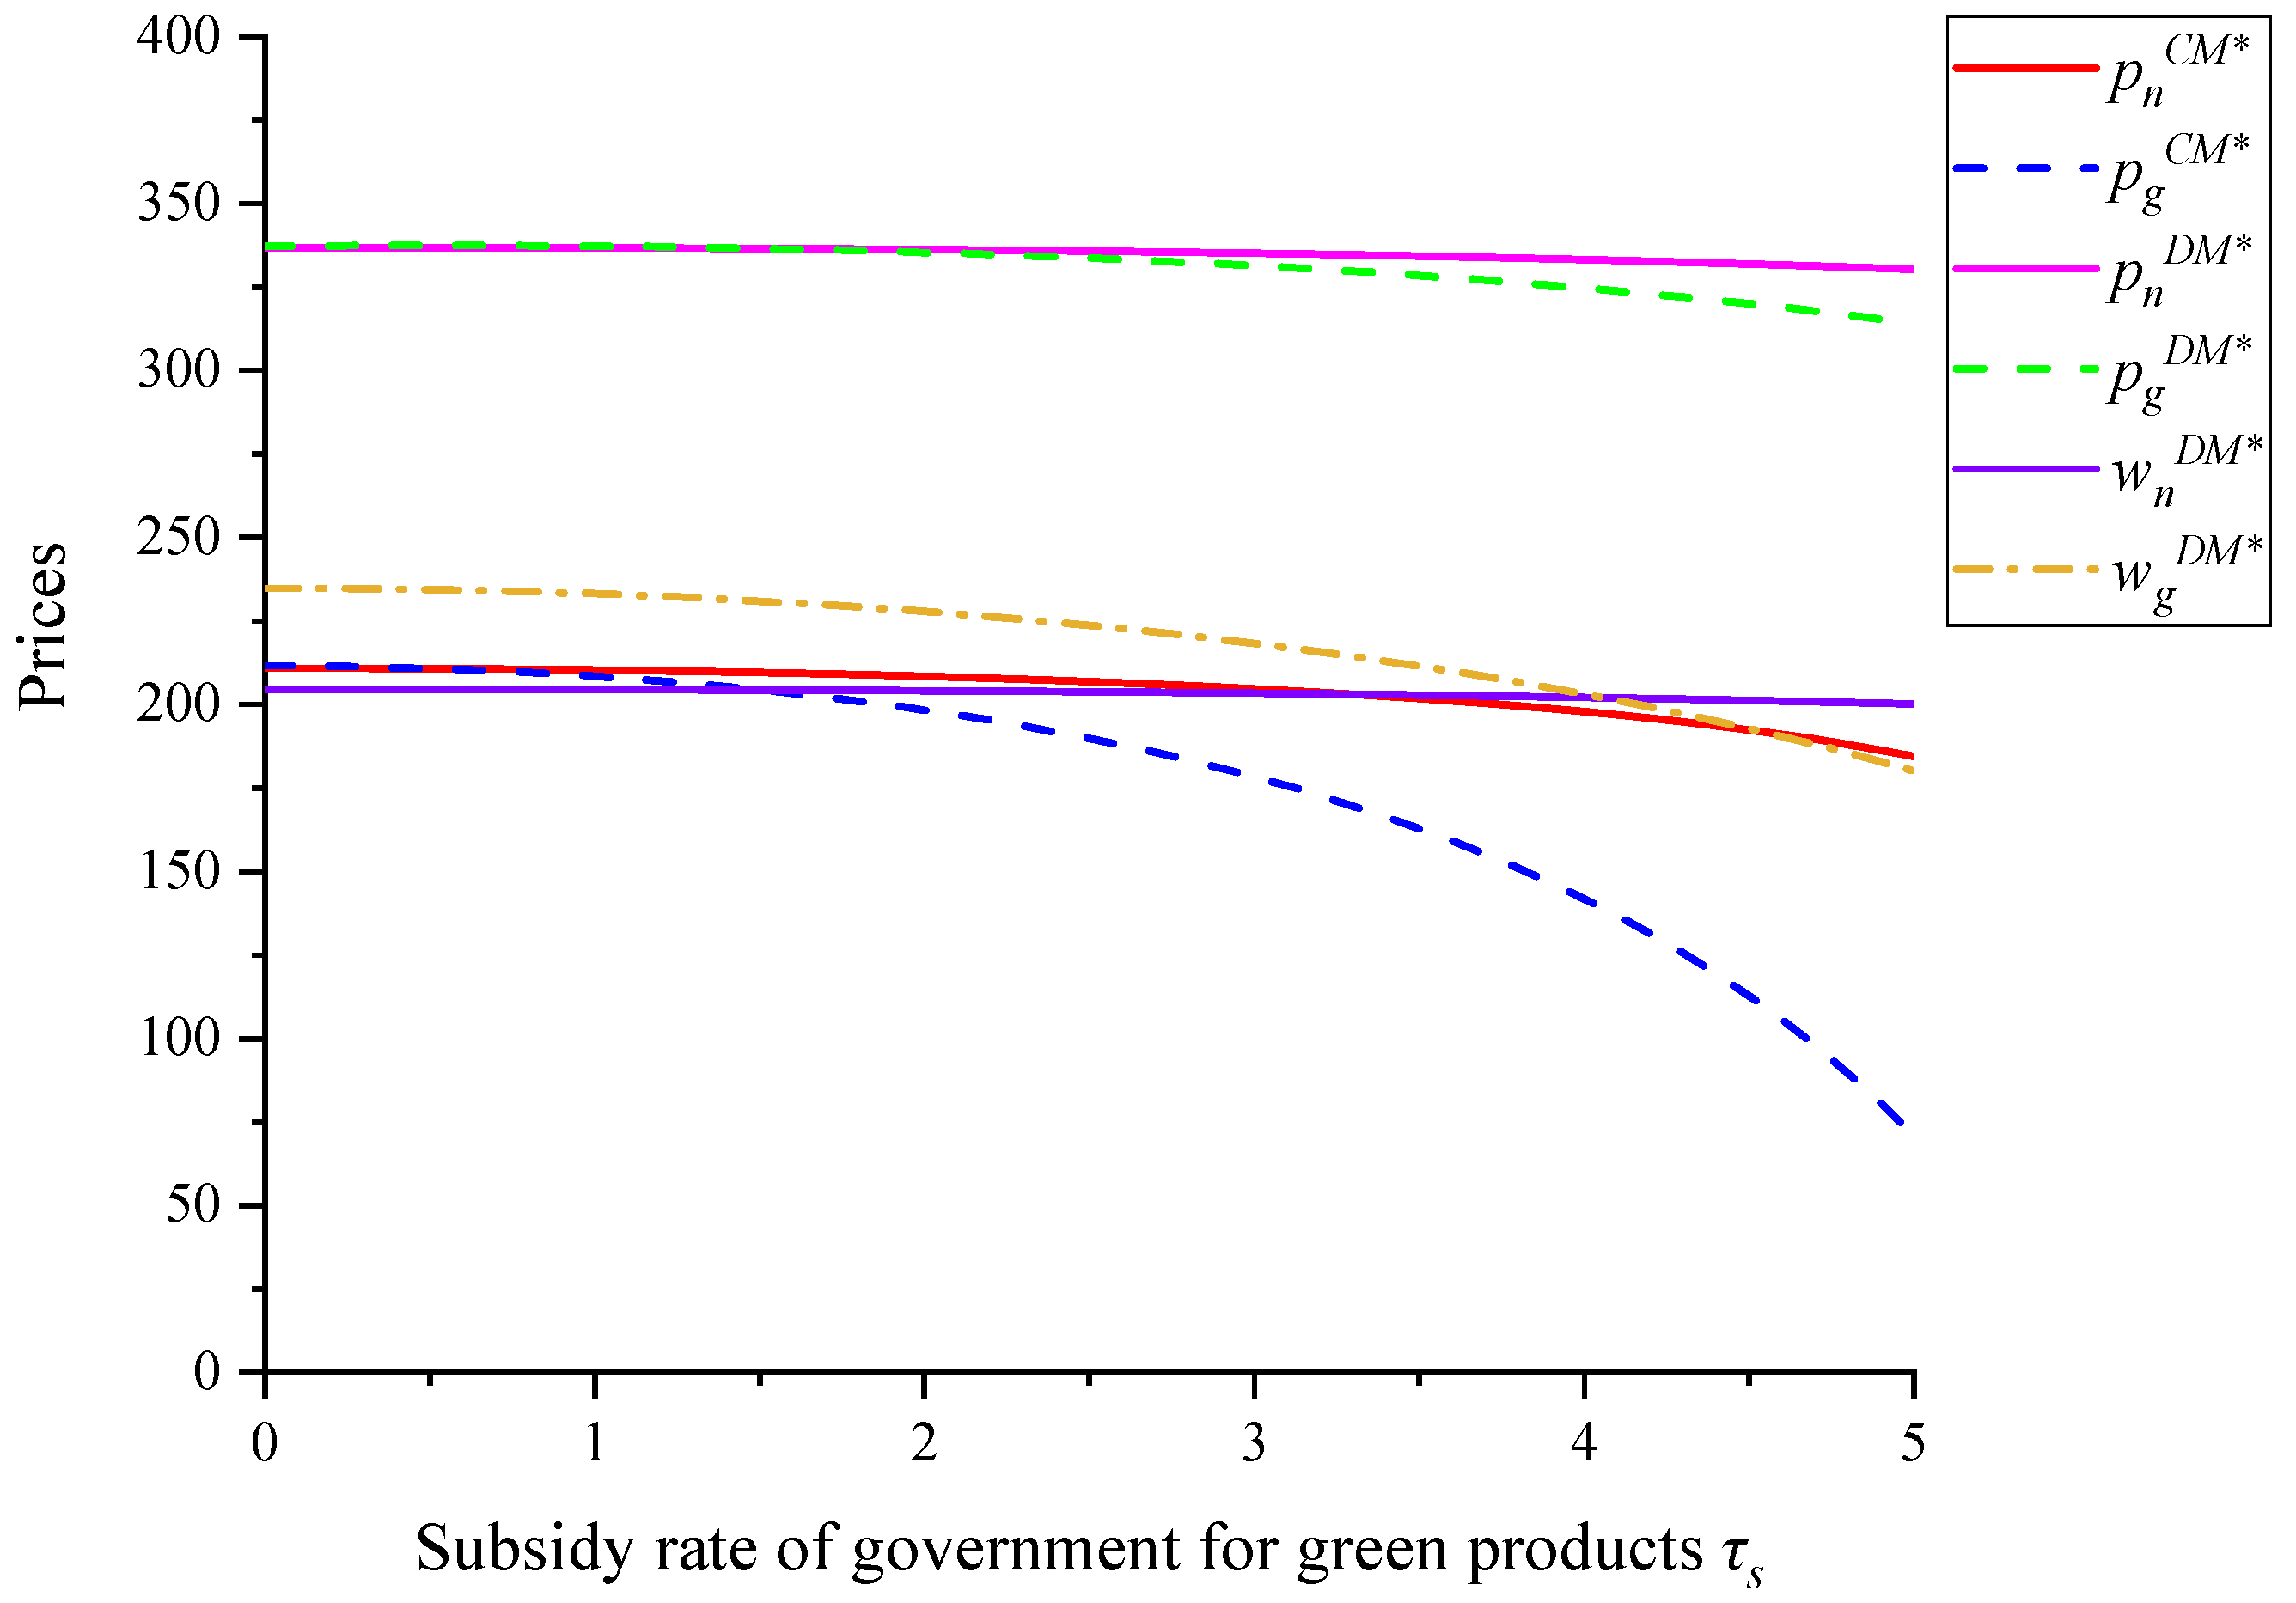
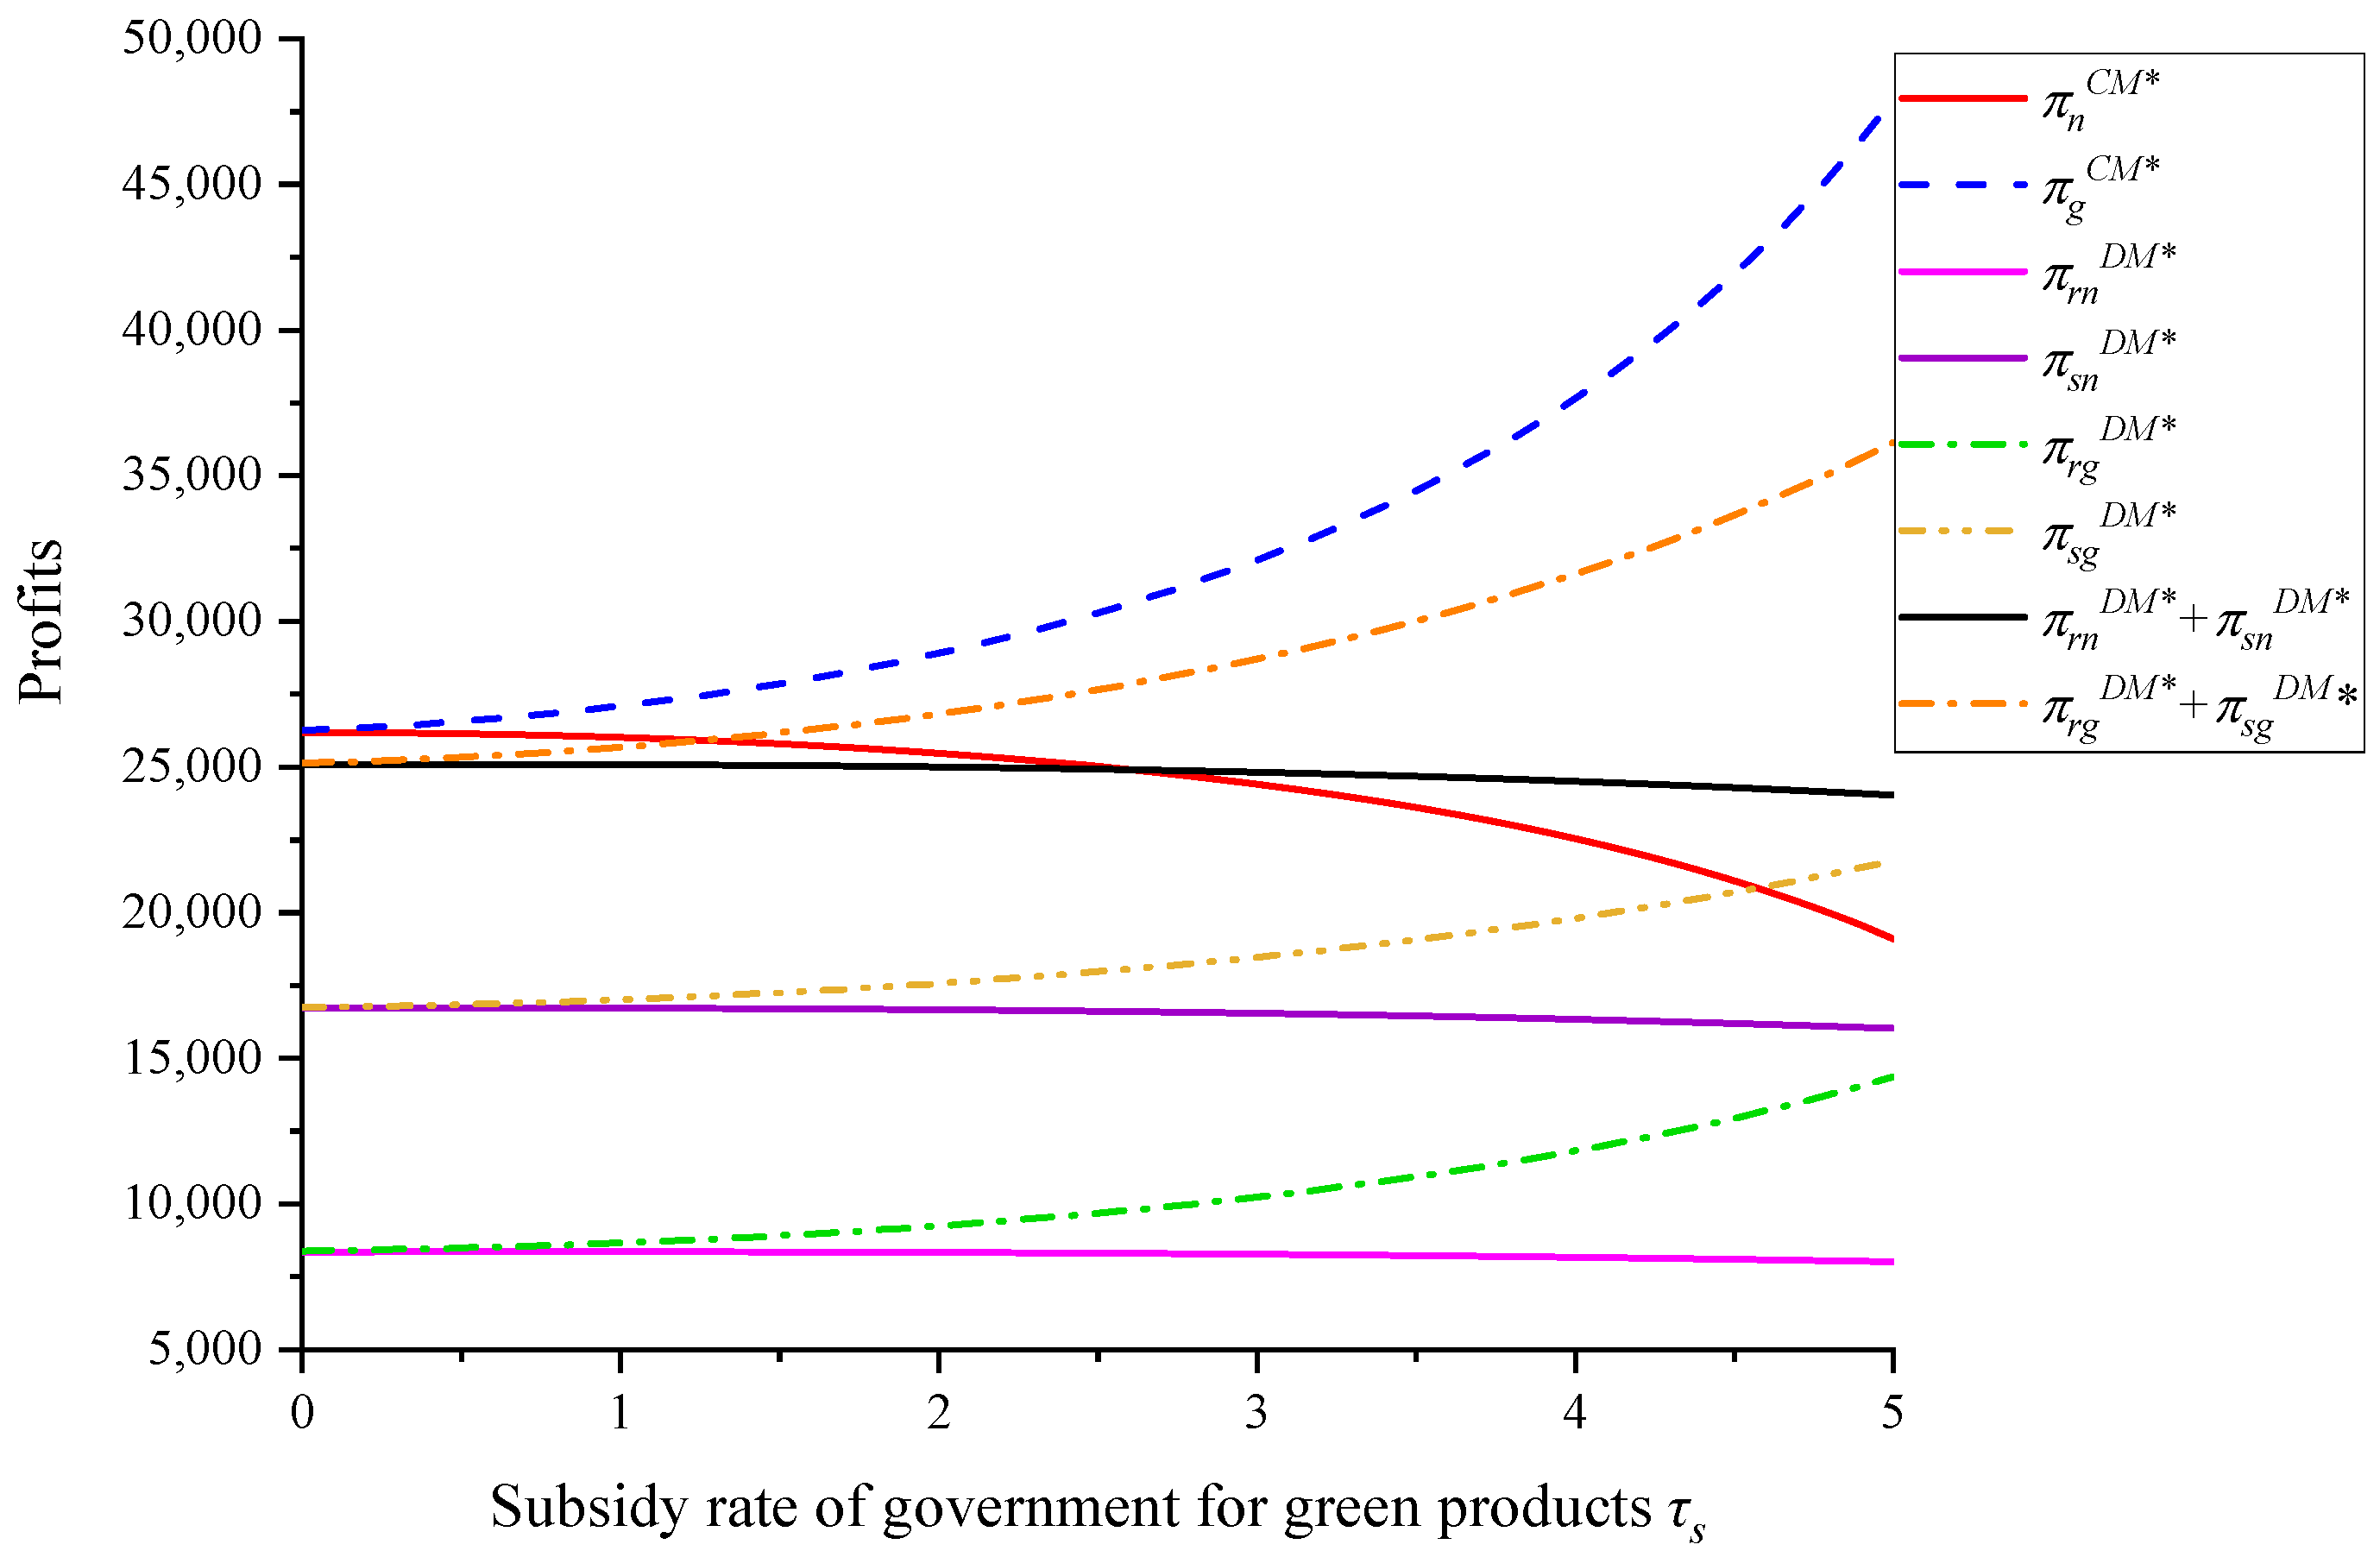
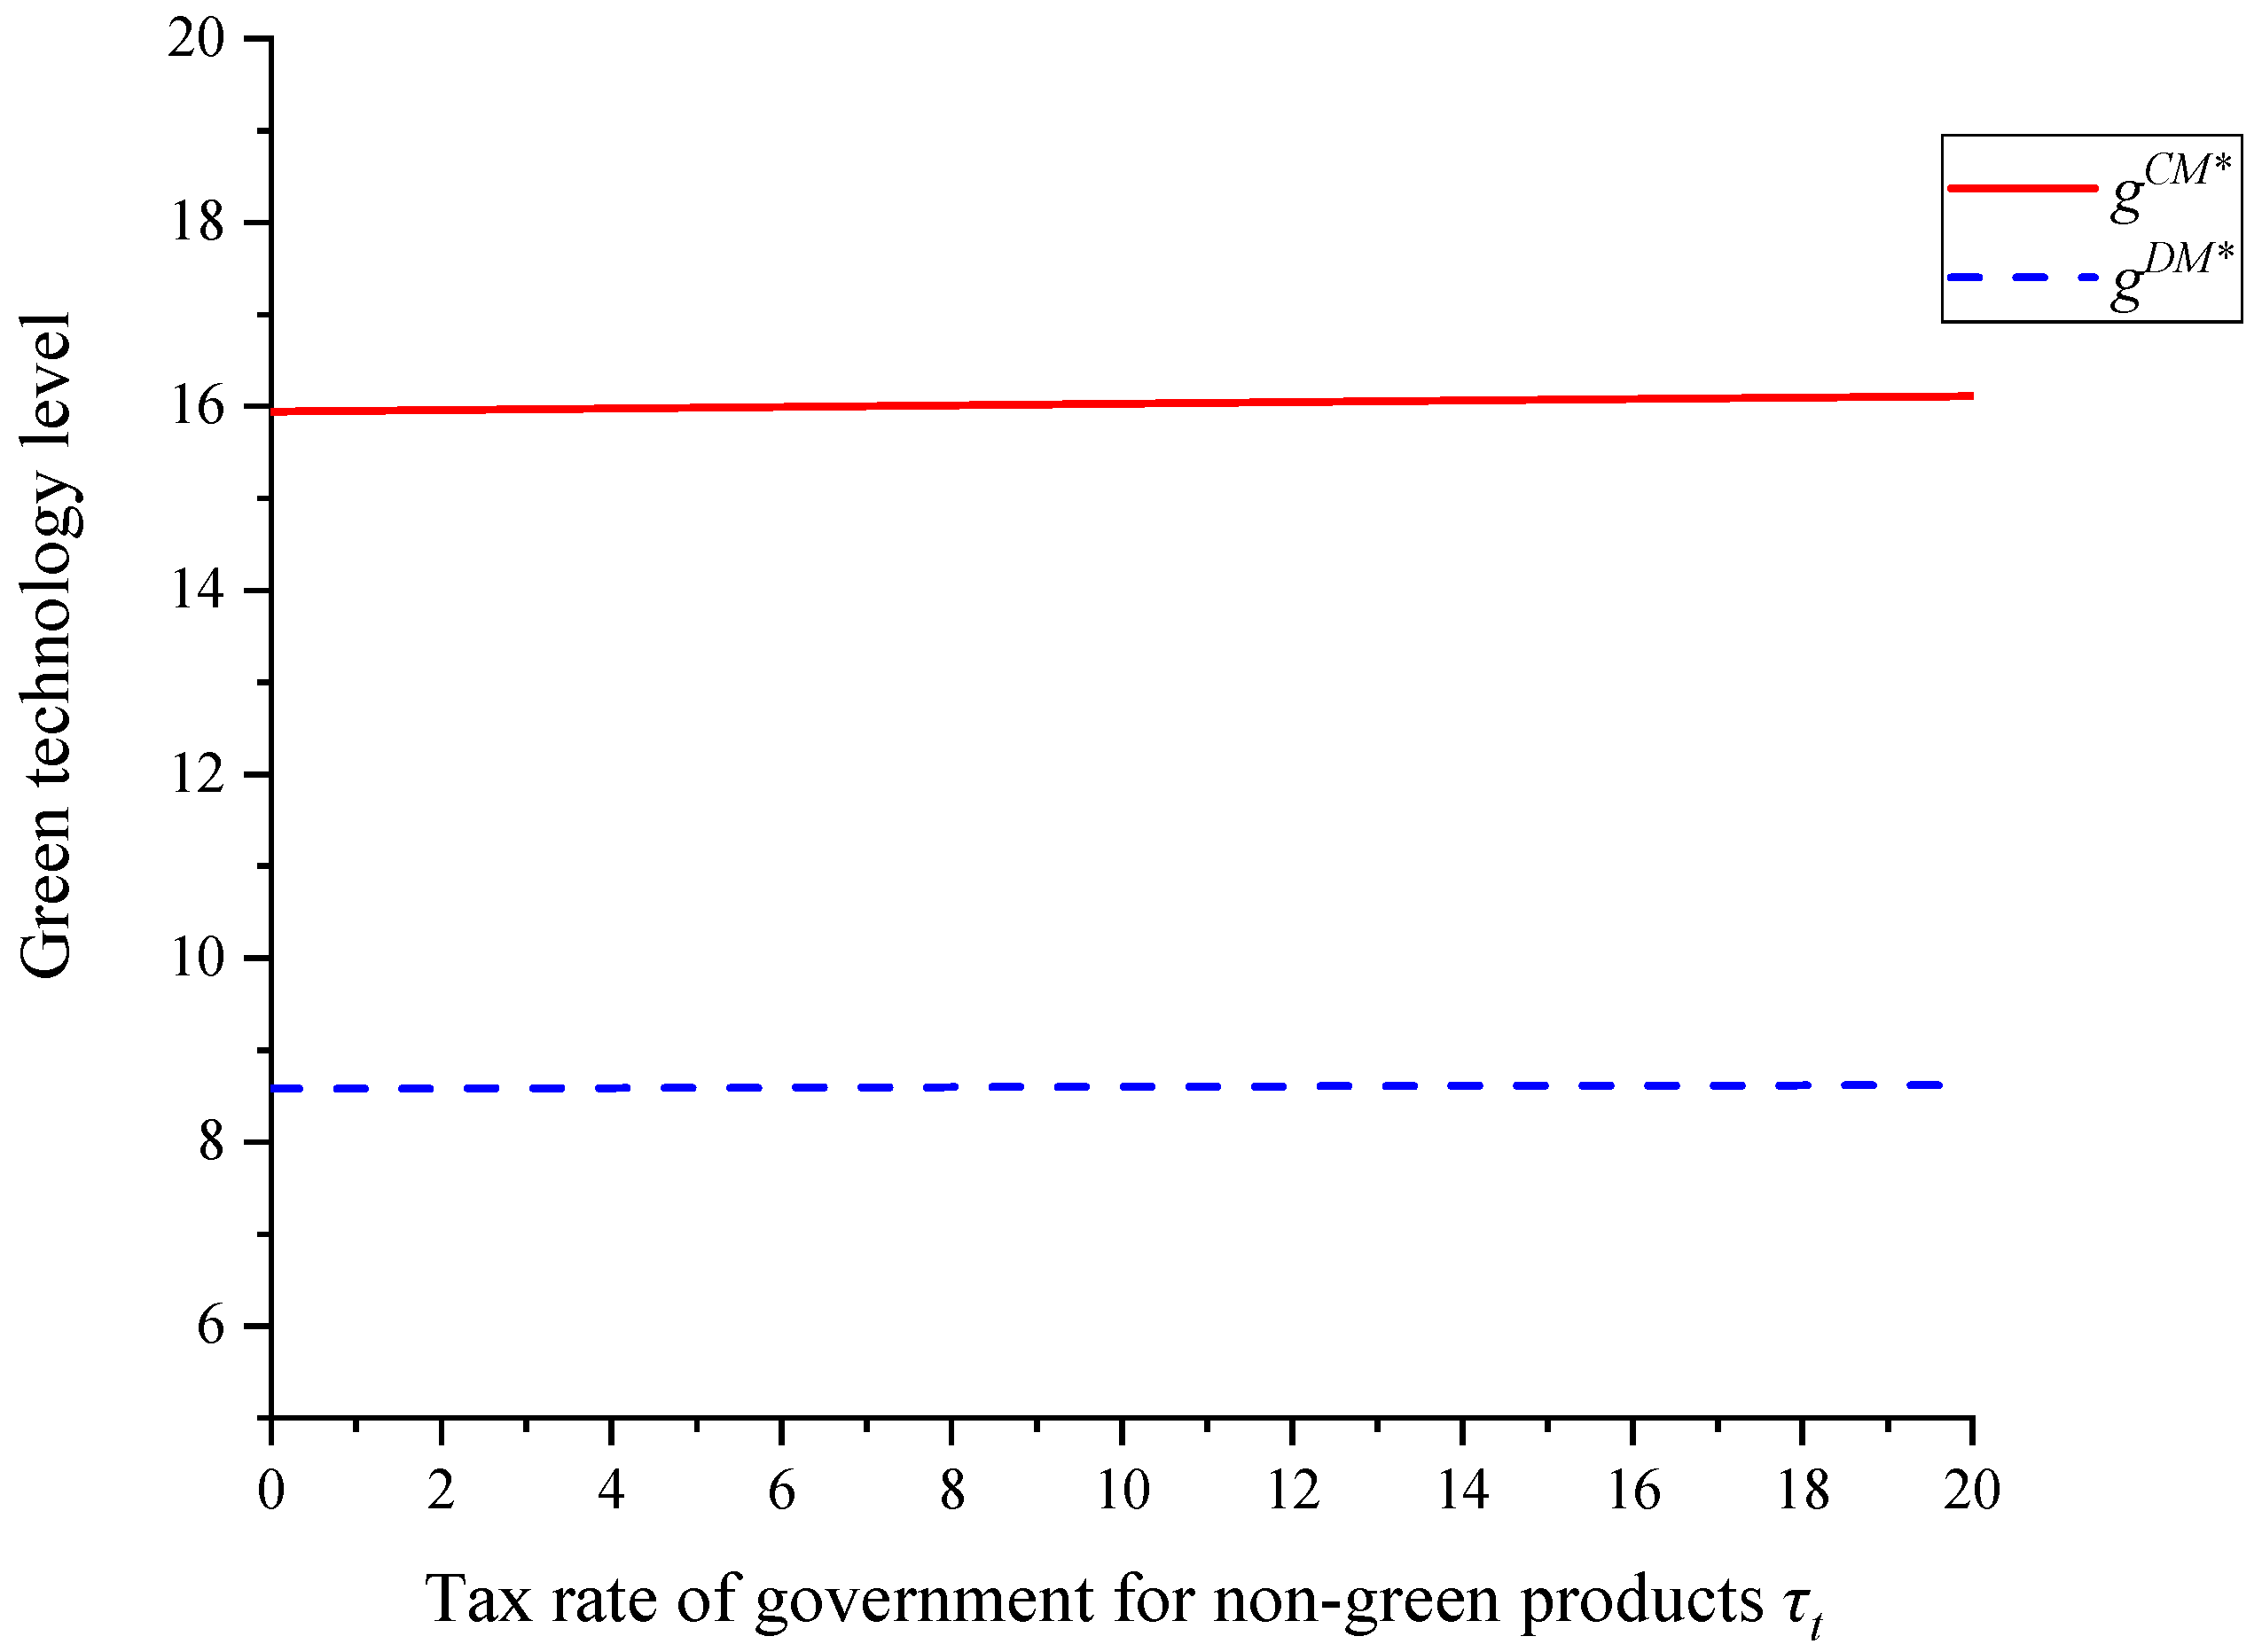
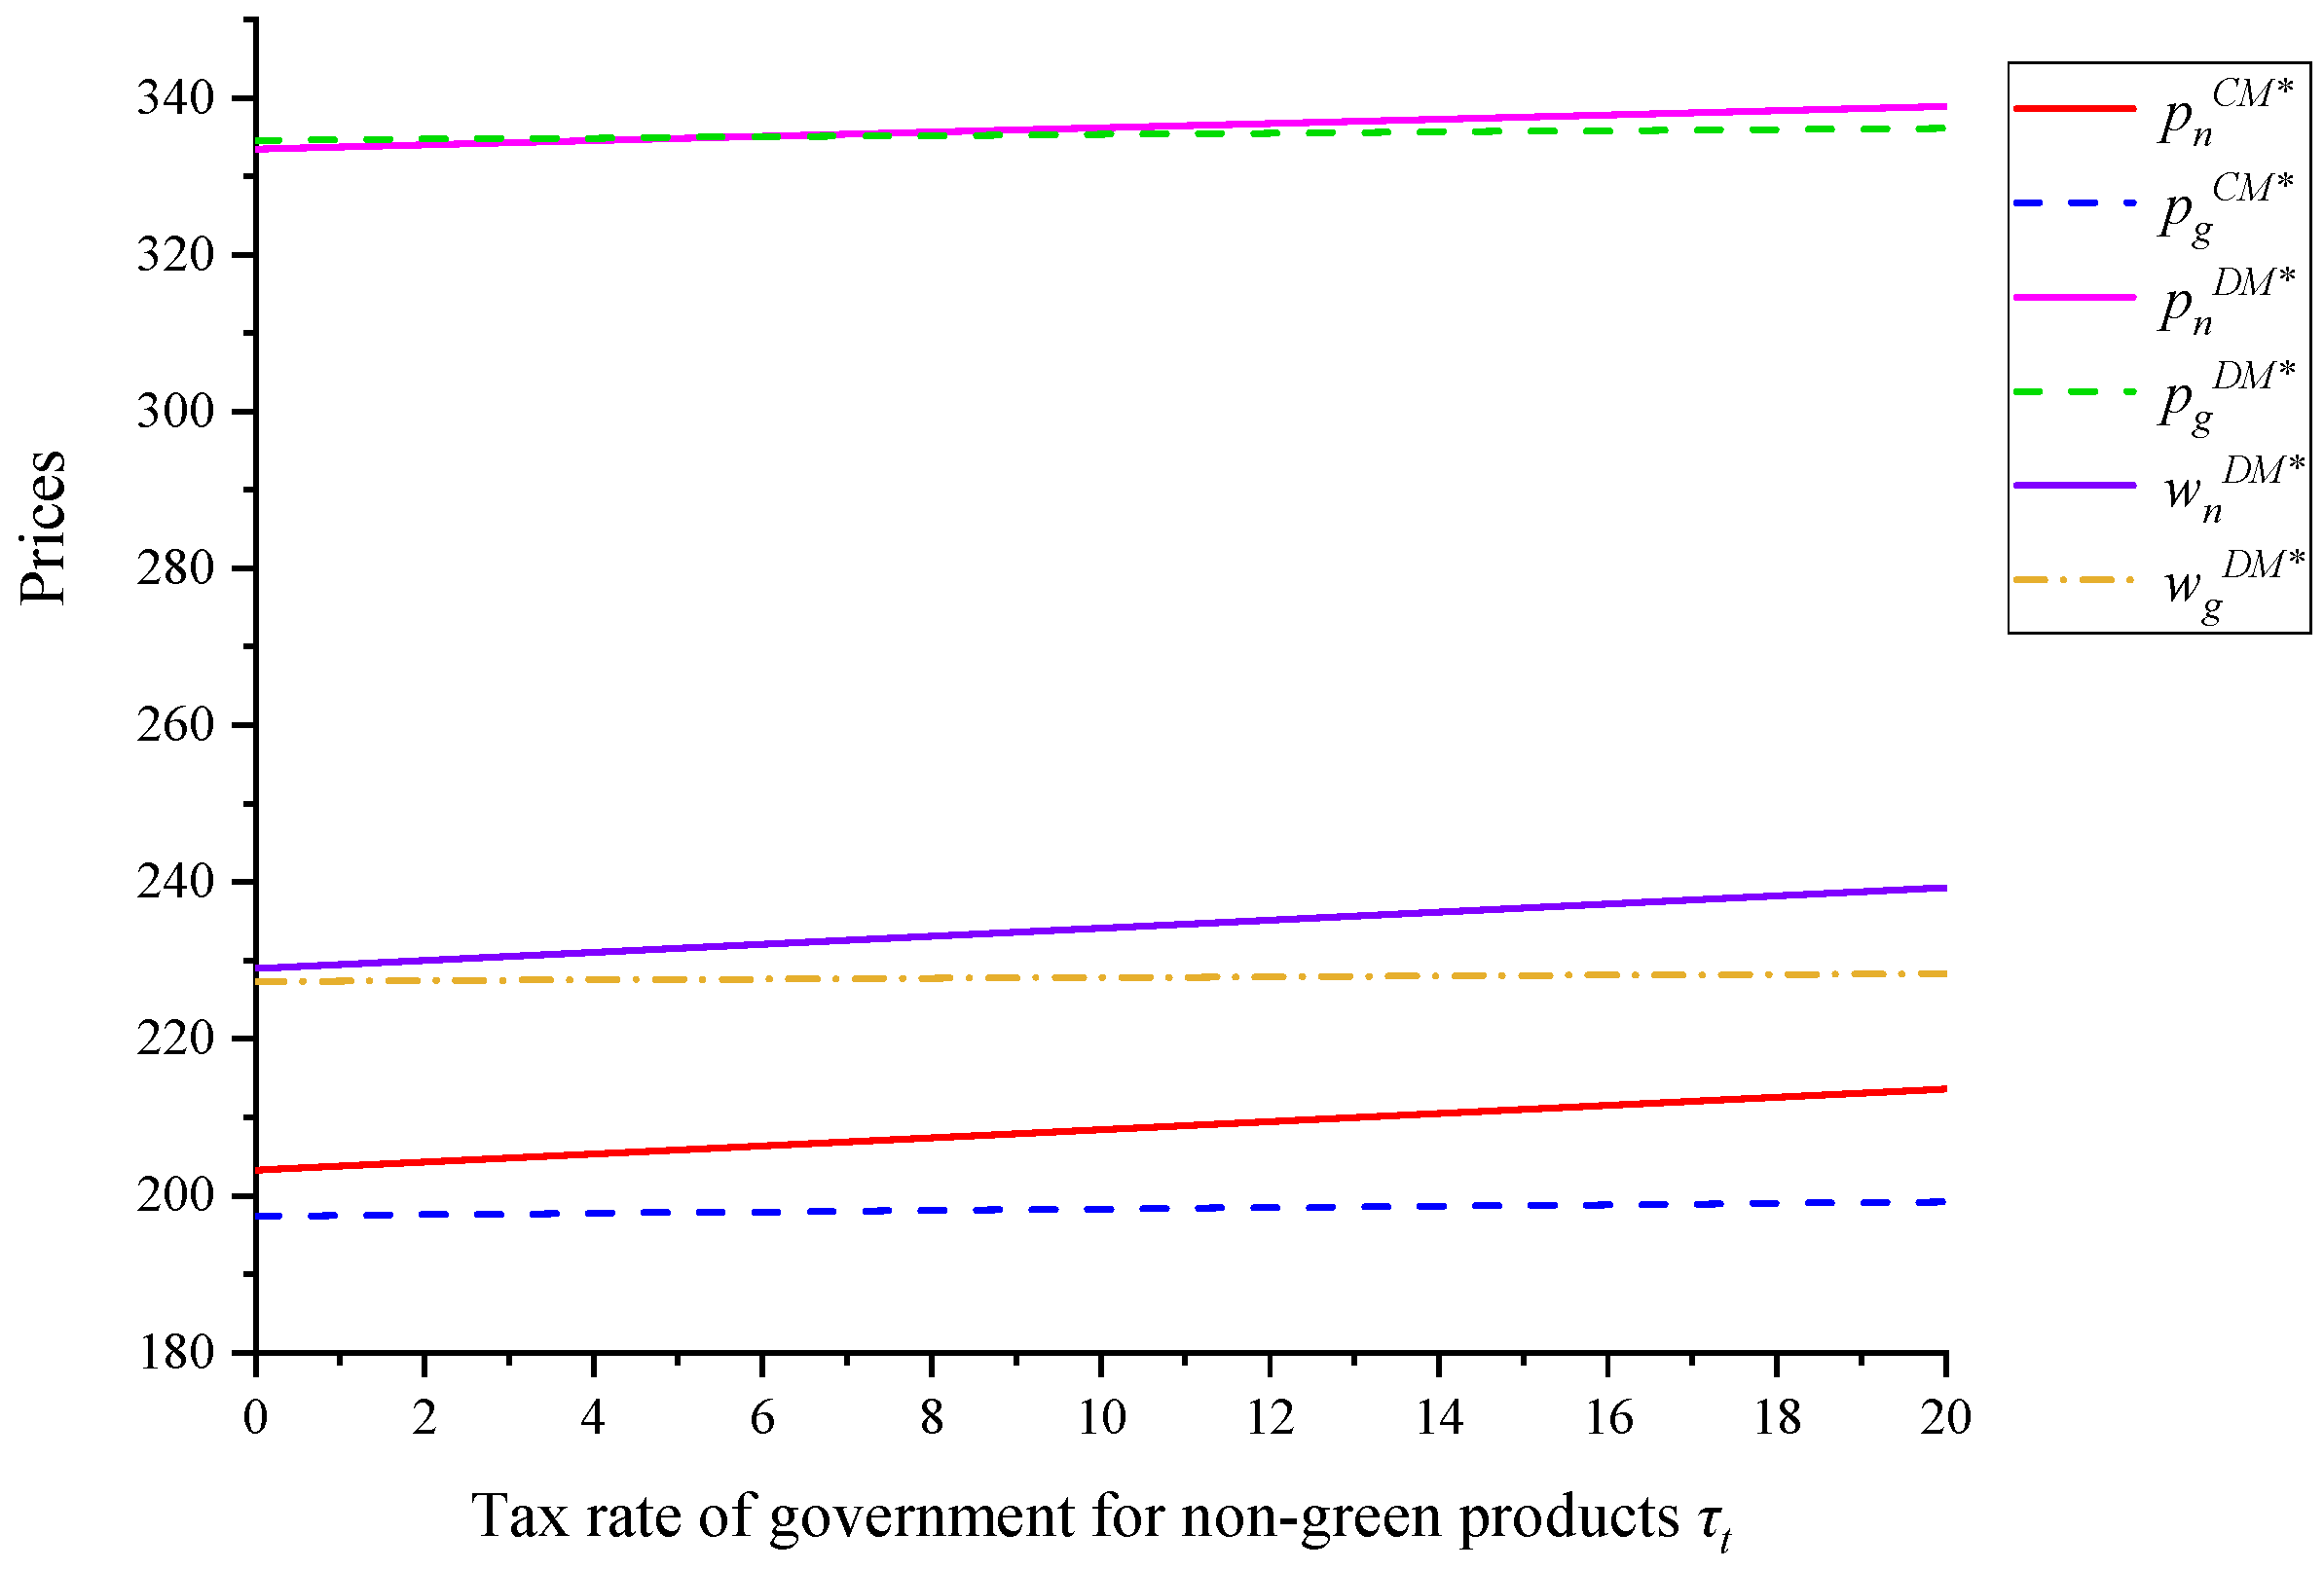
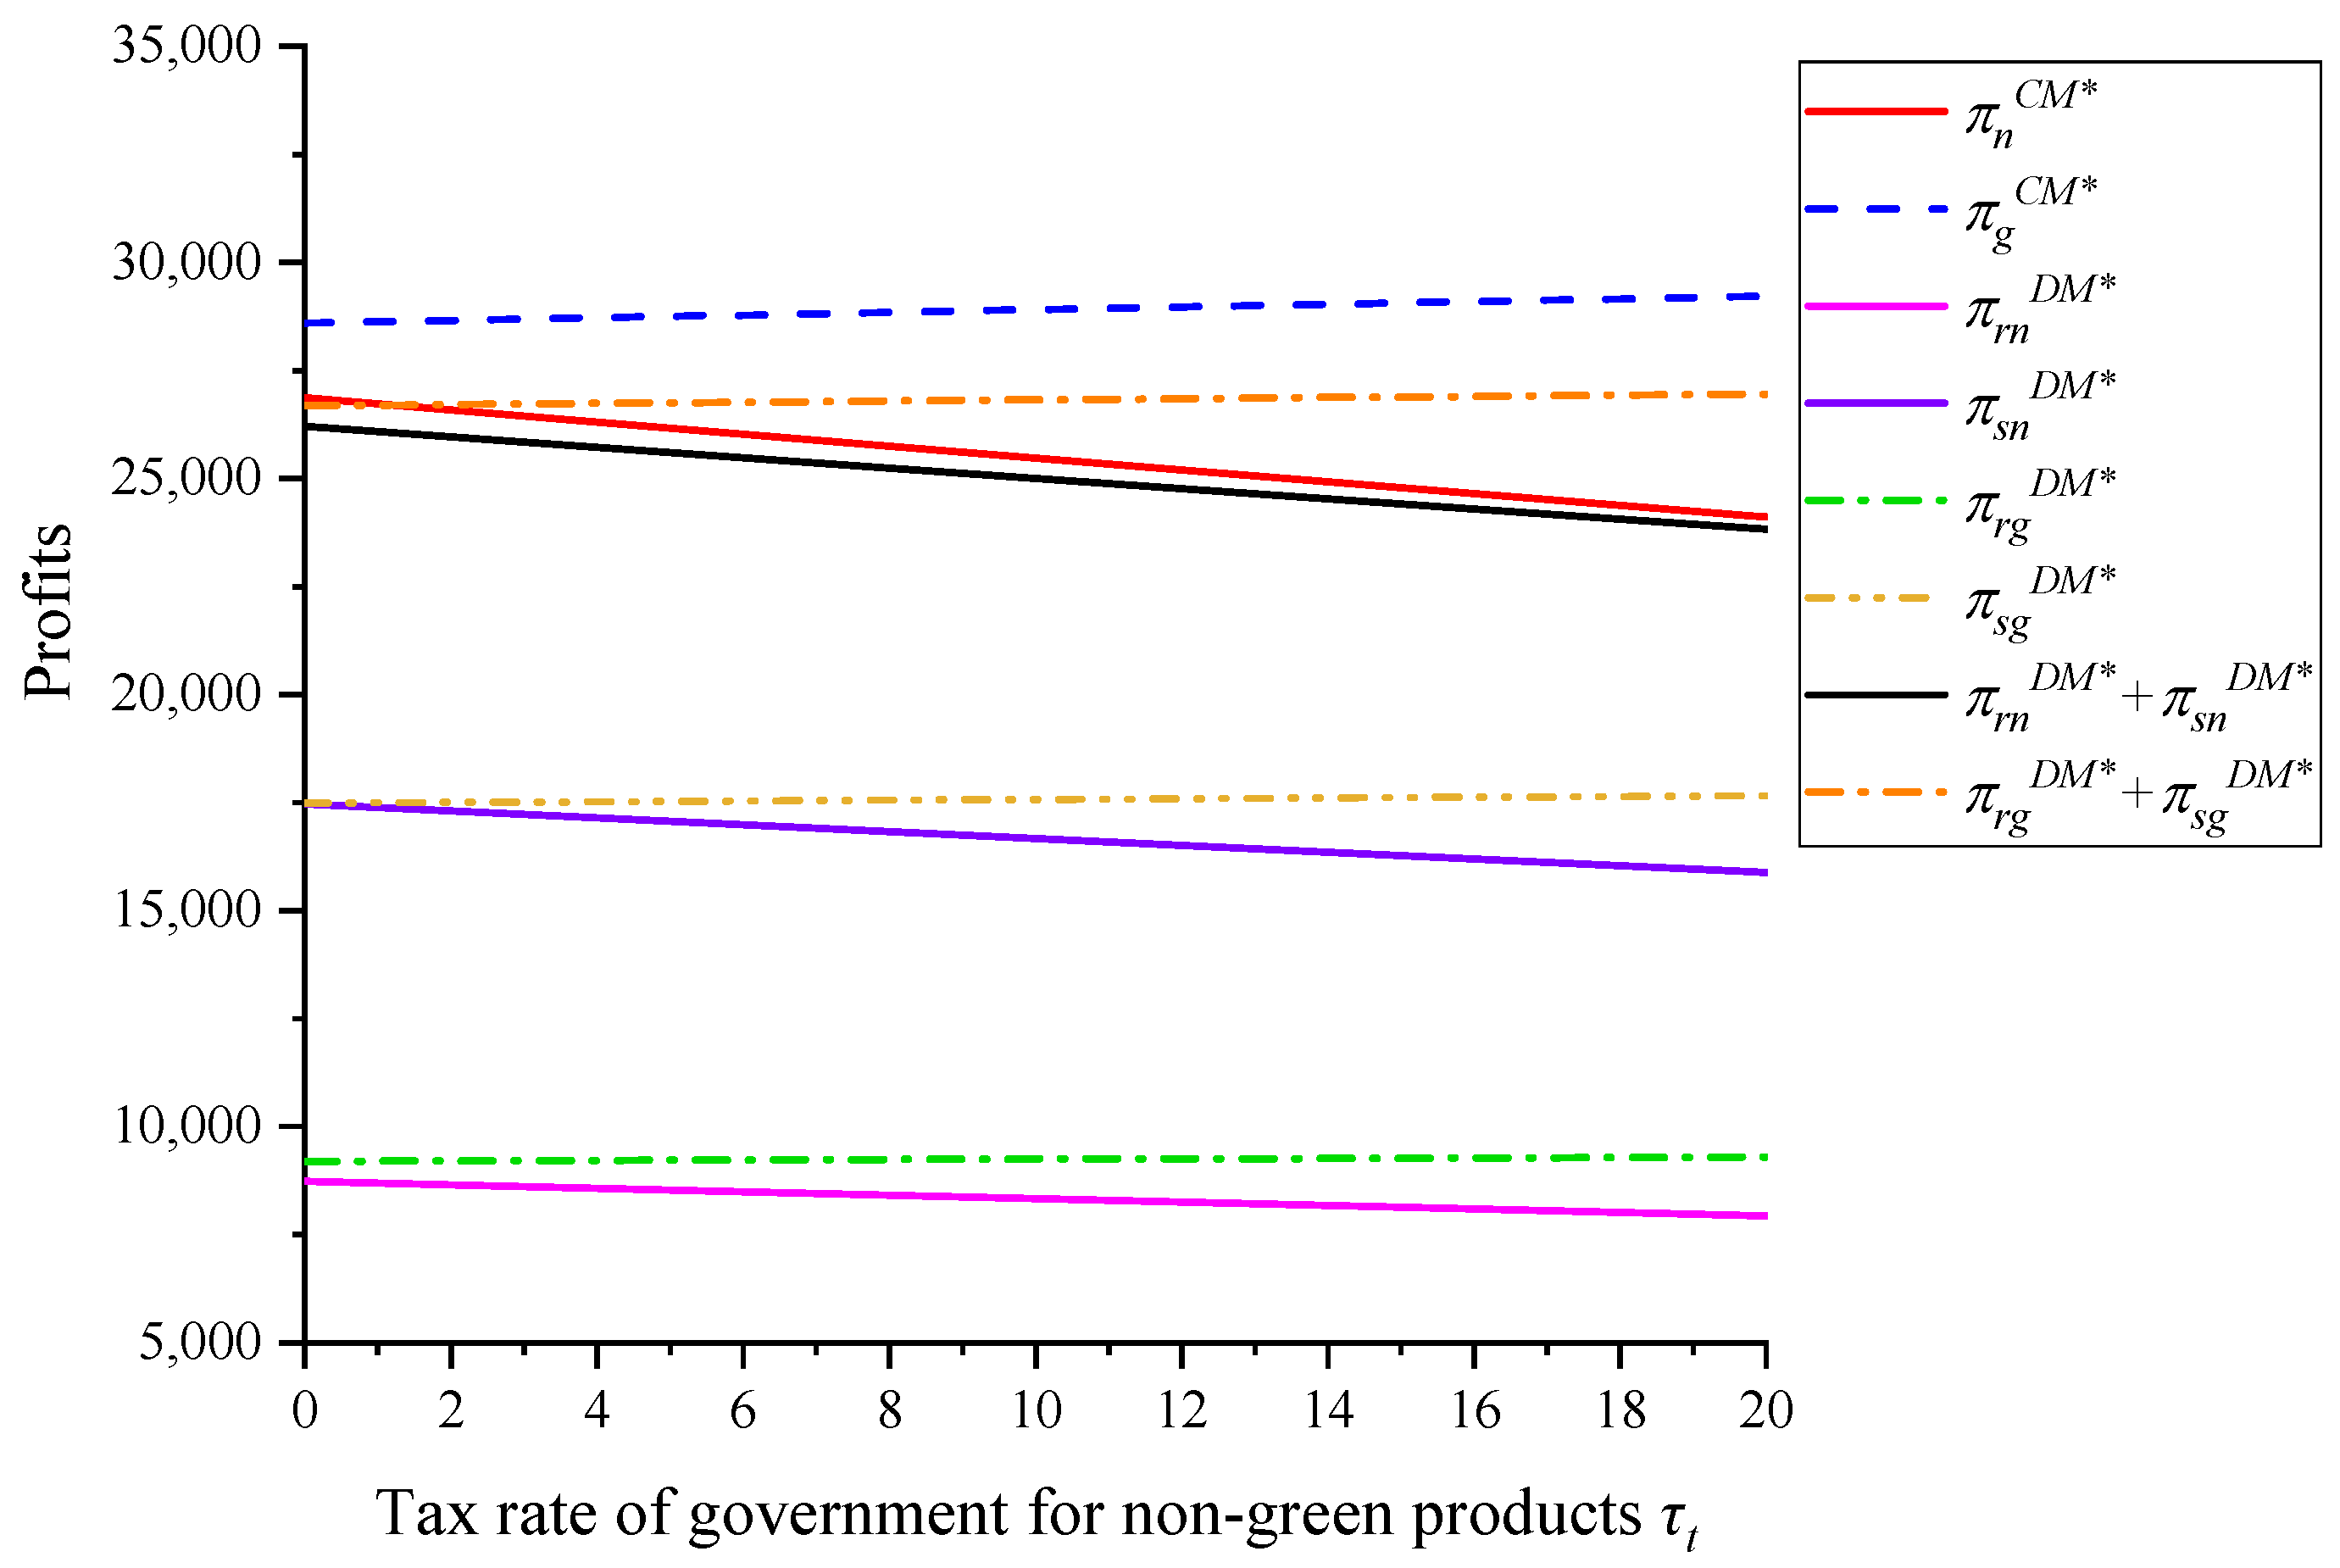
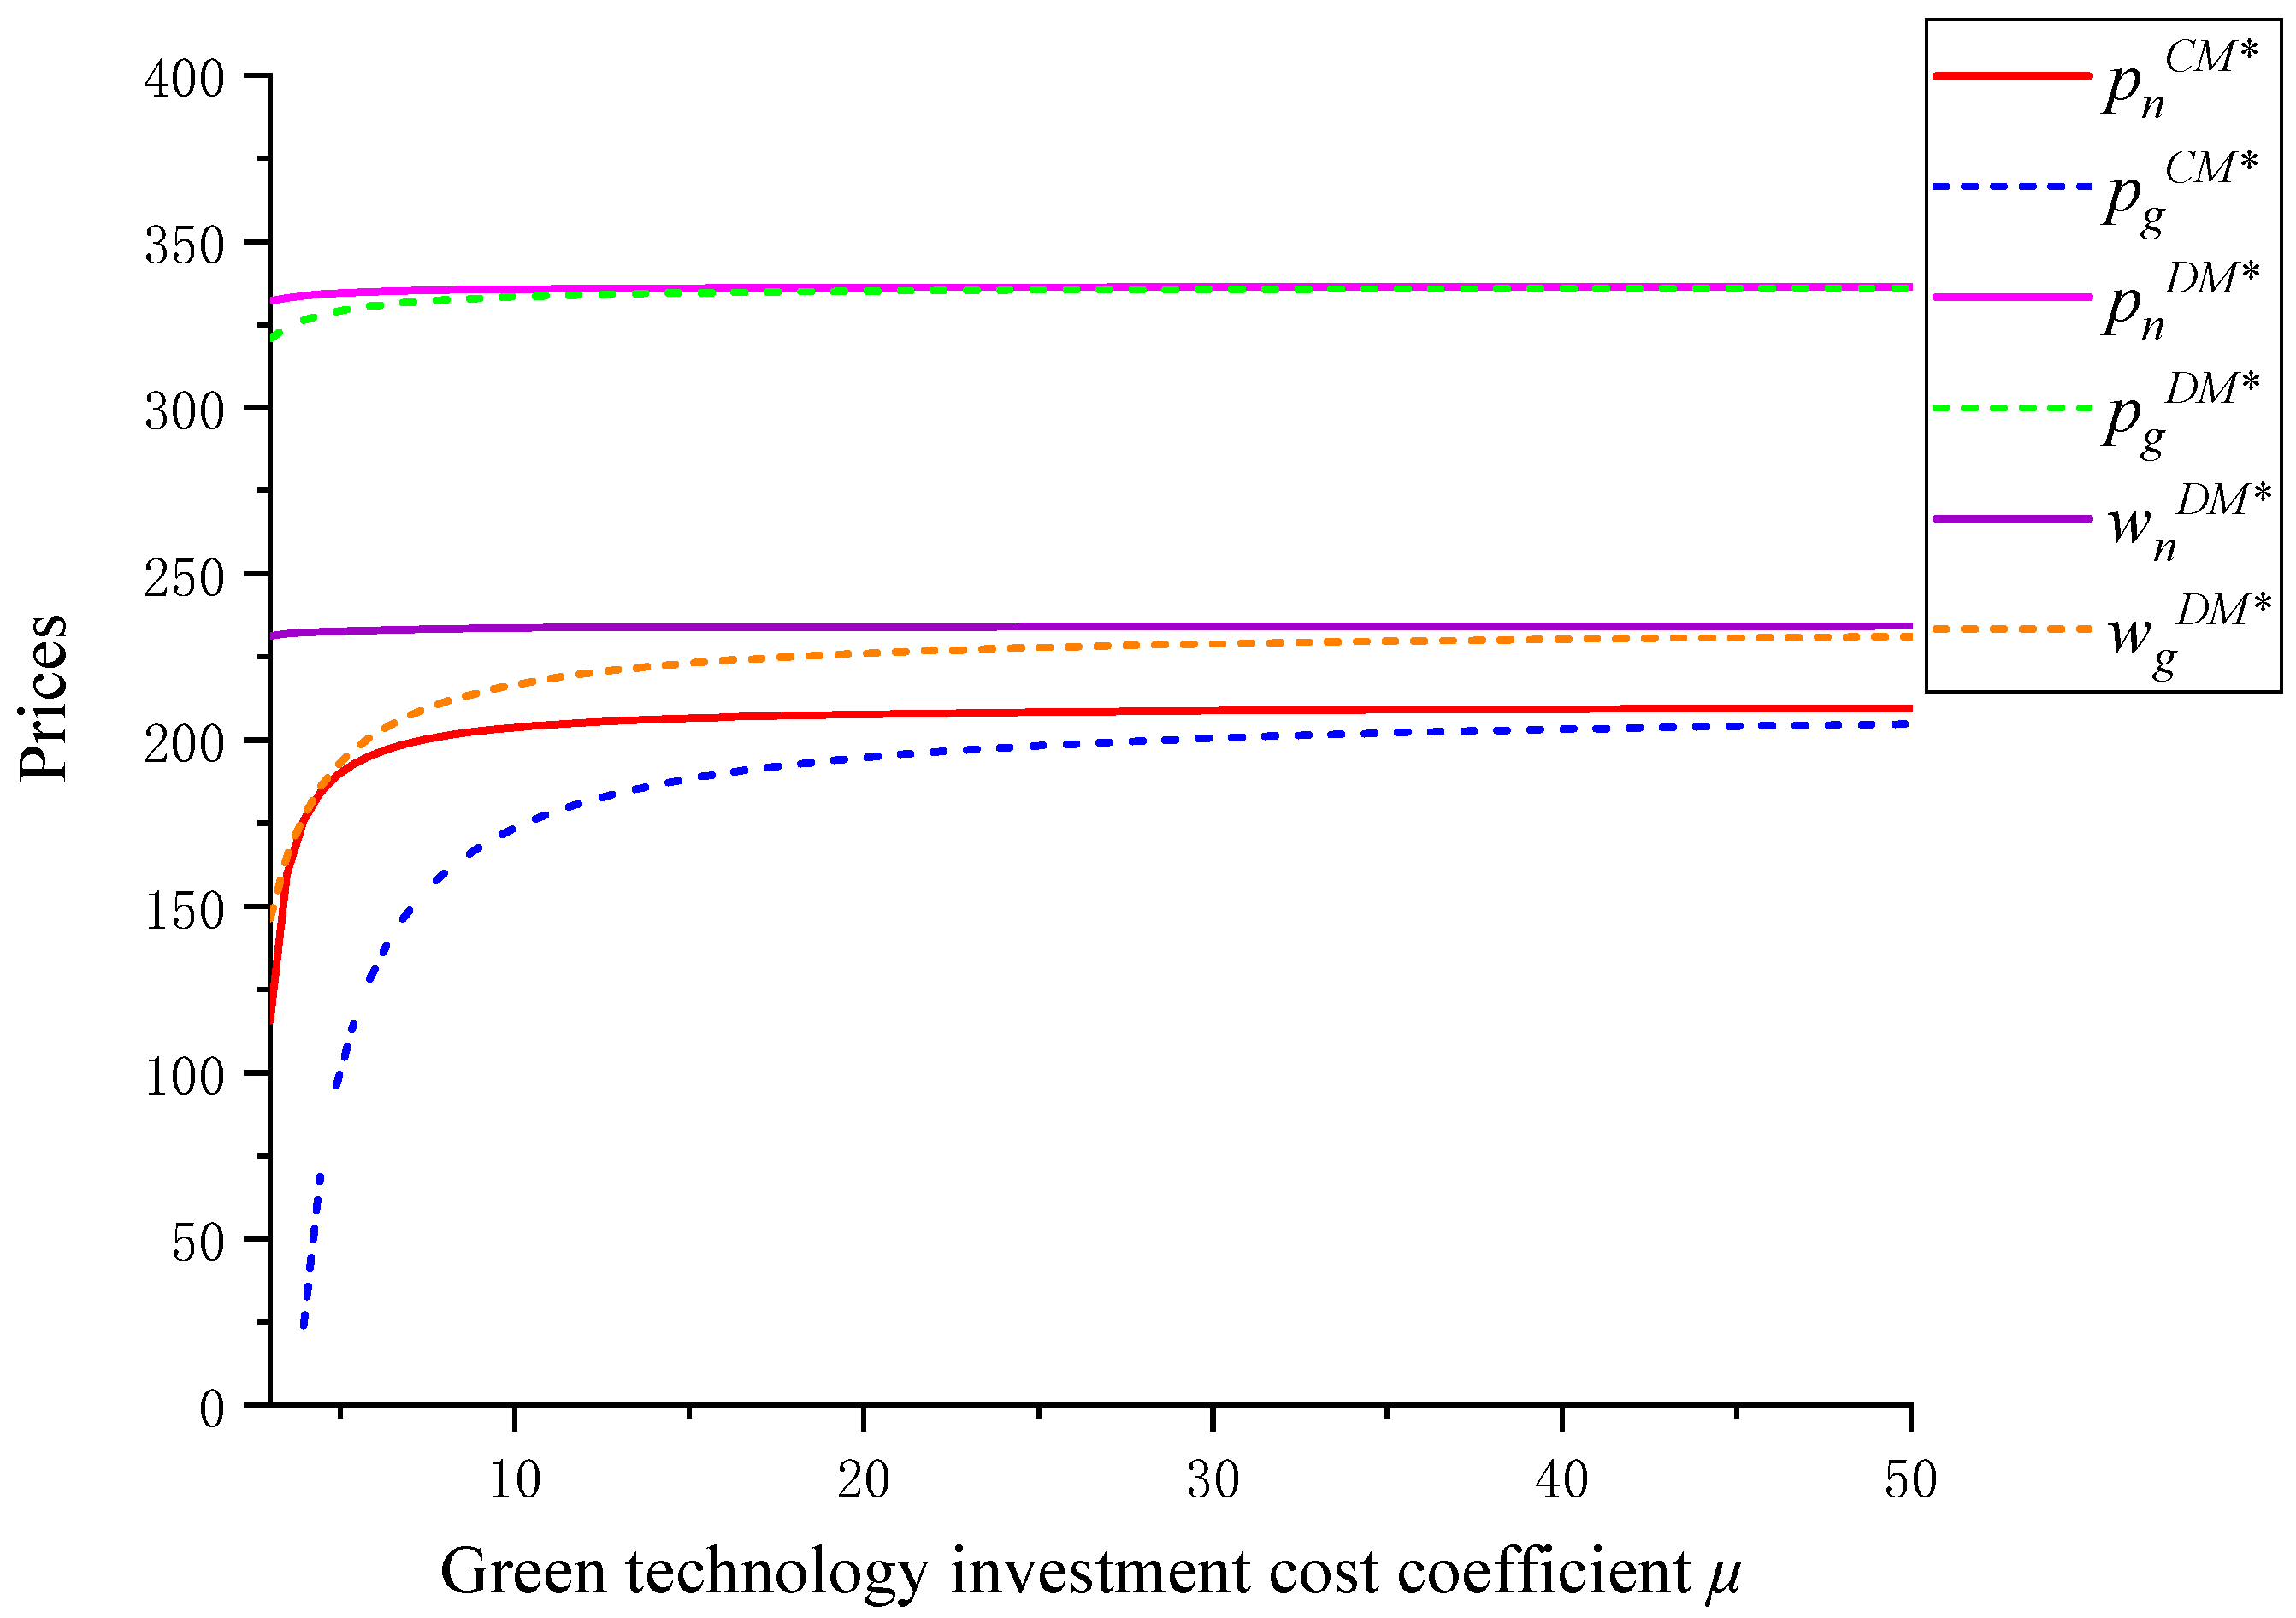

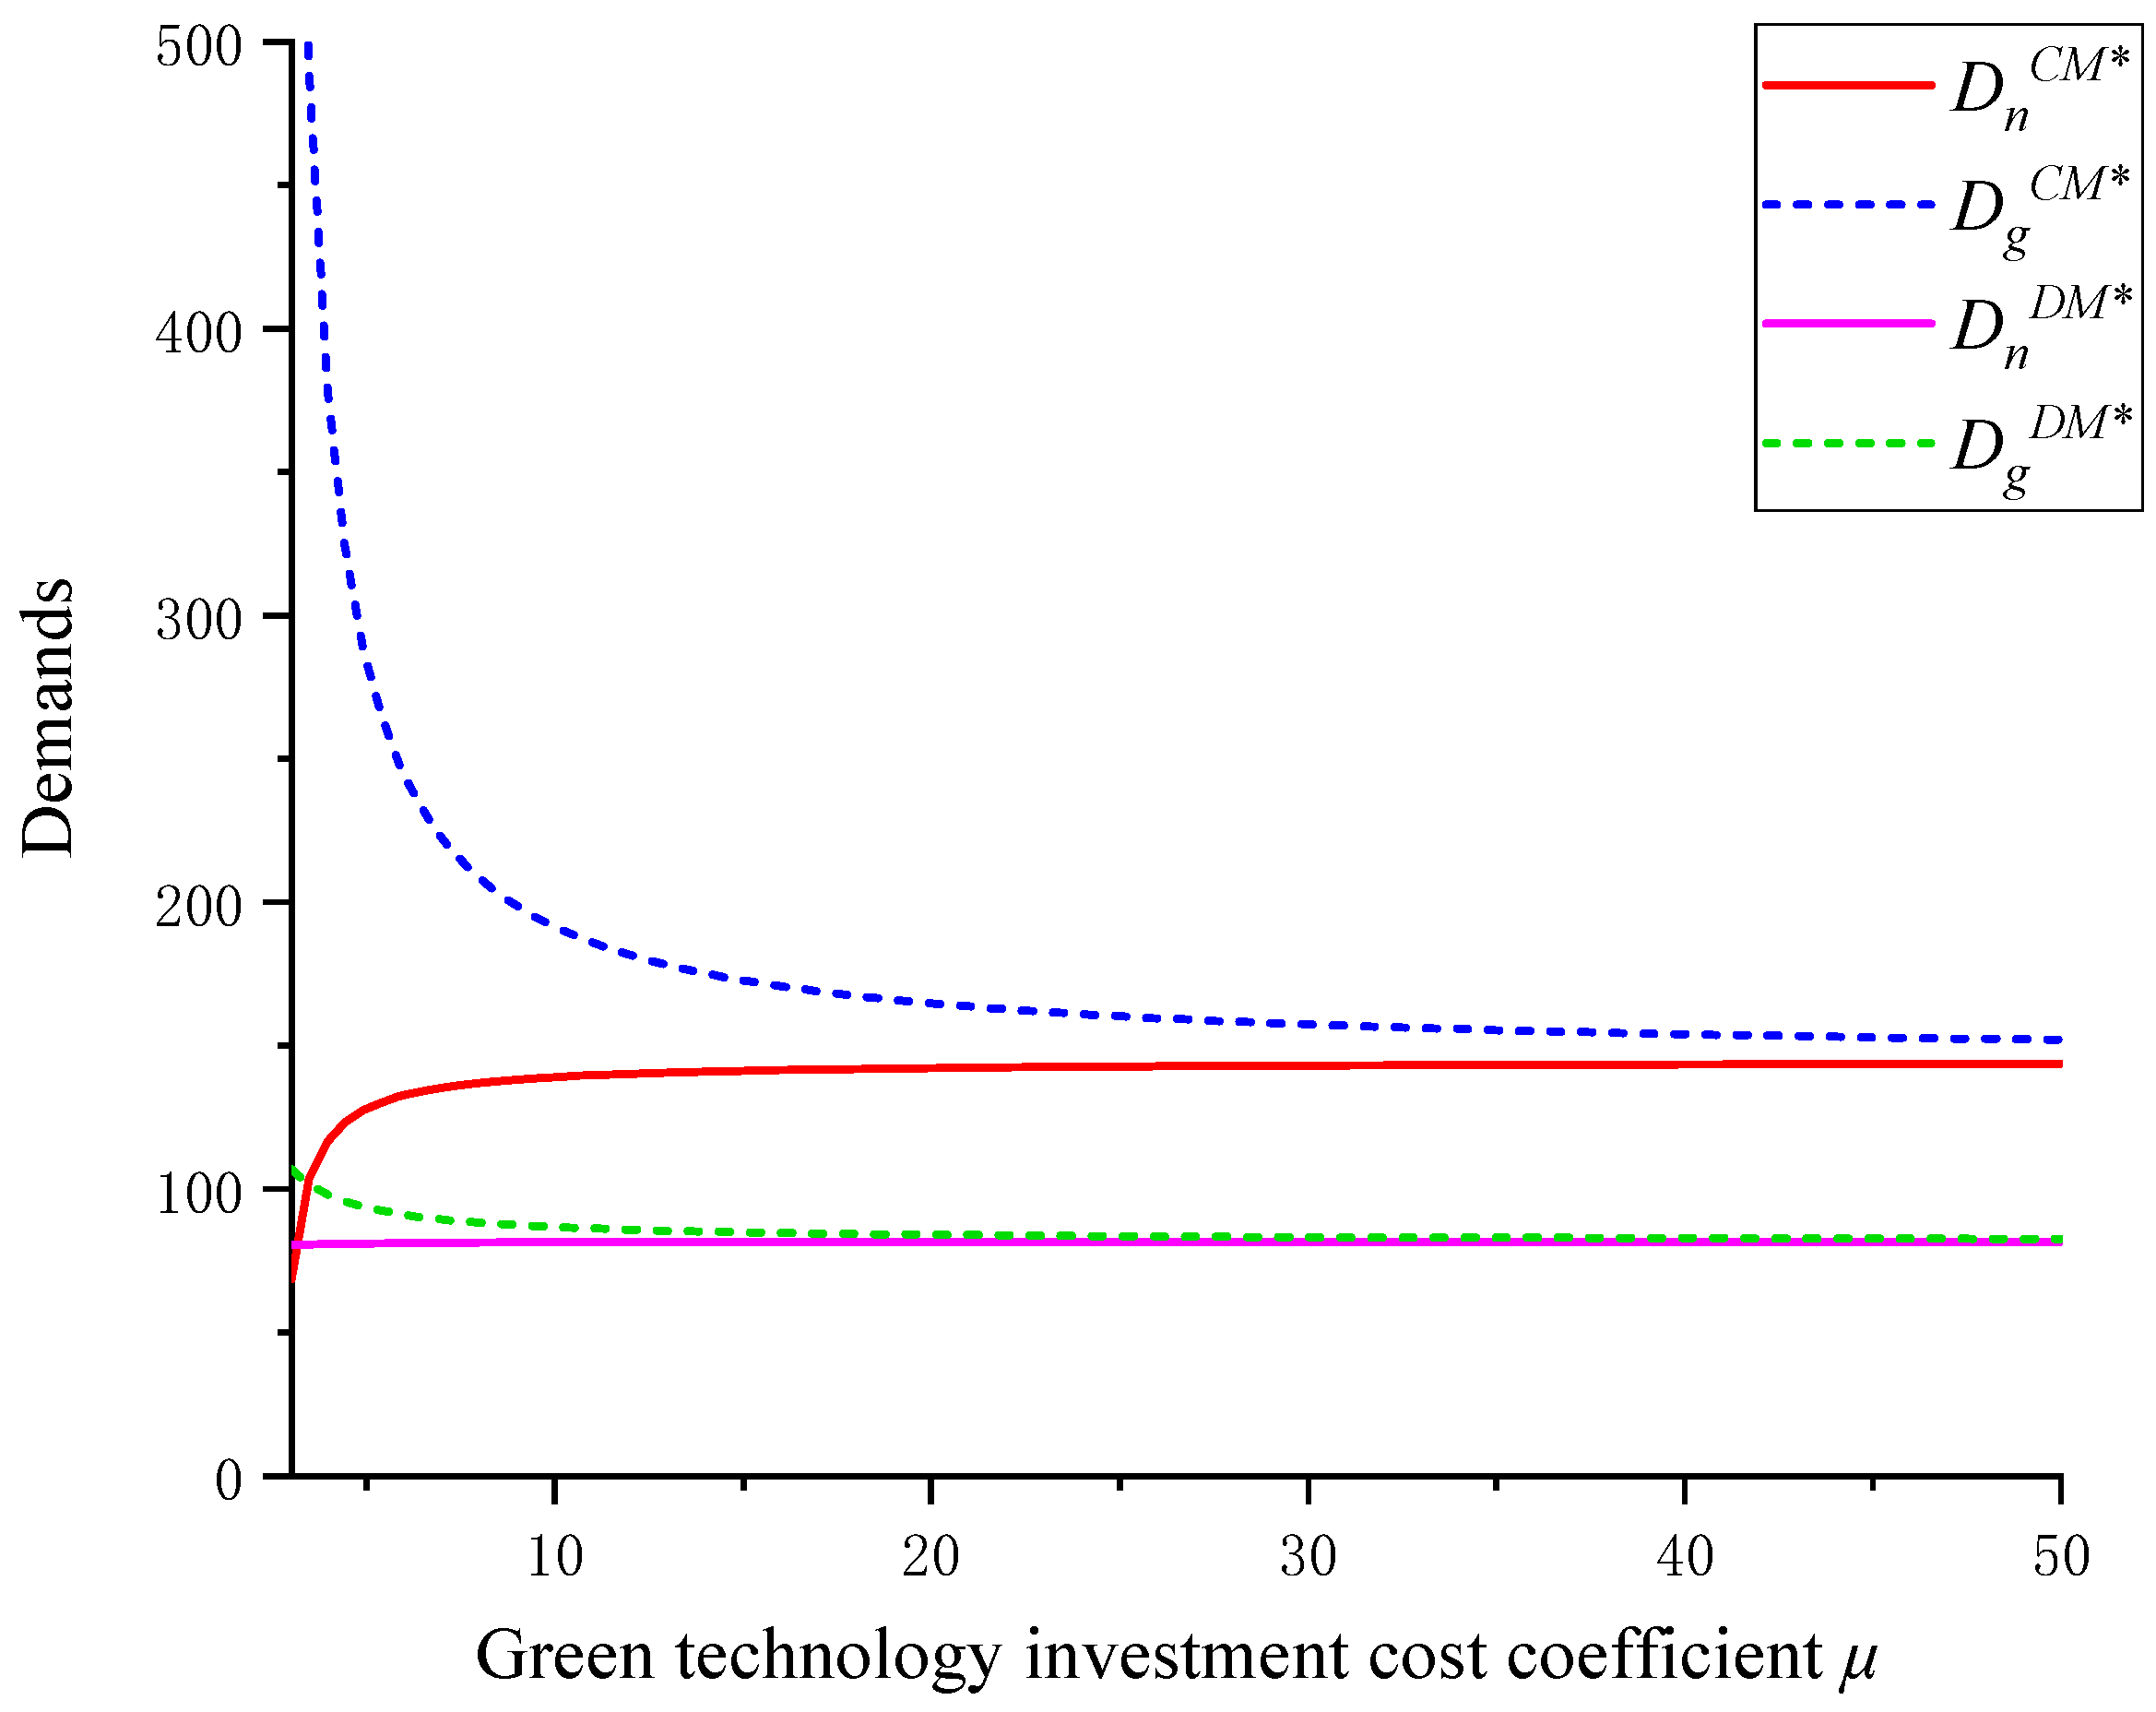
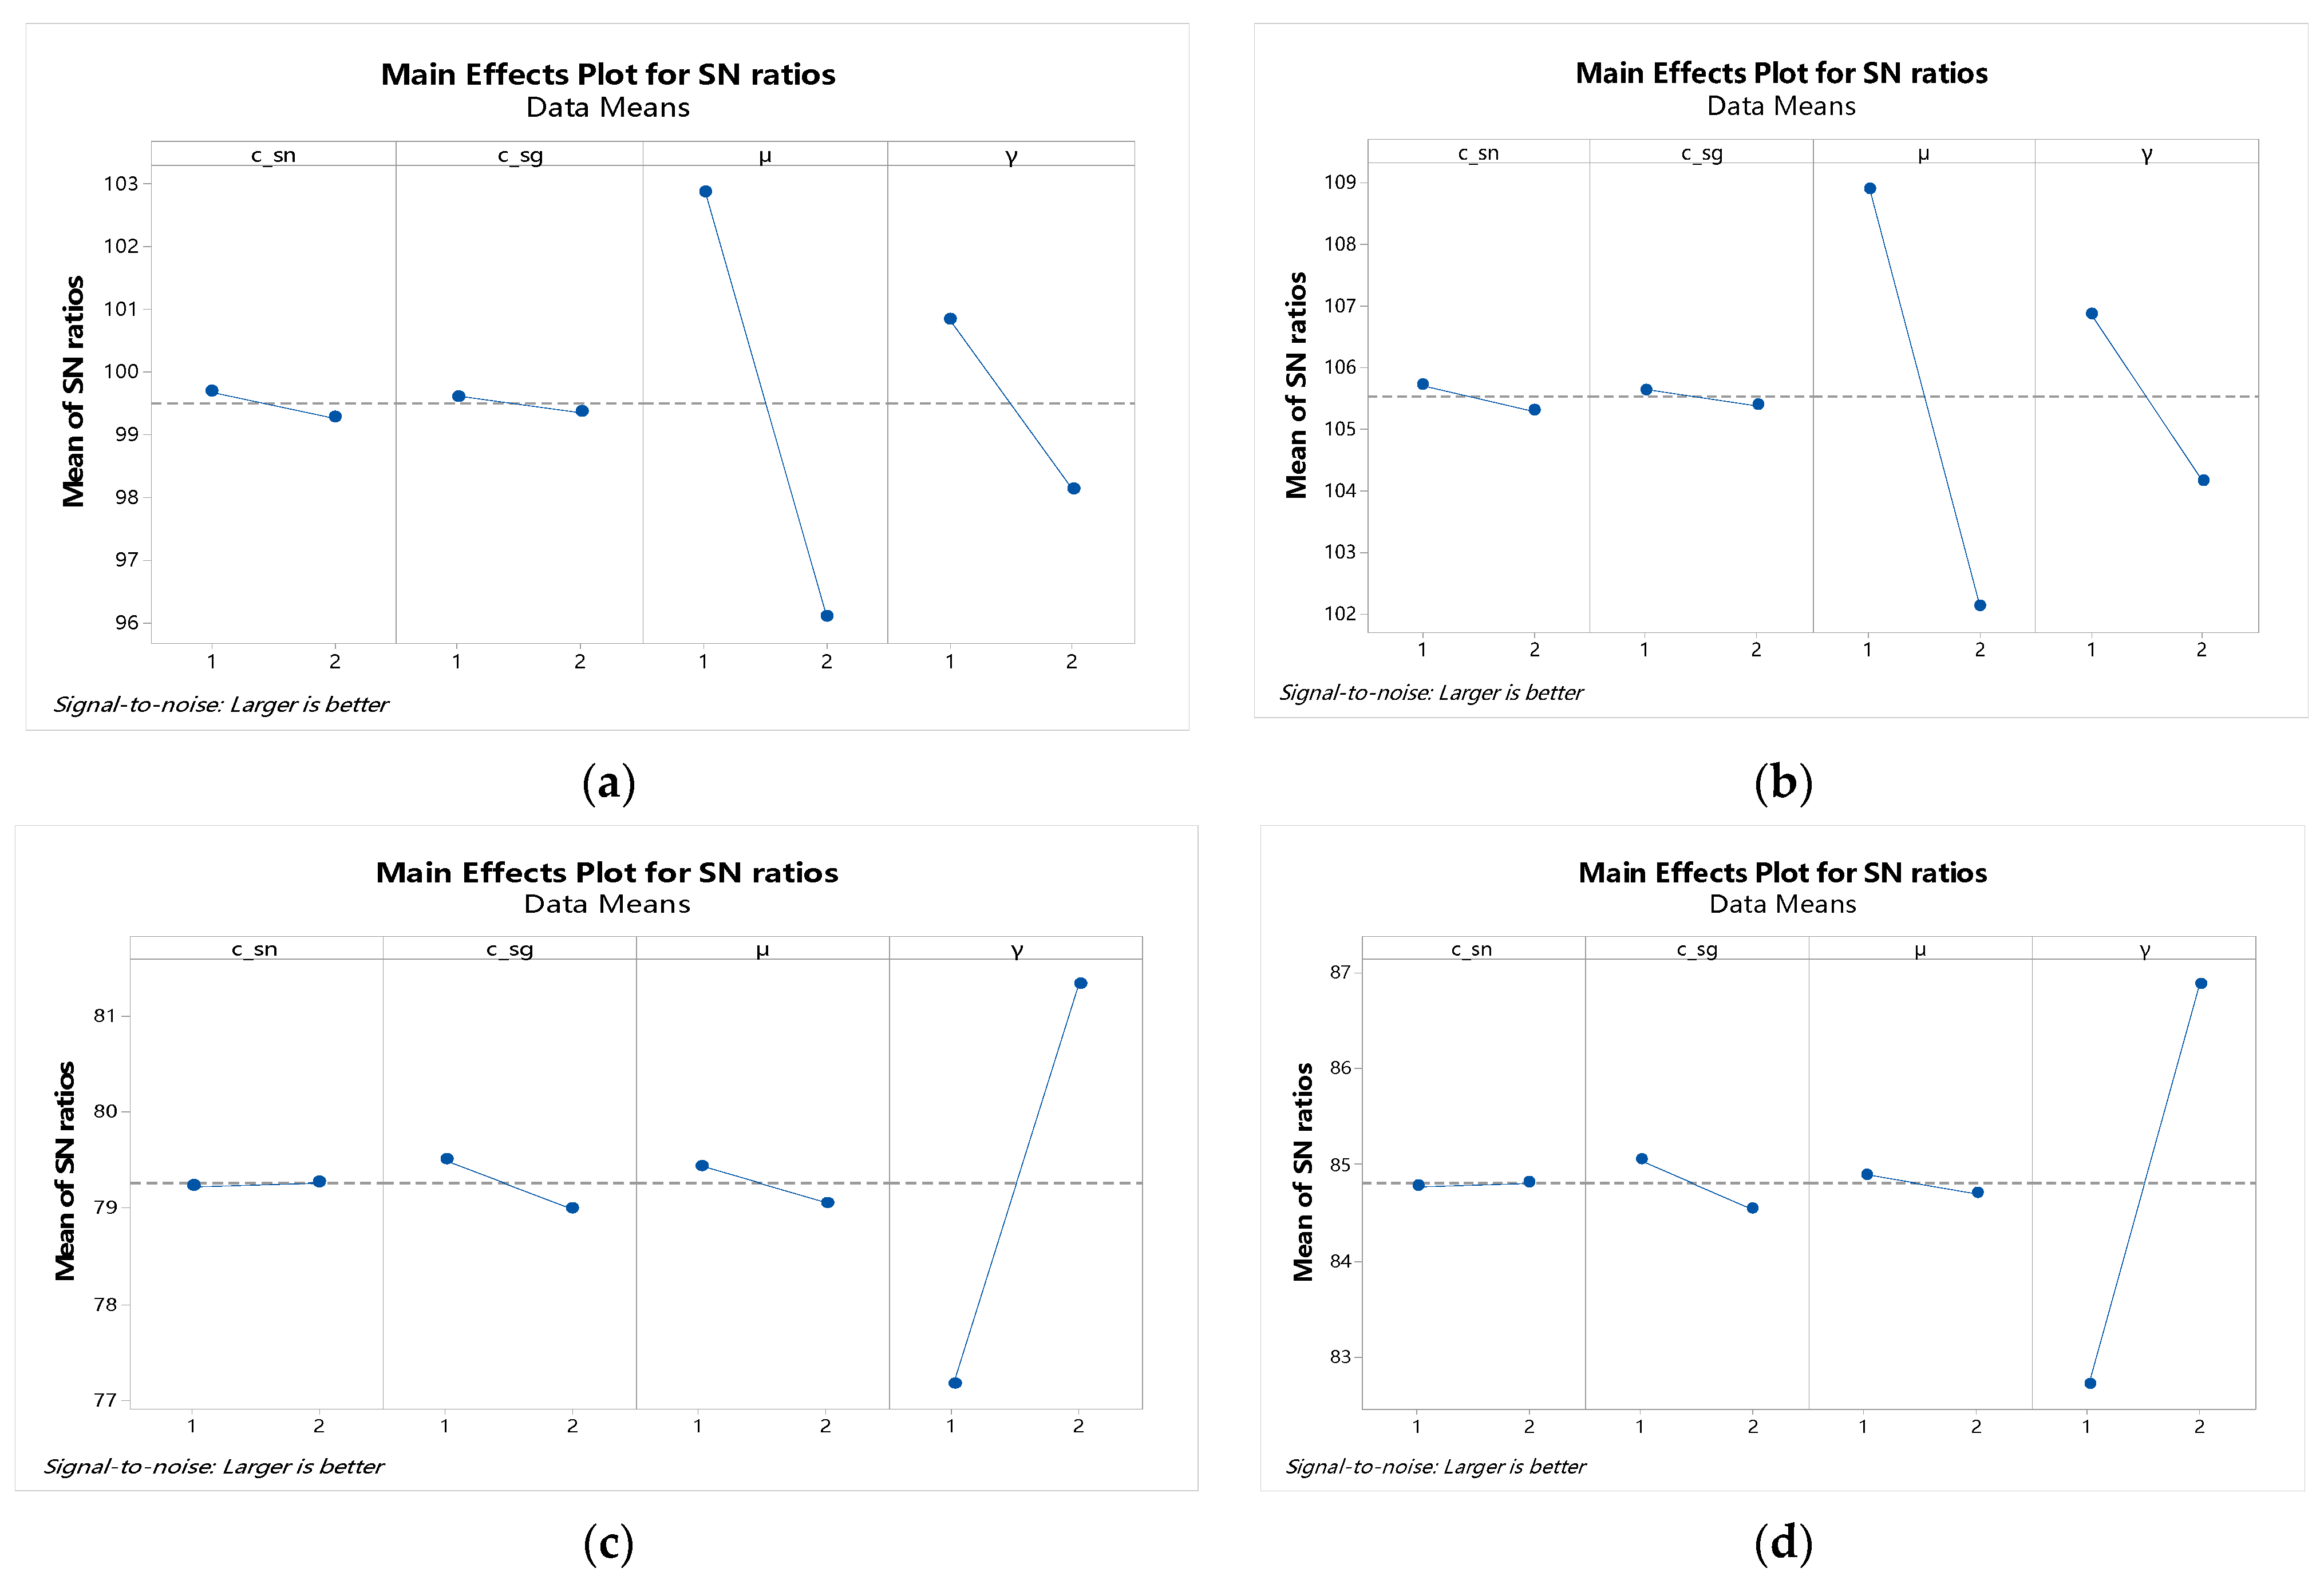
Publisher’s Note: MDPI stays neutral with regard to jurisdictional claims in published maps and institutional affiliations. |
© 2022 by the authors. Licensee MDPI, Basel, Switzerland. This article is an open access article distributed under the terms and conditions of the Creative Commons Attribution (CC BY) license (https://creativecommons.org/licenses/by/4.0/).