Article

What Affects the E-Bicycle Speed Perception in the Era of Eco-Sustainable Mobility: A Driving Simulator Study

by
Sreten Simović
1,
Tijana Ivanišević
2,
Aleksandar Trifunović
3,*,
Svetlana Čičević
3 and
Dragan Taranović
4
1
Faculty of Mechanical Engineering, University of Montenegro, Podgorica 81000, Montenegro
2
Academy of Professional Studies Sumadija, 34000 Kragujevac, Serbia
3
Faculty of Transport and Traffic Engineering, University of Belgrade, 11000 Belgrade, Serbia
4
Faculty of Engineering, University of Kragujevac, 34000 Kragujevac, Serbia
*
Author to whom correspondence should be addressed.
Sustainability 2021, 13(9), 5252; https://doi.org/10.3390/su13095252
Submission received: 9 April 2021 / Revised: 4 May 2021 / Accepted: 4 May 2021 / Published: 7 May 2021
(This article belongs to the Section Sustainable Transportation)

Abstract

:
The increase in the number of electric bicycles worldwide has resulted in a rise in the number of traffic accidents involving e-bicyclists. Previous studies have been based on analyzing the use, advantages and disadvantages of e-bicycles, whereas only a small number of studies have been focused on analyzing the e-bicycle traffic safety, particularly the factors leading to the occurrence of traffic accidents. One of the factors affecting the occurrence of traffic accidents is the incorrect perception of the e-bicycle speed by other traffic participants. To examine the mentioned problem, the authors of this paper conducted an experimental study to determine what affects the e-bicycle speed perception. The experiment included 175 participants, aged 18 to 50. The research was conducted under laboratory conditions using a driving simulator, at different e-bicycle speeds (10 km/h, 20 km/h and 30 km/h), in the situations in which the e-bicyclist was (not) using a reflective vest. The results show statistically significant differences in the e-bicycle speed perception when the e-bicyclist does not use/uses a reflective vest. Besides, the driving licence categories of traffic participants and their driving experience also have a significant impact on the perception of the e-bicycle speed.

1. Introduction

The use of e-bicycles in traffic is growing [1,2,3,4], because they are becoming increasingly popular in the transportation of passengers and goods [3,5,6]. This mode of transport is still in its development stage and is still unknown in many respects. One of the key aspects is the safety of e-bicyclists, which is closely related to the e-bicycle speed perception. So far, there have been a scarce number of studies dealing with the perception of the e-bicycle speed in traffic, whereas no study has analyzed the factors affecting the e-bicycle speed perception.
The existing literature mentions the following advantages of using e-bicycles: travelling longer distances [7,8,9], a larger number of trips [9], faster-travelling speed [7], and decrease of travelling time [8]. The researchers also identified certain disadvantages and obstacles to using e-bicycles: congestions at intersections [10], change of traffic flow dynamics, which results in unpredicted traffic situations [2], compromising traffic safety [7,10] and others.
Dozza et al. [2] stated that there is insufficient knowledge, especially in Europe, regarding the safety of e-bicyclists, their traffic behaviour, as well as the manner of the occurrence of traffic accidents involving e-bicyclists.
Campbell et al. [10] claimed that the unusual behaviour of e-bicyclists leads to the increased number (larger than in the case of traditional bicyclists) of conflict situations with other traffic participants, which might arise due to the incorrect perception (underestimation) of the e-bicycle speed by other traffic participants [1,2]. The incorrect perception (underestimation) of speed is caused by the fact that in the European market most e-bicycles resemble traditional bicycles, so traffic participants have wrong (underestimated) expectations regarding the e-bicycle dynamics [1,2]. In their research, Schleinitz et al. [1] indicated that the incorrect speed perception by other traffic participants can occur in the situations when an e-bicyclist approaches other traffic participants with a seemingly low effort but at a relatively fast speed. Similarly, according to Schleinitz et al. [1], an additional problem which might lead to the incorrect speed perception is comparing bicycles with other vehicles. Namely, larger vehicles and larger objects come before the smaller ones due to the object-size effect.
Researchers dealing with e-cyclist safety, Schleinitz et al. and Cherry came to the conclusion that e-bicycle riders represent a new vulnerable population of road users [1,11]. In the Republic of Serbia, in the country where the research was conducted, out of the total number of people fatally injured in traffic accidents, about 9% are cyclists [12]. Research has shown that e-bike riders are more involved in traffic accidents with “heavy vehicles” (buses and trucks) and a minority with “light vehicles” (passenger vehicles and vans), as opposed to traditional bicycles [11,13]. The study by Rodier et al. showed no significant difference in the type of e-bike collision, compared to traditional bicycles, at low speeds [13]. Cyclists in the country where the study was conducted were most frequently exposed to fatal injuries in side collisions 36% (traffic accidents at intersections, in the city), in catching up traffic accidents 27%, 19% in head-on collisions, and in collisions during comparative driving in 18% of analyzed cases [12,14]. Schleinitz et al. stated that in traffic accidents in which e-bicycles participated, an error of other traffic participants was found (about 70%), which may be related to an inaccurate speed estimate of an e-bicycle [1].
Colours have a significant impact on perception of objects, but they also cause different reactions of the observers [15,16,17]. To improve their conspicuity in traffic, bicyclists should wear reflective vests. Wearing reflective vests by bicyclists is not defined by law in the country where the study was performed (the Republic of Serbia) [18]. There are a small number of bicyclists who use reflective vests [19]. Wood et al. [19] studied the impact of reflective equipment on the conspicuity of cyclists in traffic. The results showed that the bicyclist clothing, bicyclist lights and the age of the bicyclist affected the ability of a driver to recognize bicyclists at night. The drivers perceived the bicyclist at a 19.9 m distance when the bicyclist wore black clothing, at a 38.4 m distance when the bicyclist wore a reflective vest, and at a 117.8 m distance when the bicyclist wore a reflective vest plus ankle and knee reflective markings. The use of a reflective vest and ankle and knee reflectors enhance the conspicuity of the bicyclist in traffic, i.e., they make the bicyclist visible at a 5.9 times larger distance than in the situation when the bicyclist wears black clothing, or at a 3.1 times larger distance than in the case when the bicyclist wears only a reflective vest [19].

Speed Perception (Driving Simulator)
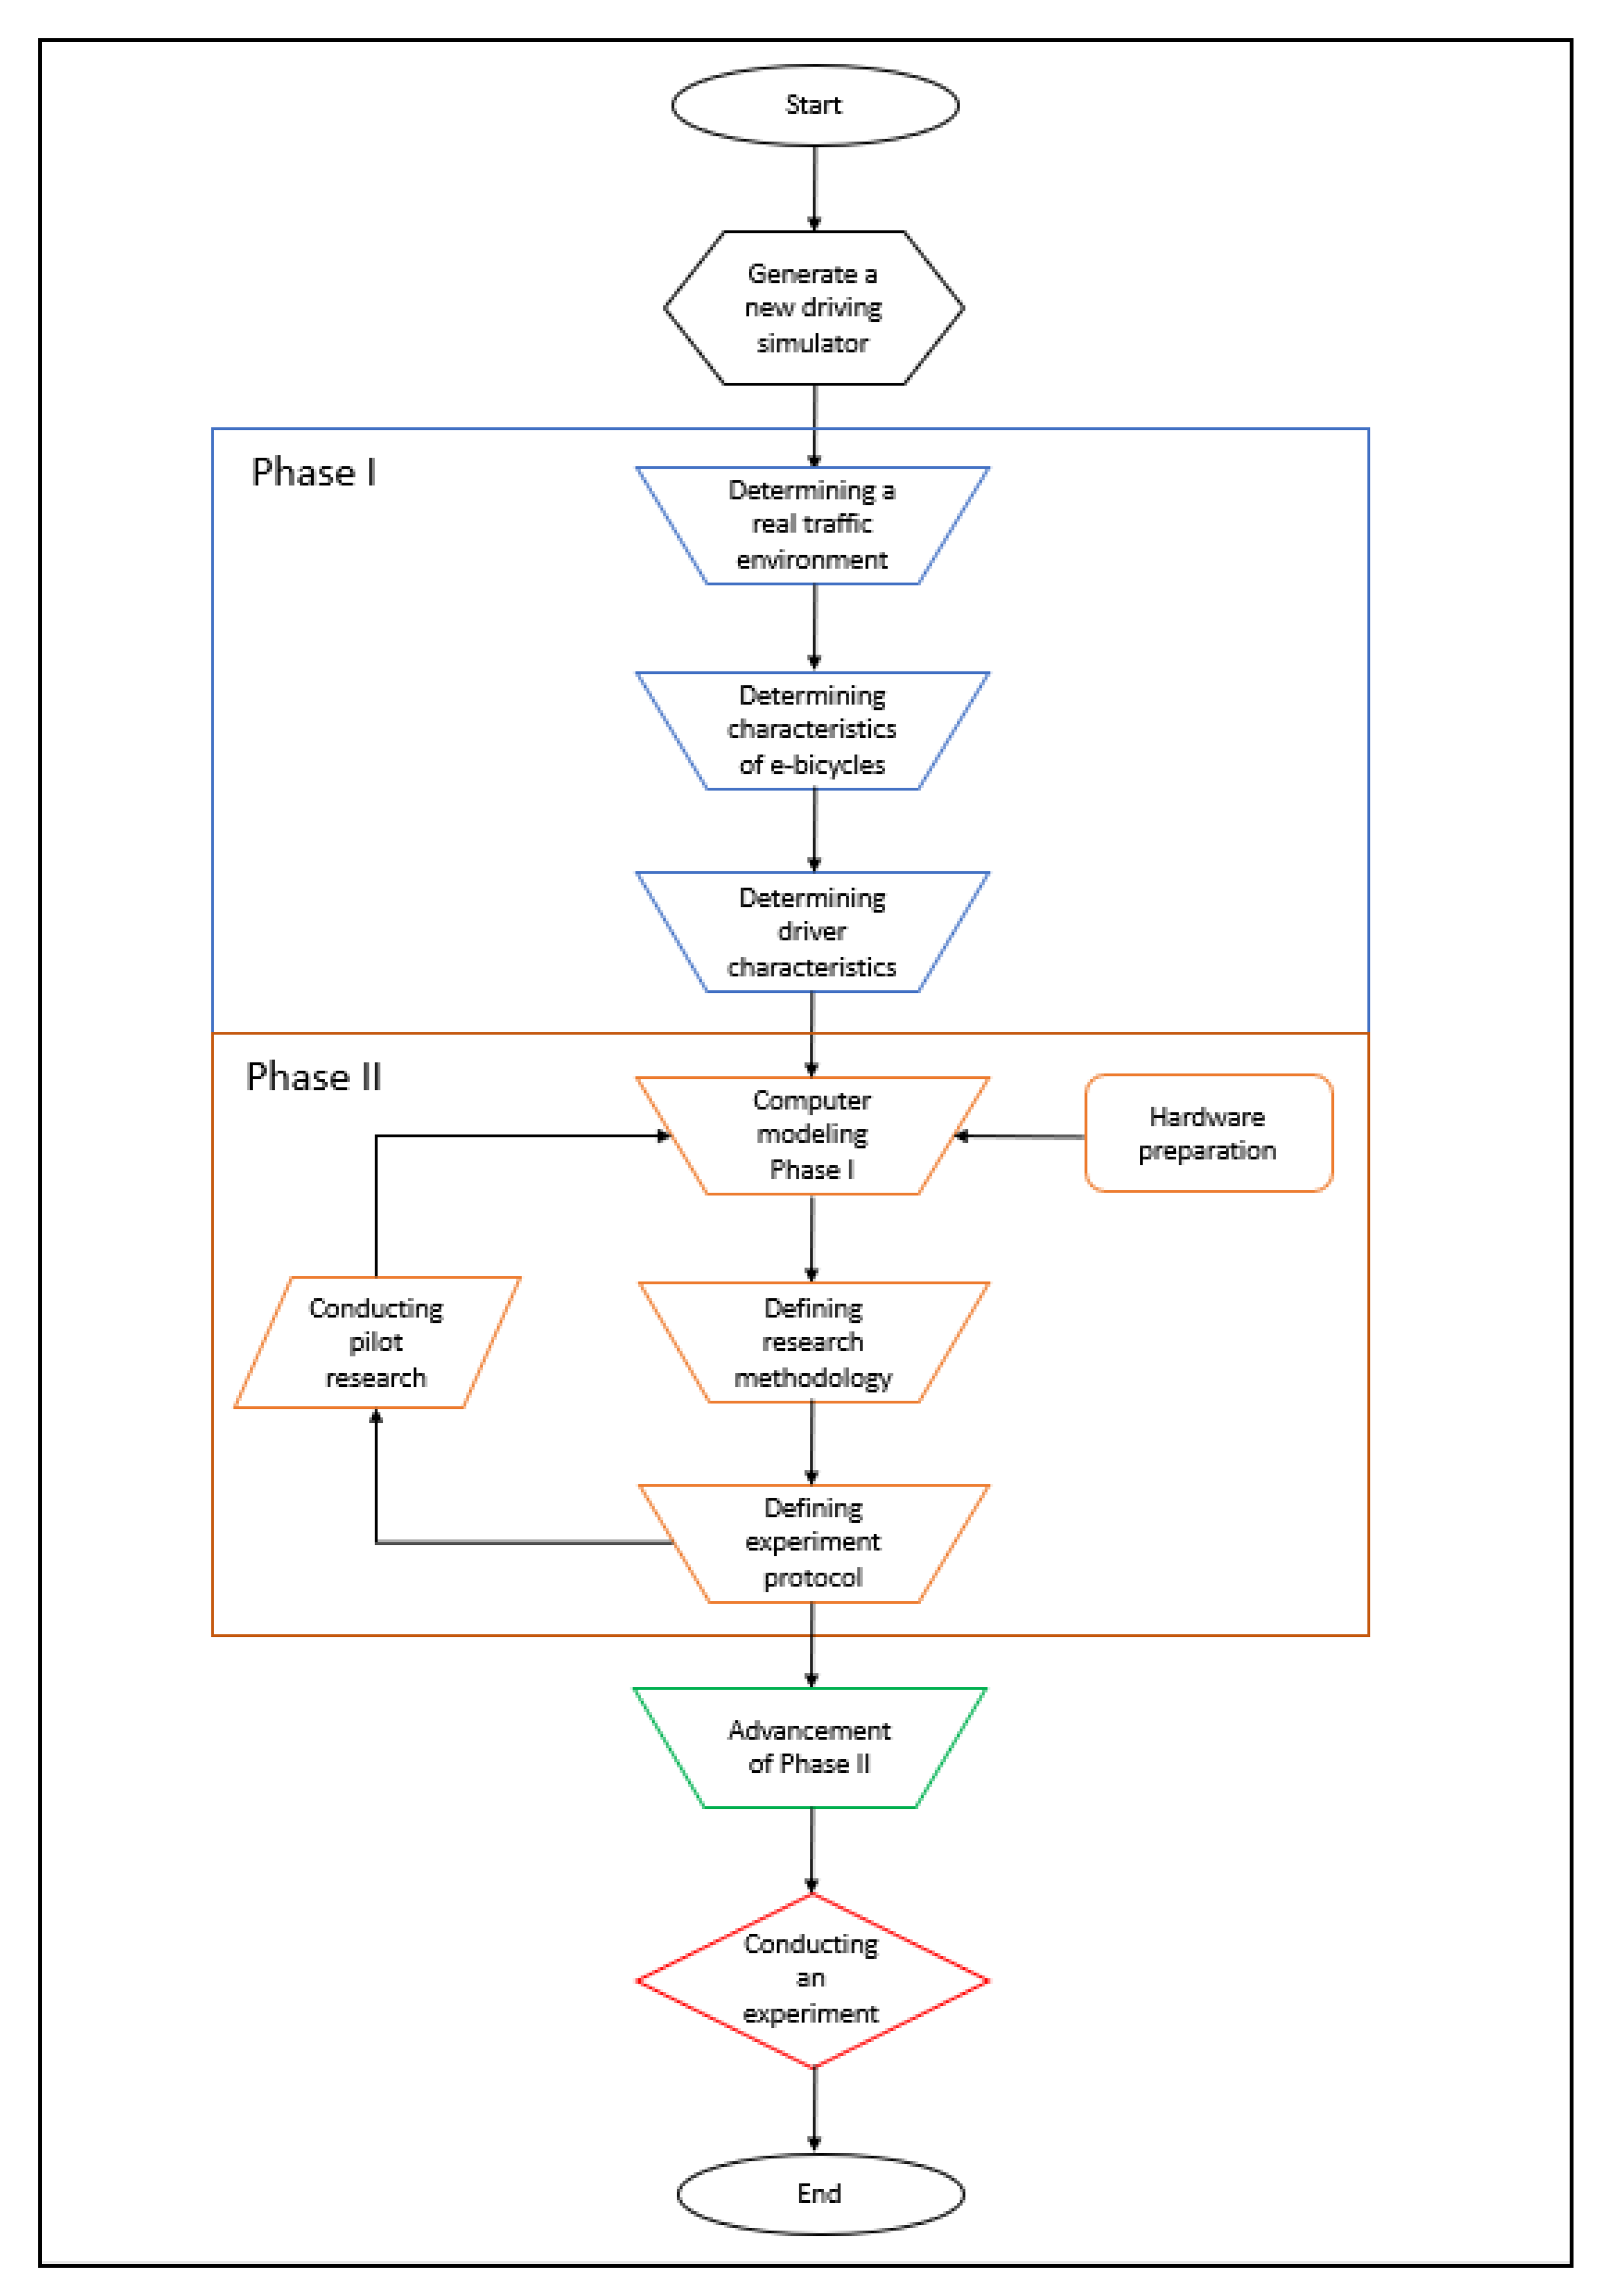
Most driving simulator studies are not related to speed perception but instead focus on a variety of topics including the evaluation of new interfaces for entertainment, hazard perception, etc. Table 1 summarizes the most important characteristics of the papers dealing with speed perception in a driving simulator studies. Studies related to the perception of the passenger vehicle speed in a driving simulator are covered by the following references [20,21,22,23,24,25,26], while studies related to the perception of the bicycle speed were conducted by many authors [27,28,29]. While driving, evaluation of the vehicle speed and inter-vehicle distance are crucial skills and constant demands. Manoeuvring such as braking, obstacle avoidance and overtaking are based on such skills. From the perspective of human perception, these skills rely on the representation of self-motion in the 3D environment and the egocentric distances.
For the reasons mentioned above, this study aims to collect empirical results regarding the impact of various factors on the e-bicycle speed perception, based on the experimental research using a driving simulator.

2. Methods

2.1. Participants

A total of 175 respondents participated in the experiment. The share of male respondents was 66.3%, while the share of female respondents was 33.57%. The analysis of the level of education showed that 70.28% of the respondents had higher education, whereas 29.71% of the respondents were of primary and secondary education. A total of 44% of the respondents lived in the wider urban zone, while 26.29% of the respondents lived in the central urban zone. The experiment included 87.4% of the respondents possessing a driving licence, with the largest number (64.6%) of the respondents possessing a driving licence for passenger cars. The largest percentage of the respondents possessed a driving licence for 10 to 30 years (34.86%). More than a third of the respondents (38.29%) participated in traffic as passenger car drivers daily, while 21.71% of the respondents did not participate in traffic as drivers. Of note, 26.86% of the respondents said that they did not ride bicycles, while 90.76% of the respondents reported not participating in traffic as e-bicyclists. The largest percentage of the respondents (30.86%) participated in traffic as bicyclists fewer than 3 times a month, while as e-bicyclists they participated in traffic between 3 and 5 times a week with the highest percentage (3.43%). The total percentage of the respondents who had participated in a traffic accident was 36.6%, out of which 69.4% of the respondents participated in one traffic accident, 29.7% in two, 9.4% in three, while 1.6% of the respondents had participated in more than 3 traffic accidents. A total of 58.3% of the respondents did not use protective equipment while riding a bicycle or an e-bicycle, whereas 18.9% always used protective equipment.

2.2. Procedure

For the purposes of this experiment, six different conditions of an e-bicycle movement were shown to the respondents on a driving simulator: three conditions in which the e-bicyclist wore a dark T-shirt (and no reflective vest) and three conditions in which the e-bicyclist wore a reflective vest. In both cases, the e-bicycle travelled at the speeds of 10 km/h, 20 km/h and 30 km/h. Traffic on a two-lane carriageway of the undivided road on a sunny day was simulated for the respondents using the driving simulator [23]. The present study focused on the trajectory characteristics of free-flow driving with no roadside interference. The driving environment included usual traffic signalization and vegetation, there were no additional objects added in the traffic scenes to avoid the impact on the participants’ expectations about the movement of the visual targets, and to prevent distraction [23]. In the experiment, the respondents’ task was to estimate the e-bicycle travelling speed under all described conditions. The respondents stated their judgment orally, while an assistant in the experiment entered the spoken values into the appropriate field in an on-line questionnaire [23]. The questionnaire also included the questions related to demographic characteristics (gender, age, education level, place of residence), possession of a driving licence (the category of the driving licence possessed by the respondents, years of possessing the driving licence), frequency of operating the vehicles (motor vehicles, bicycles, e-bicycles), participation in traffic accidents (number of traffic accidents in which the respondents were involved), and protective equipment use [23].

2.3. Experimental Protocol

The experiment was conducted during August and September 2019. The participants did not receive any compensation for participation in the research. Each participant was tested individually and underwent preliminary trials [23]. This procedure was carried out to neutralize the anchoring effect, using counterbalancing. Counterbalancing was accomplished by randomizing the order of presentation of the test stimuli [23]. Each respondent estimated the e-bicycle speed on the simulator for all six situations: three situations when the e-bicyclist did not wear a reflective vest (the e-bicyclist wore a dark T-shirt in this situation) and three situations when the e-bicyclist wore a reflective vest (for the test speeds of 10 km/h, 20 km/h and 30 km/h). The estimation of the e-bicycle speed provided by each respondent was recorded after watching each driving situation on the driving simulator.

2.4. Stimuli

2.4.1. Characteristics of E-Bicycles and the Reflective Vest

E-bicycles—A KTM e-bicycle named “MACINA Moto 11“—were used in the research. The frame of the e-bicycle is grey, made of aluminum, the motor is “Bosch drive unit 36 V–250 W“, the battery “Powerpack 13.8 Ah–500 Wh“, the wheel size 29”. The bicycle has three riding modes: riding without using an electric motor, riding using the electric motor as assistance to pedalling and riding by means of an electric motor. The theoretical maximum speed of this e-bicycle is 45 km/h, while its maximum range is 80 km.
Reflective vest—The test bicyclist wore a fluorescent yellow bicycling vest with silver retroreflective material on the shoulders and front and back totaling about 400 cm2 [19].

2.4.2. E-Bicycle Speeds

Three e-bicycle speeds were selected for the research (10 km/h, 20 km/h and 30 km/h) based on the available studies analyzing the e-bicycle speed in traffic and transport [1,4,26], as well as the practical use of the e-bicycle employed in the research.

2.4.3. Characteristics of the Driving Simulator

To examine the factors affecting the accuracy of the e-bicycle speed perception, an experiment was conducted using a driving simulator [1,2,4,23,30]. The very approach of the experiment, which includes a driving simulator, is an environmentally friendly form of research. The driving simulator incorporates three 4200 plasma displays that give the respondents a 180 horizontal and 50 vertical fields of view of the simulated environment. Each display has a resolution of 1360 × 768 pixels and a refresh rate of 60 Hz [23,30,31,32,33,34,35,36,37,38,39]. It has been found that for the correct speed perception, a horizontal field of view of at least 120° is needed [39]. The driving simulator showed a modeled traffic environment, based on a real city road and the characteristics of the described e-bicycle. The entire ambiance is designed to show the movement of the e-bicycle in traffic in the most realistic way possible. In addition to the visual information, the respondents were also presented with the sound information from the traffic surrounding. Before starting the test, participants were instructed about the use of the equipment inside the driving simulation. The flowchart of the overall driving simulator is graphically presented in Figure 1.

3. Analyses

The data were collected through an on-line questionnaire and then imported in the software package MS Excel 2018. After importing, the data were examined and validated. Next, the statistical analysis of the obtained data was conducted in the software package IBM SPSS Statistics v.22. Normality of distribution was tested by inspection of histograms and the Kolmogorov–Smirnov test. Since the data for all the measured variable distributions were normally distributed, we used parametric methods [23]. The Independent-Samples t-test, Paired-Samples t-test, one One-Way ANOVA and Bonferroni post hoc tests were used to assess the significance of differences.
The null hypothesis (H0) was: There is no statistically significant difference between the perceptions of the e-bicycle speed. The alternative hypotheses (Ha) were:
Hypothesis 1 (H1).
There are statistically significant differences in the e-bicycle speed perception when the e-bicyclist wears/does not wear a reflective vest.
Hypothesis 2 (H2).
There are statistically significant differences in the e-bicycle speed perception depending on gender differences.
Hypothesis 3 (H3).
There are statistically significant differences in the e-bicycle speed perception depending on the category of the driving licence.
Hypothesis 4 (H4).
There are statistically significant differences in the e-bicycle speed perception depending on the impact of driving experience.
The threshold for the statistical significance (a) was set to 5%. Consequently, if probability (p) is smaller or equal to 0.05, H0 is rejected, and Ha is accepted. On the contrary, if p > 0.05, H0 is not rejected. The Bonferroni post hoc test was used for the additional comparison between groups.

4. Results

This section provides an analysis of the experimental results to show the potential differences in the respondents’ perceptions of the e-bicycle speeds.

4.1. Estimation of the E-Bicycle Speed

Figure 2 shows the descriptive statistics of the perception of the e-bicycle speed depending on whether the driver uses a reflective vest or not. The errors in the estimation of the e-bicycle speed increase with the increase of the analyzed speed. The higher the e-bicycle speed leads to the rise of the standard deviation values. The results show that the respondents’ estimations of the e-bicycle speed were more accurate at higher speeds (20 and 30 km/h) when the e-bicyclist wears the reflective vest (Table 2).
The mean errors (deviations from the actual e-bicycle speed) in the estimation of the e-bicycle speed are shown in Figure 3. It can be seen that the mean error is lower when the respondents observed the e-bicyclist using a reflective vest in the situation when the e-bicycle travelled at the speeds of 20 and 30 km/h (Table 3).
The results of the Paired Sample t-test show statistically significant differences in accuracy of e-bicycle speed perception at speeds of 20 km/h (t = −4.2; p = 0.000) and 30 km/h (t = 2.925; p = 0.004) when using versus not using a reflective vest. In the situation when the e-bicyclist does not use a reflective vest, the respondents underestimate the 20 km/h speed (M = 17.99; SD = 7.825), while they overestimate this speed (M = 20.63; SD = 9.68) when the e-bicyclist uses a reflective vest. In both analyzed situations, the respondents underestimate the speed of 30 km/h (when the e-bicyclist uses a reflective vest M = 26.01; SD = 10.288 and when the e-bicyclist does not use a reflective vest M = 24.37; SD = 11.888), while estimating the speed more accurately when the e-bicyclist wears a reflective vest.

4.2. Gender Differences in the Estimation of the E-Bicycle Speed

The Independent Samples t-test was used to examine the differences in estimation of the e-bicycle speed depending on the respondents’ gender, as well as with respect to reflective vest (not) using. There were no significant differences in the e-bicycle speed perception depending on the respondents’ gender for all the tested speeds and in both tested conditions.

4.3. Impact of the Driving Licence Category on the Estimation of the E-Bicycle Speed

The results of the One-Way ANOVA analysis show a statistically significant difference between the drivers with different driving licence categories for the 30 km/h speed when the e-bicyclist uses a reflective vest (F = 2.554; p = 0.041) and when the e-bicyclist does not wear a reflective vest (F = 2.493; p = 0.045).
Post hoc tests show that the 30 km/h speed is estimated with the smallest error by the drivers possessing the driving licence for heavy vehicles (M = 31.22) when the e-bicyclist does not wear a reflective vest, while it is estimated with the largest error by motorcycle drivers (M = 27.67).
In the cases when the e-bicyclist wears a reflective vest, the speed of 30 km/h is most accurately estimated by the drivers possessing the driving licence for heavy vehicles (M = 32.39), while it is estimated least accurately by motorcycle drivers (M = 26.67).
Heavy vehicle drivers estimate the e-bicycle speed with the smallest error when the e-bicyclist does not use a reflective vest (M = 31.22) while motorcycle drivers estimate the e-bicycle speed with the largest error when the e-bicyclist does not use a reflective vest (M = 27.67) (Figure 4).

4.4. Impact of Driving Experience on the Estimation of the E-Bicycle Speed

The e-bicycle speed when the e-bicyclist uses/does not use a reflective vest was estimated by drivers with different driving experience (drivers with up to three years of driving experience, 3 to 10 years, more than 30 years of driving experience and the respondents not possessing a driving licence).
The results of the One-Way ANOVA analysis show statistically significant differences in 30 km/h speed (F = 2.477; p = 0.046) estimations for drivers with different driving experience when the e-bicyclist does not wear a reflective vest. The participants who did not possess a driving licence made the least error in speed estimation (M = 28.5), while the drivers with more than 30 years of driving experience show the worst estimation (M = 18.53). It can be seen that the mean error in the speed estimation increases with driving experience of the respondents (Figure 5).

5. Discussion

The results of the experiment obtained and presented in this study cause considerable concern. The alternative hypotheses H1, H3, and H4 are accepted, while the alternative hypothesis H2 is rejected. The results indicate that, at higher e-bicycle speed, errors in e-bicycle speed perception were greater. A large number of traffic accidents occur due to the errors in the estimation of the e-bicycle speed [2]. The research results show that the probability of the occurrence of traffic accidents is higher if the e-bicycle speed is faster [2]. If a traffic accident involving an e-bicycle and a motor vehicle occurs at faster speeds, the bicyclist’s injuries will be more serious, as confirmed in the study by Dozza et al. [2]. The respondents underestimate the e-bicycle speed at faster-analyzed speeds (for the 30 km/h speed: when the e-bicyclist wears a reflective vest M = 26.01; SD = 10.288 and when the e-bicyclist does not wear a reflective vest M = 24.37; SD = 11.888, and for the 20 km/h speed: when the e-bicyclist does not use a reflective vest M = 17.99; SD = 7.825). The results of the study are in accordance with the findings of Dozza et al. [2,40] and Schleinitz et al. [1], which state that traffic participants have wrong expectations regarding the e-bicycle dynamics, which leads to underestimating the e-bicycle speed and thus endangering traffic safety.
The results of this paper show that using a reflective vest has a positive impact on the estimation of the e-bicycle speed, particularly at faster speeds (20 km/h and 30 km/h). In other words, the use of a reflective vest enables the perception of the e-bicycle speed with smaller errors.
Furthermore, the results show that there are statistically significant differences between the drivers possessing different driving licence categories for the 30 km/h speed (when the e-bicyclist wears a reflective vest (F = 2.554; p = 0.041) and when the e-bicyclist does not wear a reflective vest (F = 2.493; p = 0.045)). Heavy vehicle drivers perceive the e-bicycle speed with the smallest error (when the e-bicyclist does not use a reflective vest (M = 31.22) and when the e-bicyclist uses a reflective vest (M = 32.39)). Motorcycle drivers estimate the e-bicycle speed with the largest error (when the e-bicyclist does not use a reflective vest (M = 27.67) and when the e-bicyclist uses a reflective vest (M = 26.67)). The study results indicate that professional drivers (probably due to their experience of driving at a wide range of speeds) estimate the e-bicycle speed more accurately than other driver categories. On the other hand, motorcycle drivers (as one of the most endangered categories of traffic participants) estimate the e-bicycle speed least accurately, so this participant category should be particularly focused on and educated. This result can be connected with the results of study [41] stating that motorcycle drivers drive faster, on average, than passenger car drivers and that extreme speeding is recorded 2.3 times more often by motorcyclists than by passenger car drivers, which can be the reason for the incorrect perception of the e-bicycle speed. Therefore, errors in the perception of the e-bicycle speed can occur due to the motorcyclists “not being accustomed” to the e-bicycle speed.
The analysis of the e-bicycle speed perception based on driving experience shows that the respondents not possessing a driving licence have the smallest error (M = 28.5), while the drivers with more than 30 years of driving experience have the poorest speed estimation (M = 18.53). Namely, in this research, the respondents not possessing a driving licence are young people, used to e-bicycle presence, who have had the opportunity to encounter and try riding an e-bicycle. Furthermore, in the country where the research was performed, educational measures are most frequently conducted among young people, to raise their awareness and safe participation in traffic. A potential problem revealed in the study is related to the errors in estimating the speed by drivers with more than 30 years of driving experience. A possible cause of these errors might be the fact that these respondents are not accustomed to the driving simulator, as well as the fact that older drivers have not encountered e-bicycles in traffic and are used to seeing traditional bicycles. They are aware of the expected speed of a traditional bicycle but they are not conscious of the fact that e-bicycles can travel at considerably faster speeds than traditional bicycles.

6. Conclusions

Based on the data collected and analyzed, the conclusions of this research are as follows:
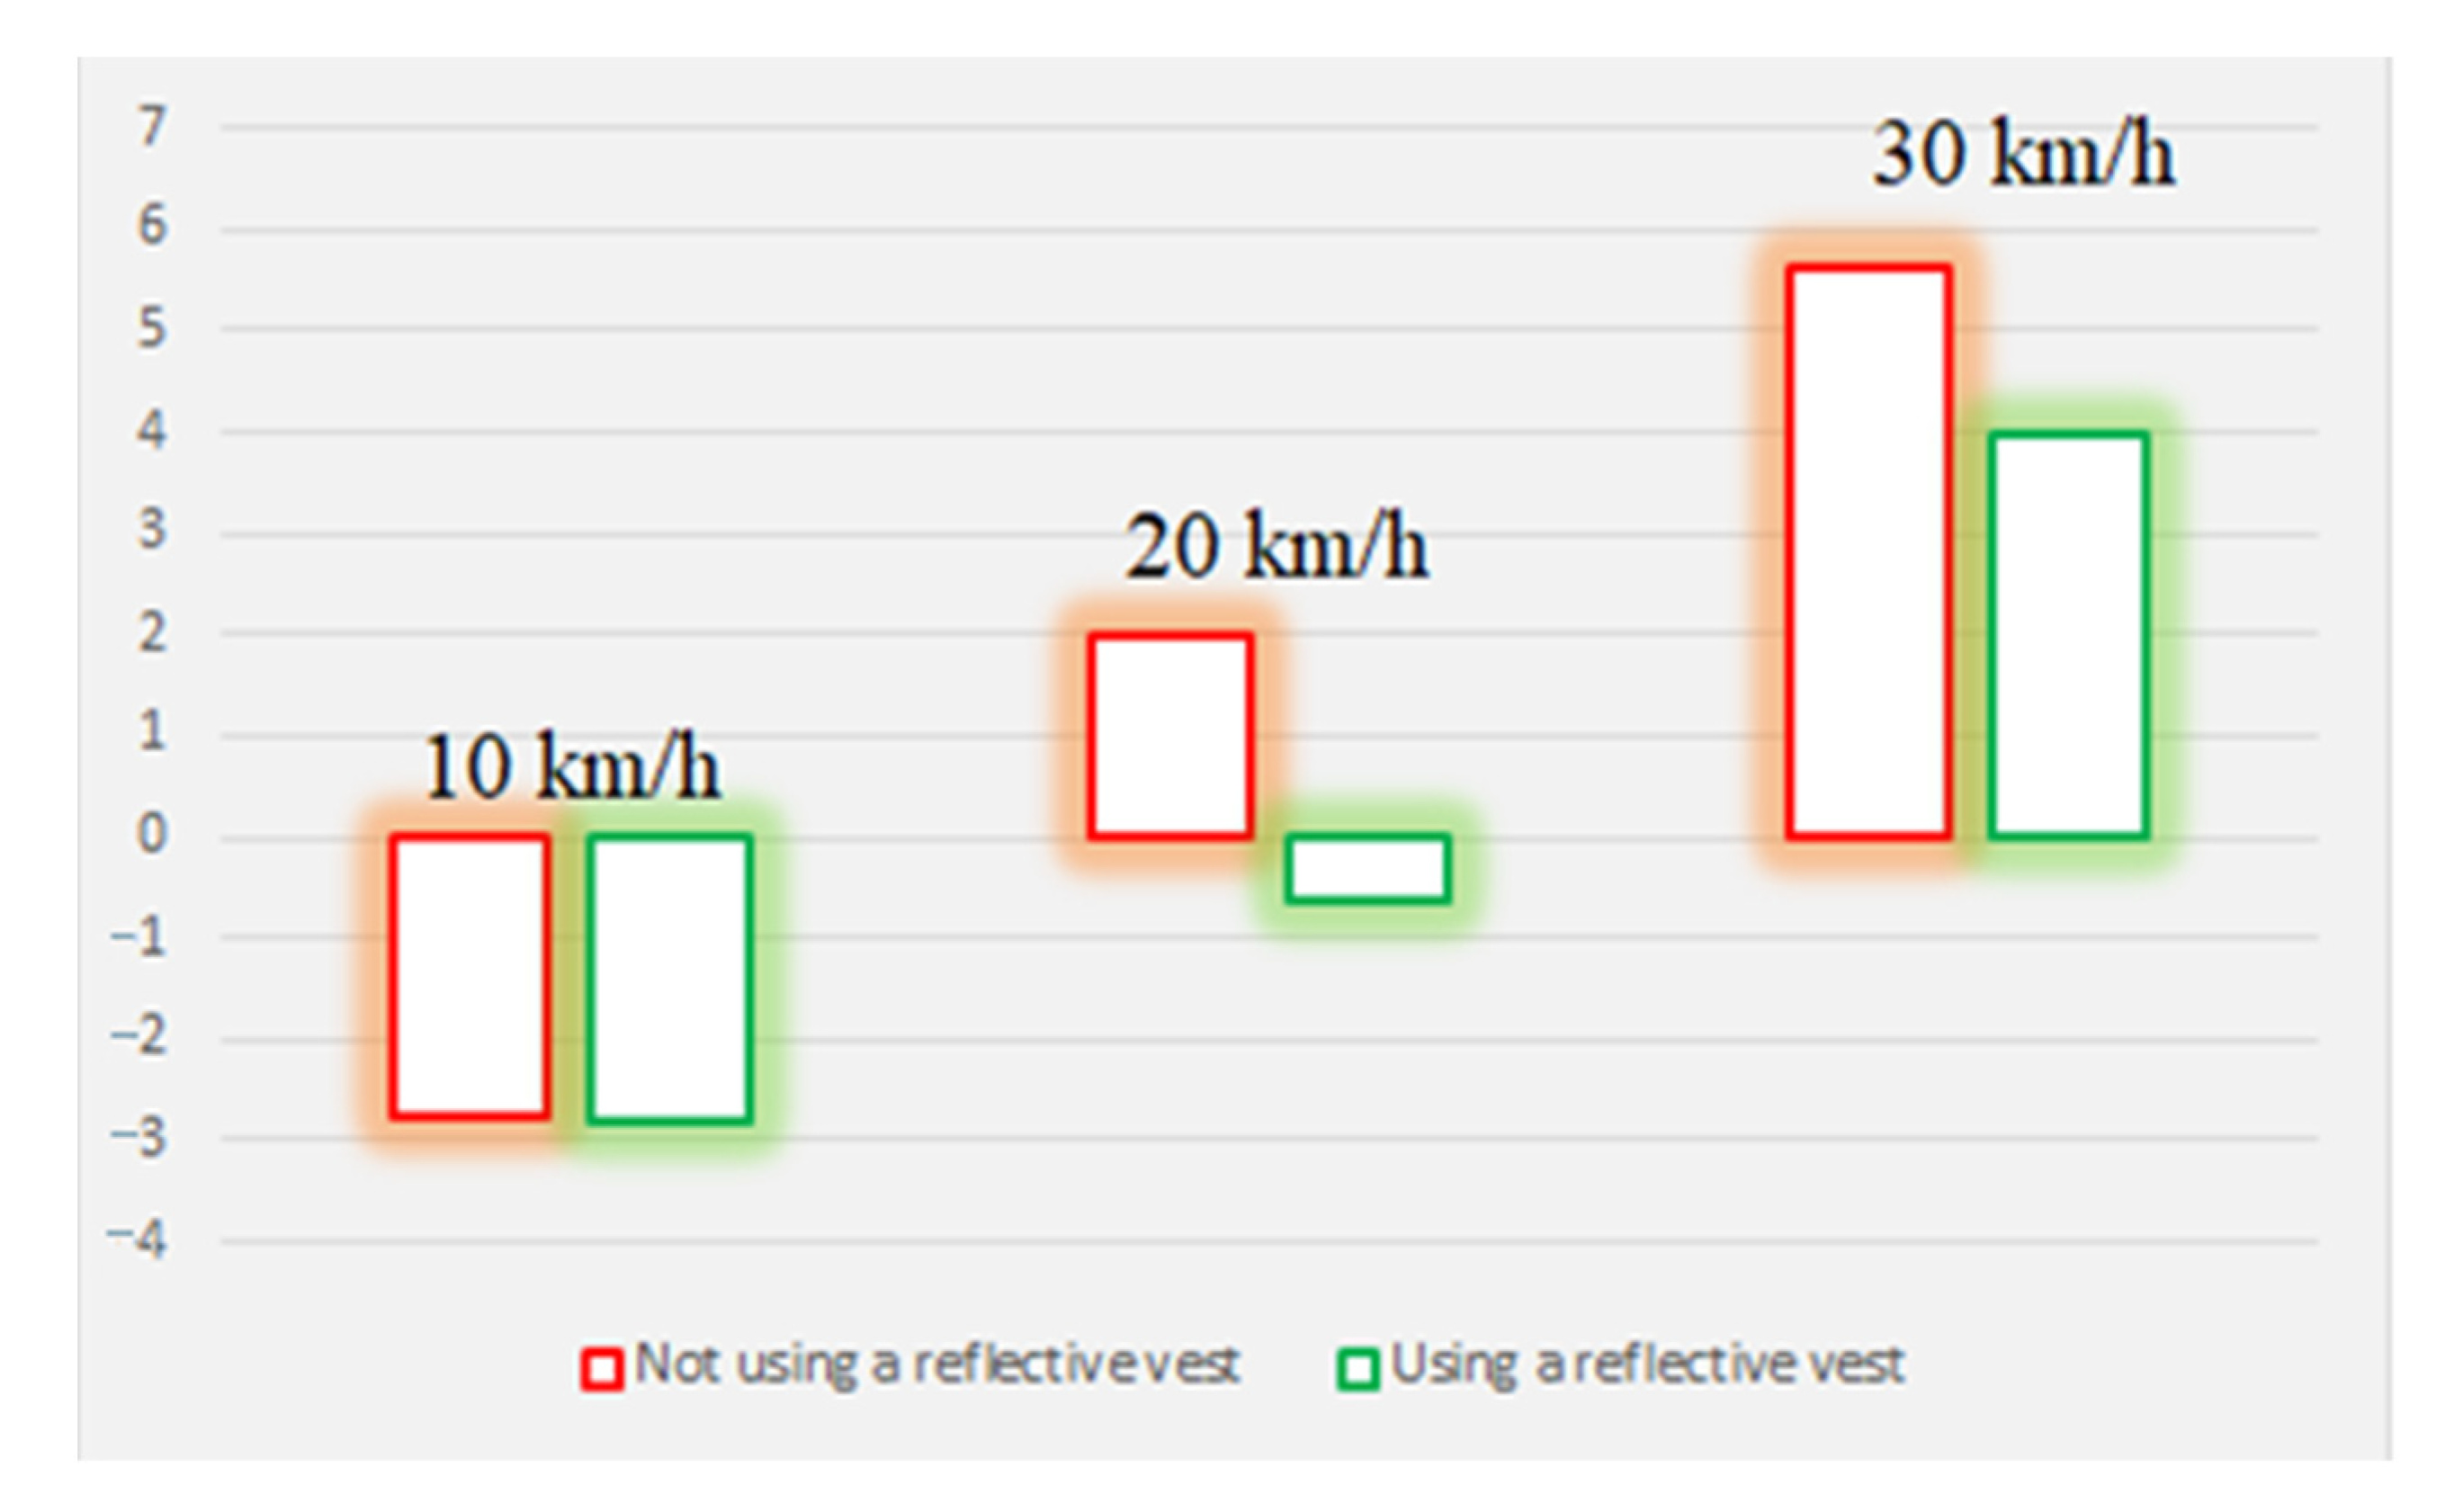
  • The respondents underestimate the e-bicycle speed at the speeds of 20 km/h and 30 km/h and they overestimate it at the 10 km/h speed in both tested conditions;
  • Errors in the estimation of the e-bicycle speed increase with the (rise of the) analyzed speed;
  • The respondents make minor errors when estimating the e-bicycle speed in the cases when the e-bicyclist uses a reflective vest, and larger errors when the e-bicyclist does not use a reflective vest;
  • There are statistically significant differences in the perception of the e-bicycle speed of 20 km/h (t = −4.2; p = 0.000) and 30 km/h (t = 2.925; p = 0.004) when the e-bicyclist uses/does not use a reflective vest;
  • There are no statistically significant differences in the estimation of the e-bicycle speed according to the respondent’s gender for all the tested speeds and in both tested conditions;
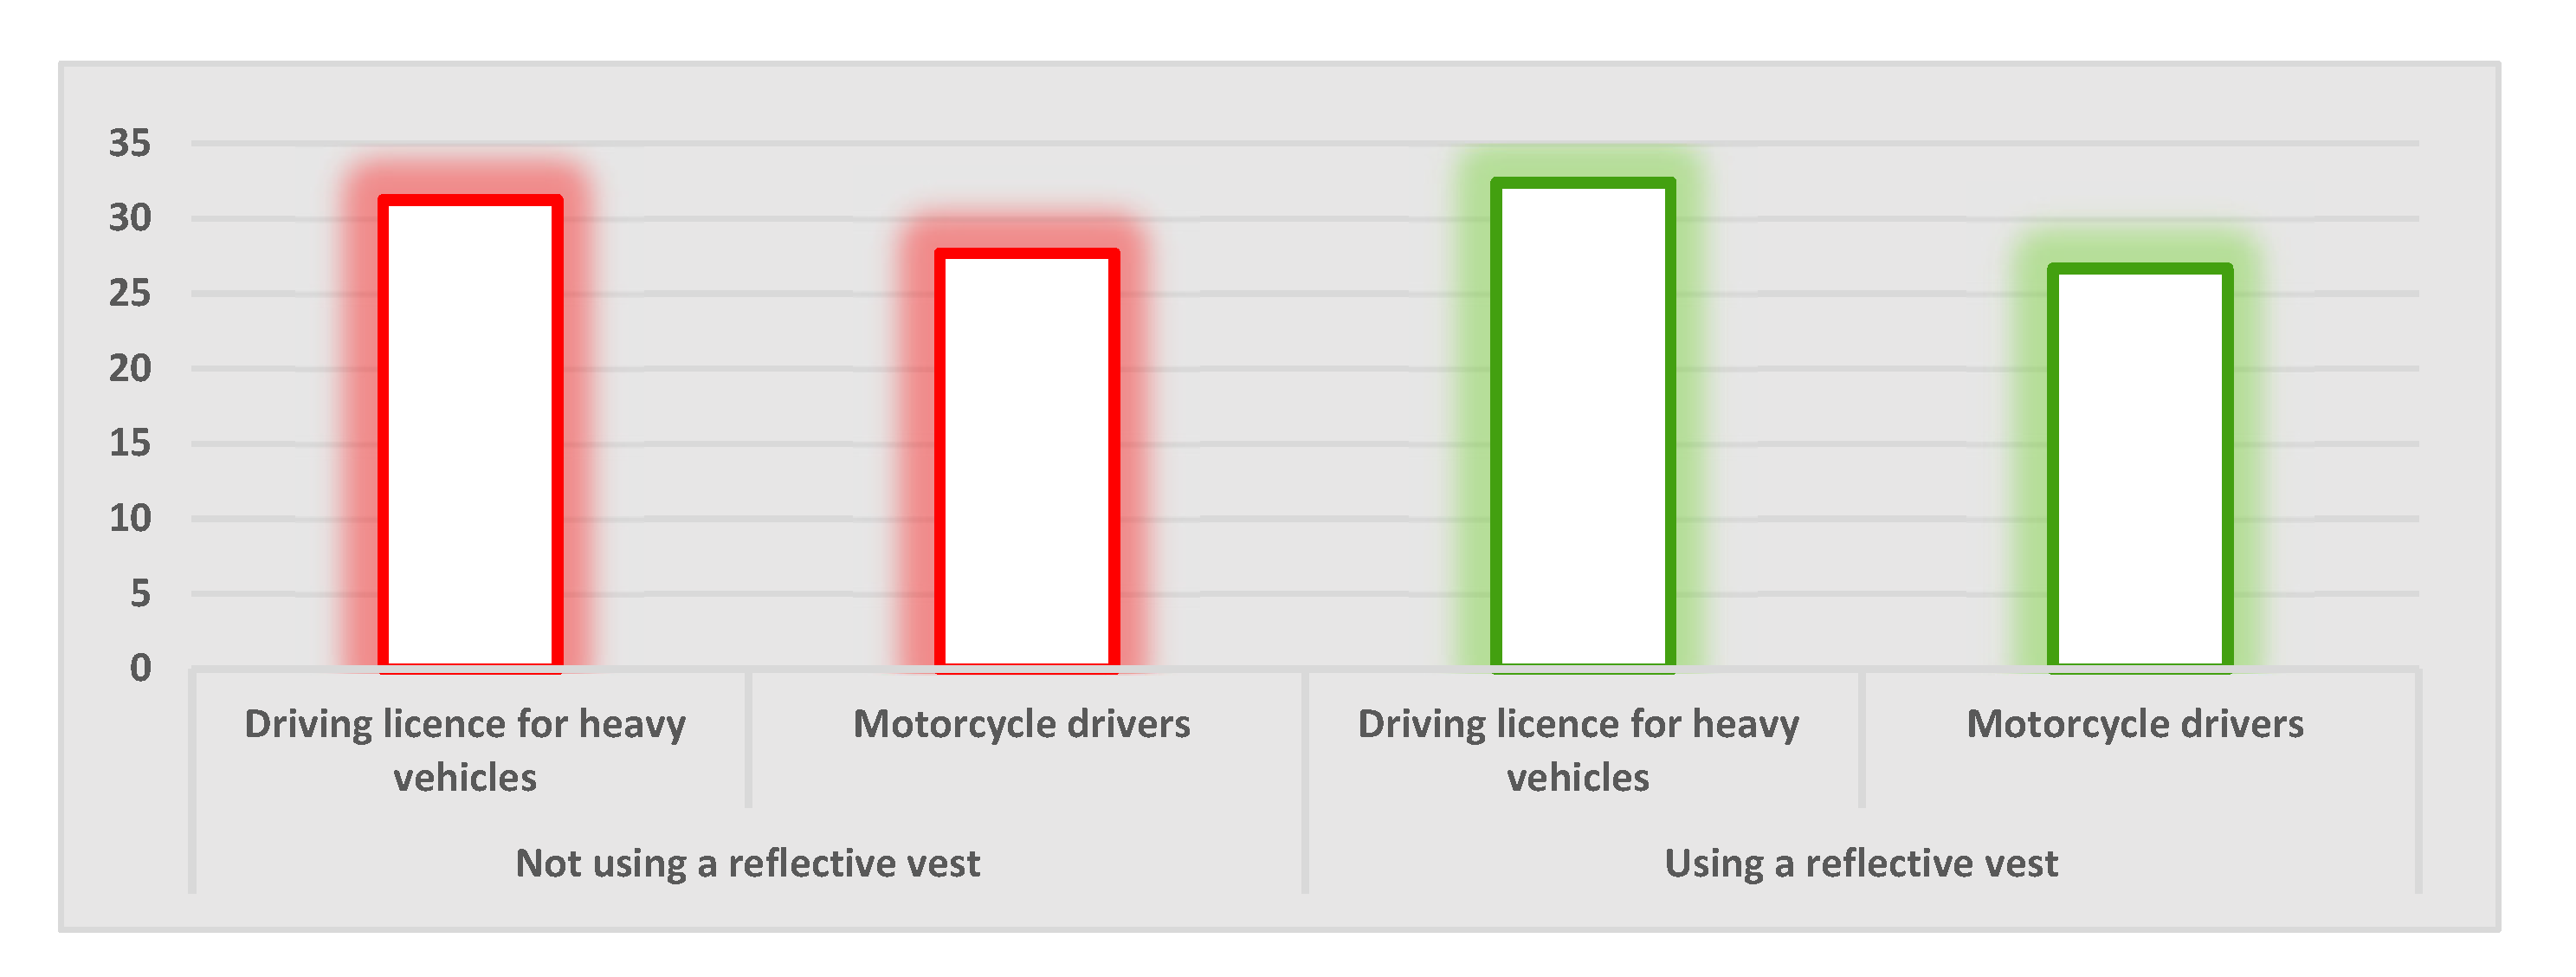
  • There are statistically significant differences between drivers with different driving licence categories for the speed of 30 km/h (when the e-bicyclist uses a reflective vest F = 2.554; p = 0.041 and when the e-bicyclist does not use a reflective vest F = 2.493; p = 0.045). The e-bicycle speed of 30 km/h is most accurately estimated by heavy vehicle drivers, while least accurately by motorcycle drivers;
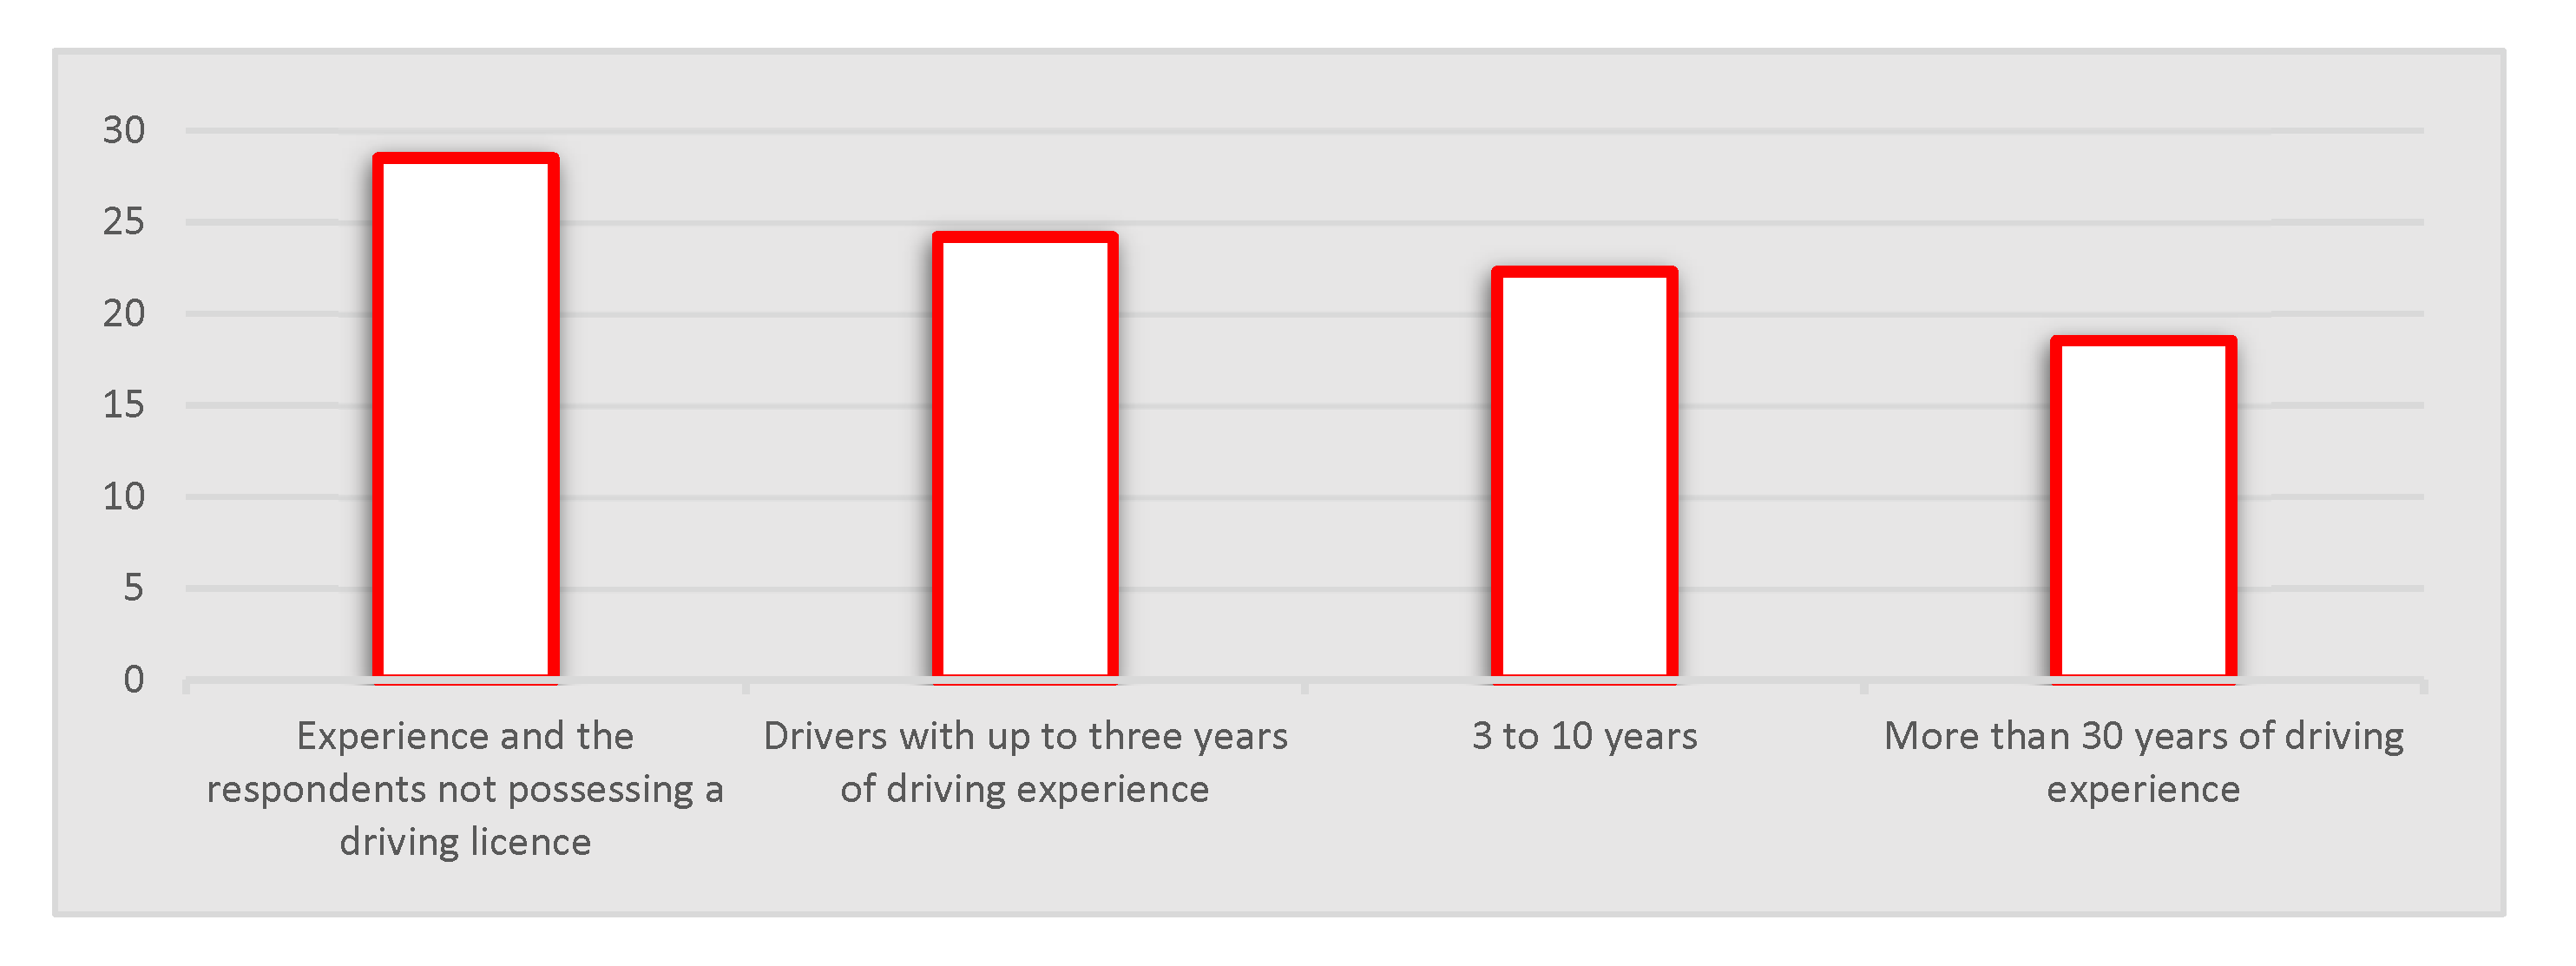
  • The results show statistically significant differences when estimating the speed of 30 km/h (F = 2.477; p = 0.046), among the drivers of different driving experience when the e-bicyclist uses/does not use a reflective vest. The respondents who do not possess a driving licence make the smallest number of errors in perception, while the drivers with more than 30 years of driving experience have the worst perception.

7. Future Research

The results of this study significantly contribute to the research related to the perception of the e-bicycle speed and therefore to the improvement of the traffic safety of e-bicycles.
Since the paper has proven that traffic participants estimate the e-bicycle speed more accurately when the e-bicyclist wears a reflective vest, future research should involve the analysis of other protective clothing (helmet, colour and surface of reflective vests, clothing colour, etc.) and the e-bicycle equipment, which can affect the e-bicycle speed perception. In addition, future research should encompass different ranges of examination speed, geographical areas, different road categories, weather conditions, etc.

8. Recommendations

The obtained results show that traffic participants underestimate the e-bicycle speed, which is in accordance with the results obtained by Dozza et al. [2,40] and Schleinitz et al. [1]. The study conducted by Schleinitz et al. [1] states that educational measures should be implemented. Our study proposes the same raise awareness of the respondents regarding the presence of e-bicycles in traffic since a considerable number of traffic participants are not conscious of the e-bicycle presence on the streets. Moreover, educational measures should be also directed at e-bicyclists to raise their awareness regarding the fact that traffic participants are unaware of their presence in traffic. Schleinitz et al. [1] and Dozza et al. [2,40] believe that certain constructive changes on e-bicycles should be carried out (change of the design, sound, use of lights, etc.) to improve the conspicuity and perception of e-bicycles in traffic, which will consequently improve traffic safety.
In certain countries, one of them being the country of the research, even though the presence of e-bicycles is noticeable and e-bicyclists represent the endangered traffic category, the manner and conditions for the e-bicycle traffic have not been arranged yet. Another problem is the fact that e-bicyclists are differently characterized by different countries [42]. The study by Schleinitz et al. [1] states that most two-wheelers are characterized as e-bicycles in China, while in Europe and the USA they are characterized as mopeds [1]. Therefore, the manner and conditions for the participation of e-bicycles in traffic should be defined. This would facilitate the analysis and monitoring of e-bicycle safety in all countries.
So far, using a reflective vest has mainly been considered from the aspect of pedestrian use. In this manner, a decades-long issue regarding the use of a reflective vest by e-bicyclists has remained unresolved. The findings of this study indicate that the use of a reflective vest by an e-bicyclist enables a more accurate perception of the e-bicycle speed by traffic participants. The use of a reflective vest by e-bicyclists while riding the e-bicycle is a reasonable measure for the improvement of e-bicyclist traffic safety. Also, it is completely justified to expect material savings from the use of reflective vests, as well as the decrease in the number of casualties in traffic accidents involving e-bicyclists.
The results presented in this paper would contribute to the improvement of the safety of e-bicycles drivers, as well as the functioning of the entire traffic system. Implementing the proposed measures and promoting the benefits provided by e-bikes would create a safe environment, which is a basic precondition for promoting this eco-sustainable mode of transport. Greater use of e-bicycles, especially in central urban areas, would contribute to the improvement and development of environmentally sustainable mobility, as well as reduce the negative consequences of road traffic: reduction of harmful emissions, noise, energy consumption, occupation of land by road transport infrastructure, etc. [39]. In this way, in addition to improving the traffic system, the protection of the environment, as well as similar areas, would be improved.

Author Contributions

Conceptualization, A.T. and T.I.; methodology, A.T. and T.I.; software, A.T. and S.Č.; validation, S.S. and S.Č.; formal analysis, S.S. and D.T.; investigation, S.S.; resources, T.I.; data curation, S.S.; writing—original draft preparation, S.S., T.I., S.Č., D.T., A.T.; visualization, A.T. and T.I.; supervision, S.S. and D.T. All authors have read and agreed to the published version of the manuscript.

Funding

This research received no external funding.

Institutional Review Board Statement

Not applicable.

Informed Consent Statement

Not applicable.

Data Availability Statement

Data sharing not applicable.

Acknowledgments

The authors acknowledge the constructive comments of the three reviewers, which have helped to improve this paper significantly.

Conflicts of Interest

The authors declare no conflict of interest.

References

  1. Schleinitz, K.; Petzoldt, T.; Krems, J.F.; Gehlert, T. The influence of speed, cyclists’ age, pedaling frequency, and observer age on observers’ time to arrival judgments of approaching bicycles and e-bikes. Accid. Anal. Prev. 2016, 92, 113–121. [Google Scholar] [CrossRef]
  2. Dozza, M.; Francesco, G.; Piccinini, B.; Werneke, J. Using naturalistic data to assess e-cyclist behavior. Transp. Res. Part F 2016, 41, 217–226. [Google Scholar] [CrossRef] [Green Version]
  3. Rose, G. E-bikes and urban transportation: Emerging issues and unresolved questions. Transportation 2012, 39, 81–96. [Google Scholar] [CrossRef]
  4. Schepers, J.P.; Fishman, E.; den Hertog, P.; Klein Wolt, K.; Schwab, A.L. The safety of electrically assisted bicycles compared to classic bicycles. Accid. Anal. Prev. 2014, 73, 174–180. [Google Scholar] [CrossRef]
  5. Cherry, C.; Cervero, R. Use characteristics and mode choice behavior of electric bike users in China. Transp. Policy 2007, 14, 247–257. [Google Scholar] [CrossRef] [Green Version]
  6. Fishman, E.; Cherry, C. E-bikes in the Mainstream: Reviewing a Decade of Research. Transp. Rev. 2015, 36, 72–91. [Google Scholar] [CrossRef]
  7. Van Cauwenberg, J.; De Bourdeaudhuij, I.; Clarys, P.; De Geus, B.; Deforche, B. Older E-bike Users: Demographic, Health, Mobility Characteristics, and Cycling Levels. Med. Sci. Sports Exerc. 2018, 50, 1780–1789. [Google Scholar] [CrossRef]
  8. Plazier, A.P.; Weitkamp, G.; Den Berg, A.E.V. “Cycling was never so easy!” An analysis of e-bike commuters’ motives, travel behaviour and experiences using GPS-tracking and interviews. J. Transp. Geogr. 2017, 65, 37–45. [Google Scholar] [CrossRef] [Green Version]
  9. Fyhri, A.; Fearnley, N. Effects of e-bikes on bicycle use and mode share. Transp. Res. Part Transp. Environ. 2015, 36, 45–52. [Google Scholar] [CrossRef] [Green Version]
  10. Campbell, A.A.; Cherry, C.R.; Ryerson, M.S.; Yang, X. Factors influencing the choice of shared bicycles and shared electric bikes in Beijing. Transp. Res. Part C Emerg. Technol. 2016, 67, 399–414. [Google Scholar] [CrossRef] [Green Version]
  11. Cherry, C. Electric Two-Wheelers in China: Analysis of Environmental, Safety, and Mobility Impacts. Ph.D. Thesis, University of California, Berkeley, CA, USA, 2007. [Google Scholar]
  12. Road Traffic Safety Agency. Statistical Report on the State of Traffic Safety in the Republic of Serbia in 2019; Road Traffic Safety Agency: Belgrade, Serbia, 2020.
  13. Rodier, C.; Shaheen, S.A.; Chung, S. Unsafe at any speed? What the literature says about low-speed modes. In Proceedings of the Transportation Research Board 84th Annual Meeting, Washington, DC, USA, 9–13 January 2003. [Google Scholar]
  14. Antić, B. Improving and Developing of the Method for Accidents Avoidance Analysis, Accidents Type: Passenger Car—Bicycle. Ph.D. Thesis, University of Belgrade, Faculty of Transport and Traffic Engineering, Belgrade, Serbia, 2012. [Google Scholar]
  15. Koenderink, J.; Doorn, A.V.; Gegenfurtner, K. Colors and Things. i-Perception 2020, 11. [Google Scholar] [CrossRef]
  16. Koenderink, J.; van Doorn, A.; Witzel, C.; Gegenfurtner, K. Hues of color afterimages. I Percept. 2020, 11. [Google Scholar] [CrossRef] [PubMed] [Green Version]
  17. Jonauskaite, D.; Parraga, C.A.; Quiblier, M.; Mohr, C. Feeling blue or seeing red? Similar patterns of emotion associations with colour patches and colour terms. I Percept. 2020, 11. [Google Scholar] [CrossRef] [PubMed] [Green Version]
  18. Law on Road Traffic Safety; 41/2009, 53/2010, 101/2011, 32/2013, 2/2018, 87/2018 and 23/2019; Official Gazette: Belgrade, Serbia, 2019.
  19. Wood, J.M.; Tyrrell, R.A.; Marszalek, R.; Lacherez, P.; Carberry, T.; Chu, B.S. Using reflective clothing to enhance the conspicuity of bicyclists at night. Accid. Anal. Prev. 2012, 45, 726–730. [Google Scholar] [CrossRef] [PubMed] [Green Version]
  20. Cicevic, S.; Trifunovic, A.; Mitrovic, S.; Nešic, M. The usability analysis of a different presentation media design for vehicle speed assessment. In Ergonomic Design and Assessment of Products and Systems; Nova Science Publishers: Hauppauge, NY, USA, 2017. [Google Scholar]
  21. Wu, C.; Yu, D.; Doherty, A.; Zhang, T.; Kust, L.; Luo, G. An investigation of perceived vehicle speed from a driver’s perspective. PLoS ONE 2017, 12, e0185347. [Google Scholar] [CrossRef] [PubMed] [Green Version]
  22. Zheng, Z.; Du, Z.; Xiang, Q.; Chen, G. Influence of multiscale visual information on driver’s perceived speed in highway tunnels. Adv. Mech. Eng. 2018, 10, 1–12. [Google Scholar] [CrossRef] [Green Version]
  23. Pešić, D.; Trifunović, A.; Ivković, I.; Čičević, S.; Žunjić, A. Evaluation of the effects of daytime running lights for passenger cars. Transp. Res. Part F Traffic Psychol. Behav. 2019, 66, 252–261. [Google Scholar] [CrossRef]
  24. Hussain, Q.; Alhajyaseen, W.K.; Pirdavani, A.; Reinolsmann, N.; Brijs, K.; Brijs, T. Speed perception and actual speed in a driving simulator and real-world: A validation study. Transp. Res. Part F Traffic Psychol. Behav. 2019, 62, 637–650. [Google Scholar] [CrossRef]
  25. Trifunović, A.V.; Čičević, S.J.; Lazarević, D.M.; Dragović, M.S.; Vidović, N.D.; Mošić, M.R.; Otat, O.V. Perception of 3D virtual road markings: Based on estimation of vehicle speed. FME Trans. 2019, 47, 360–369. [Google Scholar] [CrossRef]
  26. Hussain, Q.; Almallah, M.; Alhajyaseen, W.K.; Dias, C. Impact of the geometric field of view on drivers’ speed perception and lateral position in driving simulators. Procedia Comput. Sci. 2020, 170, 18–25. [Google Scholar] [CrossRef]
  27. O’Hern, S.; Oxley, J.; Stevenson, M. Validation of a bicycle simulator for road safety research. Accid. Anal. Prev. 2017, 100, 53–58. [Google Scholar] [CrossRef]
  28. Farah, H.; Piccinini, G.B.; Itoh, M.; Dozza, M. Modelling overtaking strategy and lateral distance in car-to-cyclist overtaking on rural roads: A driving simulator experiment. Transp. Res. Part F Traffic Psychol. Behav. 2019, 63, 226–239. [Google Scholar] [CrossRef]
  29. Abadi, M.G.; Hurwitz, D.S.; Sheth, M.; McCormack, E.; Goodchild, A. Factors impacting bicyclist lateral position and velocity in proximity to commercial vehicle loading zones: Application of a bicycling simulator. Accid. Anal. Prev. 2019, 125, 29–39. [Google Scholar] [CrossRef] [PubMed]
  30. Bıçaksız, P.; Öztürk, İ.; Özkan, T. The differential associations of functional and dysfunctional impulsivity with driving style: A simulator study. Transp. Res. Part F Traffic Psychol. Behav. 2019, 63, 1–11. [Google Scholar] [CrossRef]
  31. Keler, A.; Kaths, J.; Chucholowski, F.; Chucholowski, M.; Grigoropoulos, G.; Spangler, M.; Busch, F. A bicycle simulator for experiencing microscopic traffic flow simulation in urban environments. In Proceedings of the 2018 21st International Conference on Intelligent Transportation Systems (ITSC), Maui, HA, USA, 4–7 November 2018; pp. 3020–3023. [Google Scholar]
  32. Boot, W.R.; Charness, N.; Mitchum, A.; Roque, N.; Stothart, C.; Barajas, K. Driving Simulator Studies of the Effectiveness of Countermeasures to Prevent Wrong-Way Crashes (No. BDV30-977-10); Florida Department of Transportation: Tallahassee, FL, USA, 2015. [Google Scholar]
  33. Lubbe, N. Brake reactions of distracted drivers to pedestrian Forward Collision Warning systems. J. Saf. Res. 2017, 61, 23–32. [Google Scholar] [CrossRef] [PubMed]
  34. Olstam, J. Simulation of Surrounding Vehicles in Driving Simulators. Ph.D. Thesis, Linköping University Electronic Press, Linköping, Sweden, 2009. [Google Scholar]
  35. Pomarjanschi, L.; Dorr, M.; Barth, E. Gaze guidance reduces the number of collisions with pedestrians in a driving simulator. Acm Trans. Interact. Intell. Syst. (Tiis) 2012, 1, 1–14. [Google Scholar] [CrossRef]
  36. Sadia, R.; Bekhor, S.; Polus, A. Speed variation for different drivers, situations, and road geometry: Simulator and survey analysis. J. Transp. Saf. Secur. 2018, 10, 25–44. [Google Scholar] [CrossRef]
  37. Salamati, K.; Schroeder, B.; Rouphail, N.M.; Cunningham, C.; Zhang, Y.; Kaber, D. Simulator study of driver responses to pedestrian treatments at multilane roundabouts. Transp. Res. Rec. 2012, 2312, 67–75. [Google Scholar] [CrossRef] [Green Version]
  38. Taheri, S.M.; Matsushita, K.; Sasaki, M. Virtual reality driving simulation for measuring driver behavior and characteristics. J. Transp. Technol. 2017, 7, 123. [Google Scholar] [CrossRef] [Green Version]
  39. Kemeny, A.; Panerai, F. Evaluating perception in driving simulation experiments. Trends Cogn. Sci. 2003, 7, 31–37. [Google Scholar] [CrossRef]
  40. Dozza, M.; Schindler, R.; Bianchi-Piccinini, G.; Karlsson, J. How do drivers overtake cyclists? Accid. Anal. Prev. 2016, 88, 29–36. [Google Scholar] [CrossRef] [PubMed] [Green Version]
  41. Jevtić, V.; Vujanić, M.; Lipovac, K.; Jovanović, D.; Pešić, D. The relationship between the travelling speed and motorcycle styles in urban settings: A case study in Belgrade. Accid. Anal. Prev. 2015, 75, 77–85. [Google Scholar] [CrossRef] [PubMed]
  42. Ivanisevic, T.; Simović, S.; Vukšić, V. The role and importance of e-bikes in CITY logistics, with special emphasis on sustainable transport. Put I Saobraćaj 2020, 66, 59–63. [Google Scholar] [CrossRef]
Figure 1. Overall driving simulator flowchart.
Sustainability 13 05252 g001
Figure 2. E-bicycle speed estimation with respect to reflective vest usage/non usage.
Sustainability 13 05252 g002
Figure 3. The mean error of the e-bicycle speed estimation with respect to reflective vest usage/non usage.
Sustainability 13 05252 g003
Figure 4. Descriptive statistics in the e-bicycle speed estimation with respect to the driving licence category and (non) use of the reflective vest.
Sustainability 13 05252 g004
Figure 5. Estimation of the e-bike speed depending on the driving experience.
Sustainability 13 05252 g005
Table 1. Key characteristics and research results related to speed perception.
Authors
(Publication Year)
Problem ConsideredResearch Methodology (Sample)Processing DataKey Research Results
Bicycle
O’Hern, S., Oxley, J., & Stevenson, M. [27]Validation of a bicycle simulator for road safety researchDriving simulator
(26 participants)
Statistical analysisThe study found evidence to suggest that various aspects of cyclist behaviour can be investigated using the driving simulator.
Farah, H., Piccinini, G. B., Itoh, M., & Dozza, M. [28] Modelling overtaking strategy and lateral distance in car-to-cyclist overtaking on rural roads: A driving simulator experimentDriving simulator
(37 participants)
Statistical analysisHigher driving speeds increase the probability of performing the flying overtaking manoeuvres.
Abadi, M. G., Hurwitz, D. S., Sheth, M., McCormack, E., & Goodchild, A. [29]In this study, a bicycling simulator experiment examined bicycle and truck interactions.Driving simulator
(48 participants)
Statistical analysisThe results show that truck presence has an effect on the bicyclist’s performance, and this effect varies based on the engineering and design treatments employed. Truck manoeuvre had the largest effect on the bicyclist velocity and lateral position.
Passenger vehicle
Cicevic, Trifunovic, Mitrovic, & Nesic
[20]
Usability analysis of different presentation media designs for the vehicle speed assessmentTablet PC and Smartboard
(14 respondents)
Statistical analysisThere are differences between the medium on which tasks are presented, but also the accuracy of the assessment is influenced by the different analyzed speeds of vehicles, as well as the perspective from which the vehicle is observed.
Wu, Yu, Doherty, Zhang, Kust & Luo [21]To examine the effects of multiple factors such as image scale, speed, road type, driving experience, and gender on the speed perception of drivers’ vehicles.Driving simulator—Video clips
(30)
Statistical analysisThe study shows the effect of multidimensional influential factors on the perceived vehicle speed from the drivers’ perspective.
Zheng, Du, Xiang, & Chen [22]Influence of multiscale visual information on the driver’s perceived speed in highway tunnels.Driving simulation
(30 drivers)
Statistical analysisThe speed overestimation by drivers in the middle of tunnels results from the presence of high-frequency visual information, while speed underestimation results from the presence of medium-frequency and low-frequency visual information.
Pešić, Trifunović, Ivković, Čičević & Žunjić [23]The paper shows whether there are differences in the driver’s estimation of the passenger car speed when daytime running lights (DRL) are turned on or off.Driving simulator
(185 drivers)
Statistical analysisThe results indicate that there are differences in the estimation of passenger car speed when DRL are turned on or off.
Hussain, Q., Alhajyaseen, W. K., Pirdavani, A., Reinolsmann, N., Brijs, K., & Brijs, T. [24]Speed perception and actual speed in a driving simulator and real world: A validation studyDriving simulator
(65 drivers)
Statistical analysisThe fixed-base driving simulator can be considered as a useful tool for research on actual speed and speed perception.
Trifunović, Čičević, Lazarević, Dragović, Vidović, Mošić & Otat [25]To appraise the relationship between Perception of 3D virtual road markings and the estimation of vehicle speed.Virtual reality
(63 drivers)
Statistical analysisThere are statistically significant differences between drivers’ willingness to reduce vehicle speed as a response to the two types of 3D road markings.
Hussain, Q., Almallah, M., Alhajyaseen, W. K., & Dias, C. [26]Impact of the geometric field of view on drivers’ speed perception and lateral position in driving simulatorsDriving simulator
(41 drivers)
Statistical analysisResults of this study suggest that using the incorrect geometric field of view for any simulator would generate biased results in speed and lateral position.
Our studyWhat affects the perception of the e-bicycle speed?Driving simulator (175 participants)Statistical analysisThe e-bicycle speed perception is affected by the use of a reflective vest, driving experience and the driving licence category of the respondents.
Table 2. Descriptive statistics of the estimation of e-bicycle speed.
ConditionsNot Using a Reflective VestUsing a Reflective Vest
Speed10 km/h20 km/h30 km/h10 km/h20 km/h30 km/h
Mean12.7617.9924.3712.8220.6326.01
Standard Deviation7.0297.82511.8888.2329.68110.288
Table 3. The mean error of the e-bicycle speed estimation.
Conditions/Speed10 km/h20 km/h30 km/h
Not using a reflective vest−2.762.015.63
Using a reflective vest−2.82−0.633.99
Publisher’s Note: MDPI stays neutral with regard to jurisdictional claims in published maps and institutional affiliations.

