Abstract
With the deepening of the concepts of “sustainable development”, green supply chain management has gradually been attached great importance by the government and enterprises. Based on the green supply chain management method, this paper studies the path optimization of industrial hazardous waste treatment transportation in environmental protection enterprises, aiming at the green purchasing link, in order to realize the management of the green purchasing of environmental enterprises linked to green production under the green supply chain management which integrates green purchasing, hazardous waste storage and green disposal.
1. Introduction
As the largest developing country in the world, China’s economy has been growing continuously in the early 21st century. In recent years, the pace of growth has begun to slow down. From 2010 to 2018, the GDP growth rate has gradually fallen from 10.64% to 6.57% (The data source: https://www.kylc.com/stats/global/yearly_per_country/g_gdp_growth/chn.html accessed on 1 April 2021) In a long period of time, China’s economy has made a breakthrough growth with the advantage of low-cost, followed by environmental damage and waste of resources. Today, China’s economic growth mainly comes from the manufacturing sector, and China’s manufacturing exports account for 17.39% of GDP, With the development of the concept of “green” in the world, the concepts of “a community of shared future for mankind” and “lucid waters and lush mountains are invaluable assets” are put forward, and a large number of environmental protection enterprises have adopted the green concept throughout their business processes and implemented the green supply chain management mode to realize their social responsibilities and improve their core competitiveness. However, due to the immature development of green supply chain management (GSCM) in China, green realization in hazardous waste transportation has been neglected in the process of purchase, management and production. In 2018, China’s 200 large and medium-sized cities produced nearly 1.55 billion tons of general industrial solid waste and about 46.43 million tons of industrial hazardous waste. In the process of industrial hazardous waste treatment, we should pay attention not only to its disposal and recovery, but also to its environmental pollution and energy consumption during transportation. In 2018, the combined utilization of general industrial solid waste amounted to 860 million tons, disposal 390 million tons, storage 810 million tons and dumping 46,000 tons. The comprehensive utilization of general industrial solid waste accounts for 41.7% of the total amount of utilization and disposal, and the disposal and storage accounts for 18.9% and 39.3% respectively, the comprehensive utilization amount of industrial hazardous waste was 23.673 million tons, the disposal amount was 24.825 million tons and the storage amount was 5.624 million tons. Comprehensive utilization of industrial hazardous waste accounts for 43.7% of the total utilization and disposal, while disposal and storage account for 45.9% and 10.4% respectively. Effective utilization and disposal is the main way to deal with industrial hazardous waste, and some cities have made effective utilization and disposal of historical hazardous waste [1]. From the above data shows the strong ability of waste treatment in China but still need to further improve the waste processing efficiency, therefore, transport of dangerous waste in time, solve the collection point, stranded, alleviate waste storage point load, reduce the subsequent points, collecting waste storage environment pollution problem, realize the processing, transportation and storage to green in three stages: coordination need to be addressed.
2. Literature Review
According to the value chain model [2] proposed by Professor Poter of Harvard Business School, supply chain management is an essential enterprise business process model [3], which plans, organizes, coordinates and controls all links of enterprise procurement, product processing, product design and packaging, storage, transportation and sales, and has achieved the management objectives of shortening product development cycle, reducing inventory, reducing costs and improving inventory turnover rate [4]. Green supply chain management is to integrate the green concept into every link of supply chain management and consider the environmental impact of every link. In order to achieve the enterprise in the process of supply chain management, environmental protection and economic benefits of win-win. Enterprises in the implementation of green supply chain management mainly include the following contents: green procurement management, green design, green production, green packaging and green marketing. Among them, green design, green production and green packaging can also be called internal green management of enterprises [5].
In recent years, scholars at home and abroad have focused on the issues related to green supply chain management from two perspectives: the relationship between green supply chain management and enterprise performance, and the green procurement link in green supply chain management methods, and the research on related issues related to supplier selection. Murat Kucukvar, Gokhan Echilmez and Omer Tatari established a hybrid life cycle assessment model based on economic input and output for construction waste disposal, quantifying the overall environmental impact of different waste management methods, such as recycling, conventional landfill and incineration.The analysis results show that the recycling of ferrous and non-ferrous metals can produce significant carbon contribution, which fully verifies the effectiveness of green procuremen [6]. From the perspective of integrated supply chain, Wenfei Xia, Baizhou Li, and Shi Yin discussed the influence of technological innovation and partner selection on the management form and various links of green supply chain in green building materials industry, and concluded that the choice of partner was an important factor affecting green supply chain [7]. With more and more enterprises adopting green supply chain management, the measurement of supplier performance and company environmental performance in green supply chain has become the focus of scholars.Ke-Qin Wang, Hu-Chen Liu, Liping Liu 3 and Jia Huan have developed an integrated MMCM cloud-based and QualiFlex (Qualitatively Flexible Multicriteria Approach) model to evaluate companies’ environmental performance according to economic and environmental criteria. In this method, the language description of performance evaluation is transformed into an alternative scheme with selection criteria, and the linear model is used as a reference for automobile enterprises to choose the best green supplier, which enhances the rationality of green procurement and the effectiveness of supplier selection [8]. At the same time, Blanka Tundys and Tomasz Wi’ Sniewski also proposed similar methods and tools for green environmental performance measurement [9]. MD. Rabbi 1, Syed Mithun Ali and other scholars put forward a probabilistic model based on Bayesian belief network (BBN) to predict the performance of green supply chain, put forward 11 performance indicators, and investigated the influence of these indicators on the decision-making of managers and practitioners [10]. The scholars’ discussions above focus on how to evaluate the performance of green supply chain management, instead of focusing on the specific practice of this management mode in the digital age. This paper mainly discusses the green procurement management of environmental protection enterprises, namely the green management of environmental protection enterprises in the hazardous waste transportation and treatment link.
On the construction of hazardous waste transport model, many scholars have established the research foundation. Wan Fengjiao, Zhang Qingnian and other scholars have established a multi-objective integer programming model, whose mathematical model uses tabu algorithm and ant colony algorithm to establish a two-stage hybrid heuristic algorithm, and solves the positioning problem by using tabu search algorithm. Then, the ant colony algorithm is embedded in the framework of tabu search, and a better transportation route is obtained according to the determined positioning scheme. The total cost of the LRP problem obtained is used as the evaluation index of the solution. The main advantage of this model is that it comprehensively considers the three objectives of the minimum total cost, the minimum risk and the maximum risk equity. However, the algorithm path optimization is not accurate enough and no application cases are given. Therefore, the model is difficult to practice [11]. He Zhenggang and other scholars considered the influence of time-varying conditions on the transportation accident rate, established a multi-objective decision-making model of hazardous waste transportation with arrival time constraints, considering transportation cost and transportation risk, and transformed the multi-objective problem into a single objective problem by linear weighting. Although this method considered two conditions of transportation cost and transportation risk, it considered less environmental problems [12]. Aiming at the problem of network design of dangerous goods closed-loop supply chain, Ma Hongguang constructed a two-stage stochastic programming model by using enumeration algorithm and genetic algorithm, and comprehensively considered the transportation cost and risk, but did not provide specific basis and measurement standard for the determination of linear weighting coefficient adopted therein [13]. Comprehensive described above, the present scholars mainly on the transportation of dangerous goods issue to consider is transportation risk and transportation cost, each have differences in model construction and algorithm, but no scholars to carry hazardous waste transportation problem and the combination of green supply chain management, comprehensive consideration of various factors such as cost, risk and environment friendly.
Based on green supply chain management approach, with some environmental protection enterprise in Henan province as an example, to build the enterprise waste transportation processing model, vehicle path planning problem was applied to the processing of the environmental protection enterprise waste transfer, thus effectively improve the efficiency of waste processing, precision for environmental protection enterprises allocate resources and realize the hazards with three link harmonious and unified operation, transportation and storage, It provides the basis for realizing the green management ability of hazardous waste in environmental protection enterprises. This model mainly uses the GTA hybrid algorithm dominated by genetic algorithm and tabu algorithm. Its main advantage is that the superposition of tabu algorithm and genetic algorithm can accelerate the convergence efficiency of the algorithm. With the increase of iteration, the optimization ability of local hazardous waste transportation can be enhanced, and the transportation path optimization, cost and other issues can be comprehensively coordinated.
3. Transport and Disposal Model of Hazardous Waste in Environmental Protection Enterprises Based on Green Supply Chain Management Model
At present, the annual output of general industrial solid waste in Nanyang City of Henan Province is 4.3784 million tons.
According to the latest data from the Environmental Protection Bureau of Nanyang City, Henan Province, the comprehensive utilization and disposal volume of Nanyang City is about 3,779,600 tons. However, due to the location of hazardous waste storage points, limited reserves and low transportation efficiency of hazardous waste, the treatment efficiency of hazardous waste in Nanyang City still needs to be further improved.
The main issues are as follows:
Firstly, the daily output of hazardous waste is large. The same waste contains a variety of hazardous wastes, which need to be collected and classified, with low transport efficiency and lagging treatment.
Secondly, hazardous waste storage sites require high storage facilities, and for environmental protection enterprises, the construction cost of storage sites is high.
Once built and put into use, it will be difficult to make changes.
According to the above problems, this article is based on green supply chain management method, in view of the hazardous waste transfer point location, transportation, building the environmental protection enterprise in purchasing green transportation of hazardous waste processing model, aims to improve the efficiency of hazardous waste disposal, avoid the secondary pollution of the environment, the formation of purchasing-transportation-storage-transportation-processing or purchasing-transportation-treatment of coordinate process more efficient operation.
Finally, a management structure linking green procurement of environmental protection enterprises to green production is formed under the requirements of green supply chain management integrating information technology and big data, including green procurement of environmental protection enterprises, green storage of hazardous waste storage points and green disposal of enterprises. As shown in Figure 1:
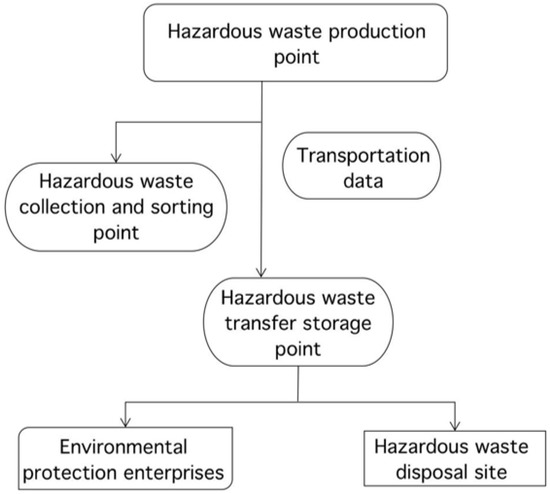
Figure 1.
Environmental protection enterprise hazardous waste green treatment transport model.
Model mainly involves three problems: the waste collection and storage location, transport route planning and the construction of transportation information processing platform, the information platform construction mainly USES the means of data exchange, using the information technology of hazardous waste from the factory to waste disposal point to track the whole process of data management, data updated in real time, improve the efficiency of enterprise internal and external linkage.
As for the location of storage points, classification collection points and transit route planning, due to the diverse types of hazardous wastes, the wide range of involved and the need to consider the impact on the transportation surrounding environment in the selection of transportation routes, this paper adopts algorithm research in the selection of path, classification collection points and storage points.
At present, the main algorithm research mainly includes ant colony algorithm, simulated annealing algorithm and genetic algorithm.
Ant Colony Algorithm (ACO) has been widely used in Deppon Logistics’ route planning for distribution vehicles, and has been continuously optimized and improved with the rapid increase of business volume [14].
The simulated annealing algorithm (SA) was applied to the material distribution path planning of Yonghui Supermarket in Xiamen. After solving the algorithm, the path scheme was shortened from the initial random scheme of 131.29 km to the optimal solution of 71.294 km, which greatly reduced the logistics distribution cost [15].
When it comes to the path planning of slap-hanging transportation, the tabu search algorithm (TS) is used to improve the randomly generated initial solution, so as to improve the vehicle operation efficiency and reduce the operating cost of enterprises [16].
It can be seen from previous studies that several algorithms have been widely used in path selection and optimization, but they have great differences in global convergence, high efficiency and applicability for different transportation goods.
The main differences of the three algorithms are shown in Table 1:

Table 1.
Comparison of the three algorithms.
Through the comparison of the three heuristic algorithms, from the perspective of applicability of a single algorithm, genetic algorithm has obvious advantages in global convergence, and it is easy to combine with other algorithms, which is the most applicable basic algorithm in this study. However, the convergence speed of genetic algorithm is slow. Therefore, this paper adopts tabu search algorithm (TS) to accelerate the convergence efficiency of genetic algorithm. Tabu search algorithm (TS), as an improvement of mountain climbing algorithm, has a good ability to solve local optimization problems. The path planning model of this study mainly consists of three parts.
- (1)
- According to the existing environmental assessment standards and related parameters, the exclusion cannot be used as the site selection of hazardous waste collection and classification points and storage points, so as to determine the address of the final transit storage point.
- (2)
- Establish a two-path planning model consisting of hazardous waste generation point-> hazardous waste collection and classification point-> hazardous waste transfer storage point-> hazardous waste disposal point, hazardous waste generation point-> hazardous waste transfer storage point-> hazardous waste disposal point.
- (3)
- According to the path planning model, the algorithm is used to optimize the model, which not only improves the efficiency of hazardous waste transport in environmental protection enterprises, but also promotes the green management of hazardous waste in procurement-disposal.
Taking an environmental protection enterprise in Nanyang City, Henan Province as the research object, this paper optimized the path of its main business of industrial hazardous waste collection and transportation, and expected to spread the method to the national hazardous waste treatment enterprises and improve the national hazardous waste treatment efficiency.
4. Requirements and Site Selection of Hazardous Waste Collection and Classification Points and Transit Storage Points
In 2001 and 2013, China’s ecological environment department promulgated and revised the Standard for Pollution Control of Hazardous Waste Storage (GB 18597-2001). The document pointed out that “in the environmental impact assessment of hazardous waste centralized storage facilities, the leakage of harmful substances, the generation and diffusion of atmospheric pollutants (including malodorous substances) and possible accident risks that may occur in hazardous waste centralized storage facilities should be considered. According to the type of environmental functional area in the area where it is located, comprehensively evaluate its impact on the surrounding environment, the health of the residents, daily life and production activities, and determine the centralized storage facilities of hazardous wastes and the residential places of permanent residents, agricultural land, surface water bodies and other sensitive objects. Reasonable positional relationship. “
Therefore, in this paper, combined with the environmental assessment impact policy of the Ministry of Ecology and Environment for hazardous waste storage facilities, taking the safety protection distance of unorganized sources as the standard, the geographical information system (Geographic Information System or Geo–Information system, GIS), is used to eliminate the areas in Nanyang City, Henan Province that are not suitable for the construction of hazardous waste transfer storage points [17].
According to the relevant regulations of Technical Methods for Formulating Local Air Pollutant Generation Standards (GB/T13201-91), the safety protection distance of unorganized sources can be calculated by the following Equation:
In Equation x, QC is unorganized emission of pollutants, kg/h. Cm is standard concentration limit of pollutants, mg/m3. L is health protection distance, m, r is equivalent radius of production unit, m. A, B, C, D is calculation coefficient of health protection distance, dimensionless, selected according to the average wind speed in the area where industrial enterprises are located in recent five years and the composition category of air pollution sources of industrial enterprises; QC is the control level that can be achieved by the unorganized production of harmful gases in industrial enterprises.
Once it is ruled out to determine the inappropriate setting area of temporary transit storage by calculation and combining with relevant laws, regulations and policies, all other areas in this area are considered to be suitable for the location of temporary transit storage. According to the following steps, several candidate areas are selected for a demonstration community in the simulation area for simulation:
- (1)
- If there are one or more industrial areas within the boundary of the city, the candidate area is located in the area where the amount of hazardous waste is concentrated, and it is the farthest area from the living area for site selection. In this area, it is necessary to follow the principle of proximity and consider the area with as few operators as possible in the industrial area.
- (2)
- If there is no complete industrial zone in the scattered places of hazardous waste producing enterprises, select the area closest to the main hazardous waste producing enterprises in the appropriate areas according to the principle of proximity.
5. The Establishment of Industrial Hazardous Waste Transport Route Planning Model
5.1. Model Structure
Although they are both hazardous wastes, due to the nature and location of hazardous waste production and the variety of hazardous wastes produced by enterprises in some regions, enterprises in some regions produce a single type of hazardous wastes, but the number of hazardous wastes produced is small and the distribution density is low, while enterprises in other regions are relatively concentrated, but there are many types of hazardous wastes. According to the business scope of the company and the characteristics of waste disposal enterprises in Nanyang, Henan Province, this paper plans the transportation of hazardous waste in this enterprise by adopting dual paths.
Based on the above characteristics, as shown in Figure 2 above, the industrial hazardous waste is divided into two transportation routes before transportation at the transfer storage site: the hazardous waste is directly transported to the disposal site, and the industrial hazardous waste is transported to the nearest transfer storage site. After the disposable resources are optimized and integrated in the transit storage place, the hazardous wastes are transported to the disposal points in an orderly manner for disposal. The idealized process and assumptions of model establishment are as follows:
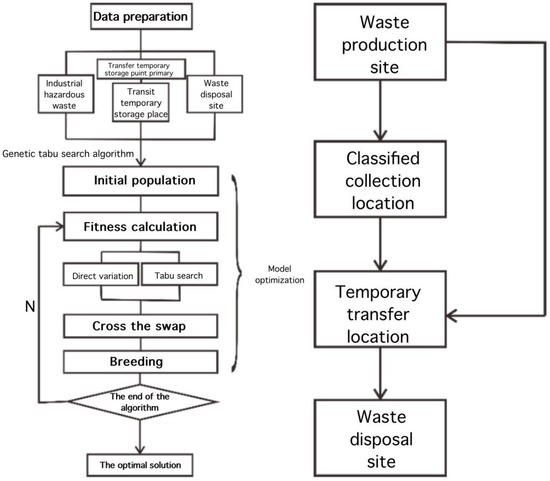
Figure 2.
Hazardous waste transportation route planning.
- (1)
- the address of the transfer storage point has been at a better level according to the processing position in the first step
- (2)
- The address and daily output of hazardous waste generating enterprises are stable, which is directly proportional to the scale of hazardous waste generating enterprises
- (3)
- For the same hazardous waste generation enterprise, it is only transported to one transit storage point, and the two routes are separated and do not affect each other
- (4)
- The distance used in the model is Euclidean distance, and the transportation cost is only proportional to the distance.
5.2. Optimization Model Function Processing
Collect the distance aij between classification points I and j, the distance bij between classification point industry I and transfer storage point j, the distance cij between hazardous waste generating enterprise I and transfer storage point j, the distance di between transfer storage point I and disposal point, transfer storage point I, the actually received hazardous waste is si, the maximum capacity c of transport vehicles, the rated capacity c of transport vehicles and the maximum capacity ri of transfer storage point I, The rated capacity Ri′ of transfer storage point I, the number Si of hazardous wastes collected by centralized storage point I, the number Hi of hazardous wastes produced by enterprises I, the number m of collection and classification points, the number n of transfer storage points and the number k of hazardous waste producing enterprises.
Explanation of Formula: Equations (1) and (2) indicate where hazardous waste and its transit storage truck will be transported to the next station. In Equation (2), j < 0 indicates the hazardous waste generation point to the transit storage point, and j > 0 indicates the hazardous waste generation point to the collection and classification point. Equation (3) represents the cost of the whole model, including the distance from hazardous waste generation point to storage point, distance from collection and classification point to storage point, distance from transfer storage point to collection and classification point, and the difference between the theoretical number and actual number of transfer storage points, which can be used to express the effective utilization rate of transfer storage points. kh, ks, ke, km is a constant, indicating the weight of each cost in the total cost Equations (4)–(7) are the calculation Equations of a specific cost, in which Equation (5) also calculates the distance from the storage point to the collection and classification point, which is represented by Head in this paper, and the specific calculation is realized by algorithm; Equations (8) and (9) are the limiting conditions of the Equations, and the specific Equations are the same as above. Equation (8) is that one transport cannot exceed the maximum transport capacity of the transport vehicle; The Equation (9) is that the hazardous waste stored in the transfer storage point cannot exceed the maximum capacity of the storage point; Equation (10) is the objective function that needs to be optimized in this paper, so as to find the route S and make the transportation cost as small as possible.
6. Add GTA Hybrid Algorithm Optimization Model
At present, the commonly used method for solving multi-objective nonlinear programming problems is genetic algorithm, which is easy to implement, has strong global searching ability, and has good universality and robustness. However, genetic algorithm also has the disadvantages of slow convergence speed and easy to fall into “premature”. Therefore, this paper improves the genetic algorithm by combining the local searching ability of tabu search algorithm with the global searching ability of genetic algorithm to improve the accuracy and efficiency of the algorithm. Then its GTA hybrid algorithm is used to optimize this model. The flow chart of the algorithm is shown in the following Figure 3:
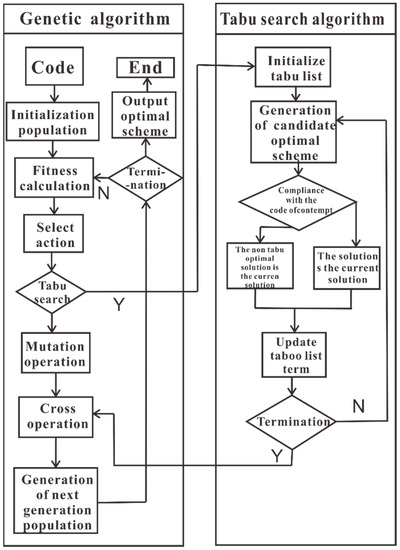
Figure 3.
Hazardous waste transportation route planning.
The GTA hybrid algorithm flow is as follows:
- (1)
- coding. This paper plans to set up three chromosome coding path optimization models. A chromosome is used to encode the hazardous waste from the production point to the intermediate storage point. The distance from the classification point of hazardous waste collection to the transfer storage point is coded by two chromosomes. Among them, the encoding mode of hazardous waste generation points to transit storage points is an array G1, the ith element in the array represents the ith hazardous waste generation point, and the value of the ith element (G1[i]=j) represents that hazardous waste of a hazardous waste generation enterprise is transported to the jth transit storage point. For example, the gene chain (1, 3, 5, 1, 2, 4, 2) indicates that a total of seven hazardous waste producing enterprises were transported to the No.1351242 transit storage point. The coding mode from collection and classification points to transit storage points is two arrays G2 and G3, in which G2 chromosome has the same action with G1, which determines which transit storage point the hazardous waste of each enterprise is finally transported to, and the other chromosome is an array of floating-point numbers, which determines the transportation order of all collection and classification points, specifically, the smaller the value, the more priority is given to transportation. For example: (1, 2, 3, 2, 1), (0.5, 0.3, 0.2, 0.4, 0.1) In this paper, the first and fifth collection and classification points are used as examples. Firstly, according to G2 chromosome, the second fifth collection and classification point is determined and transported to the No.1 transit storage point, and then because 0.5 < 0.1, it is preferentially transported 5 and then transported 1.
- (2)
- Initializing the population. According to the coding rules of the previous step and parameters such as population size, the population is randomly initialized.
- (3)
- Fitness matching. According to f(s), calculate the values of HRoad, SRoad, Empty and MRoad, and give appropriate weights to calculate the matching degree of each gene.
- (4)
- Natural selection. According to the matching degree of each individual in the population calculated above, we select the individual, and here, eliminate the individual with large cost function value.
- (5)
- Individual reproduction. Individual reproduction is mainly divided into three ways:
- Direct reproduction, excellent individuals have the chance to pass on genes directly to the next generation.
- Cross reproduction, some individuals can pass on genes to the next generation by exchanging chromosomes
- Tabu search propagation: Some individuals are optimized by tabu search algorithm, and the optimized genes are passed on to the next generation.
- (6)
- Set the ending conditions. Set the maximum breeding algebra or function optimization goal, end the function when the goal is reached, and select the best individual in the population as the solution of this model.
7. Simulation Experiment of 3 GTA Hybrid Algorithm
7.1. Data Preparation
The number of hazardous waste generation points; collection and classification points and transfer storage points are set as 30; 8 and 6 respectively. The maximum capacity of waste transport vehicles is set to 150 and the rated capacity is set to 0.7 of the maximum capacity. The storage capacity of the transfer storage point is set to(300,400) random number, and the rated capacity is 0.8 of the maximum capacity; The amount of waste collected at the collection and classification points is(10,30) random number; The generation amount of hazardous waste generation point is(50,80) random number; In this paper, 30 and 8 points conforming to Gaussian distribution are used as hazardous waste generation points and the position simulation of collection and classification points (see Figure 4). The calculated mean values are all (50 and 50), the variance of collection and classification points is (250 and 250), and the variance of hazardous waste generation points is (500 and 500). In this paper, the locations of six transit storage points are simulated by random distribution, and the coordinates of disposal points are set as (10,10).
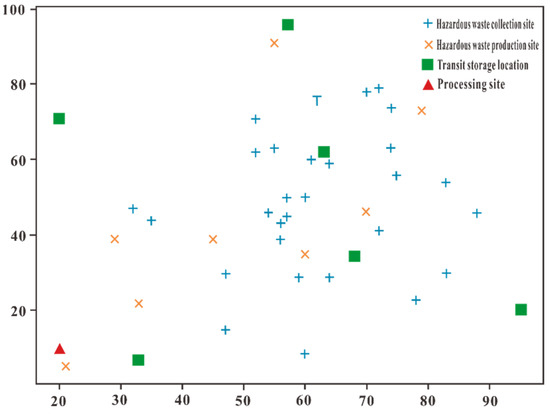
Figure 4.
Simulation location diagram of simulation experiment.
The location information of the initialization hazardous waste generation point and the generated hazardous waste are shown in Table 2:
Table 2.
Initialize the location of eight hazardous waste generating enterprises and the amount of hazardous waste generated.
The location information of the initialized hazardous waste collection and classification points and the generated hazardous waste quantity are shown in Table 3:
Table 3.
Initialize the location of 30 hazardous waste collection and classification points and the amount of hazardous waste generated.
Initialize the location of each hazardous waste transfer storage point and its maximum storage capacity as shown in Table 4:
Table 4.
Initialize the location and maximum capacity of the six transit temporary storage places.
7.2. Determination of the Weights of Parameters, Selection Methods and Fitness Functions in the Algorithm
In the heuristic algorithm, the parameters of the algorithm are of great significance. Whether the parameters in an algorithm are suitable or not directly affects the accuracy of the solution. After many verifications, it is finally decided to use the following parameters:
Genetic algorithm: population size: 1000; Elimination method: roulette; The propagation modes and their proportions are shown in Table 5:
Table 5.
Propagation methods and their proportions.
This breeding mode has the following advantages: it is propagated by 1 mode, and 1 mode accounts for the majority, which ensures the stability of the population and makes the optimal solution not jump greatly. 2,3 propagation modes, 2 of which are partial exchange of local optimal solutions, and 3 are directional search for the best, which is equivalent to artificial breeding and increases the convergence speed. Moreover, using the tabu search algorithm to optimize the population may fall into local optimum. Therefore, a small number of breeding in four ways increases the diversity of the population and avoids the population falling into local optimum as much as possible.
Determination of each weight of fitness function. After the pretreatment experiment and the estimation of HRoad, SRoad, Empty and MRoad in this paper, the coefficient points of these values are kh, Ks, Ke and Km are 1, 0.5, 400 and 1, respectively. It is estimated in this paper that the average distance from the hazardous waste collection and classification point to the transfer storage point is 0.3~0.4 of the hazardous waste generation point. The average waste quantity of collection and classification points is only 1/6~1/5 of that of hazardous waste generation points. Therefore, the k_s value set in this paper is small. In addition, if most transit storage points are idle and the utilization rate is low, it means that this model is not applicable. Therefore, this paper sets the cost function 400 of idle storage points, which is designed according to the average size of storage points. If this value is too small, it will cause resource waste, and if the design is too large, it will lead toTabu search algorithm. In this hybrid algorithm, tabu search is mainly used to optimize some chromosomes, mainly to optimize local genes to develop in a better direction, so as to overcome the shortcoming of slow convergence in traditional genetic algorithm. In this algorithm, the following parameters are mainly included: taboo table length: (5, 5, 7, 7, 7); Taboo step size: 8; Ending method: determine the random number, stop searching the optimized chromosome after reaching the random number, and set the number as (200,200,500,500,500).
Note: The coding method has been described above. Two of them determine the transfer storage points where hazardous wastes from the collection and classification points or hazardous waste generation points are transported. The other one determines the transportation sequence of hazardous waste collection points. The first two chromosomes have two ways of exchange and direct change, while the last one has only one way of exchange, so there are five taboo tables in total. Compared with the route of hazardous waste generation points, the route of hazardous waste collection and classification points is more complex, so the number of ending points of hazardous waste generation points and the length of taboo table are also smaller than those of hazardous waste collection and classification points.
7.3. Initialize the Population
After randomly coding the population, the cost of initializing the population is shown in Table 6:
Table 6.
Cost of initializing population.
The optimal road map of the initial population (generation 0) is shown in Figure 5 below:
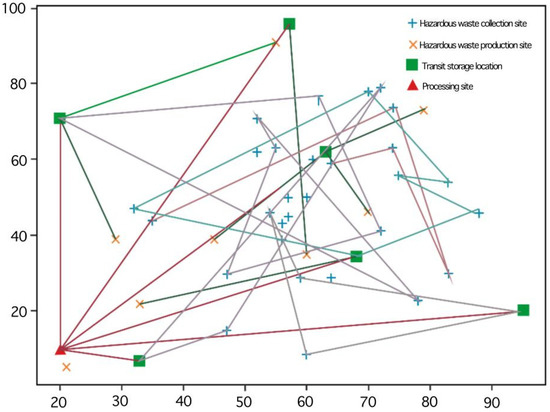
Figure 5.
All road maps of the 0 the generation.
Among them, the route from the hazardous waste generation point to the transit temporary storage place and the route from the hazardous waste collection point to the transit temporary storage place are shown in Figure 6 and Figure 7:
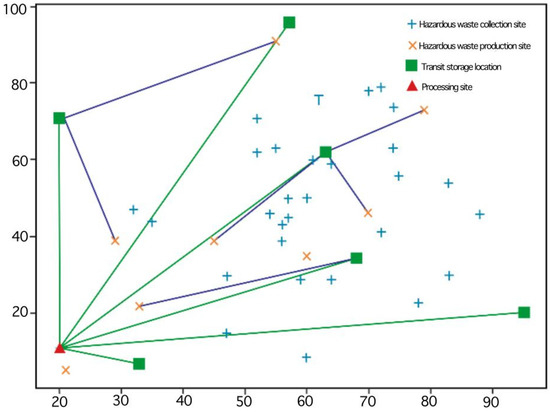
Figure 6.
Roadmap of generation 0 hazardous waste production points.
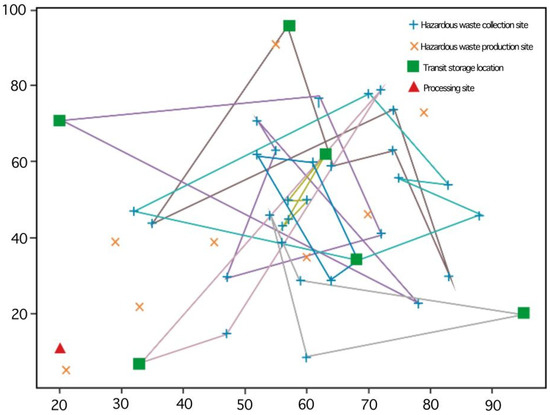
Figure 7.
Roadmap of the 0th generation hazardous waste collection and classification points.
From the above three figures, it can be seen that in the 0th generation, even the individuals with the best performance in the population were disorganized, and from the latter two figures, it can be seen that at this time, the hazardous waste collection and classification points and production points were not transported to the transit storage points close to them, and the transportation routes of the collection and classification points were relatively poor.
7.4. Training Results and Analysis
After 29 generations of training, the cost of each item is shown in Table 7:
Table 7.
Costs after 29 generations of training.
The transportation route map after 29 generations of training is shown in Figure 8:
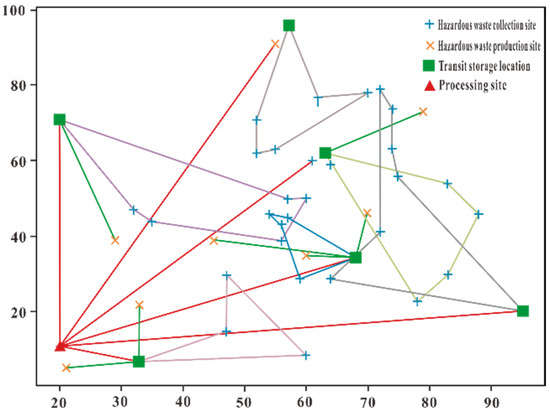
Figure 8.
All circuit diagrams of the 29th generation.
Among them, the routes from collection and classification points and production points to transit storage points are shown in Figure 9 and Figure 10:
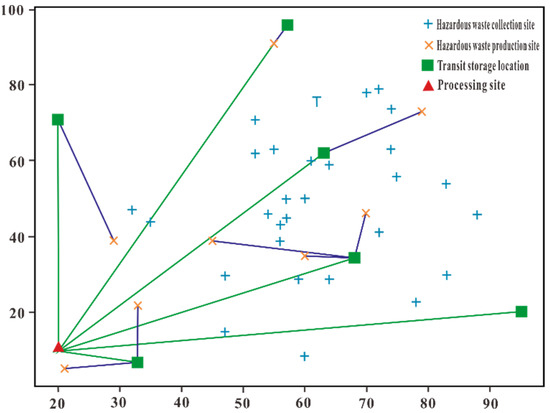
Figure 9.
Roadmap of generation 29 hazardous waste production points.
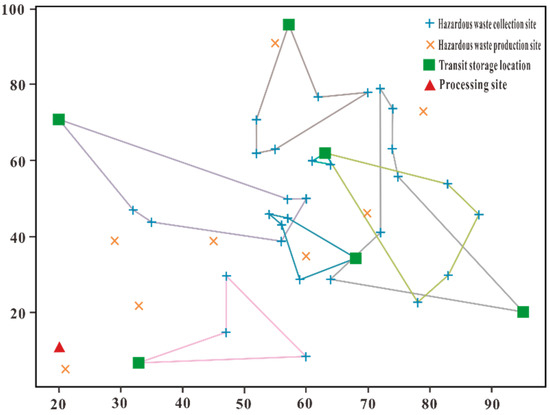
Figure 10.
Circuit diagram of the 29th generation hazardous waste collection and classification points.
According to the road map, when initializing the population, the route between the collection of classification points, production points and transit storage points is a random route, but with the increase of iteration times of the algorithm, the road map presents the following characteristics:
- (1)
- The nearest transit storage point is preferred for transportation at hazardous waste generating points. In the route map of hazardous waste generating points after the 29th generation training, all hazardous waste generating points have selected the nearest transit storage point.
- (2)
- Hazardous waste collection and classification points will also give priority to the nearest transit storage point for transportation, and the polygonal tracks generated by each optimized transportation route will generally not intersect with each other.
We can draw the following conclusions from the average value of each cost in training and the optimal value polyline (as shown in Figure 11):
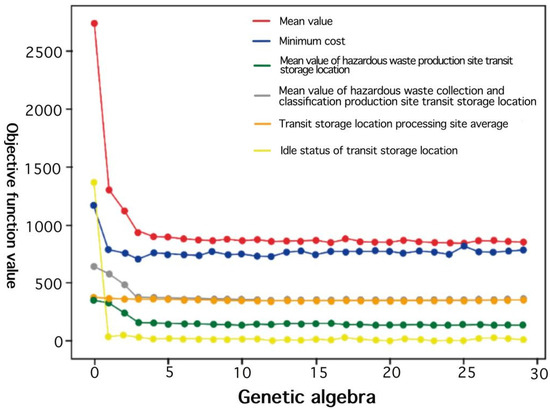
Figure 11.
Average cost and minimum cost of each item in training.
- (1)
- With the increase of training times, the average value of each cost decreases continuously, among which the cost functions of hazardous waste generation point-transfer storage point and collection and classification point-transfer storage point decrease continuously. The reduction of transfer storage point-disposal point is very slow, and the idle degree of transfer storage point is basically in a stable state after the first generation of reduction. The cost function of the optimal solution drops rapidly at first, fluctuates slightly up and down after the seventh generation, and finally is in a dynamic equilibrium state.
- (2)
- Through longitudinal comparison, it can be seen that apart from the change of the cost of idleness at the beginning, the algorithm mainly optimizes the collection and classification point-transfer storage point and the generation point-transfer storage point at other times, and in practice, the difficulty of optimization is also the problem of transportation path, so this algorithm just hits the point. The route table of training results is shown in Table 8:
Table 8. Transport route table after 29 generations of training.
Combined with the route table and road map, this algorithm has some shortcomings in optimizing vehicle capacity, the average utilization rate of vehicles is only 0.5, and the average utilization rate of collection and classification points is not high. This paper thinks that the reason is that the algorithm mainly optimizes transportation routes, but neglects the utilization rate of transit storage points and vehicles.
8. Experimental Conclusion
In this simulation experiment, by comparing the transportation route of the first generation with the transportation route of the last generation, it can be found that the algorithm can optimize the route, so that the sum of each part of the route is at a low level. By comparing the average value and the minimum value of the results of each generation, it can be concluded that the hybrid algorithm converges with the 6th~8th generation. However, this algorithm also has some problems. Although this algorithm puts emphasize on the optimal route, it neglects the utilization rate of storage points and hazardous waste transport vehicles, resulting in a certain waste of resources. In the meantime, it has certain significance to solve the multi-conditional path planning model and by observing the final result graph, it can be observed that the result has a certain global optimality.
9. Application Suggestions
Under the background of green supply chain management, based on the classification of industrial hazardous waste collection points, transit storage location and path optimization simulation under the basis of the reach from generation, collection and treatment of hazardous waste effective collaborative management in different stages of the pilot, the environmental protection enterprise of industrial hazardous waste disposal link in procurement procedures and effective digital green management practices. And reduce the cost of green management. This model is not only applicable to the disposal and transportation of industrial hazardous wastes, but also applicable to the disposal of other hazardous wastes and domestic wastes.
10. Future Research Direction
Its deficiency in this paper, based on the above research results, the future will join the classification of waste collection points, transit storage utilization optimization, considering traffic, limiting factors such as population density, improve transport links environmental emergency contingency plans, establish a complete set of effective synergy of hazardous waste transportation disposal system of supply chain. Further in-depth digital practice of green supply chain management.
To sum up, this paper thinks that the application of hybrid algorithm in the optimization of echelon route selection of industrial hazardous waste transfer storage and disposal is effective under certain conditions. First of all, we should pay attention to the multiple principles of tool, controllability and effectiveness when choosing hybrid algorithm. Secondly, in terms of meaning acquisition, we should pay attention to the principles of target management identity, scientific algorithm uses and convenience, so as to ensure the optimal acquisition in practical application through path optimization under the hybrid algorithm. Finally, on the road of intelligent development of science and technology application, we should pay attention to improving the application efficiency and practical results of comprehensive diversity management, so as to make resources use effectively, safely and reasonably. The feasibility of the hybrid algorithm further verifies the effectiveness of the digital practice of green supply chain management, and provides a reference for the digital green, management of environmental protection enterprises in the procurement and production links.
Author Contributions
Conceptualization, Z.L., T.L. and Y.W.; methodology, X.X.; software, X.W.; validation, W.L., Y.Y. and X.X.; formal analysis, T.L.; investigation, Y.W.; resources, X.W.; data curation, Y.Y.; writing—original draft preparation, Z.L., X.W. and Y.W.; writing—review and editing, T.L.; visualization, W.L.; supervision, X.X.; project administration, W.L.; funding acquisition, X.W. All authors have read and agreed to the published version of the manuscript.
Funding
National Key R&D Program of China "Microbial well cementing technology with lactate mother liquor bacterial fluid from dairy wastewater"(2016YFE0204300); National Natural Science Foundation of China “Effects of hydrate decomposition on pore characteristics and mechanical properties of the deep water cementing sheath” (42072343).
Institutional Review Board Statement
Not applicable.
Informed Consent Statement
Not applicable.
Data Availability Statement
https://www.kylc.com/stats/global/yearly_per_country/g_gdp_growth/chn.html, accessed on 1 April 2021.
Conflicts of Interest
The authors declare no conflict of interest.
References
- Ministry of Ecology and Environment of the People’s Republic of China. 2019 National Annual Report on Prevention and Control of Environmental Pollution by Large and Medium Municipal Solid Waste; Ministry of Ecology and Environment: Beijing, China, 2019.
- Poredr, M.E. Competitive Advantage; Chen, X., Translator; Huaxia Publishing House: Beijing, China, 1997. [Google Scholar]
- Shen, H.; Tao, Q.; Chen, Y. The Theory and Method of Supply Chain Management. China Manag. Sci. 2000, 1, 1–9. [Google Scholar]
- Wang, H.; Han, W. Green supply chain management and implementation strategy. J. Tianjin Univ. 2002, 2, 97–100. [Google Scholar]
- Zhu, Q.; Zhao, Q. A review of green supply chain management and its performance evaluation. Sci. Res. Manag. 2005, 4, 93–98. [Google Scholar]
- Kucukvar, M.; Egilmez, G.; Tatari, O. Life Cycle Assessment and Optimization-Based Decision Analysis of Construction Waste Recycling for a LEED-Certified University Building. Sustainability 2016, 8, 89. [Google Scholar] [CrossRef]
- Xia, W.; Li, B.; Yin, S. A Prescription for Urban Sustainability Transitions in China: Innovative Partner Selection Management of Green Building Materials Industry in an Integrated Supply Chain. Sustainability 2020, 12, 2581. [Google Scholar] [CrossRef]
- Wang, K.; Liu, H.; Liu, L.; Huang, J. Green Supplier Evaluation and Selection Using Cloud Model Theory and the QUALIFLEX Method. Sustainability 2017, 9, 688. [Google Scholar] [CrossRef]
- Rabbi, M.; Ali, S.M.; Kabir, G.; Mahtab, Z.; Paul, S.K. Green Supply Chain Performance Prediction Using a Bayesian Belief Network. Sustainability 2020, 12, 1101. [Google Scholar] [CrossRef]
- Tundys, B.; Wiśniewski, T. The Selected Method and Tools for Performance Measurement in the Green Supply Chain—Survey Analysis in Poland. Sustainability 2018, 10, 549. [Google Scholar] [CrossRef]
- Ma, H. Study on Network Design and Transportation Optimization of Dangerous Goods Closed-Loop Supply Chain. Ph.D. Thesis, Beijing University of Chemical Technology, Beijing, China, 2019. [Google Scholar]
- Wan, F. Study on Model and Algorithm of Hazardous Waste Localization and Transportation Route Arrangement Problem. J. Wuhan Univ. Technol. 2010, 1. [Google Scholar]
- He, Z.; Song, J. Study on Hazardous Waste Transportation Route Selection under Time-varying Conditions. China Saf. Sci. J. 2014, 24, 44–50. [Google Scholar]
- Wang, D. Research on the Development Strategy of Deppon Logistics Enterprises under Cross-border E-commerce Environment. Mod. Bus. 2015, 33, 120–121. [Google Scholar]
- Wang, Q. Research on Optimization of Supermarket Logistics Distribution Path Based on Simulated Annealing Algorithm. J. Guangzhou Inst. Navig. 2019, 27, 39–41. [Google Scholar]
- Ma, H.; Fan, F.; Hu, X. xxx. Chin. J. Manag. Sci. 2016, 24, 205–209. [Google Scholar]
- Hu, C.; Jiang, P.; Zhou, G. Application of Improved Ant Colony Algorithm in AGV Path Planning. Comput. Eng. Appl. 2020, 56, 270–278. [Google Scholar]


Publisher’s Note: MDPI stays neutral with regard to jurisdictional claims in published maps and institutional affiliations. |
© 2021 by the authors. Licensee MDPI, Basel, Switzerland. This article is an open access article distributed under the terms and conditions of the Creative Commons Attribution (CC BY) license (https://creativecommons.org/licenses/by/4.0/).