Abstract
In developing countries, like Jordan, climate change and population growth have prompted land-use and land-cover changes that have profoundly affected ESs, especially by poor people living in fragile ecosystems. This study aimed to analyze the attitudes towards ES among households living in Wadi Araba, a study area located in a dry ecosystem with limited natural resources, as well as to determine the value of ES and the main socio-economic and perceptions factors influencing households’ willingness to accept (WTA) compensation according to the families’ priorities. The face-to-face method was used to interview a random sample of 296 residents from the study sites, using a structured questionnaire to capture the accepted level of compensation for conservation by the local community. Additionally, multiple linear regression analysis was applied to determine the main socio-economic factors affecting WTA. More than 91% of the respondents were willing to accept compensation for three different conservation plans that reflect the resident’s priority. For the three priorities, the weighted average of the compensation levels was JOD 436, 339, 261 per household per year, respectively, and the aggregate values were about JOD (1,196,977.8, 930,601.2, and 719,411.8, respectively) (JOD 1 = USD 1.41). The residents’ gender, age, and income were among the most important factors that affect the compensation level. The main policy implications are that the government and non-governmental organizations should strengthen advocacy and education of arid ecological and natural resources protection, besides including the local community in any decisions in establishing differentiated compensation strategies and regulations. Eventually, the conservation and restoration activities will become self-initiated.
1. Introduction
People benefit considerably from the various ecosystem services (ESs) provided by natural ecosystems [1]. ESs provide direct benefits as well as indirect services, including the provision of food, water, and raw materials; the regulation services of fresh air and pure water; and aesthetic and spiritual attractions [2,3]. Studies on ESs values have been conducted at different scales from the national, regional, and global scales and in diverse areas, including forest, desert, wetland, and growing urbanizing areas [4,5,6,7]. Researchers have provided sufficient evidence indicating that many important ecosystems are facing threats of degradation, mostly attributed to climate change and population growth, which reflects the importance of valuing their impacts on ES within decision-making processes [8,9].
In developing countries, climate change and population growth have prompted land-use and land-cover changes that have profoundly affected ESs [10]. Jordan lies in the heart of the Middle East (Figure 1), where climate change is expected to have substantial impacts on the limited water sources, alongside a high rate in population growth due to the successive waves of refugees from the surrounding countries [11,12]. On the other hand, the government has implemented national afforestation projects and national networks of the protected areas that have improved the ES in different regions. Presently, ESs are considered in the land management and decision-making process, which has helped in shaping the national projects in ecological development and urbanization or civilization [13]. Several studies have addressed ESs at the different geographic zones; for instance, studies were conducted to examine and value the ESs in forest ecosystems [5,6,14,15,16].
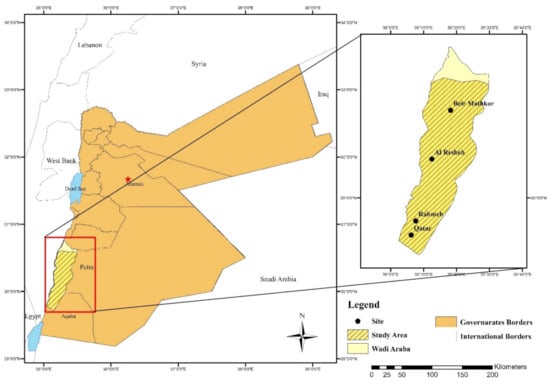
Figure 1.
Map of the study area, south of Wadi Araba (Source: NARC, Environment and Climate Change Research Directorate, 2020).
Other national studies were conducted to estimate the ES value in arid areas (e.g., Wadi Araba (WA) in south-west Jordan), which demonstrated that WA harbors many valuable genetic plant resources that can be used for many purposes, including food, feed, energy, aesthetics, fiber, and medical. The ecological sustainability in WA had been hampered due to climate change and local communities’ activities in the southern part of Jordan [17,18,19]. The previous national studies concluded that decreasing amounts of rainfall and high variations in precipitation from year to year have affected agricultural activities of local communities and imposed additional stress on the ESs of the arid environment. Moreover, the threats faced by the communities’ livelihoods have grown because of unsustainable practices in hunting, overgrazing, and tourism. Such practices had placed a high strain on natural resources. The complex interaction between ecology and humans has highlighted the need for constructing policies for the sustainable provision of ESs in this area.
ESs are the benefits people obtain from ecosystems [2,3]. Some of these benefits are tangible and tradable goods (e.g., fish, fruits, and livestock) to which monetary values are assigned at the market. Other benefits are intangible and untradeable (e.g., water purification, sand fixation, carbon sequestration, and inspiring aesthetics) [1,2,3]. Environmental researchers have devoted considerable efforts to developing a wide range of methods for the valuation of non-marketed ES values. The valuation techniques include two categories: techniques for valuations of revealed preferences (e.g., travel cost, hedonic price, and the random utility model) [20,21], and valuation methods for the stated preferences that incorporate changes in the provision of ES under hypothetical conditions [22,23]. The most well-known valuation techniques related to stated preferences are choice experiments and the contingent valuation method (CVM), and the latter method have been widely used to estimate the value of the use and the non-use of ESs [24,25].
The objective of this study was to analyze the attitudes towards ES among households living in WA and to apply the CVM to (1) explore the WTA of households from WA for different ESs defined by households’ priorities and, thus, its importance for human welfare; (2) determine the value of ES and the main socio-economic, and perceptions factors influencing households’ WTA according to the families’ priorities. The findings of the study can provide inputs for the formulation of participatory plans for improved ESs and ecological sustainability in WA. They can also serve as a reference for worldwide ES evaluation in fragile and dry regions, as well as in other dry areas in Jordan that account for 80% of Jordan’s land area.
2. Materials and Methods
2.1. Research Area and Sampling
WA is a 2000 km2 arid environment that extends 170 km from the southern Dead Sea shore (elevation of 400 m below sea level) to the Gulf of Aqaba at the Red Sea (130 m above sea level) and constitutes 2.4% of the total area of Jordan [19]. WA consists of six large communities, which form a population of 10,510 people living in 1911 households [26]; moreover, WA is close to Aqaba and Petra cities, which form the famous Jordan’s Golden Tourism Triangle. The WA region suffers from surface water scarcity due to low rainfall rates and the absence of valleys or torrents of permanent flow in the region. Employment opportunities within WA consist of grazing livestock, agriculture, and making handmade textiles, and there are few people who work in government jobs [27]. In the southern part of WA, four study sites of Rahamh, Qatar, Al-Reshah, and Beir Mathkour were selected for hosting 50% of the population and for the diversity of ESs in these locations. The total population of the study sites is about 5459 people, and the total number of households is 820, with an average family size of 6–7 people per household [27].
A random sample of 296 residents was chosen as a representative sample that forms 36% of the total households in the four project sites. The sample size for each site was defined proportionally to the number of households in each community; there was no specific profile for selecting respondents beyond their willingness to participate in this study. Face-to-face interviews were used for interviewing the respondents; the respondents also provided a written consent to participate in the field study, based on the ethical approval granted by the National Agricultural Research Center (NARC) and the University of Jordan to conduct the study according to the general regulations.
2.2. Survey Instruments
Data were collected between November 2019 to January 2020, including the pre-survey and the formal investigations, by conducting 12 interviews within local communities and with key persons in WA and experts. Using the pre-survey results, a three-part structured questionnaire was designed to capture the information and opinions of respondents on the ESs of WA. The first part covered the demographic information of the respondents, such as gender, age, education, occupation, income, and family size. The second part focused on residents’ benefits and interaction with the surrounding ecosystem, such as animal production, grazing, agriculture, vegetation cover, and water-provisioning, as well as cultural services (hiking, camping, photography, climbing mountains, biking, bird watching, and visiting historical sites). The third part was for the investigation of willingness to accept (WTA) a payment for controlling the use of ES according to respondents’ priorities and utility gained from the ecosystem, which was started in the following scenario:
“There are priorities and action plans to improve the ecosystems environmental situation of WA, and assuming that the responsible authorities wish to implement participatory financing plans, what are the priorities and plans that the family can have as an alternative for the controlling the use of ESs and natural resources for a period of 5 years. Choose your preferred plan (see the following plans).”
The information from this part was used to estimate WTA for sustaining the ecosystem of the study sites in WA. Accordingly, respondents were given three cards with the same five plans with different values (expressed in JOD, 1 JOD = USD 1.41) and asked to select one plan for each priority (Table 1). The expected support from the local communities was assumed to be extended for 5 years. Based on the proposed plans for each priority, the respondent is expected to apply and/or accept specific constraints on utilizing the ES, while restoration plans are executed in the area for 5 years. Table 1 refers to the suggested limitations and constraints that are expected to be applied in case of accepting compensation for ES. Based on these constrains/impact, respondents are assumed to handle additional costs and/or lost income.

Table 1.
The suggested plans and the values (JOD *) for the three priorities used to estimate the WTA.
The values of the suggested plans were estimated based on the annual income of the population in WA. According to [27], the annual income of the family is about JOD 3600, the maximum compensation was about 25% of this income. The plans’ values were designed and validated in the pre-testing phase of the WTA scenarios, besides considering the information provided by some key persons in this phase.
2.3. Research Methods
2.3.1. Contingent Valuation Method
For valuing WA’s ecosystem service, a CVM was applied. CVM is a hypothetical survey-based valuation method focusing on the respondents’ answers [5,28,29], which are analyzed to conclude important information for the decision-makers regarding the willingness to sustain ecosystem benefits of provisioning, cultural, and supporting services [5,30,31]. CVM is applied to value the use and non-use values of natural resources and ESs. This approach consists of a willingness to pay (WTP) and willingness to accept pay (WTA) as proxy economic measures for use, existence, and bequest values for ESs by the users [28,29,30,31,32,33,34]. Generally, the maximum WTP equals the minimum WTA [28,32,34]. In other words, low WTP refers to the limited economic value of ESs provided by individual landowners [5,32,33], while higher WTA is attributed to high costs associated with important changes or losses in the land use [5,35,36,37,38]. Researchers [39,40,41,42,43,44,45] have referred to the effectiveness of using WTA as a reference for the compensation standards in developing countries.
Previous studies have focused on the importance of socio-economic characteristics of the households in determining WTA. Other factors, such as perceptions and environmental knowledge, were varied in their influence on WTA or WTP [35,36,37]. Previous studies found that socio-economic factors (e.g., age, gender, education level, and occupation level) significantly influenced WTP or WTA relating to ES in different regions [5,30,31]. Other studies have shown that local communities’ perceptions and environmental awareness significantly influence WTP and WTA [15,35,36,37,38]. These studies had provided significant conclusions and practical application of ES valuations, specifically in ecological conservation regions. However, regions inhabited by minorities, backward economies, or fragile ecologies have been relatively overlooked in ES valuations studies [37,38,39,40].
2.3.2. Data Processing Method
To estimate the WTA, several methods can be used: median [5,38,39], the individual utility function theory [32], and Maximum Likelihood Estimation [42,44]. In the current research, the WTA was calculated using the weighted-average, which is a simple but accurate approach [34,44]. Next, the average annual WTA of respondents was used to calculate the aggregate annual compensations for the whole households in the region, where the weighted average of WTA for each priority was extended for all households. Then, a discount rate was applied to the aggregated WTA for estimating the WTA for the region for a period of 5 years. Later, to examine the effect of different factors on the respondent’s WTA value, the multiple linear regression was used. The outcome variable (y = WTA) is a continuous variable. This model was considered the appropriate model to assess the association between WTA and the independent variables as socio-economic variables, the perceptions, and use of ESs [5,37,45,46]. Others [33,43,47] have applied this approach for analyzing the correlation between dependent and independent variables in similar contexts. The data were analyzed using SPSS 20.0 (SPSS Inc., Chicago, IL, USA) statistical software.
In this study, three regression models of the independent variables that affected the WTA of respondents of each priority were defined with multiple linear regression models. The multiple -linear regression model equation is given the Equation (1)
where Y defines the dependent variable as the WTA of each plan in each priority; X1, X2, and Xn define independent variables as socio-economic variables, the perceptions, and use of ESs; a, b, c, Z define constants, and U is the error term. The models were tested for multicollinearity problems, as no correlation of more than 0.8 was found between independent and dependent variables, thus, a multicollinearity problem is not found.
Y = a + bX1 + cX2 + dX3 + … ZXn + U
3. Results
3.1. Characteristics of Respondents
Demographic data displayed several trends. About 68.6% of the respondents were male; this was due to the conservative nature of the society, and 83% of the respondents were married. The average age of the household head was 43 ± 12.2 years, and on average, they had finished the ninth grade (±2.8). The average monthly income was JOD 324 ± 147.8, which is close to the national poverty line (JOD 323). WA is one of the poorest communities in Jordan, where 71.5% of the households are classified as poor families [28]. About 15.5% of the respondents were retired from the public institutions and military forces, while the other 23% were still working at governmental institutions. Only 26.7% of the respondents were housewives, and very few (2%) were farmers.
3.2. Ecosystem Services and Perceptions
WA is located in hyper-arid environment, where most of the families own livestock for household consumption, and they depend on the open grazing at the nearby locations. Most of the respondents did not practice farming (planting vegetables or horticulture) in the last five years due to the limited water sources and climate change. The ecosystem of WA is rich in fauna and flora. Most of the respondents emphasized that medicinal plants and edible plants are widely available. The other 57% of respondents tend to collect firewood for domestic consumption.
WA is also considered a tourist attraction; there are a diverse number of eco-tourism activities, including hiking, camping, photography, mountain climbing, biking, walking, sand dunes, waterfalls, bird watching, visiting historic sites, hunting, and camel riding. Sand dunes are considered the most important activity in the region, followed by hiking and camping. Regardless of the diversity of ESs in this region, most of the respondents expressed limited activities of hiking, camping, hunting, and exploring sand dunes, which contribute significantly to their income and livelihood (Figure 2).
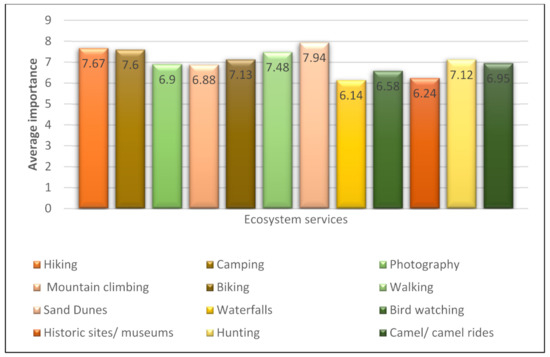
Figure 2.
Mean importance of the ecosystem services to the region (1–10).
3.3. Analysis of Willingness to Accept Compensation: Amount, Time Value, and Economic Value
Respondents indicated a wide range of compensation for the three priorities; the values and percentage for each plan are presented in Table 2. In each priority, some respondents preferred to have no actions, as 11.1%, 8.8%, and 9.1% showed their unwillingness to accept any compensation for the three priorities, respectively. On the other hand, 31.1% of the respondents agreed that plan 3 should be priority 1, which is dedicated to the improvement and protection of water resources, and the implementation of water harvesting in WA. Regarding the second priority, 38.5% of the respondents selected plan 4, which was about the rehabilitation of grazing areas and natural vegetation cover. For the last priority (priority 3), 38.2% of the respondents selected plan 5, which was for enhancing ES and activities related to eco-tourism.
Table 2.
The percentage of bids by the respondents’ priorities for different ESs.
The conservation value reflects how the rural people in WA value the ecosystem from an economic point of view. Therefore, the weighted average had been calculated to estimate the value of ESs as one unit that was reflected in five plans in each priority, as presented in Table 3. All respondents selected different services in priority 1. The weighted average value of services in priority 1 was JOD 435.7. For the second priority, the weighted average of ESs value was JOD 338.77, and finally, the ESs value in priority 3 was about JOD 261.
Table 3.
Mean willingness to accept (WTA) and the economic value to restore ecosystem services in the study area.
Based on the economic theory for estimating the value, there is a discount rate to be used in cases whereby the utility of the lump sum of annual payments should be equal. Thus, the economic value of ESs in WA was estimated based on periodic payments with a cumulative discount rate (Table 3). In this study, a 15% discount rate was used as an environmental discount rate. This high discount rate implies giving high values to the restoration plans of any ecosystem, and thus, betting against the environment and future generations. The discount rate in developing countries ranges between 8–15%, there is an increase by 1–2 percent per year of the discount rate for environmental projects due to the high risks in such projects. Moreover, the proposed restoration project is assumed to extend 5 years and thus the aggregate discount rate for 5 years was employed [5,48,49]. The estimated weighted average for each priority was used to calculate the annual value of compensation for the study sites and for all households. The aggregated present benefits of the compensations for the three priorities were as JOD 1,196,977.8, 930,601.2, and 719,411.8, respectively.
3.4. Factors Affecting Participant WTA
Theoretically, WTA or WTP are directly affected by individuals’ characteristics as socio-economic conditions, personal preferences and perceptions, and income conditions [5,26,35,36,37,38]. A multiple regression model was developed with WTA as the dependent variable and a wide range of independent variables (Table 4). The multiple linear models were estimated by including different sets of explanatory variables by maximum likelihood regression for each priority.
Table 4.
Explanation of variables included in the econometric model.
Table 5 shows the regression model results, including all explanatory variables that contributed to a powerful model. These models (Table 5) included different sets of variables, and the R2 for each model was relatively high, indicating that the statistical relevance for the explanatory variables in each model was good. Model A presents the explanatory variables that affected WTA as a first priority by the respondents; all variables were significant at the 0.01, 0.05, and 0.1 levels (Table 5, Priority 1). The variables of income, gender, and depending as a tourist guide for climbing had a positive relationship with the amount of WTA, particularly the gender of respondents and if the respondent works as a tourist guide for climbing; in other words, most of the men working as a tourist guide for climbing had reflected their acceptance for receiving a higher amount of WTA as compensation to control the use of ESs in WA. The results highlight the significance of some eco-tourism activities, where local people could work as a guide, besides the importance of respondents’ socio-economic profile in accepting WTA compensation.
Table 5.
The results of the multiple regression model for explaining main factors influencing resident’s WTA for ES based on their priorities.
Respondents’ perceptions and activities had significantly affected the amount of WTA for priority 2, as presented in regression model B, where most of the explanatory variables (except one) were significant at the 0.01, 0.05, and 0.1 levels (Table 5, Priority 2); respondents’ perceptions of the existence of biking and bird-watching activities had affected the WTA positively. Moreover, respondents who believed in not having grazing places nearby and limited hunting activities were not willing to receive a higher WTA; furthermore, they had weak benefits from the surrounding ecosystem. They collect small quantities of wild plants, and they had stopped collecting firewood. Thus, the results of model B clarify the effect of respondents’ perceptions and personal activities in deciding the amount of WTA as compensation and, consequently, enhancing restoration efforts for WA ecosystems.
Model of Priority 3 included the factors that affected the respondents’ WTA. All explanatory variables contributed to having a relatively robust regression model, but not all factors were significant at the 0.01 and 0.05 levels, as only variables as respondents’ age, gender, and the dependency on biking activity renting bikes for tourists as a source for income affected the amount of WTA accepted for compensations. Moreover, respondents’ perceptions on the importance of photography as an activity and the impact of eco-tourism on the WA also helped in shaping respondents’ WTA as a compensation for the third priority of ES from their point of view. Moreover, female respondents of an older age tended to accept a higher value of compensations to control the use of ESs in the study sites.
4. Discussion
This research was aimed at the estimation of the monetary value of the rural natural system of Wadi Araba, which reflects ESs belonging to that system. The estimated value of ESs plays an important role when making decisions and undertaking actions for the future of ES in any ecosystem [5,43,44]. Previous studies have emphasized the importance of demographic characteristics of the local communities in appreciation of the ESs [5,26,35,36,37,38]. Different types of ESs would require diverse land management plans and emphasized the consideration of disparities in patterns of natural resource dependence among different local income groups [50,51,52].
The estimated WTA for the first priority was approximately two times higher than the value of the third priority, which was about JOD 1,196,977.8. However, the value of any future compensation to regulate the use of the ES in WA should consider the type of ES and the beneficiaries’ dependencies. This is reflected in the range of values determined by the residents in Table 2 and Table 4. The tables show that residents depending on different water sources were willing to accept compensations for controlling the use of water sources for a certain period of time. The compensation value was the highest to make up for incurred losses of different activities due to restriction for the use of water sources, and thus affecting the household welfare and the future land use [53].
On the other hand, the residents considered the rehabilitation of grazing areas as the second-most important plan for the WA ecosystem; this is likely related to free use and accessibility of grazing areas all around the region, and the ability of the residents to travel with the livestock to other areas searching for natural grazing areas during the rehabilitation period. Grazing areas are open sources in developing countries like Jordan, where livestock breeders adopt regular patterns of migrations looking for alternative grazing areas when needed [53]. Moreover, households with lower livestock wealth rely on free and limitless grazing sources [51], which has affected the amount of compensation for the sustainability of grazing activity and plant cover.
The respondents had selected the eco-tourism activities as the third priority for the suggested conservation plan. The eco-tourism activities are not yet fully ingrained actions attached to the ecosystem conservation; WA communities still depend on agricultural activities (farming and livestock breeding) as their main source of income. Nevertheless, eco-tourism is a growing sector in the southern part of Jordan where ecological conservation should be taken in alongside eco-tourism development. In an arid region like WA, eco-tourism is highly exposed to climate change, specifically for the increased temperature and successive years of drought [16,54,55]. Several studies have highlighted the responsibility of climate change on destroying and blocking several eco-tourism activities (i.e., hiking, climbing, and other outdoor activities) [54]. Therefore, such an impact would place additional pressure on eco-tourism as a business and its profitability [55]; thus, eco-tourism is considered as an additional but unreliable source of income.
Previous studies presented a variety of factors influencing the WTA value in relation to ES; the factors included social, economic, and environmental perceptions. The research findings in Table 5) indicate the factors affecting WTA for the three suggested compensation plans. The results of the regression model for priority 1 show that household income, gender, and perceptions of the tourism activities affect the WTA value for the first priority. This is compatible with other research findings, as the ecological conservation would hinder local communities from using natural resources and, thus, affect the resident’s income. Therefore, male residents expect a higher compensation value (WTA) [5,46]. Other studies have found no clear positive relationship between WTA and resident’s income and gender [56]. Other touristic activities were considered supportive and affected by potential restrictions; as such, working as a tourist guide for climbing was considered as a supporting income source that might affect the acceptance of any future potential conservation programs.
The research findings in Table 5 (priority 2) indicate that when grazing places are nearby, collecting firewood and wild plants had a significant and negative correlation with the WTA level and plans. These factors were connected to the richness of the biodiversity cover in WA, indicating that residents benefiting from the surrounding environment were willing to accept higher WTA. This is mainly because the residents practice agricultural activities and, depending on the natural cover, would lose access to land and thus have reduced family income. Usually, farmers are influenced by the pasture area owned by the farmer to support livestock feeding and the availability of non-crop areas for agricultural production [52]. Moreover, specific eco-tourism activities (biking, bird watching, and hunting) had significant connections with the resident’s WTA, but biking and bird watching had a positive correlation, indicating that the residents who depend on these two activities to establish additional income had the highest WTA level. This is mainly because of the importance of these activities in the region. However, residents who practice hunting in this region were more willing to establish a conservation program; they have likely stopped benefiting from the current ecosystem as the number of hunted animals has decreased in recent years, and thus negatively affected the tourism from the Gulf countries [34,57].
On the other hand, the research findings in Table 5 (priority 3) present the factors affecting the respondents’ WTA for the third priority according to their own choice. These findings indicate that residents’ gender and age had a significant relationship with the level of WTA of the third priority. In this study, males and older people were willing to accept a higher level of WTA for the third priority. Previous studies did provide a conclusive connection between gender differences regarding the residents’ perception of ESs and willingness to take action toward conservation [5,28,35,36,37,38]. The biking activity was again considered an explanatory factor that explained the resident’s WTA level in the third priority. These findings indicate a strong and positive significant connection with WTA level in the third priority, indicating that resents were willing to accept higher compensations to give-up the biking activity and, thus, losing part of the income received from providing bikes to the tourists in the region. These residents would search for other activities to cover the lost income from biking restriction during the conservation period, in other words, to increase the productivity in the activities that are carried out in order to compensate for the risk of conversion practices [58]. Again, the residents’ perception of the eco-tourism activities and their importance to the region had played an important and significant role in setting the WTA level of the third priority. This indicates that the higher appreciation of eco-tourism, the higher their compensation level. The residents’ perception of the ecosystem focuses on psychological mechanisms and the role of interaction on decisions [5,59], mainly for promoting pro-environmental conservation and protection attitudes [15,60]. Such decisions should be devoted to considering different constraints, measures of decision and outcome effectiveness, and multi-criteria decision-making for integrating ecosystem sustainability in urban planning [61].
5. Conclusions and Policy Implications
This study makes a novel contribution to the ES valuation of hyper-arid ecosystems in Jordan, where the CVM can be applied successfully in poor and vulnerable local communities for the environmentally conscious ecosystem use that has delayed economic and ecological benefits. This paper explored the local community’s willingness to accept (WTA) compensation and their WTA level for controlling the use of the ecosystem in WA for a period of 5 years. These findings reveal that more than 91.2% of the respondents were willing to accept compensation for three different conservation plans that reflect the resident’s priority. The weighted averages of the compensation levels were JOD 435.7, 338.77, and 261 per household per year, and the aggregate values of the ES in WA were about JOD (1,196,977.8, 930,601.2, and 719,411.8, respectively) for the three priorities.
The residents’ gender, age, and income were among the most significant explanatory factors that affect the compensation level of WTA. Other factors contributing to the residents benefitting from the surrounding ecosystems include the existence of eco-tourism activities and their level of importance to the study area. Meanwhile, the results of this empirical research have important policy implications:
(1) the government and non-governmental organizations (NGO’s) should strengthen advocacy and education of arid ecological and natural resources protection, and raise compensation funds to support restoration programs; moreover, the current biodiversity policies in Jordan and the international agreement and treaties provide windows for structuring regulations for payments for ecosystem services (PES). At least, this should start in areas classified as protected or environmentally important areas; (2) The current land development plans and urban planning is should enhance the diversity of income sources from farming and non-farming activities with specific consideration for the arid ecosystem; (3) Maintain and strengthen the protection and improvement of water quality and quantity as one of the important components of an arid ecosystem, besides enhancing the ecosystem resilience for climate change and rainfall variations; and (4) Follow the down-top approach and include the local community in any decisions in establishing differentiated and diversified compensation strategies and regulations. Indeed, local residents will become aware of the long-term benefits of the conservation and restoration activities, which will eventually become self-initiated.
Author Contributions
The author contributions were as the following: Conceptualization and methodology: A.A.-A., N.H. and M.M.; Data entry, processing: L.A.N.; investigation: A.A., R.K. and A.H.; data analysis: A.A.-A., M.M. and A.A.; writing—original draft preparation: A.A.-A., M.M., A.A. and W.A.H.; writing—review and editing: A.A. and M.M.; supervision, S.A., N.H. and M.D.; project administration, A.A., M.D. and N.H. All authors have read and agreed to the published version of the manuscript.
Funding
This research was funded by USAID (M32-044), and the APC was funded by National Agricultural Research Center (NARC).
Institutional Review Board Statement
The study was conducted according to the guidelines of the Declaration of Helsinki, and approved by the Ethics Committee of National Agricultural Research Center (NARC) (date of approval 24 November 2019).
Informed Consent Statement
Informed consent was obtained from all subjects involved in the study.
Data Availability Statement
The data presented in this study are openly available in Mendeleye Data at [doi:10.17632/5hyz26s3mb.1].
Acknowledgments
The authors would like to thank the local community in Wadi Arab for sharing their time and information.
Conflicts of Interest
The authors declare no conflict of interest.
References
- Leviston, Z.; Walker, I.A.; Green, M.; Price, J. Linkages between ecosystem services and human wellbeing: A Nexus Webs approach. Ecol. Indic. 2018, 93, 658–668. [Google Scholar] [CrossRef]
- Millennium Ecosystem Assessment. Ecosystems and Human Well-Being: A Framework for Assessment; World Resources Institute/Island Press: Washington, DC, USA, 2003. [Google Scholar]
- Haines-Young, R.; Potschin-Young, M.B. Revision of the Common International Classification for Ecosystem Services (CICES V5.1): A Policy Brief. One Ecosyst. 2018, 3, e27108. [Google Scholar] [CrossRef]
- Boone, R.B.; Conant, R.T.; Sircely, J.; Thornton, P.K.; Herrero, M. Climate change impacts on selected global rangeland ecosystem services. Glob. Chang. Biol. 2018, 24, 1382–1393. [Google Scholar] [CrossRef] [PubMed]
- Al-Assaf, A. Applying contingent valuation to measure the economic value of forest services: A case study in Northern Jordan. Int. J. Sustain. Dev. World Ecol. 2015, 22, 242–250. [Google Scholar] [CrossRef]
- Majdalawi, M.I.; Raedig, C.; Alkarablieh, E.; Schlueter, S.; Salman, A.; Tabieh, M. Integration of different environmental valuation methods to estimate forest degradation in arid and semi-arid regions. Int. J. Sustain. Dev. World Ecol. 2015, 23, 392–398. [Google Scholar] [CrossRef]
- Al Naggar, Y.; Codling, G.; Giesy, J.P.; Safer, A. Beekeeping and the need for pollination from an agricultural perspective in Egypt. Bee World 2018, 95, 107–112. [Google Scholar] [CrossRef]
- Scheiter, S.; Schulte, J.; Pfeiffer, M.; Martens, C.; Erasmus, B.F.N.; Twine, W.C. How does climate change influence the economic value of ecosystem services in savanna rangelands? Ecol. Econ. 2019, 157, 342–356. [Google Scholar] [CrossRef]
- Arowolo, A.O.; Deng, X.Z.; Olatunji, O.A.; Obayelu, A.E. Assessing changes in the value of ecosystem services in response to land-use/land-cover dynamics in Nigeria. Sci. Total Environ. 2018, 636, 597–609. [Google Scholar] [CrossRef] [PubMed]
- Woldeyohannes, A.; Cotter, M.; Biru, W.D.; Kelboro, G. Assessing Changes in Ecosystem Service Values over 1985–2050 in Response to Land Use and Land Cover Dynamics in Abaya-Chamo Basin, Southern Ethiopia. Land 2020, 9, 37. [Google Scholar] [CrossRef]
- Al-Bakri, J.T.; Salahat, M.; Suleiman, A.; Suifan, M.; Hamdan, M.R.; Khresat, S.; Kandakji, T. Impact of climate and land use changes on water and food security in Jordan: Implications for transcending “the tragedy of the commons”. Sustainability 2013, 5, 724–748. [Google Scholar] [CrossRef]
- Rajsekhar, D.; Gorelick, S.M. Increasing drought in Jordan: Climate change and cascading Syrian land-use impacts on reducing transboundary flow. Sci. Adv. 2017, 8, e1700581. [Google Scholar] [CrossRef] [PubMed]
- Ministry of Environment, UNDP. National Biodiversity Strategies and Action Plans. Ministry of Environment; Ministry of Environment, UNDP: Amman, Jordan, 2015.
- Nawash, O.; Al-Assaf, A.; El-Oqlah, A.; Omari, A. Floristic features, distribution, and ethnobotany of plants gathered and used by local people from the Mediterranean forest in Northern Jordan. Ethnobot. Res. Appl. 2014, 2, 385–396. [Google Scholar] [CrossRef]
- Shishany, S.; Al-Assaf, A.; Majdalawi, M.; Tabieh, M.; Tadros, M. Factors influencing Local Communities Relational Values to Forest Protected Areas in Jordan. J. Sustain. For. 2020, 1–19. [Google Scholar] [CrossRef]
- Jamaliah, M.M.; Powell, R.B. Ecotourism resilience to climate change in Dana Biosphere Reserve, Jordan. J. Sustain. Tour. 2018, 26, 519–536. [Google Scholar] [CrossRef]
- Nawash, O.; Horani, A.A. The most important medicinal plants in Wadi Araba desert in South West Jordan: A review article. Adv. Environ. Biol. 2011, 5, 418–426. [Google Scholar]
- Alassaf, A.; Alhunaiti, D.; Dick, J.; Al-Adwan, T. Differences in Perceptions, Attitudes, and Use of Ecosystem Services among Diverse Communities in an Arid Region: A Case Study from the South of Jordan. J. Hum. Ecol. 2014, 45, 157–165. [Google Scholar] [CrossRef]
- Orenstein, D.E.; Groner, E. Using the Ecosystem Services Framework in a Long-Term Socio-Ecological Research (LTSER) Platform: Lessons from the Wadi Araba Desert, Israel and Jordan. In Earth Stewardship; Rozzi, R., Chapin, F.S., III, Callicott, J.B., Pickett, S.T.A., Power, M.E., Armesto, J.J., May, R.H., Eds.; Springer International Publishing: Cham, Switzerland, 2015; Volume 2, pp. 281–296. [Google Scholar]
- Hanauer, M.M.; Reid, J. Valuing urban open space using the travel-cost method and the implications of measurement error. J. Environ. Manag. 2017, 198, 50–65. [Google Scholar] [CrossRef] [PubMed]
- Iftekhar, M.S.; Polyakov, M.; Ansell, D.; Gibson, F.; Kay, G. How economics can further the success of ecological restoration. Conserv. Biol. 2017, 31, 261–268. [Google Scholar] [CrossRef]
- Tinch, R.; Mathieu, L. Marine and Coastal Ecosystem Services: Valuation Methods and Their Practical Application; Biodiversity Series; UNEP-WCMC: Cambridge, UK, 2011. [Google Scholar]
- Lewis, D.J.; Provencher, B.; Beardmore, B. Using an intervention framework to value salient ecosystem services in a stated preference experiment. Ecol. Econ. 2015, 114, 141–151. [Google Scholar] [CrossRef]
- Christie, M.; Fazey, I.; Cooper, R.; Hyde, T.; Kenter, J.O. An evaluation of monetary and non-monetary techniques for assessing the importance of biodiversity and ecosystem services to people in countries with developing economies. Ecol. Econ. 2012, 83, 67–78. [Google Scholar] [CrossRef]
- Börger, T.; Böhnke-Henrichs, A.; Hattam, C.; Piwowarczyk, J.; Schasfoort, F.; Austen, M.C. The role of interdisciplinary collaboration for stated preference methods to value marine environmental goods and ecosystem services. Estuar. Coast. Shelf Sci. 2018, 201, 140–151. [Google Scholar] [CrossRef]
- Estimated Population of the Kingdom by Governorate, Locality Sex and Households; DOS, Department of Statistics, Department of Population and Social Statistics: Amman, Jordan, 2020.
- Governor’s Aqaba Qasabah; (Ministry of Interior Affairs, Aqaba Governorate, Jordan). Personal communication, 2019.
- Feng, D.; Liang, L.; Wu, W.; Wang, L.Y. Factors influencing willingness to accept in the Paddy Land-to-Dry Land program based on contingent value method. J. Clean. Prod. 2018, 183, 392–402. [Google Scholar] [CrossRef]
- Wang, X.; Adamowski, J.F.; Wang, G.; Cao, J.; Zhu, G.; Zhou, J.; Liu, C.; Dong, X. Farmers’ Willingness to Accept Compensation to Maintain the Benefits of Urban Forests. Forests 2019, 10, 691. [Google Scholar] [CrossRef]
- Loomis, J.; Kent, P.; Strange, L.; Fausch, K.; Covich, A. Measuring the total economic value of restoring ecosystem services in an impaired river basin: Results from a contingent valuation survey. Ecol. Econ. 2000, 33, 103–117. [Google Scholar] [CrossRef]
- Awad, I.; Holländer, R. Applying contingent valuation method to measure the total economic value of domestic water services: A case study in Ramallah Governorate, Palestine. Eur. J. Econ. Financ. Adm. Sci. 2010, 20, 76–93. [Google Scholar]
- Milder, J.C.; Scherr, S.J.; Bracer, C. Trends and Future Potential of Payment for Ecosystem Services to Alleviate Rural Poverty in Developing Countries. Ecol. Soc. 2010, 15, 4. [Google Scholar] [CrossRef]
- Gelo, D.; Koch, S.F. Contingent Valuation of Community Forestry Programs in Ethiopia: Controlling for Preference Anomalies in Double-Bounded CVM. Ecol. Econ. 2015, 114, 79–89. [Google Scholar] [CrossRef]
- Wang, P.; Wolf, S.A. A targeted approach to payments for ecosystem services. Glob. Ecol. Conserv. 2019, 17, e00577. [Google Scholar] [CrossRef]
- Lewis, S.; Popp, J.; English, L.; Odetola, T. Willingness to pay for riparian zones in an ozark watershed. J. Water Resour. Plan. Manag. 2017, 143, 04017006. [Google Scholar] [CrossRef]
- Li, H.; Yang, H.; Zhang, X.; Liu, X.; Zhang, Y.K. Estimation of rural households’ willingness to accept two PES programs and their service valuation in the Miyun reservoir catchment, China. Sustainability 2018, 10, 170. [Google Scholar] [CrossRef]
- Chu, X.; Zhan, J.; Wang, C.; Hameeda, S.; Wang, X. Households’ Willingness to Accept Improved Ecosystem Services and Influencing Factors: Application of Contingent Valuation Method in Bashang Plateau, Hebei Province, China. J. Environ. Manag. 2020, 255, 109925. [Google Scholar] [CrossRef]
- Fahad, S.; Jing, W. Evaluation of Pakistani farmers’ willingness to pay for crop insurance using contingent valuation method: The case of Khyber Pakhtunkhwa province. Land Use Policy 2018, 72, 570–577. [Google Scholar] [CrossRef]
- He, K.; Zhang, J.; Zeng, Y.; Zhang, L. Households’ willingness to accept compensation for agricultural waste recycling: Taking biogas production from livestock manure waste in Hubei, P.R. China as an example. J. Clean. Prod. 2016, 131, 410–420. [Google Scholar] [CrossRef]
- Garcia, J.H.; Cherry, T.L.; Kallbekken, S.; Torvanger, A. Willingness to accept local wind energy development: Does the compensation mechanism matter? Energy Policy 2016, 99, 165–173. [Google Scholar] [CrossRef]
- Nyongesa, J.M.; Bett, H.K.; Lagat, J.K.; Ayuya, O.I. Estimating farmers’ stated willingness to accept pay for ecosystem services: Case of Lake Naivasha watershed Payment for Ecosystem Services scheme-Kenya. Ecol. Process. 2016, 5, 15. [Google Scholar] [CrossRef]
- Kang, M.J.; Siry, J.P.; Colson, G.; Ferreira, S. Do forest property characteristics reveal landowners’ willingness to accept payments for ecosystem services contracts in southeast Georgia, US? Ecol. Econ. 2019, 161, 144–152. [Google Scholar] [CrossRef]
- Xue, X.; Hua, L.X.; Cheng, S.; Qing, W.; Hua, L. Estimation of ecological compensation standards for fallow heavy metal-polluted farmland in China based on farmer willingness to accept. Sustainability 2017, 9, 1859. [Google Scholar] [CrossRef]
- Xiong, K.; Kong, F. The Analysis of Farmers’ Willingness to Accept and Its Influencing Factors for Ecological Compensation of Poyang Lake Wetland. Procedia Eng. 2017, 174, 835–842. [Google Scholar] [CrossRef]
- Yuan, Y.; Liu, Y.; Hu, Y.N.; Chen, X.; Peng, J. Identification of non-economic influencing factors affecting farmer’s participation in the paddy land to dry land program in chicheng county, China. Sustainability 2017, 9, 366. [Google Scholar] [CrossRef]
- Haile, K.K.; Tirivayi, N.; Tesfaye, W. Farmers’ willingness to accept payments for ecosystem services on agricultural land: The case of climate-smart agroforestry in Ethiopia. Ecosyst. Serv. 2019, 39, 100964. [Google Scholar] [CrossRef]
- Tolunay, A.; Bassullu, C. Willingness to pay for carbon sequestration and co-benefits of forests in Turkey. Sustainability 2015, 7, 3311–3337. [Google Scholar] [CrossRef]
- Harrison, M. Valuing the Future: The Social Discount Rate in Cost-Benefit Analysis; Productivity Comission: Melbourne, Australian, 2010. [Google Scholar]
- Xu, Z.M.; Cheng, G.D.; Zhang, Z.Q.; Su, Z.Y.; Loomis, J. Applying contingent valuation in China to measure the total economic value of restoring ecosystem services in Ejina region. Ecol. Econ. 2003, 44, 345–358. [Google Scholar]
- Li, P.; Agusdinata, D.B.; Suditha, P.H. Ecosystem services and trade-offs: Implications for land dynamics and sustainable livelihoods in Northern Lombok, Indonesia. Environ. Dev. Sustain. 2021, 23, 1–21. [Google Scholar] [CrossRef]
- Unks, R.R.; King, E.G.; Nelson, D.R.; Wachira, N.P.; German, L.A. Constraints, multiple stressors, and stratified adaptation: Pastoralist livelihood vulnerability in a semi-arid wildlife conservation context in Central Kenya. Glob. Environ. Chang. 2019, 54, 124–134. [Google Scholar] [CrossRef]
- Danne, M.; Musshoff, O. Analysis of farmers’ willingness to participate in pasture grazing programs: Results from a discrete choice experiment with German dairy farmers. J. Dairy Sci. 2017, 100, 7569–7580. [Google Scholar] [CrossRef]
- Abu Zanat, M.M.; Mekdadi, H.A.; Tabbaa, M.J. Production systems of small ruminants in middle badia of Jordan. Dirasat 2005, 32, 205–213. [Google Scholar]
- Fankhauser, S.; Tol, R.S.J. The social costs of climate change: The IPCC second assessment report and beyond. Mitig. Adapt. Strateg. Glob. Chang. 1997, 1, 385–403. [Google Scholar] [CrossRef]
- Jamaliah, M.; Powell, R. Integrated vulnerability assessment of ecotourism to climate change in Dana Biosphere Reserve, Jordan. Curr. Issues Tour. 2017, 22, 1–18. [Google Scholar] [CrossRef]
- Fan, X.; Yang, Z.; Tang, K.; Yang, H. Difference between the WTP and WTA in cultural service value evaluation of agriculture ecosystems: Shanghai pond aquaculture case study. Chin. J. Ecoagric. 2012, 20, 1546–1553. [Google Scholar] [CrossRef]
- Aloufi, A.; Ehab, E. Zootherapy: A study from the Northwestern region of the Kingdom of Saudi Arabia and the Hashemite Kingdom of Jordan. Indian J. Tradit. Knowl. 2016, 15, 14. [Google Scholar]
- Motta, R.S.D.; Ortiz, R.A. Costs and Perceptions Conditioning Willingness to Accept Payments for Ecosystem Services in a Brazilian Case. Ecol. Econ. 2018, 147, 333–342. [Google Scholar] [CrossRef]
- Shogren, J.F. Behavioural Economics and Environmental Incentives. Available online: http://dx.doi.org/10.1787/5k8zwbhqs1xn-en (accessed on 20 February 2021).
- Rey-Valette, H.; Mathé, S.; Salles, J.M. An assessment method of ecosystem services based on stakeholders’ perceptions: The Rapid Ecosystem Services Participatory Appraisal (RESPA). Ecosyst. Serv. 2017, 28, 311–319. [Google Scholar] [CrossRef]
- Guarini, M.R.; Morano, P.; Sica, F. Eco-system Services and Integrated Urban Planning. A Multi-criteria Assessment Framework for Ecosystem Urban Forestry Projects. In Values and Functions for Future Cities; Springer: Cham, Switzerland, 2020; pp. 201–216. [Google Scholar]
Publisher’s Note: MDPI stays neutral with regard to jurisdictional claims in published maps and institutional affiliations. |
© 2021 by the authors. Licensee MDPI, Basel, Switzerland. This article is an open access article distributed under the terms and conditions of the Creative Commons Attribution (CC BY) license (https://creativecommons.org/licenses/by/4.0/).