Article

Corporate Governance vs. Financial Performance for Intensity of Innovation Investments

1
Kaunas University of Technology, School of Economics and Business, 44249 Kaunas, Lithuania
2
University of Groningen, Faculty of Economics and Business, 9712 CP Groningen, The Netherlands
*
Author to whom correspondence should be addressed.
Sustainability 2021, 13(9), 5014; https://doi.org/10.3390/su13095014
Submission received: 26 February 2021 / Revised: 16 April 2021 / Accepted: 20 April 2021 / Published: 29 April 2021

Abstract

:
In a rapidly changing technology world, companies need to conform to their customers’ expectations if they wish to remain competitive in the marketplace. New products, services, processes, marketing, management, and organizational innovation can all be tools to keep companies competitive. Research and development (R&D) expenditure is a critical component in the development of a design process. According to the scientific literature, corporate governance and financial performance can be essential variables with a significant impact on the innovation process. By acting transparently and honestly with all stakeholders (employees, suppliers, customers, creditors, government, community), companies can ensure and enhance the economic sustainability of the whole country through efficient management of financial resources and work toward high value-added innovation. Therefore, the aim of this work was to analyze whether corporate governance and financial performance affect the development of corporate innovation investments and, at the same time, the sustainability of the country’s economy. Additionally, this research proposes a methodology for integrated assessment of corporate innovation investments in the context of economic sustainability, aimed at companies and countries for more efficient investment in innovation and sustainable development outcomes. The object of the research was corporate innovation investment intensity as the driver for economic sustainability. An evaluation methodology for integrated assessment of corporate innovation investment can be used as an instrument for the stimulation of business innovation and strategic development of a country’s economy. The evaluation methodology of integrated assessment of corporate innovation investments can be utilized to evaluate different companies and governments. Evidence-based empirical calculations show that synchronized corporate governance and financial performance influence the intensity of corporate innovation investments in the context of economic sustainability.

1. Introduction

Technological, economic, climatic, and social changes in countries and regulation, changing laws, rapidly evolving needs of market players, and shortening product life cycles all have a significant impact on companies and the environment. To stay competitive, companies must develop and innovate. This requires funds to be invested in consistent, cohesive, and long-term innovation development. R&D expenditure is fundamental to innovation. Adverse internal and external risk factors of innovation investments hinder the rapid growth of a design process. Alongside the ambition of companies to remain competitive in the marketplace, countries compete against each other to lead globally. Each year, countries are ranked according to several indicators, including changes in the economy and environmental protection, social responsibility, and innovation. As stated on its website, The United Nations set 17 key sustainability goals [1] to be achieved by 2030 that each country must pursue. The considerable differentiation between the intensity of corporate investment in innovation and the risk and sustainability of government signals that companies and countries move slowly or in the wrong direction.
Today, companies need to offer new or improved products, services, processes, marketing, management, and organizational innovation with long-term added value to remain competitive in the marketplace and meet ever-growing consumer demands. In addition, design based on research and development expenditure is needed because there is too little to encourage change in the look of a product or a service description. This requires not only more efficient management of financial resources but also more transparent and fairer corporate governance. Businesses must not only be financially accountable to employees, board, clients, creditors, suppliers, the public, and government but also have legal, specific, and precise definition of social and management policies and all related aspects. This would enable businesses to remain competitive and make their countries more responsible and more committed to the goals of economic sustainability, innovation progress, and economic growth. Furthermore, modern economic sustainability no longer simply concerns economic growth but must also include social, economic, and environmental requirements [2]. Research and experimental development, based on sustainable innovation created by companies, could be the basis for sustainable economic growth, including other social and environmental requirements. Scientific research proves that the problem of innovation investment evaluation by a country’s economic sustainability organizations does not consider all different world regions. One way to achieve more sustainable corporate investment in innovation in the context of economic sustainability is to assess the intensity of corporate innovation investment in various groups across different sustainability dimensions. Modern problems with corporate innovation investments in the future often arise from corporate activities, the factors affecting them, and the concept of sustainability in practice, and all of these factors should be assessed. Evaluating the intensity of corporate investment in innovation is not a systematic and exhaustive process, and the methods of evaluation are quite limited, covering a specific area.
Since measuring the intensity level of corporate innovation investment in the context of economic sustainability is still a relatively unexplored scientific area and requires specific definitions and evaluation methodologies, there is no suitable analysis tool. It is imperative to identify determinants and assessment methodologies for assessing the intensity of innovation investment by companies in the context of economic sustainability. The ownership structure of companies as well as board size, remuneration, and compensation are the most discussed aspects in the corporate governance literature. The scientific literature is mostly empirical, and many authors study corporate governance through the prism of agency theory. However, there is a lack of research that includes corporate governance, financial performance, and innovation investments in the context of economic sustainability. Therefore, the aim of this research was to analyze whether corporate governance and financial results affect the development of corporate innovation investments and, at the same time, the sustainability of the country’s economy. This research addresses the scientific problem of the key factors influencing the power of corporate innovation investments and what impact they have on a country’s economic sustainability.

2. Literature Background

In 2012, The World Bank stated that ‘green growth’, which encompasses economic growth, a cleaner environment, and better social protection and sustainable innovation, must be one of the priorities in each country [3]. However, this phenomenon is an incredibly complex and lengthy process [4], requiring time, resources, and strategy (see Figure 1). The problem in scientific sources includes how to reconcile technological development, economic growth, and reduction of environmental pollution and social responsibility. This problem (coherence between technological development, economic growth, reduction of environmental pollution, and social responsibility) has been extensive studied [4]. This problem (coherence between technological development, economic growth, reduction of environmental pollution, and social responsibility) has been extensively studied [5,6,7,8,9,10,11,12]. According to the authors, the relationship between the sustainability of innovation (technological breakthrough), long-term economic growth (as economic sustainability) and environmental (cleaner environment), as well as social sustainability (better social protection) [13,14], is a very pressing public problem, which is becoming more and more evident. Social inequality and high levels of exclusion, societal dissatisfaction, the consequences of the global economic crisis, and lower economic growth rates due to the application of international precautionary measures to prevent potential problems create preconditions for raising questions in academic, political, and social spheres. With the media’s help, among scientists, politicians, economists, the disagreement between continuous economic expansion and opportunities is becoming more acute and relevant. According to the results of a public survey in 2016, including 1001 respondents and using LCA analysis (latent class analysis), 41.1% of interviewees strongly advocated technology deployment and long-term economic growth. Additionally, 36.3% did not have a single assured opinion on economic development through modern innovation. To sum up, 22.6% of respondents expressed environmental concerns about increasing technology and uncertain economic growth [15]. According to a report from the International Organization of Economic Cooperation and Development (OECD), past economic growth has been achieved through the unsustainable use of natural resources, which cannot be allowed now in the 21st century due to rapid technological change and changing world and human perceptions [16]. Corporate governance, characterized by clarity, robustness, and efficiency, can have a significant meaning on investments in innovation investment [17] (see Figure 2). The corporate governance framework includes pre-defined requirements that clarify the responsibilities, rights, and expectations of the board members and shareholders of the company [18]. Board members may not infringe on each other’s rights and obligations and may not seek sole benefit for themselves. Each board member must be a leader that encourages the company to grow, change, and adapt to market innovation. As a leader, board members can significantly help to increase innovation investment intensity [19,20]. Board members are not the same as the CEO, but the CEO can be a board member. Board members aim at the company’s development. CEOs [21] together with corporate analysts [22] can significantly stimulate the process of innovation. However, the CEO may ignore the board’s ambitions, for fear of taking on additional risks related to innovation failure [23,24]. The survey results (1036 correspondents—CEOs) reflected assuming that the connection is between CEO traits and propensities influenced by the board and innovation development [25]. Thus, ambitious, empowered, determined, and fearless CEOs can develop innovation and fulfill board members’ goal to keep the company competitive in the global marketplace. The corporate governance framework is multifaceted, formed throughout the year to get results—the company’s highest value, in the long run, taking into account all possible useful circumstances of the company’s management application [26]. The following table (Table 1) was compiled to allow the corporate governance framework measurement methodology’s exhaustive analysis. The corporate governance methodology is based on five variables. The measurement variables of the methodology of corporate governance are described in more detail below. The corporate governance framework is characterized by five critical criteria (board’s: functions, compensation policy, structure, vision and strategy and rights of shareholders), which are evaluated individually, summarizing how effective the corporate governance system is and how much it needs to be further improved to achieve better corporate governance results. Clearly described functions for each managerial position, detailing what goals are set and how they are measured, contribute to a more effective corporate governance framework. A logically based structure defined by specific instructions, based on which the company’s management is made as transparent and efficient as possible, also has a significant positive impact on its management system. Legally, transparently, and clearly defined executive compensation policies, including the calculation of salaries, bonuses, and bonuses, can contribute to more effective management practices.
Meanwhile, the company’s strategy and vision play a particularly significant role, geared toward more sustainable innovation, a cleaner environment, and more excellent social protection to shape acceptable governance practices. Finally, shareholders’ rights should be the same for all shareholders. The aim should be to increase the assets invested by all shareholders at the same rate, without granting illegal benefits to some shareholders.
The corporate governance system (practice) can be a crucial factor in determining corporate investment in innovation. A more efficient corporate governance system can contribute to the passion and improvement of a company’s activities through creation. Meanwhile, only a theory but not practically implemented company management system can create only additional risks in its activities without results.
The significance of financial performance in research and development expenditure and the development of new or improved products or processes in companies (see Figure 3) is highlighted by different authors [27,28]. In their view, many financial factors can influence a corporate innovation performance at all stages, from starting a long-term innovation development strategy to conducting research, experimenting, and prototyping products or services in the marketplace.
Financial resources and the good financial performance of a company are essential at the very beginning when it comes to attracting new investors or additional new borrowed capital for start-ups [29]. Potential investors and credit institutions are not interested in lending to a company with higher leverage and liquidity ratios and lower market values and profitability ratios than the financial position of competitors in the same industry. It is also argued that good financial performance indicates a more favorable position for a company to launch R&D expenditure [30,31]. Therefore, these variables could be essential risk factors on corporate innovation investments. The Tobin q indicator is significant in assessing the intensity of firms’ innovation investments. It reflects the vital point of one of the theories that a firm can increase innovation investments when assets’ market value exceeds the book value of assets.
Figure 1. The linkage between corporate governance, financial performance, and intensity of innovation investments in the context of a country’s sustainability (according to [11,20,32]).
Sustainability 13 05014 g001
Figure 2. Financial performance characteristics (according to [19,27,28,33]).
Sustainability 13 05014 g002
Figure 3. Corporate governance and corporate innovation investments (according to [23,26]).
Sustainability 13 05014 g003
Creating and marketing innovation is vital for businesses, as it helps them to stay competitive in a constantly changing environment. In all innovation activities, but particularly in the initial periods of R&D, the company needs the financial resources of its own or to lend. Funding for innovation includes creation, retention, purchase of materials for experimentation and prototyping, and market research for the necessary staff. A company may not borrow money from a variety of external sources (banks, credit unions, parent companies) or capital market; however, this creates additional risks for risky innovation activities. Therefore, pre-analysis and forecasting of a financial ratios could be one of the factors that can contribute to a more successful research and experimental results and innovation investment performance (see Figure 2). The competence and motivation of employees and board in corporate are particularly important when embarking on research and development. Their qualitative and quantitative characteristics, such as their personal qualities, ambitions, gender, age, experience, remuneration, including bonuses and bonuses, board composition, and term of office, may influence research and development, the financial position of the company, and any innovation.
The ability of the board to analyze and effectively address risk factors can be a key to the success of an innovation activity. Therefore, corporate governance can also be one of the factors that can contribute to more successful innovation investment results. A country’s sustainability could be integrated to the sustainable economic growing in the long term in the country, based on sustainable, high value-added innovation by companies that use renewable energy sources in their design for the benefit of society. As a result, a country’s sustainability is closely linked not only to economic growth and innovation but also to environmental and social sustainability (which can be defined as not increasing environmental pollution and increasing social welfare in order to achieve economic growth through innovation). Innovative performance can contribute not only to economic sustainability but also to the competitiveness and progress of a country in a global context.
Table 1. Evaluation methods of 5 dimensions of corporate governance (according to [21,30,32]).
Measurement Methodology of Corporate Governance
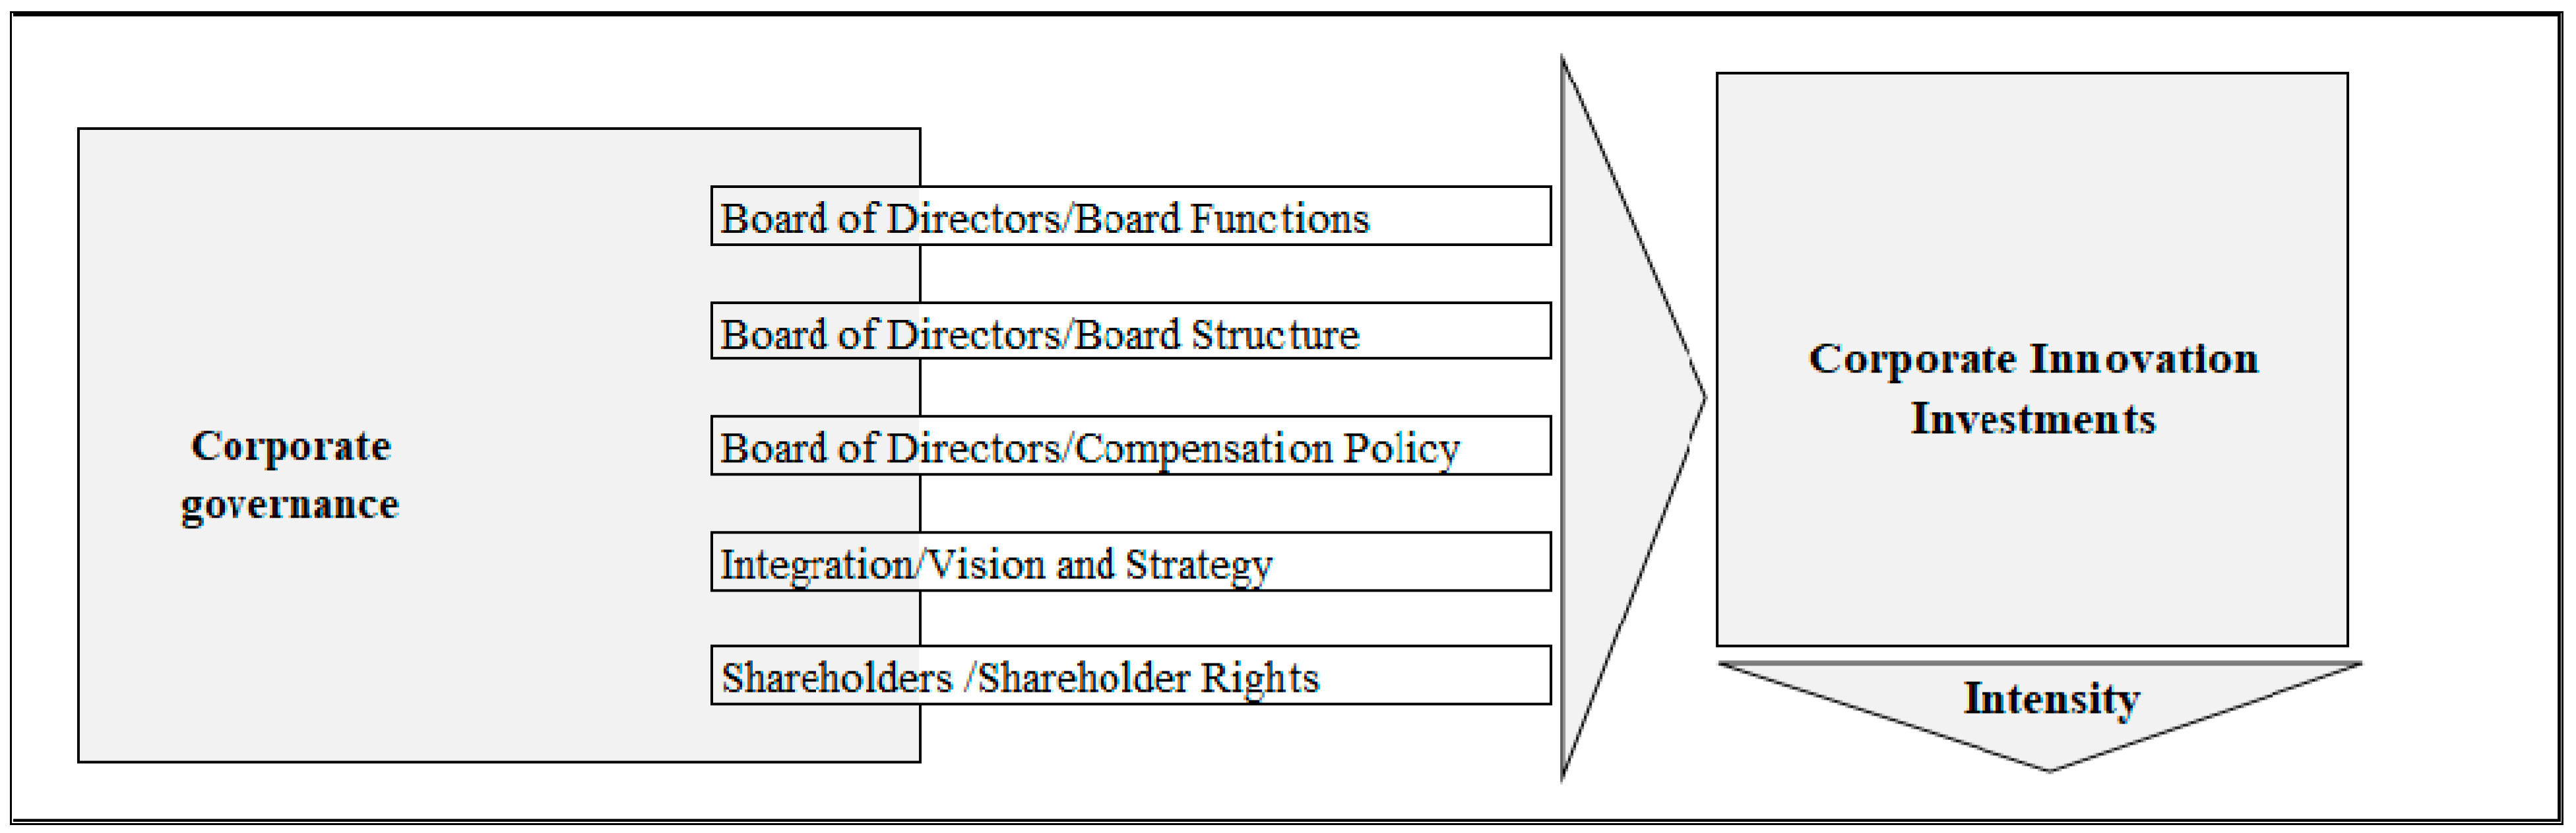
Variables of Boards:Evaluation’s Description
FunctionsThe clarity, validity, and consistency of the company’s management functions must be precisely defined and recorded to avoid unnecessary ambiguities.
StructureThe company’s management structure must be efficient, logical, and able to generate new ideas and implement those ideas by consensus on the company’s growth.
Compensation PolicyThe company’s management compensation policy must be consistent and not contradict the management’s ambitions and the company’s growth aspirations.
Strategy and Vision The company’s management strategy and vision must be based on innovations that create high added value, which would not contradict the general goal of the country—environmental protection and social responsibility.
Rights of Shareholders Company shareholders should be given equal lefts based on the desire to increase their invested assets.
To evaluate and interpret this, it is recommended to use a complex methodology that includes different indicators. More corporate innovation investments can have a relevant effect on the growth of a country’s economy. To further harmonize such phenomena and enable the country to achieve higher levels of sustainability growth and innovation, there should be business-driven investments in innovation through capital and energy resources, intensive R&D, and ultimately the growth of new or improved products, services, and marketing and organizational innovation.

3. The Research Hypotheses Based on the Literature

Research and development expenditure can be part of the total innovation investment process, and therefore, it is also significant for assessing the intensity of innovation investments. The more companies invest in research and development, the greater the intensity of their investments is in innovation. However, at the same time, if the desired results are not achieved, the company assumes a greater risk. In this case, the company risks all of its assets. Therefore, the intensity of an enterprise’s innovation investments can be described as the ratio of research and development costs to assets. Moreover, as per Table 2, financial performance and corporate governance can be key risk factors that can have a relevant effect on the intensity and risk of innovation investments. Financial ratios include debt ratio, cash ratio, return on assets, corporate size, and Tobin’s q ratio. Management of all these ratio shows how a company treats its shareholders, employees, customers, creditors, government, and the community.
The importance of corporate governance and financial performance on innovation investment intensity enables the formation of basic scientific hypotheses:
Hypothese 1 (H1).
Financial ratios influence the corporate innovation investment intensity.
Hypothese 2 (H2).
Corporate governance and financial ratios influence the corporate innovation investment intensity.
The following is a research methodology for accepting or rejecting formulated scientific hypotheses.

4. Research Methodology

The following are described in 3 steps for developing an evaluation methodology of corporate innovation investment intensity in the context of a country’s economic sustainability.
Step 1. Data collection. First of all, using Datastream, 50 countries from around the world were included, for which all relevant data were available. These countries are from 7 different regions of the world. Balancing was applied to the dataset. The evaluation methodology aims to analyze the impact of corporate governance and financial performance (return on assets, debt ratio, corporate size, cash ratio, Tobinq ratio) on corporate innovation investments in the context of a country’s economic sustainability. The evaluation methodology includes data from corporate that will enable the assessment of key factors influencing the intensity of corporate innovation investments [34,35].
The evaluation methodology was time-limited because not all historical required data were found for the investigation for more than 17 full years from 2002 to 2018 (see Table 3). The compiled dataset was included data from 50 countries in the 7 different regions of the world, which provided data on their financial performance, level of corporate governance, and R&D expenditure from 2002 to 2018. The evaluation methodology includes the microeconomic data of the corporate based on scientific literature. A total of 7 variables were included in the investigation.
Step 2. Calculation of ratios. Secondly, the following financial ratios were calculated: return on assets (ROA), debt ratio (DEBT_RATIO), corporate size (CORPORATE_SIZE), cash ratio (CASH_RATIO), and Tobin’s q Ratio (TOBINQ_RATIO)). The Winsorize process was also performed.
Methodologies for calculating each financial indicator included in the evaluation methodology are presented in Table 4.
Step 3. Step Formation of fixed-effects regression models. Third, fixed effects regression models were developed to test scientific Hypotheses 1 and 2. A fixed-effects regression model (see Formula (1)) was constructed to test Hypothesis 1; as such, a model allows the control of factors that are overlooked or unmeasured over time. Data are likely to have units of heterogeneity that can often be overlooked. Factors that are different but unobservable or unmeasurable over time should be controlled. Coefficient
I N N O V A T I O N _ I N V E S T M E N T S _ I N T E N S I T Y 1 i t = a + β 1 R O A i t + β 2 D E B T _ R A T I O i t + β 3 S I Z E i t + β 4 C A S H _ R A T I O i t + β 5 T O B I N Q _ R A T I O i t + u i + v i t
A second fixed-effects regression model (see Formula 2) was constructed to test Hypothesis 2.
I N N O V A T I O N _ I N V E S T M E N T S _ I N T E N S I T Y 2 i t = a + β 1 C O R P _ G O V E R N A N C E i t + β 2 R O A i t + β 3 D E B T _ R A T I O i t + β 4 S I Z E i t + β 5 C A S H _ R A T I O i t + β 6 T O B I N Q _ R A T I O i t + u i + v i t
Scales of correlation and determination values are very important in formulating and interpreting regression models.
The information about 2 fixed-effects regression models is summarized as follows. Model 1 included the following variables: size, debt ratio, return on assets, cash ratio, Tobin’s q ratio, intensity, and risk of corporate investments in innovation (tested Hypothesis 1). Meanwhile, model 2 included these variables: size, debt ratio, return on assets, cash ratio, Tobin’s q ratio, corporate governance, and corporate innovation investment intensity and risk (tested Hypothesis H2).

5. Results

To analyze whether the corporate governance and financial performance of corporate can influence their intensity of innovation investments, fixed-effects regression models were first developed, involving all countries. The first fixed-effects regression model included only corporate financial performance (corporate size, debt ratio, return on assets, cash, and Tobin’s q ratios) (see Table 4).
The results show (see Table 4) that all five financial variables included in the model are significant (the estimated probability p of all variables is less than the significance level 0.05). Consequently, financial variables of companies such as corporate size, debt ratio, return on assets, cash, and Tobin’s q ratios have a significant influence on the level of these companies’ investment intensity. The financial performance of four out of the five included in the model can reduce the corporate intensity of innovation investments (negative Coef.). These are corporate size, debt ratio, return on assets, and cash ratio. The decline in the level of innovation risk depending on corporate size expressed as a natural logarithm of assets indicates that for companies with more considerable assets, it is less risky to invest in innovation. Still, at the same time, the intensity of invention is slower. Growth of a company by increasing the volume of assets may signal smaller companies, which seek to reduce risk by investing in innovation. The potential reduction in innovation risk depending on the level of debt, reflecting the level of liabilities per unit of assets, means that companies with higher debt levels are less likely to invest in innovation.
For companies with significantly higher equity levels than debt, this may also be a signal for higher investment intensity. The decline in the risk level of innovation, influenced by the return on assets, which is expressed as the ratio of net profits to assets, shows that for companies with a higher return on investments, it is less risky to invest in innovation, but at the same time, innovation intensity may be slower. Management of net profit and wealth can signal companies with a lower return on assets that want to reduce risk by investing in innovation. The potential reduction in innovation risk depending on the cash ratio level, which reflects the amount of cash and cash equivalents per asset unit, means that companies with a higher cash level have a lower level of investment risk in innovation. For companies with consistently low cash balances, this can be a signal for reducing investment risk.
Contrary to corporate size, debt level, return on assets, and cash ratio, Tobin’s q coefficient in this regression model is positive. Consequently, depending on Tobin’s q ratio, which is expressed as the ratio of assets to market capitalization excluding equity and total assets, there is a potential increase in the intensity of innovation and, at the same time, an increase in risk. Increasing market capitalization per unit of assets may signal companies seeking to increase the power of creation. The coefficient of determination (R-squared) of this first fixed-effects regression model, showing the dispersion about the mean of the random values acquired, is 0.9128 (see Table 5). This ratio indicates that 91.28% of the financial performance (corporate size, debt ratio, return on assets, cash ratio, and Tobin’s q ratio) determines corporate intensity of innovation investments. Other unmeasured variables determine only 8.72 percent of the proportion of variation in the dependent variable.
The second regression model results show (see Table 6) that all variables included in the model are significant (the estimated probability p is less than a significance level of 0.05).
In this case, the corporate size, debt ratio, return on assets, cash ratio, and Tobin’s q ratio significantly influence corporate intensity of innovation investments and their corporate governance (see Table 6). According to this second regression model, the same four financial performance aspects (corporate size, debt ratio, return on assets, and cash ratio) may reduce the corporate intensity of innovation investments (negative Coef.). Declining innovation risk levels depending on corporate size, debt level, return on assets, and cash ratio indicate that for companies with higher asset volumes, return on assets, total equity, and cash levels, it is less risky to invest in innovation. The results of the first and second regression models show that, depending on the Tobin q ratio, there is the potential to increase innovation intensity and risk together. Moreover, an essential component of this regression model, an indicator of corporate governance that shows transparency, clarity, fairness, and efficiency of board functions, structure, and compensation policy, is that companies with greater transparency invest in innovation. In this case, the investment intensity of design is higher, but it also involves a higher risk. A more transparent practice in shareholder rights can signal companies seeking to increase power.
R-squared shows that 91.28% of financial performance and corporate governance determine corporate innovation investment intensity. Results show that other unmeasured variables determine only 8.72% of the variation in the dependent variable. The coefficient of determination correcting (Adj R-squared) for the increase in the standard deviation due to the addition of the variables of 0.8982 or 89.82% was corrected. It is also relatively high and significant.
In order to answer the main research question, i.e., whether corporate governance and financial performance influence the corporate innovation investments intensity regression, models were developed incorporating 42,160 observations and 7 indicators at the micro level. The results of the fixed regression model showed that corporate governance and financial performance (corporate size, debt ratio, return on assets, cash ratio, Tobinq ratio) significantly influence corporate innovation investment intensity.
Finally, evidence-based empirical calculations show that corporate governance and financial performance influence corporate innovation investment intensity in a country’s sustainability.

6. Conclusions

Despite the fact that investing in innovation is a very risky activity for a company due to high uncertainty, a successful outcome can create significant added value for both the company and the country in which it is located. The innovation investment value chain involves six important steps. As a first step, companies channel their money into R&D activities. During the second step, more R&D expenditure can increase the intensity of innovation investments. During the third step, the intensity of innovation investments (accompanied by innovation risk) creates added value for companies. During the fourth step, the intensity of innovation investments (accompanied by innovation risk) adds value to the countries. During the fifth step, the value added of the companies in the country contributes to the creation of the added value of the country’s development. Finally, during the last step, the added value created at a national level can contribute to the performance improvement of the company through the promotion of R&D spending. This creates a strong link not only between innovation investments and company growth but also between innovation investments and a country’s development. In addition, it creates a strong link between the growth of the corporates themselves and the evolution of the country. Corporate governance significantly impacts innovation investment intensity and risk for several reasons. Usually, board members are directors of different departments of the same company, who receive salaries and bonuses, and premiums for a company’s excellent performance. Innovation investments require additional risks that can affect a company’s performance, mainly when applied, fundamental, and experimental research is conducted. As a result, board members may avoid increasing innovation investments. The financial performance of corporate (mostly corporate size, debt ratio, return on assets, cash ratio, and Tobin’s q ratio) is significant. Different financial indicators that have a substantial impact are analyzed in scientific sources. Size can affect innovation investment capacity. Debt and cash may influence the sources of financing innovation investments. Return on assets and Tobin q are essential for all investors’ expectations on the market. A country’s sustainability based on economic growth and environmental and social protection is inseparable from innovation development (sustainable innovation). Thus, a design must be sustainable, contributing to the country’s sustainability goals, such as economic and innovation growth, reducing unemployment and poverty, and of course ensuring social protection and providing clean energy. However, this research has limitations on the sample (sample period, number of corporations, number of regions, and number of ratios). Therefore, future research directions could include the links between corporate governance, financial performance, innovation investment, and a country’s sustainability separately between different regions of the world, with a particular focus on emerging countries. This would allow for the development of further research and contribute to the development of countries in line with the 17 key objectives set by the United Nations.

Author Contributions

Conceptualization, R.B., H.G. and R.K.; methodology R.B., H.G. and R.K.; software, R.B., H.G. and R.K.; validation, R.B., H.G. and R.K.; formal analysis, R.B., H.G. and R.K.; investigation, R.B., H.G. and R.K.; resources, R.B., H.G. and R.K.; data curation, R.B., H.G. and R.K.; writing—original draft preparation, R.B., H.G. and R.K.; writing—review and editing, R.B., H.G., and R.K.; visualization, R.B., H.G. and R.K.; supervision, R.B., H.G. and R.K.; project administration, R.B., H.G. and R.K.; funding acquisition, R.B., H.G. and R.K. All authors have read and agreed to the published version of the manuscript.

Funding

This research received no external funding.

Institutional Review Board Statement

Not applicable.

Informed Consent Statement

Not applicable.

Data Availability Statement

Not applicable.

Conflicts of Interest

The authors declare no conflict of interest.

References

  1. United Nations. About the Sustainable Development Goals; United Nations: New York, NY, USA, 2020. [Google Scholar]
  2. Khan, I.; Hou, F.; Zakari, A.; Tawiah, K.V. The dynamic links among energy transitions, energy consumption, and sustainable economic growth: A novel framework for IEA countries. Energy 2021, 222, 119935. [Google Scholar] [CrossRef]
  3. World Bank. Inclusive Green Growth Policies Tailored to Real-World Challenges; World Bank: Washington, DC, USA, 2012. [Google Scholar]
  4. Sulkowski, A.J.; Edwards, M.; Freeman, R.E. Shake Your Stakeholder: Firm Initiated Interactions to Create Shared Sustainable Value. Organ. Environ. 2018, 31, 3. [Google Scholar] [CrossRef] [Green Version]
  5. Drews, S.; Antal, M.; van den Bergh, J.C.J.M. Challenges in Assessing Public Opinion on Economic Growth Versus Environment: Considering European and U.S. Data. Ecol. Econ. 2018, 146, 265–272. [Google Scholar] [CrossRef]
  6. Kubiszewski, I.; Costanza, R.; Franco, C.; Lawn, P.; Talberth, J.; Jackson, T.; Aylmer, C. Beyond G.D.P.: Measuring and achieving genuine global pro-gress. Ecol. Econ. 2013, 93, 57–68. [Google Scholar] [CrossRef] [Green Version]
  7. Posner, S.M.; Costanza, R. Baltimore County, and the State of Maryland. A summary of ISEW and GPI studies at multiple scales and new estimates for Balti-more City, Baltimore County, and the State of Maryland. Ecol. Econ. 2011, 70, 1972–1980. [Google Scholar] [CrossRef]
  8. Schneider, F.; Kallis, G.; Martinez-Alier, J. Crisis or opportunity? Economic degrowth for social equity and ecological sustainability. Introduction to this special issue. J. Clean. Prod. 2010, 18, 511–518. [Google Scholar]
  9. Nogueira, C. Contradictions in the concept of sustainable development: An analysis in social, economic, and political contexts. Environ. Dev. 2019, 30, 129–135. [Google Scholar] [CrossRef]
  10. Phama, H.; Kim, S. The effects of sustainable practices and managers’ lead-ership competencies on the sustainability performance of construction corporate. Sustain. Prod. Consum. 2019, 20, 1–14. [Google Scholar] [CrossRef]
  11. Eva, C. Alfredsson and J. Mikael Malmaeus. Real capital investments and sustainability—The case of Sweden. Ecol. Econ. 2019, 161, 216–224. [Google Scholar]
  12. Heikkurinen, P.; Young, W.; Morgan, E. Business for sustainable change: Extending eco-efficiency and eco-sufficiency strategies to consumers. J. Clean. Prod. 2019, 218, 656–664. [Google Scholar] [CrossRef]
  13. Tumelero, C.; Sbragia, R.; Evans, S. Cooperation in R & D and eco-innovations: The role in companies’ socioeconomic performance. J. Clean. Prod. 2019, 207, 1138–1149. [Google Scholar]
  14. Hoepner, A.; Oikonomou, I.; Scholtens, B.; Schroder, A.M. The Effects of Corporate and Country Sustainability Characteristics on The Cost of Debt: An International Investigation. J. Bus. Financ. Account. 2016, 43, 158–190. [Google Scholar] [CrossRef]
  15. Tomaselli, M.F.; Sheppard, S.R.J.; Kozak, R.; Gifford, R. What do Canadians think about economic growth, prosperity, and the environment? Ecol. Econ. 2019, 161, 41–49. [Google Scholar] [CrossRef]
  16. The Organisation for Economic Cooperation and Development (OECD). OECD and the Sustainable Development Goals: Delivering on Universal Goals and Targets; OECD: Paris, France, 2020. [Google Scholar]
  17. Hu, S.; Liu, S.; Li, D.; Lin, Y. How Does Regional Innovation Ca-pacity Affect the Green Growth Performance? Empirical Evidence from China. Sustainability 2019, 11, 5084. [Google Scholar] [CrossRef] [Green Version]
  18. Bebchuk, L.; Cohen, A.; Ferrell, A. What Matters in Corporate Governance? Rev. Financ. Stud. 2009, 22, 783–827. [Google Scholar] [CrossRef] [Green Version]
  19. Chen, X.; Liu, Z.; Zhu, Q. Performance evaluation of China’s high-tech innovation process: Analysis based on the innovation value chain. Technovation 2018, 74–75, 42–53. [Google Scholar] [CrossRef]
  20. Sheikh, S. The impact of market competition on the relation between C.E.O. power and corporate innovation. J. Multinatl. Financ. Manag. 2018, 44, 36–50. [Google Scholar] [CrossRef]
  21. Balsmeier, B.; Fleming, L.; Manso, G. Independent boards and innova-tion. J. Financ. Econ. 2017, 123, 536–557. [Google Scholar] [CrossRef]
  22. Ye, Q.; Wang, D.; Guo, W. Inclusive leadership and team innova-tion: The role of team voice and performance pressure. Eur. Manag. J. 2019, 37, 468–480. [Google Scholar] [CrossRef]
  23. Choi, S.B.; Park, B.I.; Hong, P. Does Ownership Structure Matter for Corporate Technological Innovation Performance? The Case of Korean Corporate. Corp. Gov. Int. Rev. 2012, 20, 267–288. [Google Scholar] [CrossRef]
  24. Sariol, A.M.; Abebe, M.A. The influence of C.E.O. power on explorative and exploitative organizational innovation. J. Bus. Res. 2017, 73, 38–45. [Google Scholar] [CrossRef]
  25. Sunder, J.; Sunder, S.V.; Zhang, J. Pilot C.E.O.s and corporate in-novation. J. Financ. Econ. 2017, 123, 209–224. [Google Scholar] [CrossRef]
  26. Bernile, G.; Bhagwat, V.; Yonker, S. Board diversity, corporate risk, and corporate policies. J. Financ. Econ. 2018, 127, 588–612. [Google Scholar] [CrossRef]
  27. Custodio, C.; Metzger, D. Financial expert C.E.O.s: CEO׳s work experience and corporate׳s financial policies. J. Financ. Econ. 2014, 114, 125–154. [Google Scholar] [CrossRef]
  28. Makri, M.; Scandura, T.A. Exploring the effects of creative C.E.O. leadership on innovation in high-technology corporate. Leadersh. Q. 2010, 21, 75–88. [Google Scholar]
  29. O’Connor, M.; Rafferty, M. Corporate Governance and Innovation. J. Financ. Quant. Anal. 2012, 47, 397–413. [Google Scholar] [CrossRef]
  30. Becker-Blease, J. Governance and innovation. J. Corp. Financ. 2011, 17, 947–958. [Google Scholar] [CrossRef]
  31. Ullah, B. Corporate innovation in transition economies: The role of formal versus informal finance. J. Multinatl. Financ. Manag. 2019, 50, 58–75. [Google Scholar] [CrossRef]
  32. Lehn, K. Corporate governance and corporate agility. J. Corp. Financ. 2021, 66, 101929. [Google Scholar] [CrossRef]
  33. Shen, H.; Zheng, S.; Xiong, H.; Tang, W.; Dou, J.; Silverman, H. Stock market mispricing and firm innovation based on path analysis. Econ. Model. 2021, 95, 330–343. Available online: https://www.sciencedirect.com/science/article/abs/pii/S026499931932019X (accessed on 5 March 2020). [CrossRef]
  34. Aghion, P.; van Reenen, J.; Zingales, L. Innovation and Institutional Ownership. Am. Econ. Rev. 2013, 103, 277–304. [Google Scholar] [CrossRef] [Green Version]
  35. Cho, S.Y.; Kimb, S.K. Horizon problem and corporate innovation: The influence of C.E.O. career horizon, exploitation, and exploration on breakthrough in-novations. Res. Policy 2017, 46, 1801–1809. [Google Scholar] [CrossRef]
Table 2. Key variables for innovation investments [19,21,23,26,28,33].
Significant VariablesReason of Significant Impact on Corporate Innovation Investment Intensity and Risk
Corporate governanceBoard members (among whom various company directors) can make important effect on the whole value chain of innovation investments
Corporate sizeSignificant impact on the volume of innovation investments
Debt ratioImportant influence on external sources of financing for investments
Return on assetsSignificant effect on corporate development and market prestige
Cash ratioSignificant impact on internal sources of financing for investments
Tobin’s q ratioImportant influence on corporate value. Corporate could increase the intensity of innovation investments, if asset’s market value is bigger than asset’s book value.
Table 3. Information of the countries that were included in the evaluation methodology.
RegionCountries
Western Europe (17 countries) 34%Austria
(AUT), Belgium (B.E.L.), Switzerland (C.H.E.), Germany (D.E.U.), Denmark (D.N.K.), Spain (E.S.P.), Finland (FIN), France (F.R.A.), United Kingdom (G.B.R.), Greece (G.R.C.), Ireland (IRL), Italy (I.T.A.), Luxembourg (LUX), Netherlands (NLD), Norway (NOR), Portugal (P.R.T.) and Sweden (S.W.E.)
Eastern Europe (4 countries) 8%Czech Republic (C.Z.E.), Hungary (H.U.N.), Poland (P.O.L.), and Russia (RUS)
North America (2 countries) 4%United States of America (U.S.A.) and Canada (CAN)
Latin America (5 countries) 10%Brazil (B.R.A.), Chile (C.H.L.), Colombia (C.O.L.), Mexico (MEX), and PER (Peru)
Asia (18 countries) 36%United Arab Emirates (A.R.E.), China (C.H.N.), Hong Kong (H.K.G.), Indonesia (IDN), India (IND), Israel (I.S.R.), Japan (J.P.N.), North Korea (KOR), Kuwait (K.W.T.), Malaysia (M.Y.S.), Philippines (P.H.L.), Qatar (QAT), Saudi Arabia (S.A.U.), Jordan (JOR) Singapore (S.G.P.), Thailand (T.H.A.), Taiwan (T.W.N.) and Turkey (TUR)
Africa (2 countries) 4%Egypt (E.G.Y.) and South Africa (Z.A.F.)
Oceania (2 countries) 4%Australia (AUS) and New Zealand (N.Z.L.)
Table 4. Description of the ratios included in the evaluation methodology and calculation methodology.
RatioNameMethodology (Measurement)
Intensity of innovation investmentsINNOVATION_INVESTMENTS_INTENSITYR&D EXPENDITURE/ASSETS (COEFF.)
Corporate governanceCGAVERAGE OF 5 SUB-DIMENSIONS OF BOARD’S (functions; structure; compensation policy; vision and strategy; shareholder rights) (SCORE FROM 1 TILL 100) Board (COEFF)
Return on assetsROANET INCOME/ASSETS (COEFF)
Debt ratioDEBT RATIODEBT/ASSETS (COEFF)
Corporate sizeCORPORATE SIZEL.N. (ASSETS) (COEFF)
Cash ratioCASH RATIOCASH/ASSETS (COEFF)
Tobinq ratioTOBINQ RATIO(ASSETS + MCAPx1000-COMMON EQUITY)/ASSETS (COEFF)
Table 5. Fixed-effects regression model results excluding corporate governance.
Number of Obs = 42,160 Prob > F = 0.0000
No. of Categories = 6033 R-Squared = 0.9128
F(21, 6032) = 5.23 Adj R-Squared = 0.8981
Root MSE = 0.0136
INNOVATION_
INVESTMENTS_
INTENSITY
Coef.RobusttP > t[95% Conf.][Interval]
Std. Err.
CORPORATE_SIZE−0.00400830.0008018−50.0000.000−0.0055802−0.0024364
DEBT_RATIO−0.00699720.0024296−2.8800.004−0.01176−0.0022343
ROA−0.01602270.0033633−4.7600.000−0.022616−0.0094295
CASH_RATIO−0.00969310.0033123−2.9300.003−0.0161865−0.0031997
TOBINQ_
RATIO
0.00124060.00047952.5900.0100.00030060.0021806
2003−0.00010450.0004124−0.250.800−0.0009130.000704
2004−0.00110220.0007342−1.500.133−0.00254150.0003371
2005−0.00129090.0008681−1.490.137−0.00299270.000411
2006−0.00042480.0009834−0.430.666−0.00235260.0015031
20070.00053470.00106140.500.614−0.00154610.0026154
20080.00203610.0010911.8700.062−0.00010260.0041748
20090.00107940.00115940.930.352−0.00119340.0033522
20100.00039690.00123150.320.747−0.00201730.0028111
20110.00106410.00127920.830.406−0.00144360.0035719
20120.001530.00131641.160.245−0.00105050.0041105
20130.00125220.00127920.980.328−0.00125540.0037599
20140.0013720.001272410.080.281−0.00112240.0038665
20150.00043680.0012560.350.728−0.00202540.0028991
20160.00146840.00127881.150.251−0.00103850.0039753
20170.00130550.001296910.010.314−0.00123680.0038478
20180.00125310.00142330.880.379−0.0015370.0040432
_cons0.07972080.01150036.9300.0000.0571760.1022656
Table 6. Results of a fixed-effects regression model incorporating corporate governance.
Number of obs = 42,160 Prob > F = 00.0000
No. of Categories = 6033 R-Squared = 0.9128
F(22, 6032) = 5.26 Adj R-Squared = 0.8982
Root MSE = 00.0136
INNOVATION_
INVESTMENTS_
INTENSITY
Coef.Robust Std. Err.tP > t[95% Conf.][Interval]
CORPORATE_SIZE−0.00409430.0008023−5.1000.000−0.005667−0.0025215
DEBT_
RATIO
−0.00698960.0024302−2.8800.004−0.0117537−0.0022254
ROA−0.01598450.0033622−4.7500.000−0.0225756−0.0093934
CASH_
RATIO
−0.00963730.0033123−2.9100.004−0.0161306−0.0031441
TOBINQ_RATIO0.00124530.00047962.6000.0090.00030510.0021855
CG0.00243920.00091522.6700.0080.00064510.0042333
2003−0.00008510.0004129−0.210.837−0.00089460.0007244
2004−0.00130070.0007408−1.7600.079−0.0027530.0001515
2005−0.00156580.0008758−1.7900.074−0.00328260.000151
2006−0.00069920.0009892−0.710.480−0.00263840.0012399
20070.00024490.00106250.230.818−0.00183790.0023277
20080.00173130.00109391.580.114−0.00041310.0038757
20090.00075170.00116290.650.518−0.0015280.0030315
2010−0.000008820.0012342−00.010.994−0.00242820.0024106
20110.00065060.00128420.510.612−0.0018670.0031681
20120.00110220.00132420.830.405−0.00149370.003698
20130.00082170.00129090.640.524−0.00170890.0033523
20140.00091180.00128420.710.478−0.00160560.0034293
2015−0.00008710.0012748−00.070.946−0.00258620.0024119
20160.00087550.00130110.670.501−0.00167520.0034261
20170.00065210.00132510.490.623−0.00194550.0032498
20180.00091130.00142390.640.522−0.001880.0037026
_cons0.08015490.01149466.9700.0000.05762140.1026884
Publisher’s Note: MDPI stays neutral with regard to jurisdictional claims in published maps and institutional affiliations.

