Article

Solar Thermal Processing to Disinfect Human Waste

1
Department of Chemical and Biological Engineering, University of Colorado at Boulder, 3415 Colorado Ave, UCB 596, Boulder, CO 80309-0596, USA
2
Solar Consulting, LLC, 505 Madison Street, Denver, CO 80206, USA
3
Department of Civil, Environmental and Architectural Engineering, University of Colorado at Boulder, 4001 Discovery Drive, UCB 607, Boulder, CO 80309-0607, USA
*
Authors to whom correspondence should be addressed.
Current address is Environmental Resources Engineering, Humboldt State University, Arcata, CA 95521, USA.
Sustainability 2021, 13(9), 4935; https://doi.org/10.3390/su13094935
Submission received: 7 March 2021 / Revised: 12 April 2021 / Accepted: 22 April 2021 / Published: 28 April 2021

Abstract

:
Almost half of the world’s population is living without access to sanitation services that are safe, reliable, and minimize public health risk of human waste exposure. Modern flush-based sanitation networks are unsustainable: substantial resources, namely water and fuel, are required to bring human waste to centralized treatment facilities. Moving toward sustainable sanitation requires the implementation of innovative renewable energy technologies for stabilization and disinfection of waste, at the local or household scale, where minimal inputs of water, electricity or chemicals are required. A novel solar thermal disinfection toilet prototype has been constructed and is assessed for overall solar to receiver efficiency in treating waste without electrical, chemical, or water inputs from municipal supply. The measured solar to receiver efficiency is 28%, incorporating the capturing and concentration of sunlight and transmission of the energy to the receiver. For a typical sunny day, the current system can achieve thermal treatment of 0.8 kg human waste in roughly 100 min. The novel toilet is available for any location in the world with sufficient sunlight and irradiance data, and is scalable by adding solar collectors for sizes from single dwellings to communities.

1. Introduction

Today, 4.2 billion people, or roughly 55% of the world’s population, lack access to safely managed sanitation services defined as systems which safely manage human excreta from containment to eventual disposal or reuse [1,2]. A majority of these people live in Eastern and Southern Asia, Sub-Saharan Africa, Latin America and the Caribbean. Climate refugee and homeless camps, and COVID-19 infections [3,4,5] are on the rise globally. A lack of safe sanitation leads to risk of infection, disease, environmental damage, as well as secondary impacts such as malnutrition, anxiety, adverse birth outcomes, antimicrobial resistance, and decreased economic productivity. Urban centers will face growing challenges of demand for water and sanitation services and rural communities must address the service gap experienced by people in those areas. For nations with populations that lack sanitation, the implementation of a sanitation system can require significant behavioral changes, high demands on water resources, as well as untenable costs to individual households. Novel alternatives to conventional sanitation that will allow access to improved sanitation for both urban and rural populations can make a significant impact on health and the environment.
Appeals to the environmental engineering community at-large for alternatives to flush-based sanitation systems have been made as early as 1971 [6]. As more people connect to public sewer networks, improvements in health, environmental or economic outcomes for low- and middle-income nations are not likely to bear fruit if sewage is not treated before flowing out of the sewers and back into local water resources [7]. It has been estimated that more than 70% of fecal waste generated each year in low- and middle-income cities is released to the environment without adequate treatment [8,9,10]. As regions become more developed and exert higher demand on their resources, flush-based sanitation networks are not a sensible solution due to the high cost of sewage treatment [11]. Many alternative sanitation technologies have been developed as off-the-grid waste treatment processes with varying degrees of success regarding adoption of alternative technologies [12]. Recovering resources from waste is becoming increasingly attractive globally, for low- [13] and high-income [14] countries alike that face mounting pressure to accommodate growing populations that produce growing amounts of waste with limited energy, water, and land resources [15].
A novel Sol-Char prototype sanitation toilet system is described and quantified. It is used to disinfect human waste by utilizing renewable solar energy and, under certain conditions, can pyrolyze the waste to form biochar [16,17,18,19]. A schematic of the Sol-Char disinfection system is shown in Figure 1 with a photograph shown in Figure S1. It con sists of (1) reflective parabolic solar concentrators, (2) optical fiber bundles for transmitting concentrated sunlight for heating, (3) a squat-plate toilet, and (4) an insulated solar thermal receiver. Concentrated solar power (CSP) is generated by eight reflective parabolic concentrators that are coupled to fused silica or borosilicate optical fiber bundles. These bundles carry the concentrated solar power to the outer diameter of the feces pyrolysis receiver, made from stainless steel. Optical fibers are ubiquitous around the world and are used as waveguides for low-flux, low-power data transmission and communication [20].
The concept of solar concentrators using fiber optics for delivery of sunlight [21] was first proposed over forty years ago [22]; however, the successful demonstration of this approach was only made possible after the development of improved fiber optic technology for communications. The growth in the use of fiber optics for a number of applications outside of solar, enabled by glass fibers of sufficient purity and low enough cost, has spurred their use in solar thermal systems [23,24,25,26,27,28,29], solar lighting [30,31,32], photovoltaics [33] and photoreactors [34,35]. The opportunity for using fiber optics for solar thermal power is enormous as it would safely allow bringing concentrated solar indoors for domestic applications such as heating the underside of a cook plate and heating a water tank, in addition to this current application of disinfecting feces. Of course, such uses are dependent on lower cost fibers with efficient transmission and on the ability to efficiently couple concentrated solar energy to the fiber inlet. Kribus [26] directly assessed the challenges of fiber optic cost that will likely limit fiber optic systems to small scale. Such demonstrations have been very encouraging and show the potential for both good performance and achievement of high temperature [36]. Nakamura and Senior demonstrated the use of optical fibers supplying concentrated solar power from parabolic reflectors to a high-temperature receiver [37].

2. Materials and Methods

The Sol-Char sanitation system (Figure S1) includes multiple concentrators on a single tracked platform with multiple fiber optic bundles delivering concentrated sunlight to a stationary receiver. A flat turning mirror is added in front of the nominal focal point of each parabolic concentrator to redirect the beam back down the optical axis and to simplify, and shorten, the fiber optic bundle routing. A quartz homogenizing rod with polished ends was used to reduce the peak flux on the fiber bundle entrance. This also served to slightly shorten the bundle length at the expense of two additional surfaces for Fresnel reflection. The fiber bundles are attached at the back of the parabolic concentrator and routed to the receiver. The length of each bundle is sufficient to account for daily azimuthal tracking of the concentrator array and distance to the treatment system.
Here, the concentrator design, methods for solar thermal to fiber optics coupling, transmission through different types of fibers, flux distribution, power measurements, measured efficiency throughout the network, and a simplified model for the receiver are described. Delivery of concentrated solar radiation via fiber optic bundles offers design flexibility for small systems by allowing the receiver to be located away from the focal point of the concentrator. This project demonstrated the ability to focus sunlight from small-diameter parabolic dishes onto relatively large diameter fiber bundles and deliver that sunlight into a stationary receiver. Both fused silica and borosilicate fiber bundles were tested. The energy requirements for this process drove the small-scale design.

2.1. Concentrators

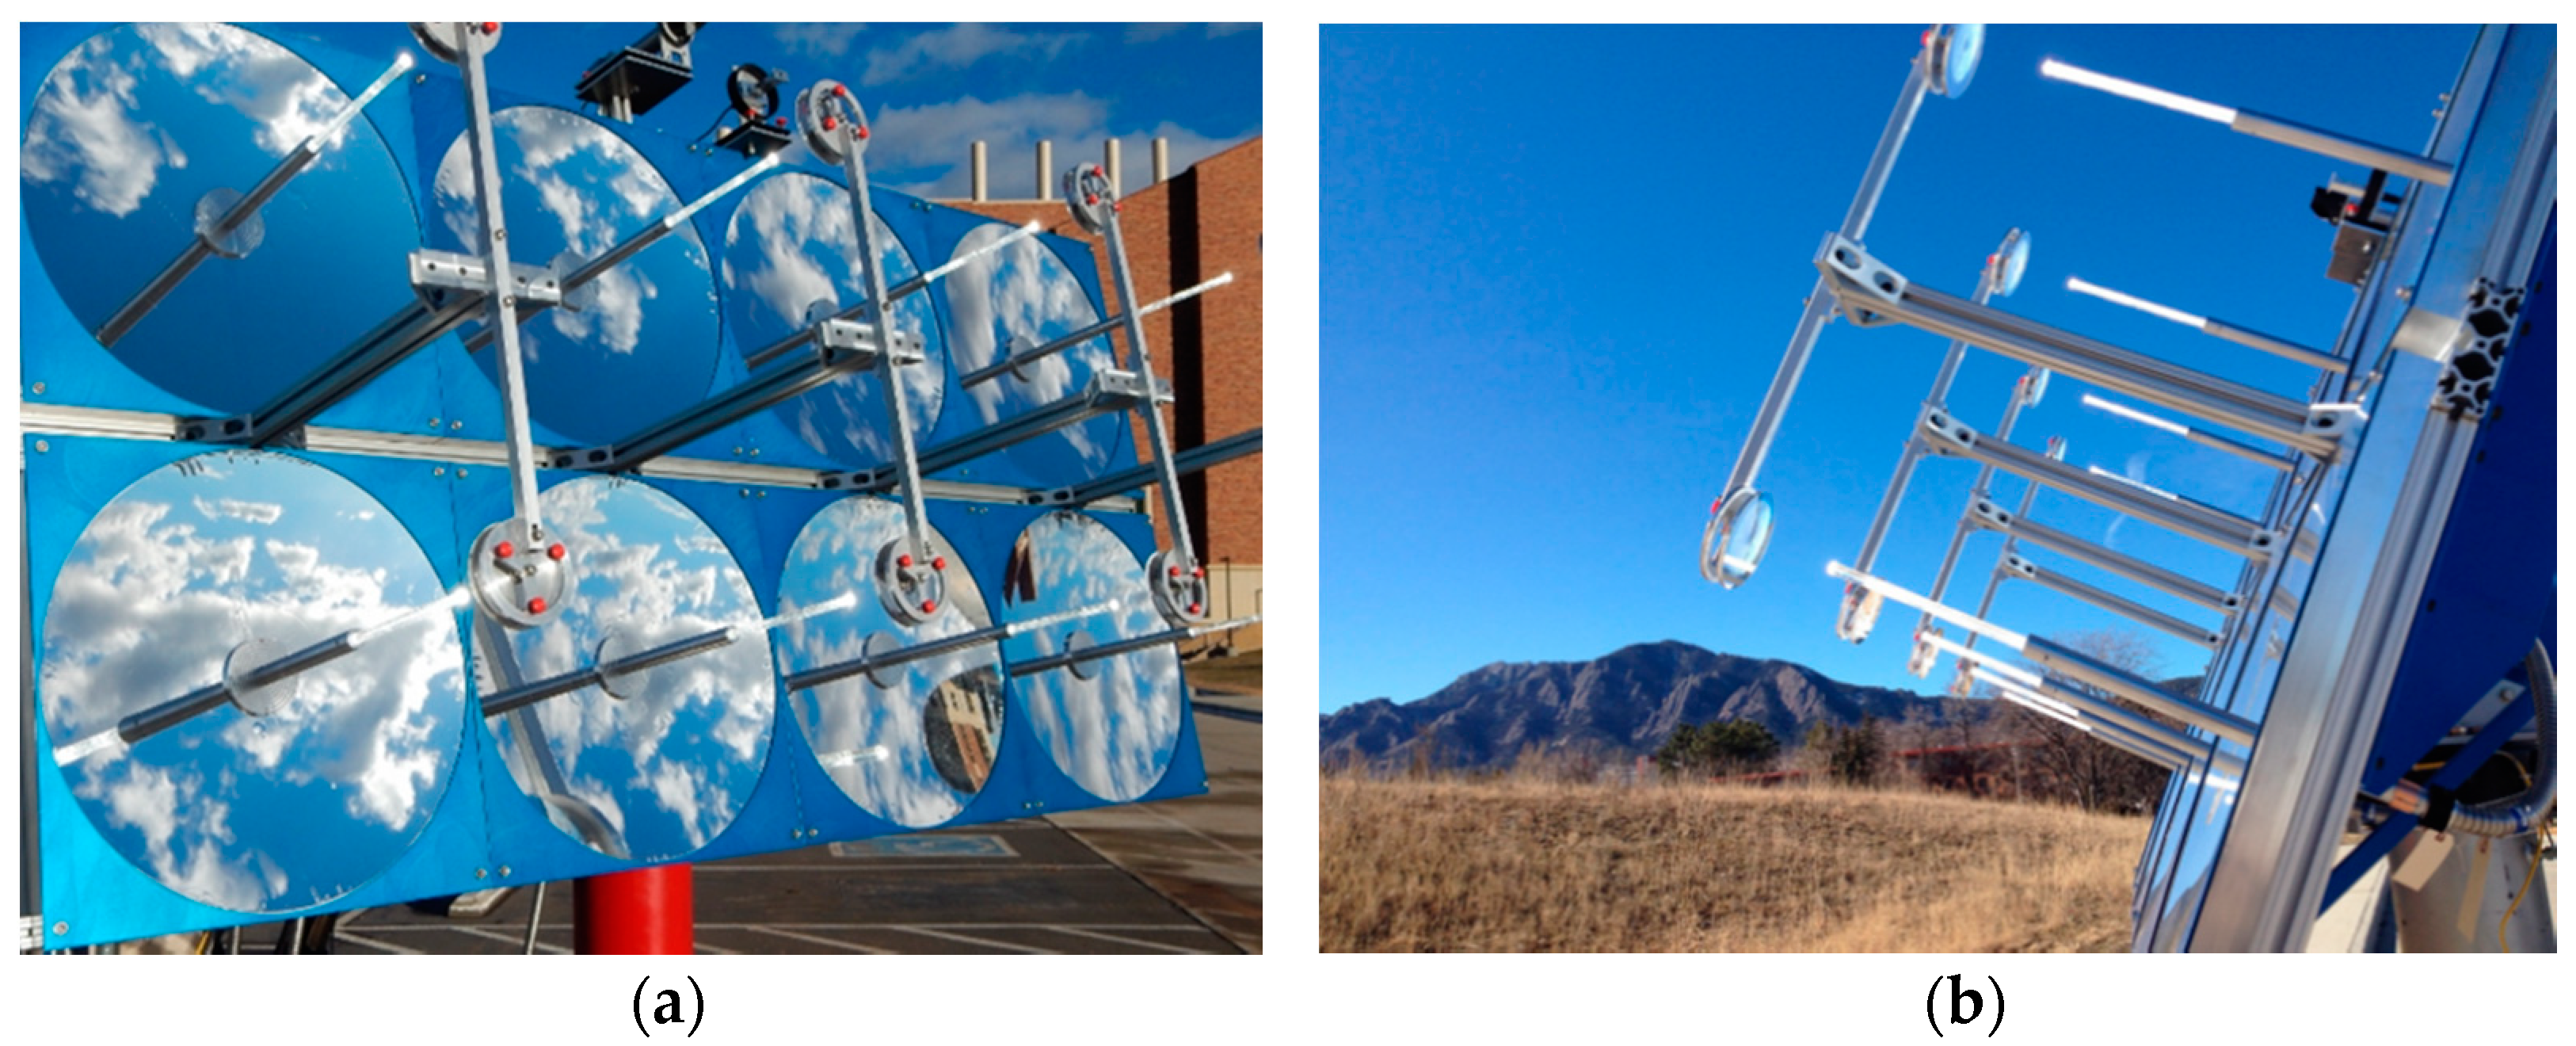
The solar concentrators were designed to provide enough heat to the receiver (3750 kJ/day) such that the feces from 4 to 8 people (0.2–0.4 kg waste per person per day) were dried, disinfected and potentially pyrolyzed in the daylight hours of a typical sunny day. Assuming operation of the system for 4 h per day at direct normal irradiance (DNI) of 800 W/m2, the instantaneous power delivered is approximately 1120 W. The parabolic solar concentrators, shown in detail in Figure 2, are 600 mm diameter dishes with each focusing sunlight to small 12 mm diameter fiber bundles; the fiber bundle entrance is located roughly 690 mm from the dish surface. The concentrator system is shown on the sun in Figure 2a. Some imperfections in the 3M film application process can be seen, particularly around the edge of the concentrators. A Kipp & Zonen CH1 pyrheliometer and a shadow tracking sensor can be seen at the top. A detailed view of the parabolic solar concentrators actively on-sun is shown in Figure 2b.
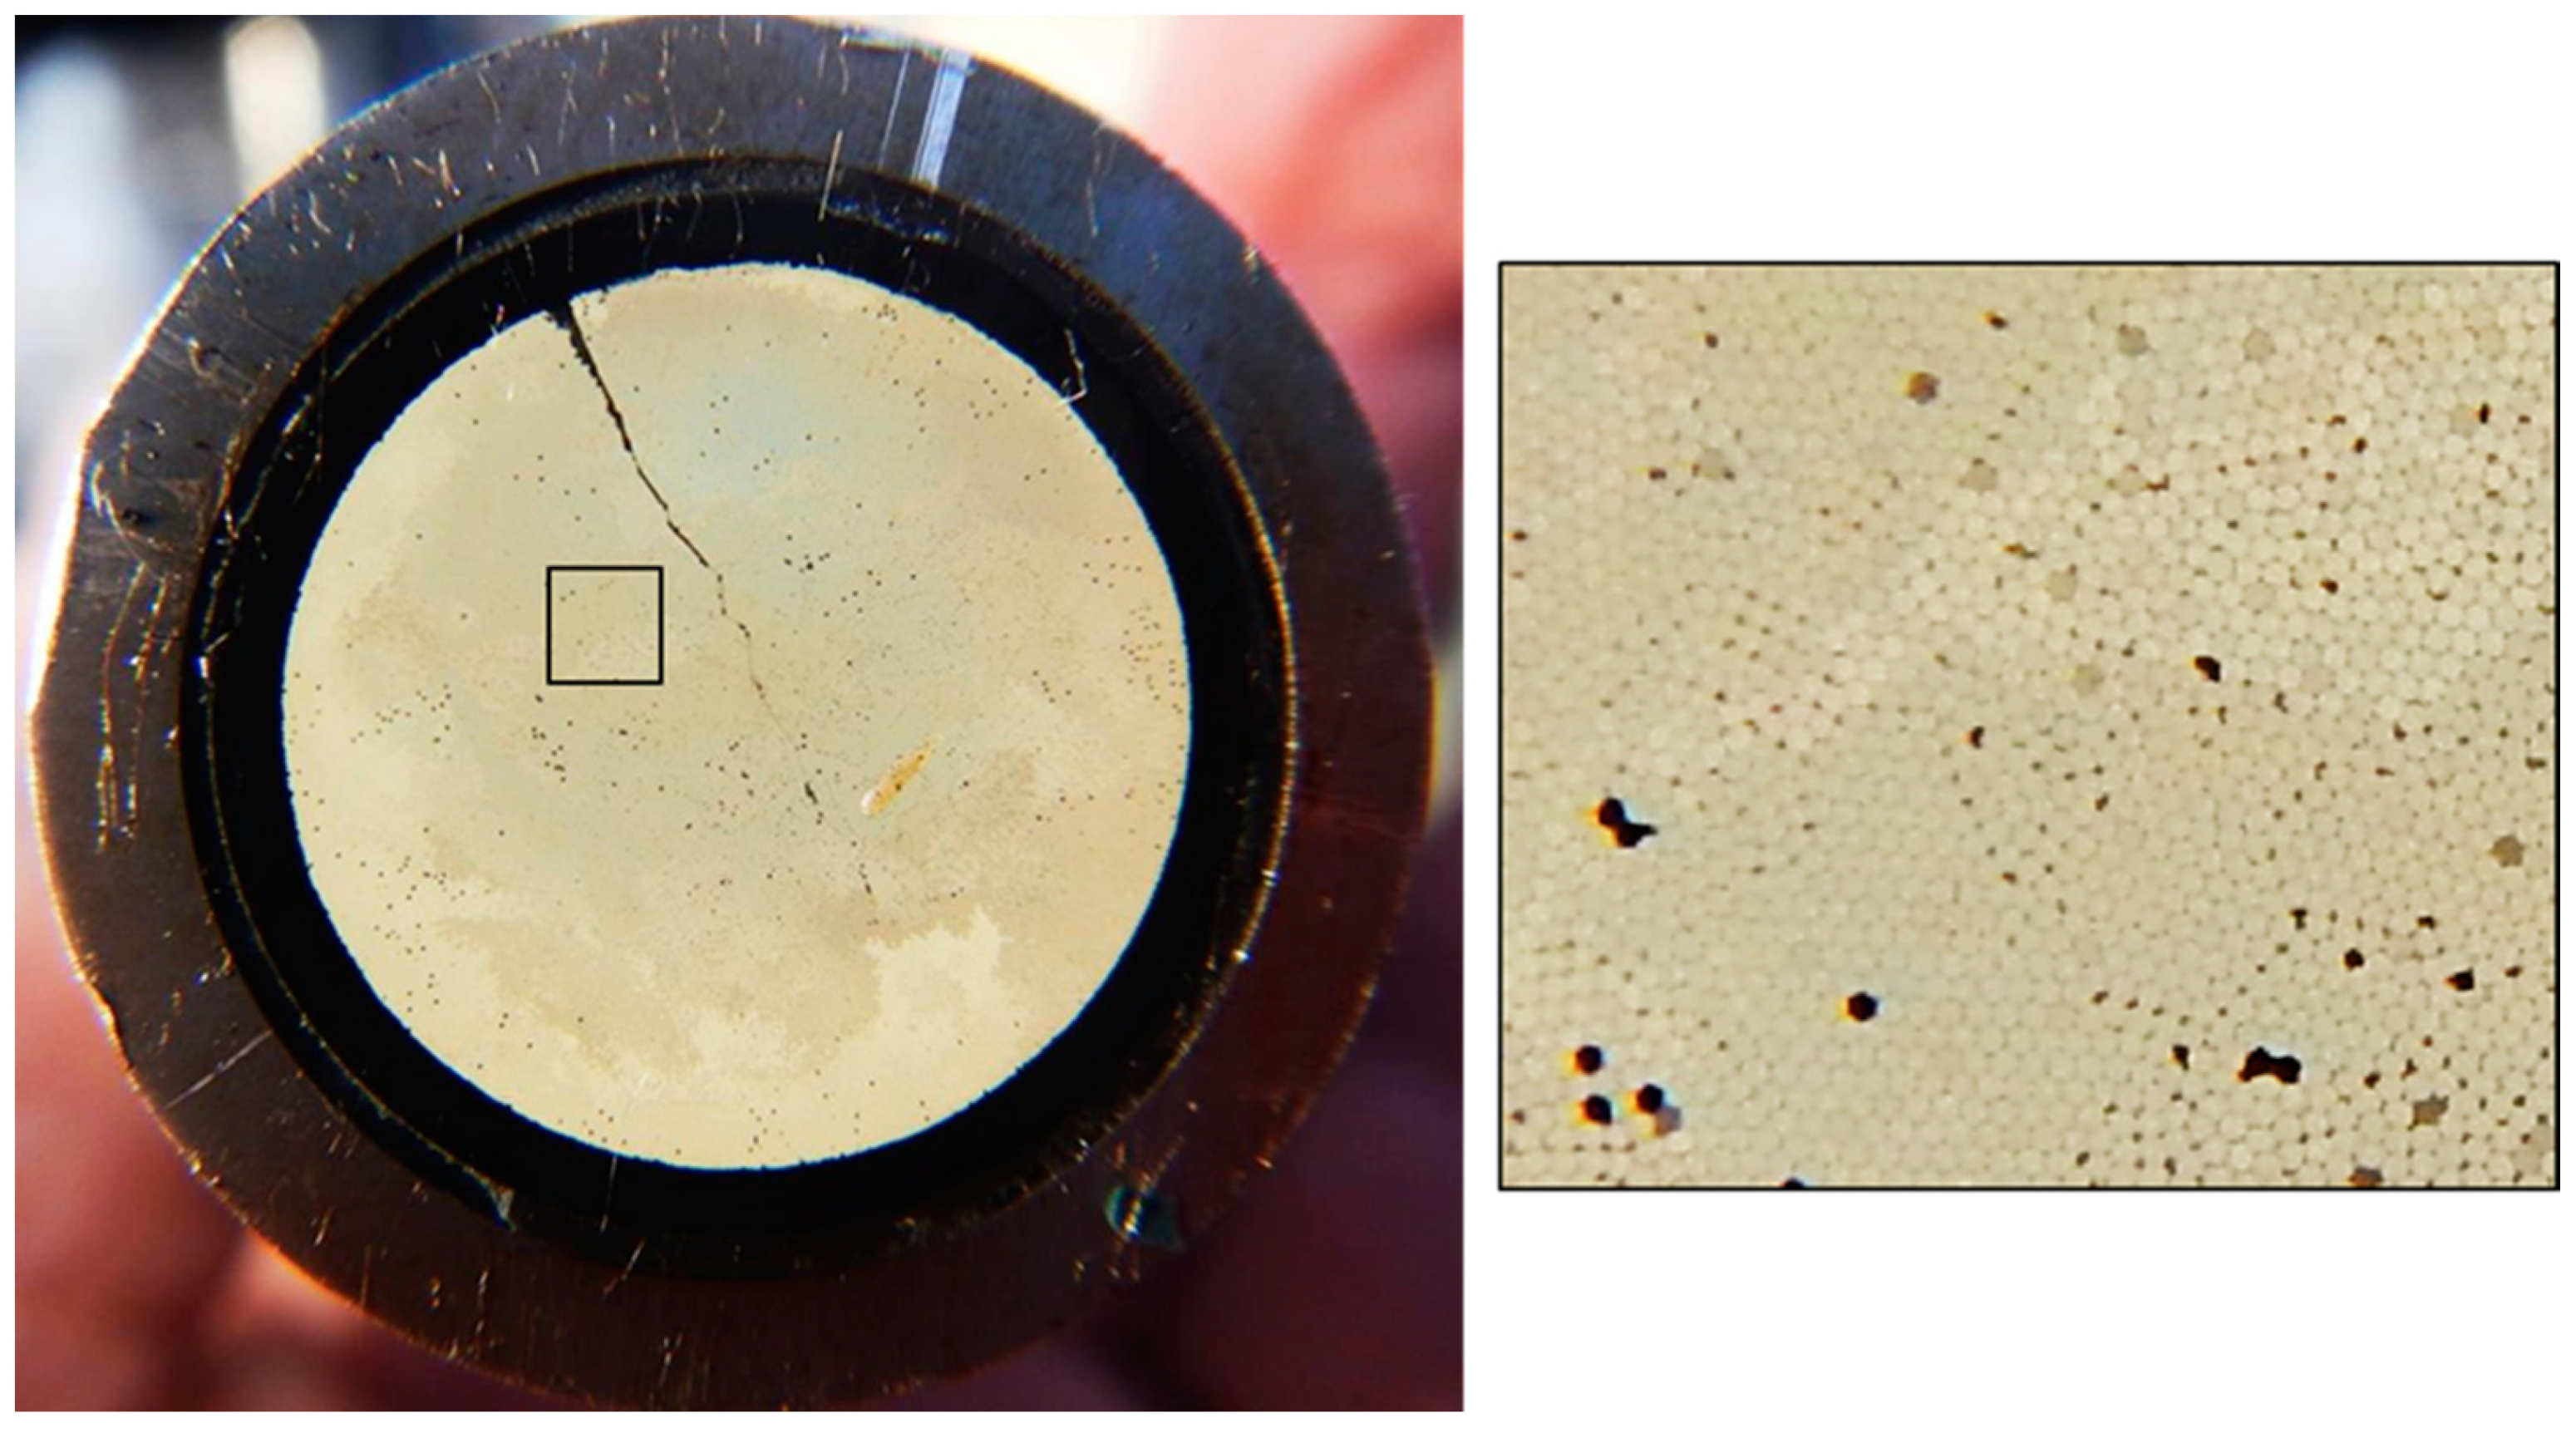
Optical fibers are used to safely bring concentrated solar energy from the solar concentrators to the solar thermal treatment receiver. Silica and borosilicate fibers were fused at both ends to maximize the optical surface for concentrated solar power to enter the fiber bundle. A detailed view of the fused end on one of the borosilicate fibers used in the Sol-Char prototype is shown in Figure 3. A zoomed-in view of the fiber packing is also shown. These fibers were chosen due to their survivability to exposure of very high fluxes of concentrated sunlight.
The initial step in the design was to estimate the efficiency of delivering the sunlight to the reactor. Reasonable estimates were generated based on engineering experience (Table S1). An overall efficiency of sunlight to delivered power was estimated to be 0.43. A concentrator area of 3.3 m2 (2.0 m diameter) at that efficiency would be needed to supply ~1120 W. This is not unreasonable for a small-scale system, but probably too large for a single concentrator with a single fiber optic bundle. To complete the initial design, more practical dimensions for a multiple concentrator system with realizable fiber bundle sizes were assumed.
A large number of design parameters must be considered to generate a more detailed design for the concentrator and its components. With the use of fiber optics, a critical consideration is the numerical aperture (NA) of the fiber. In theory, Total Internal Reflection (TIR) within the fiber is achieved for a clad fiber with air at the entrance end at an angle (φ) defined by:
sinφ = NA = (n12 − n22)½
where n1 = index of refraction of the fiber core, n2 = index of the cladding, and φ = maximum incidence angle for TIR at the fiber entrance.
The angle φ corresponds to the rim angle (θ) of the concentrator and, to first order, θ ≤ φ. Other studies [38] have shown that the cutoff at the critical angle is not always sharp and depends on a number of factors.
Practical NA values for commercially available fibers are in the range 0.35 to 0.60 (φ = 20.5° to 36.9°). When the correspondence between θ and φ is applied, this results in a much “longer” solar concentrator than is typical for thermal applications (where θ ~ 45° or focal length to diameter ratio, f/D ~ 0.6 for most dish systems). The relationship between rim angle and f/D for a parabola is given by:
tanθ = [8(f/D)]/[16(f/D)2 − 1]
The resulting relationship between the rim angle of the concentrator and the NA of the fiber is shown in Figure S2. The data point shown is the selected design NA based on the availability and suitability of fused silica fibers. The higher NA of borosilicate fibers (~0.55) means that those fibers could also be used without design changes as the required rim angle is well within the critical angle at that NA. The selected design NA = 0.415 results in a φ = θ = 24.5°, and f/D = 1.15. A concentrator diameter of 0.6 m was chosen as a workable size, resulting in 8 concentrators to deliver the required power. At this diameter, the focal length was f = 0.69 m.
Each of the concentrators was machined to the parabolic contour by CNC from a square, thin block of aluminum and subsequently polished. The underside of the block was also light weighted. A 3M (Saint Paul, MN, USA) SMF1100 (3M 2012) film was used for the reflective surface. The film was applied by mounting a section onto the square aperture of the aluminum block. While applying heat to the block, a vacuum was applied to slowly pull the film onto the parabolic surface. The film stretches, but at this f/D does not exceed the maximum elongation at yield. A trial-and-error approach resulted in an acceptable conformation of the film to the aluminum substrate with a minimum of bubbles. This approach does not represent a viable longer-term method for applying this film; however, it did result in a good optical surface quality for this project.

2.2. Turning Mirrors

As shown in Figure 2, the overall design was simplified by using a flat turning mirror in front of the nominal focal point. This redirects the concentrated beam back down the optical axis and significantly shortens the length of fiber optic cable needed. The turning mirror size and position were determined so that essentially 100% of the reflected sunlight was captured, blockage of the incoming beam was minimized, and peak and average flux were sufficiently low to allow for passive cooling of the mirror surface. The values chosen for the turning mirror are: location 0.85f from the vertex and diameter of 11.5 cm (these mirrors were supplied by Flabeg Technical US Glass; Naugatuck, CT, USA). This size mirror blocks only about 4% of the incoming sunlight and allows for a shaded area around the vertex to conveniently mount homogenizing rod support hardware, measurement equipment and finally, fiber optic mounting.
The restriction to longer f/D and other design choices impact the achievable image size at the focal point of the concentrator. To predict the image size, SolTrace [39], a Monte Carlo ray-tracing code developed specifically for solar concentrator analysis, was used. While this code is very versatile, it is not capable of easily modeling complex refractive systems such as a fiber bundle. Nonetheless, the nominal component geometry (Table S2) to just beyond the exit of the homogenizing rod was used in the concentrator analysis.
A simulation using 500,000 rays generated performance estimates. A concentrator diameter of 0.6 m will have a maximum of 283 W incident on its reflective surface at a direct irradiance of 1000 W/m2. When blockage by the turning mirror and its support arm (0.06 m wide) and surface reflectance are considered, the concentrator will deliver 252 W to the turning mirror plane. The turning mirror intercepts 0.999 of that power and reflects 240 W to the plane at the homogenizing rod entrance (redirected focal point). For the selected rod diameter (13.5 mm), about 0.89 of that power will be intercepted. For the values in Table S2, the average flux over the rod diameter was ~1500 kW/m2 with a peak of ~5700 kW/m2. This is a very significant peak flux and was a driving factor to select a homogenizing rod in the design.

2.3. Homogenizing Rod

A cylindrical quartz rod was employed to serve as a homogenizer specifically to reduce the peak flux on the fiber bundle surface and to move the bundle attachment location to the back of the concentrator surface. Based on initial analysis of performance, a rod diameter of 13.5 mm with a length of 61 cm was chosen. During testing, a variety of rod diameters was used based on the selected fiber optic bundle. These rods were obtained from United Silica Products (Franklin, NJ, USA) with fire polished ends. This resulted in somewhat rounded edges and, in some cases, the rods were further polished to reduce the impact of this. The rods were mounted in an aluminum tube with 3-point support at each end. The supports were adjustable to provide for accurate positioning and alignment within the tube and provide an air gap between the tube and rod. The tubes were fixed to the concentrator using a flange that allowed the rods to be positioned along the optical axis. The flange also provided support for the fiber optic bundle in a similar way, allowing for direct contact between the bundle and the rod. The completed assembly on sun during the test phase of the project is shown in Figure 2.
Modeling showed that the reduction in peak flux was significant. At the exit of the rod, the average was ~1400 kW/m2 with a peak of ~2600 kW/m2. The average flux decrease was due primarily to Fresnel loss while the peak reduction was from homogenization. Losses through Fresnel reflection and additional small transmittance loss result in 195 W delivered to a fiber bundle surface of the same 13.5 mm diameter as the rod. This represents an overall efficiency to that point of 0.69. The predicted flux distribution at the entrance and exit of the homogenizing rod is shown in Figure 4. The size of the rod is superimposed in white to show the relative area of the beam that is intercepted. A selected number of rays reflected from the turning mirror are traced through the homogenizing rod, which is shown in 2-dimensions in Figure 5. Refraction at the entrance, total internal reflection (TIR) through the rod and refraction at the exit are shown.

2.4. Optical Fibers

Clad fibers suitable for this application are available in plastic, fused silica or borosilicate glass. Bundles of fibers are needed in order to meet the nominal size requirements (~13 mm image diameter). Other requirements are high broadband transmittance over the few meters for this application, low cost, large core diameter (~1 mm), adequate flexibility and sufficiently high NA. The tradeoff between performance and cost is a major consideration as these two factors are inversely proportional. First, plastic fibers were eliminated from consideration due to their high losses, particularly in the ultraviolet and infrared. Fused silica fibers meet all the requirements except low cost. Borosilicate fibers are low cost but have very small diameter and have higher transmission losses than fused silica fibers. Even when the large number of fibers required for a bundle was considered, borosilicate fibers have a very large cost advantage. Both options were pursued initially; however, it was clear that a borosilicate bundle was the most likely viable option from a cost perspective at this time.
With multiple fiber bundles, there are a few options for engineering those fibers into a manageable package. In previous work [40], the sides of fibers were polished to allow hexagonal packing of the fused silica fibers. Arnaoutakis [41] explored various coupling options for mating large, hyperbolic-profiled secondaries to single optical fibers. Nakamura [33] machined a single, multi-element optic to mate with 56 individual fibers. These three approaches allow the separation of the individual fibers at the inlet end with simple mechanical containment at the outlet end. However, each of these also requires highly accurate forming, machining, coating and/or polishing to achieve good performance. All that would very likely contribute to significant increases in cost. Another option is to either mechanically hold the fibers at the inlet end or fuse them. Both mechanical and fused approaches were evaluated.
The appreciable packing loss for circular fibers (optimal packing of circles within a circle approaches 0.85 for a large number of inner circles) causes several potential problems. Any open area is a light trap for highly concentrated radiation and may result in overheating at the concentrations required to minimize the area of fiber optics required. It would also be difficult to hold the fibers in place to maintain a polished front surface. One alternative tested was a fiber bundle (15.9 mm overall diameter) with the fibers (50 cm long, 50 µm diameter borosilicate fibers) bonded using a high temperature epoxy and contained in a stainless-steel ferrule at both ends, provided by Gulf Fiberoptics (Oldsmark, FL, USA). While initial testing at low flux levels was encouraging, this assembly failed quickly at full power with obvious melting of the fibers. This option was then abandoned.
The other option is to fuse the fibers at one or both ends of the bundle. A commercial product of this type is available from CeramOptec (East Longmeadow, MA, USA) in their PowerLightGuide line. In this case, the largest NA available was 0.37 which was lower than the NA of the concentrator (0.415). The largest bundle diameter available was 12 mm. A 4 m-long bundle with 3600 185 µm-diameter, pure fused silica core fibers with a 200 µm-outer diameter, fluorine-doped, fused-silica cladding was used. Two vendors of fused borosilicate bundles (CT Fiberoptics; Somers, CT, USA and Acrolite; Elbridge, NY, USA) were able to enhance their production capability to produce fused bundles of sufficient diameter for this application.

2.5. Solar Receiver

A 316SS solar thermal receiver is designed to collect 4–8 people’s (roughly 0.2–0.4 kg feces) [42] waste each day and to be heated using concentrated sunlight from the fiber optic bundles. The outer surface of the receiver was painted with flat black solar absorbing paint (Tempil® Pyromark® 2500; Elyria, OH, USA), which has high absorbance for solar spectrum wavelengths [43]. The receiver had an inside radius of 4.78 cm with a wall thickness of 0.31 cm. It was 22.9 cm tall. The height of feces studied in the experiment was 15.4 cm.

3. Results and Discussion

Initial testing was performed using a single concentrator. Measurements included flux distribution at the redirected focal point (rod entrance), power at the rod exit and power at the exit of the selected fiber bundle. In addition, the tracking performance of the system was evaluated. Each of these is discussed in the following sections.

3.1. Measured Flux Distribution and Tracking Performance

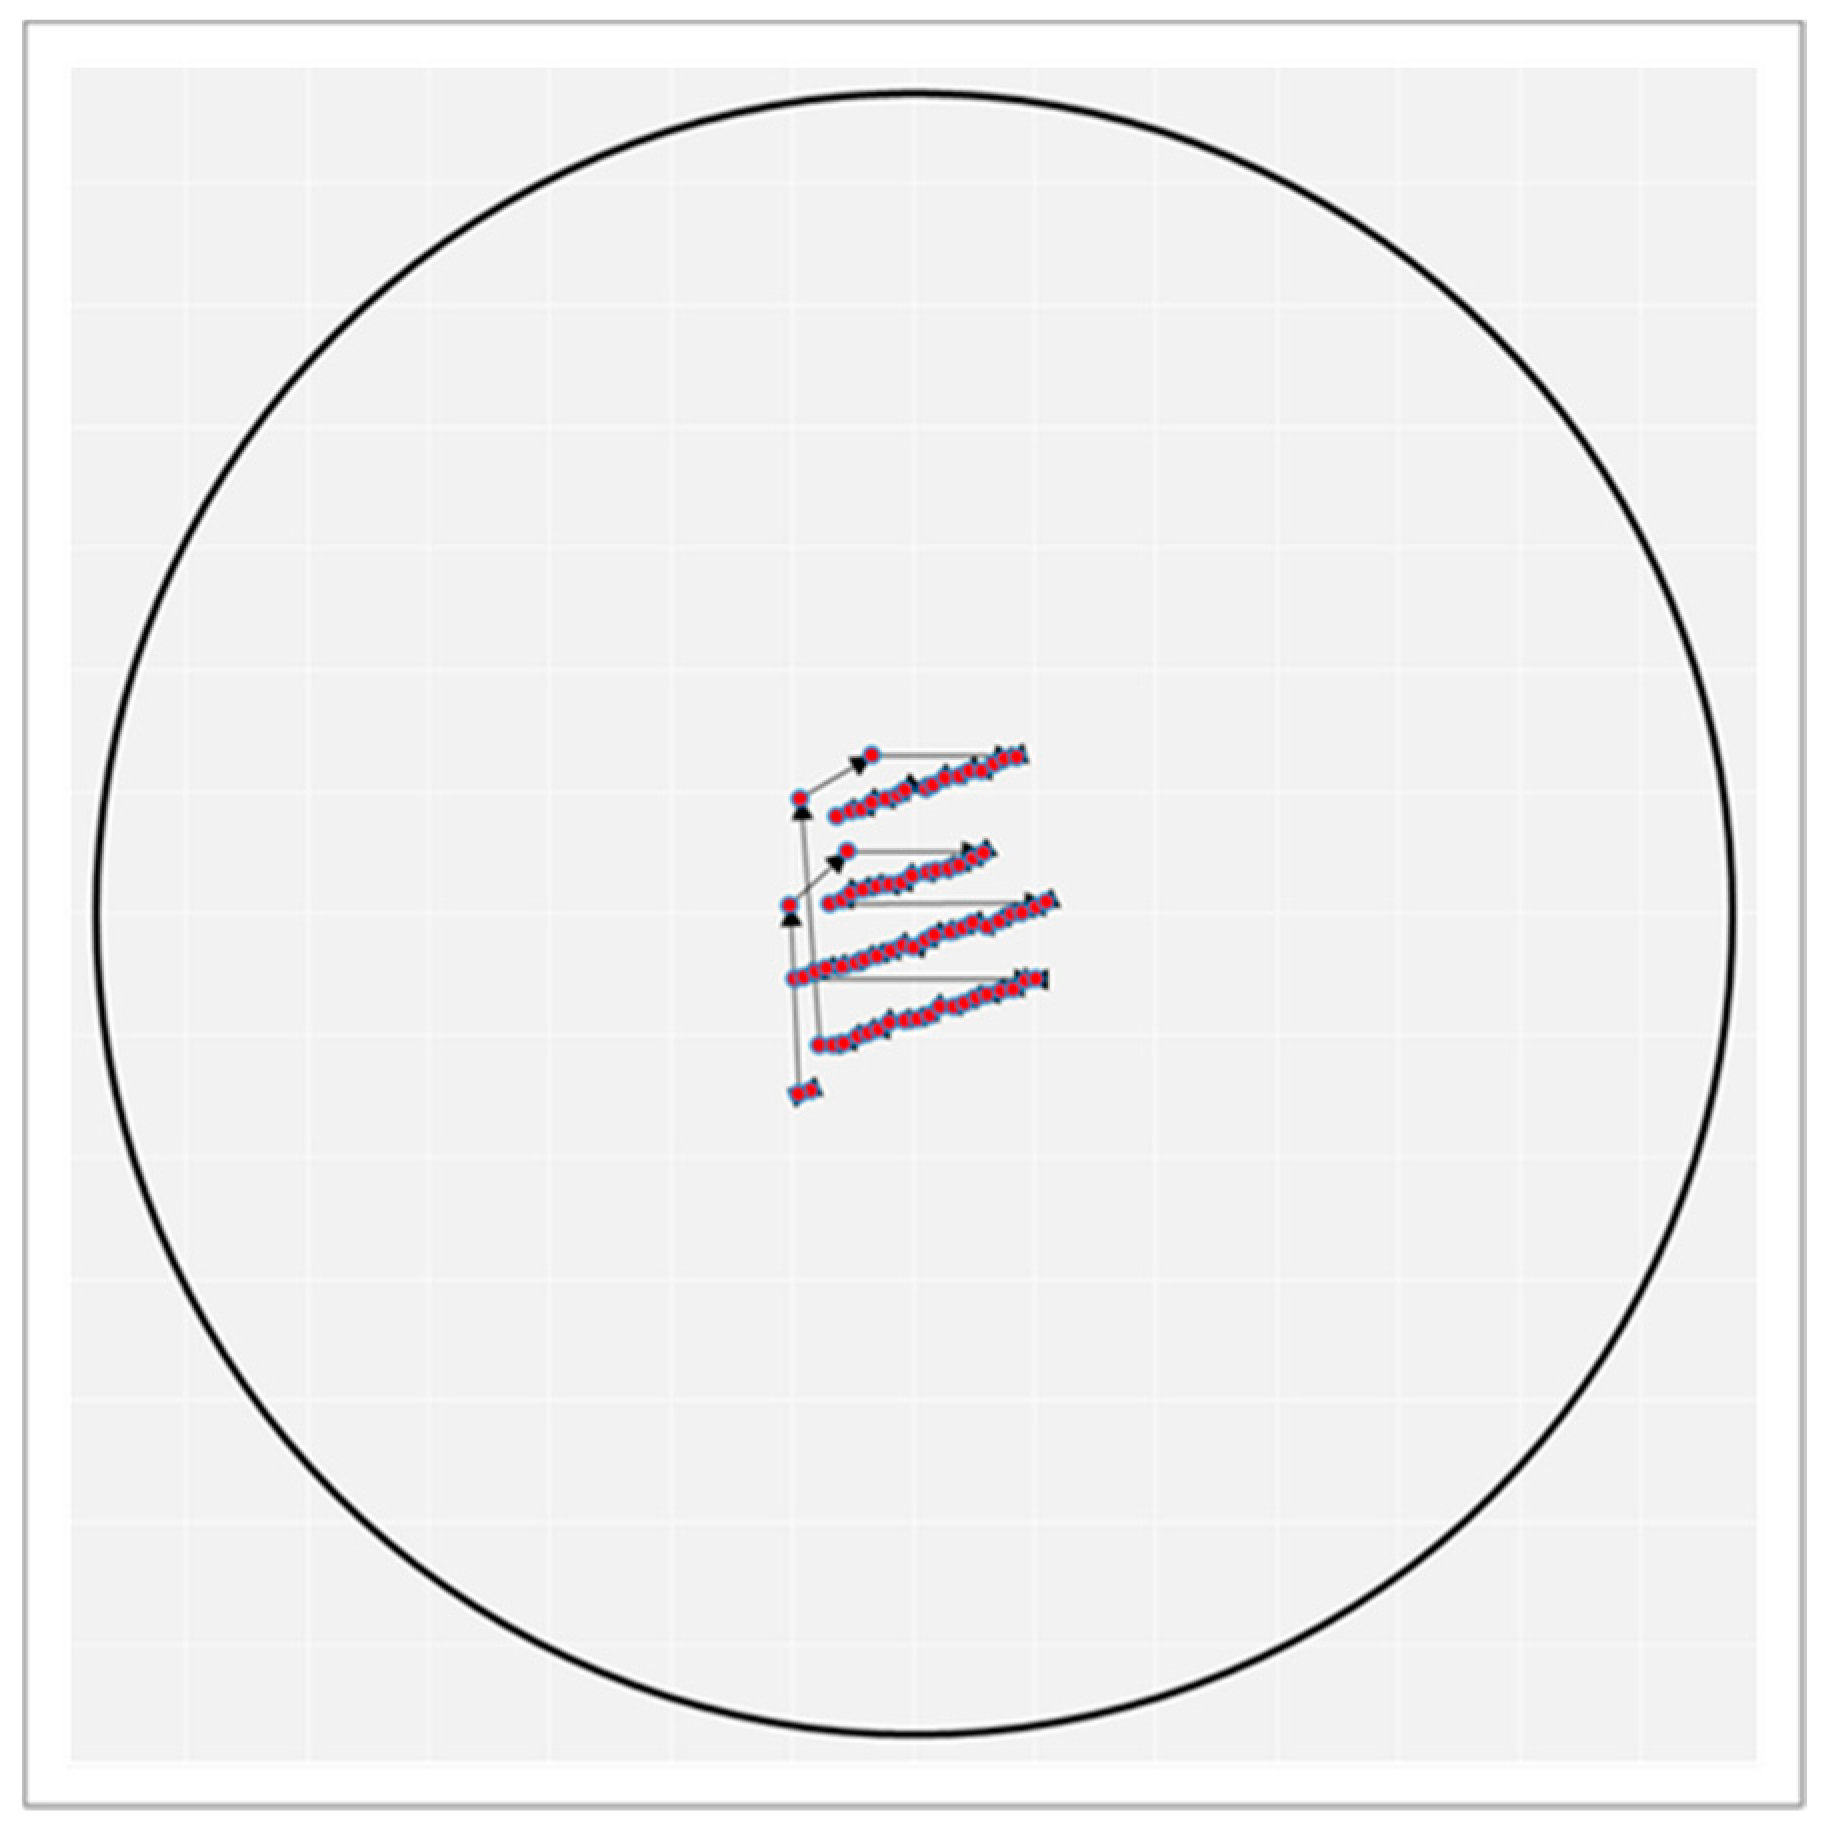
The flux distribution at the redirected focal point (plane of the rod entrance) was measured using a frosted (Lambertian) quartz plate as a transmitting target. A camera (Coherent LaserCam HR) was mounted at the back of the concentrator focused on the plate. After scaling with a calibrated target, the quartz plate was mounted and the tracker (Array Technologies Duratrack DA) was set to automatically follow the sun. As instrumentation to measure power at that location was unavailable, the acquired images (acquired and processed through Coherent’s BeamViewUSB 4.6.3 software) could not be scaled to absolute power and flux values. One measured flux distribution with 96.5% of the total power within the 13.5 mm aperture is shown in Figure S3. The predicted flux distribution is shown also for comparison. Both distributions use the same linear dimension and color scale but, as mentioned previously, the absolute flux scales cannot be compared. From this measurement and comparison to prediction, it was concluded that the size of the flux distribution was accurately predicted and that the concentrator optical errors were quite low. The Array Technologies tracking and drive system uses a simple, closed-loop, shadow-type sun sensor. The sensor shadowing block and the control electronics were modified to improve tracking ability. The same measurement system as above was used to evaluate the tracking performance. The tracking performance over a 2-min period, 1 h before solar noon, near the spring equinox, at latitude 40° N is shown in Figure 6. The centroid of the focused image is displayed at the 2 s interval of image acquisition. Four azimuth updates and two elevation updates can be clearly distinguished. Gridlines are spaced at 1 mm with a 13.5 mm diameter circle shown representing the nominal rod/target size. These updates represent a maximum tracking error of ~±1.5 mrad at this time of day.

3.2. Power Measurements

After initial testing of the original concentrator, a program was undertaken to fabricate seven more concentrators for use in the eight-concentrator system prototype. Once completed, 3M film was applied, and the concentrators were mounted to the tracking structure (see Figure 2) and aligned. Performance was then measured for each of these units with quartz rods installed. Power at the exit of either the quartz rod or a fiber optic bundle was measured with a Coherent PM150-50 (Santa Clara, CA, USA), an air-cooled thermopile sensor with an active area diameter of 50 mm. This device can continuously measure up to 150 W and up to an intermittent level of 300 W (for periods <5 min). A Kipp & Zonen (Delft, The Netherlands) CHP 1 pyrheliometer was mounted to the tracking platform to measure direct normal irradiance during all tests.
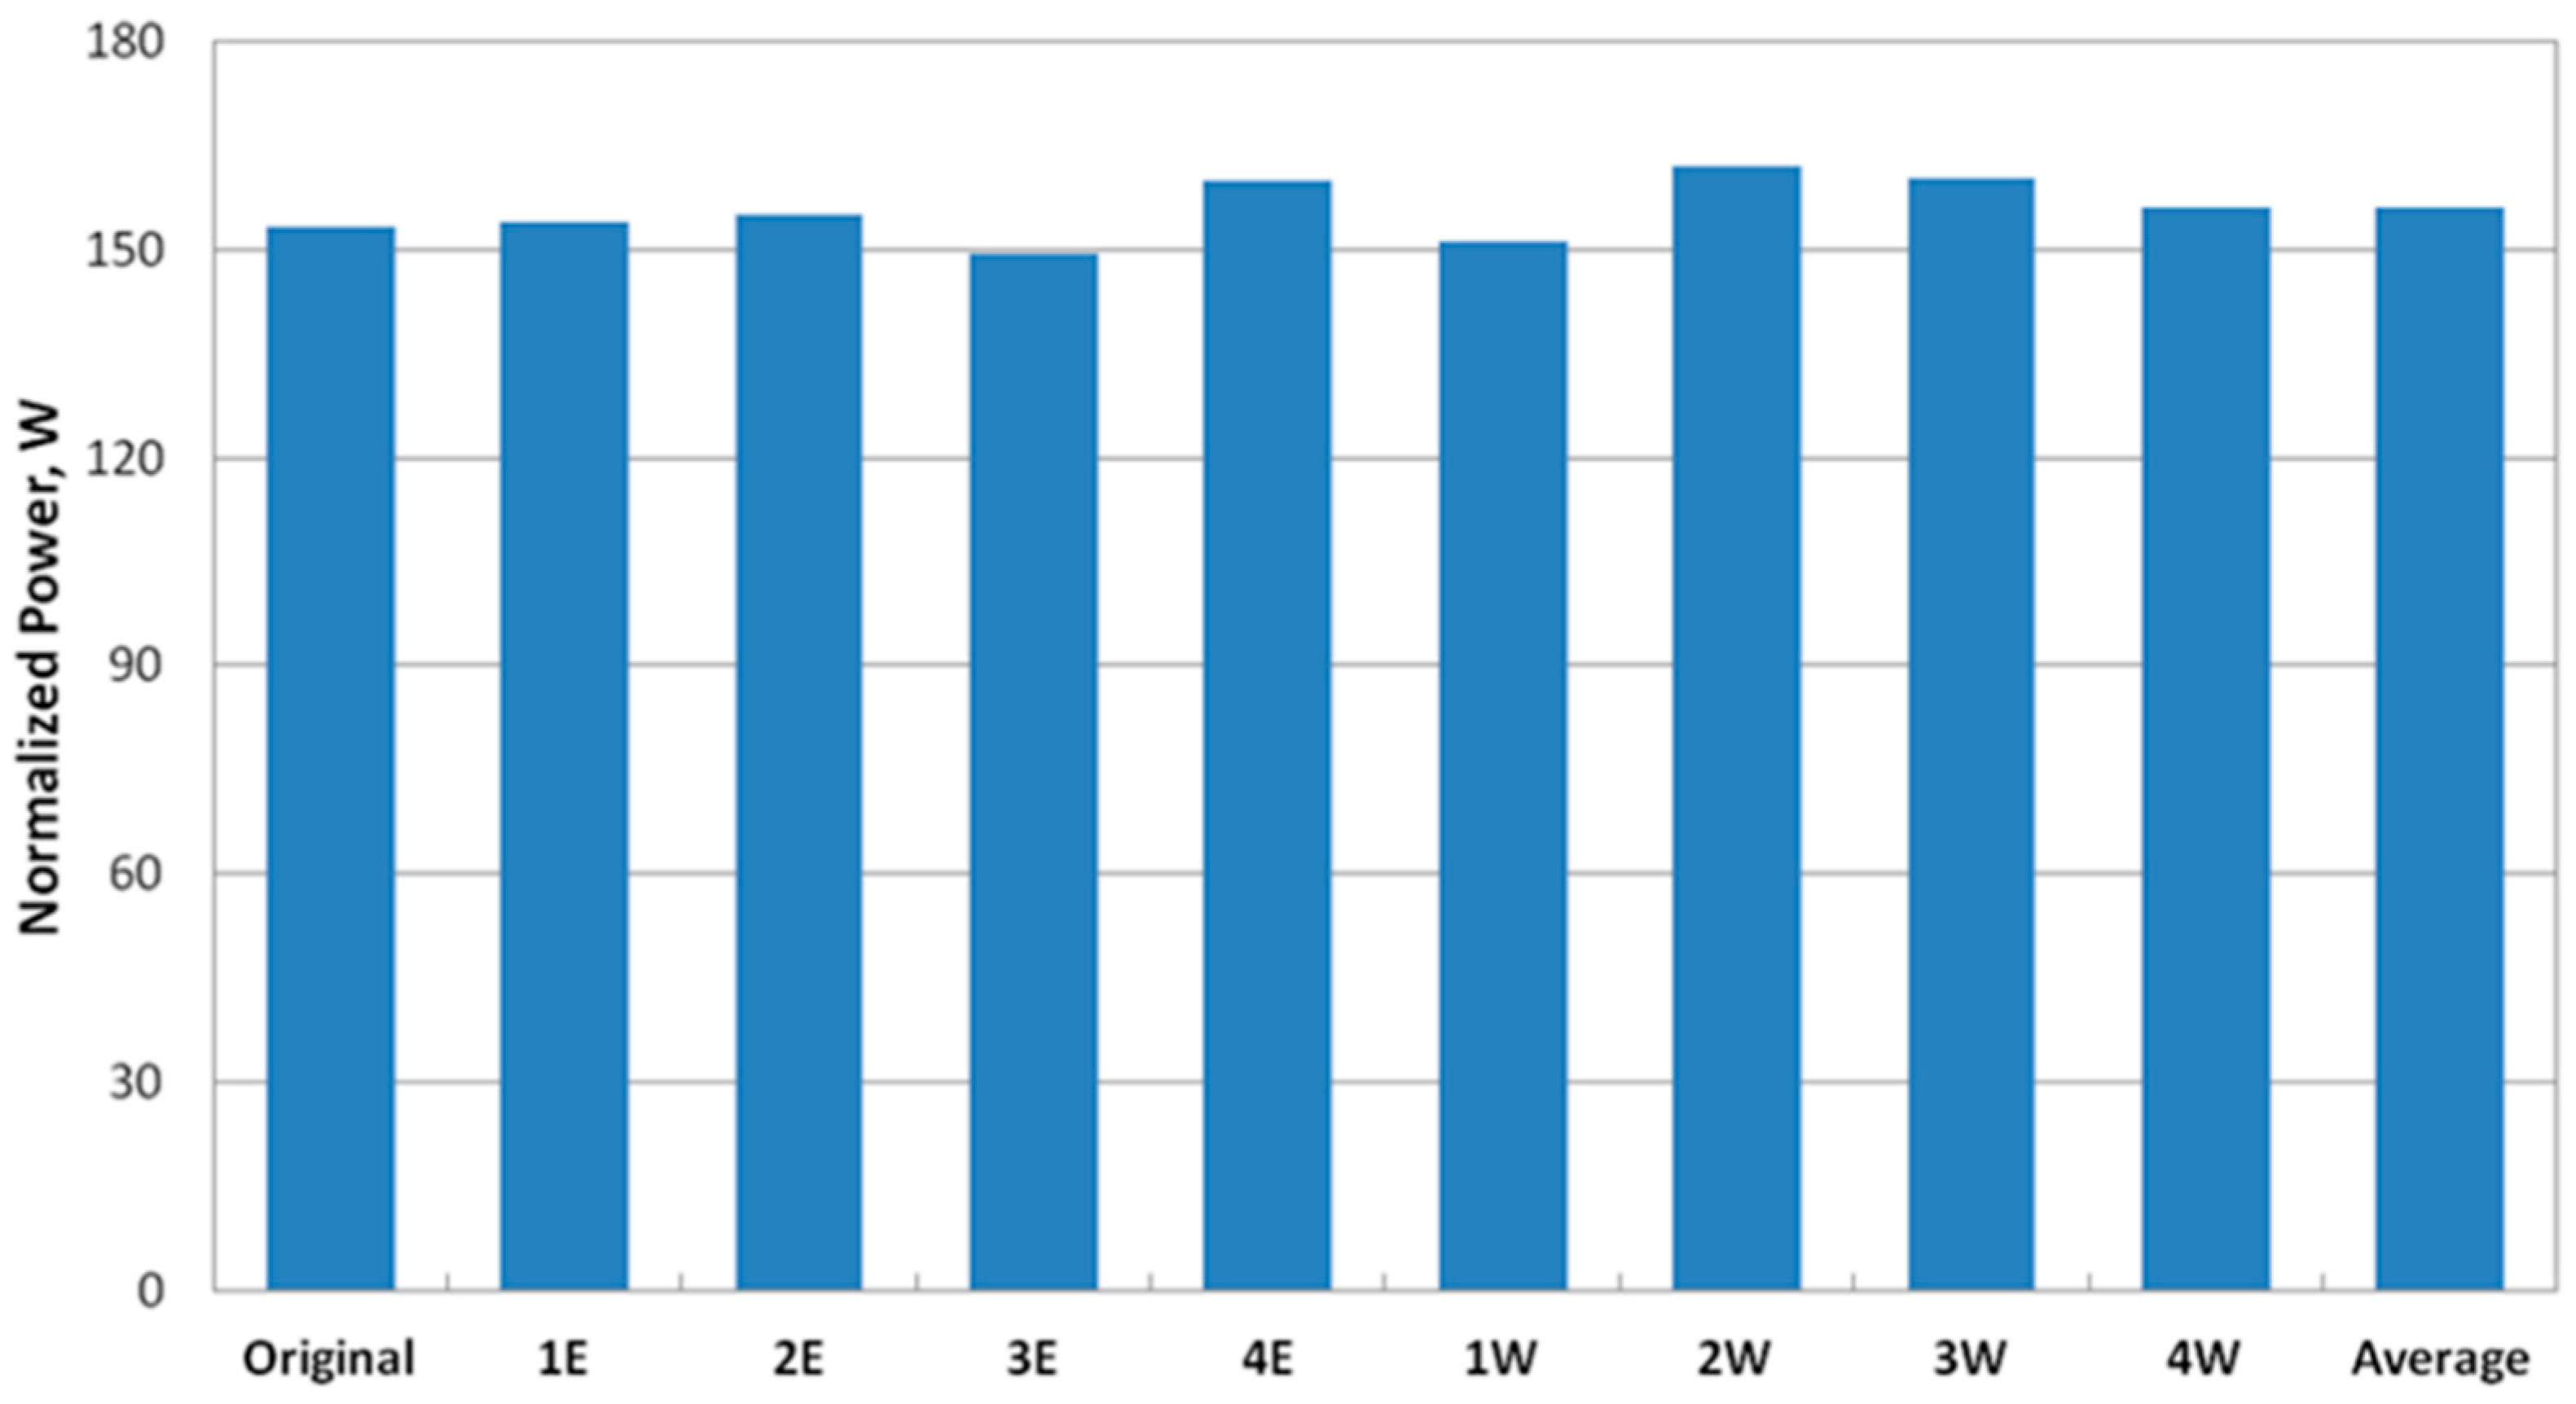
Each of the concentrators was characterized with power measurements at the exit of the quartz homogenizing rod. Rods with 12 mm diameters (slightly less than the bundle diameter to minimize the amount of stray light directly illuminating the area outside the active bundle) were used. The measured power was scaled (normalized) to 1000 W/m2 using the measured DNI. These tests were conducted on clear days with DNI generally in the range of 900–1000 W/m2. Prior to each test, the concentrators were cleaned using distilled water and lightly rubbed with a microfiber cloth. The results of power measurement tests for each of the concentrators (Original, 1-4E, 1-4W) are shown in Figure 7. The average normalized power, 156 ± 5 W, is for the eight concentrators used on the prototype. The average efficiency, 0.55 ± 0.02, is for those same eight concentrators and is defined by the measured power at the rod end (156 W) divided by the power incident on the full concentrator area (i.e., including blockage), i.e., 283 W. When compared to the model, the average power corresponds to a roughly 2 mrad slope error on the concentrator, representing a very good optical surface. The impact of varying slope error on the power available at the fiber bundle entrance is shown in Figure S4.
After testing a number of bundle options, eight borosilicate fiber bundles (4 m length bundles at a fused area diameter of 12.5 mm, fused at both ends) were purchased from Acrolite (Elbridge, NY, USA) for use on the prototype. At the time, they were able to quickly modify their fusing production process to provide 4 m length bundles at a maximum diameter of 12.5 mm. The fused ends were bonded to a stainless-steel ferrule and the length was encased in a protective tube. Figure S5 is a photograph of one end of a selected bundle both before and after testing. Cracks in the surface after initial testing are obvious but appeared to have only a small impact on performance. These bundles were extremely flexible, allowing them to be routed to the stationary reactor without compromising the wide azimuthal tracking requirement. Each of the Acrolite fiber bundles (A1–A8) was connected to the concentrator by securing them in the rod support flange and in contact with the rod. Although each end of a bundle was nominally identical, the A end was generally used at the concentrator and power was measured at the loose, B end. The normalized power and efficiency for each of the bundles are shown in Figure S6. Delivered power at the exit of each 12 mm-diameter bundle, is 80 W on average, or 70 W/cm2 (700 suns). The bundle efficiency is the ratio of normalized power at each bundle divided by the normalized power at the rod, i.e., 80 W/156 W = 0.51 bundle efficiency. This should represent the net transmittance of the bundle.
Although there were some failures (A2 and A6) after initial testing, the remaining bundles performed reasonably well. With all eight fiber bundles connected, this system could then deliver over 600 W to the receiver on a typical sunny day. The first four bundles were positioned at a height of 6.35 cm from the base of the receiver at 90° angles around the vertical centerline. The second four bundles were arbitrarily placed at 6.35 cm above the lower bundles. Bundles were held in place 0.64 cm from the outer surface of the receiver.
Given the available instrumentation and diagnostics, it was not possible to separate the various loss mechanisms in the bundle (Fresnel reflectance, fraction of broken fibers, fiber core/clad area, light leakage, attenuation loss, etc.). For borosilicate fiber, a solar weighted attenuation loss of 0.5 dB/m is a reasonable estimate. At that value, the transmittance over a length of 4 m will be ~0.63 (τ = 10 − (A * L/10), where A = loss in dB/m and L= length in m). This represents the bulk of the loss and is not far from the overall average (all tests excluding failures) of 0.52 ± 0.03. The other result was a degradation of ~10% after initial on-sun testing. The overall efficiency (average delivered bundle power divided by solar intercepted by the concentrator, including blockage) was 28% (0.55 × 0.51). While this was less than the originally estimated 43%, it is clear that many of the initial estimates in Table S1 were somewhat optimistic, particularly the fraction of power intercepted by the homogenizing rod (smaller rod for selected bundle) and fiber bundle transmittance (for borosilicate fibers).

3.3. Experimental Data from an On-Sun Experiment and a Simple Model

Experiments were conducted over the course of several months. With minimal interruptions in data collection and clear skies for a near ideal sunlight condition, the direct normal irradiance (DNI) was measured, on average, as 896 W/m2 for several hours, as can be seen in Figure S7. The average power measured from each fiber optic bundle was found to be 78.1 W, after being normalized to a standard DNI of 1000 W/m2.
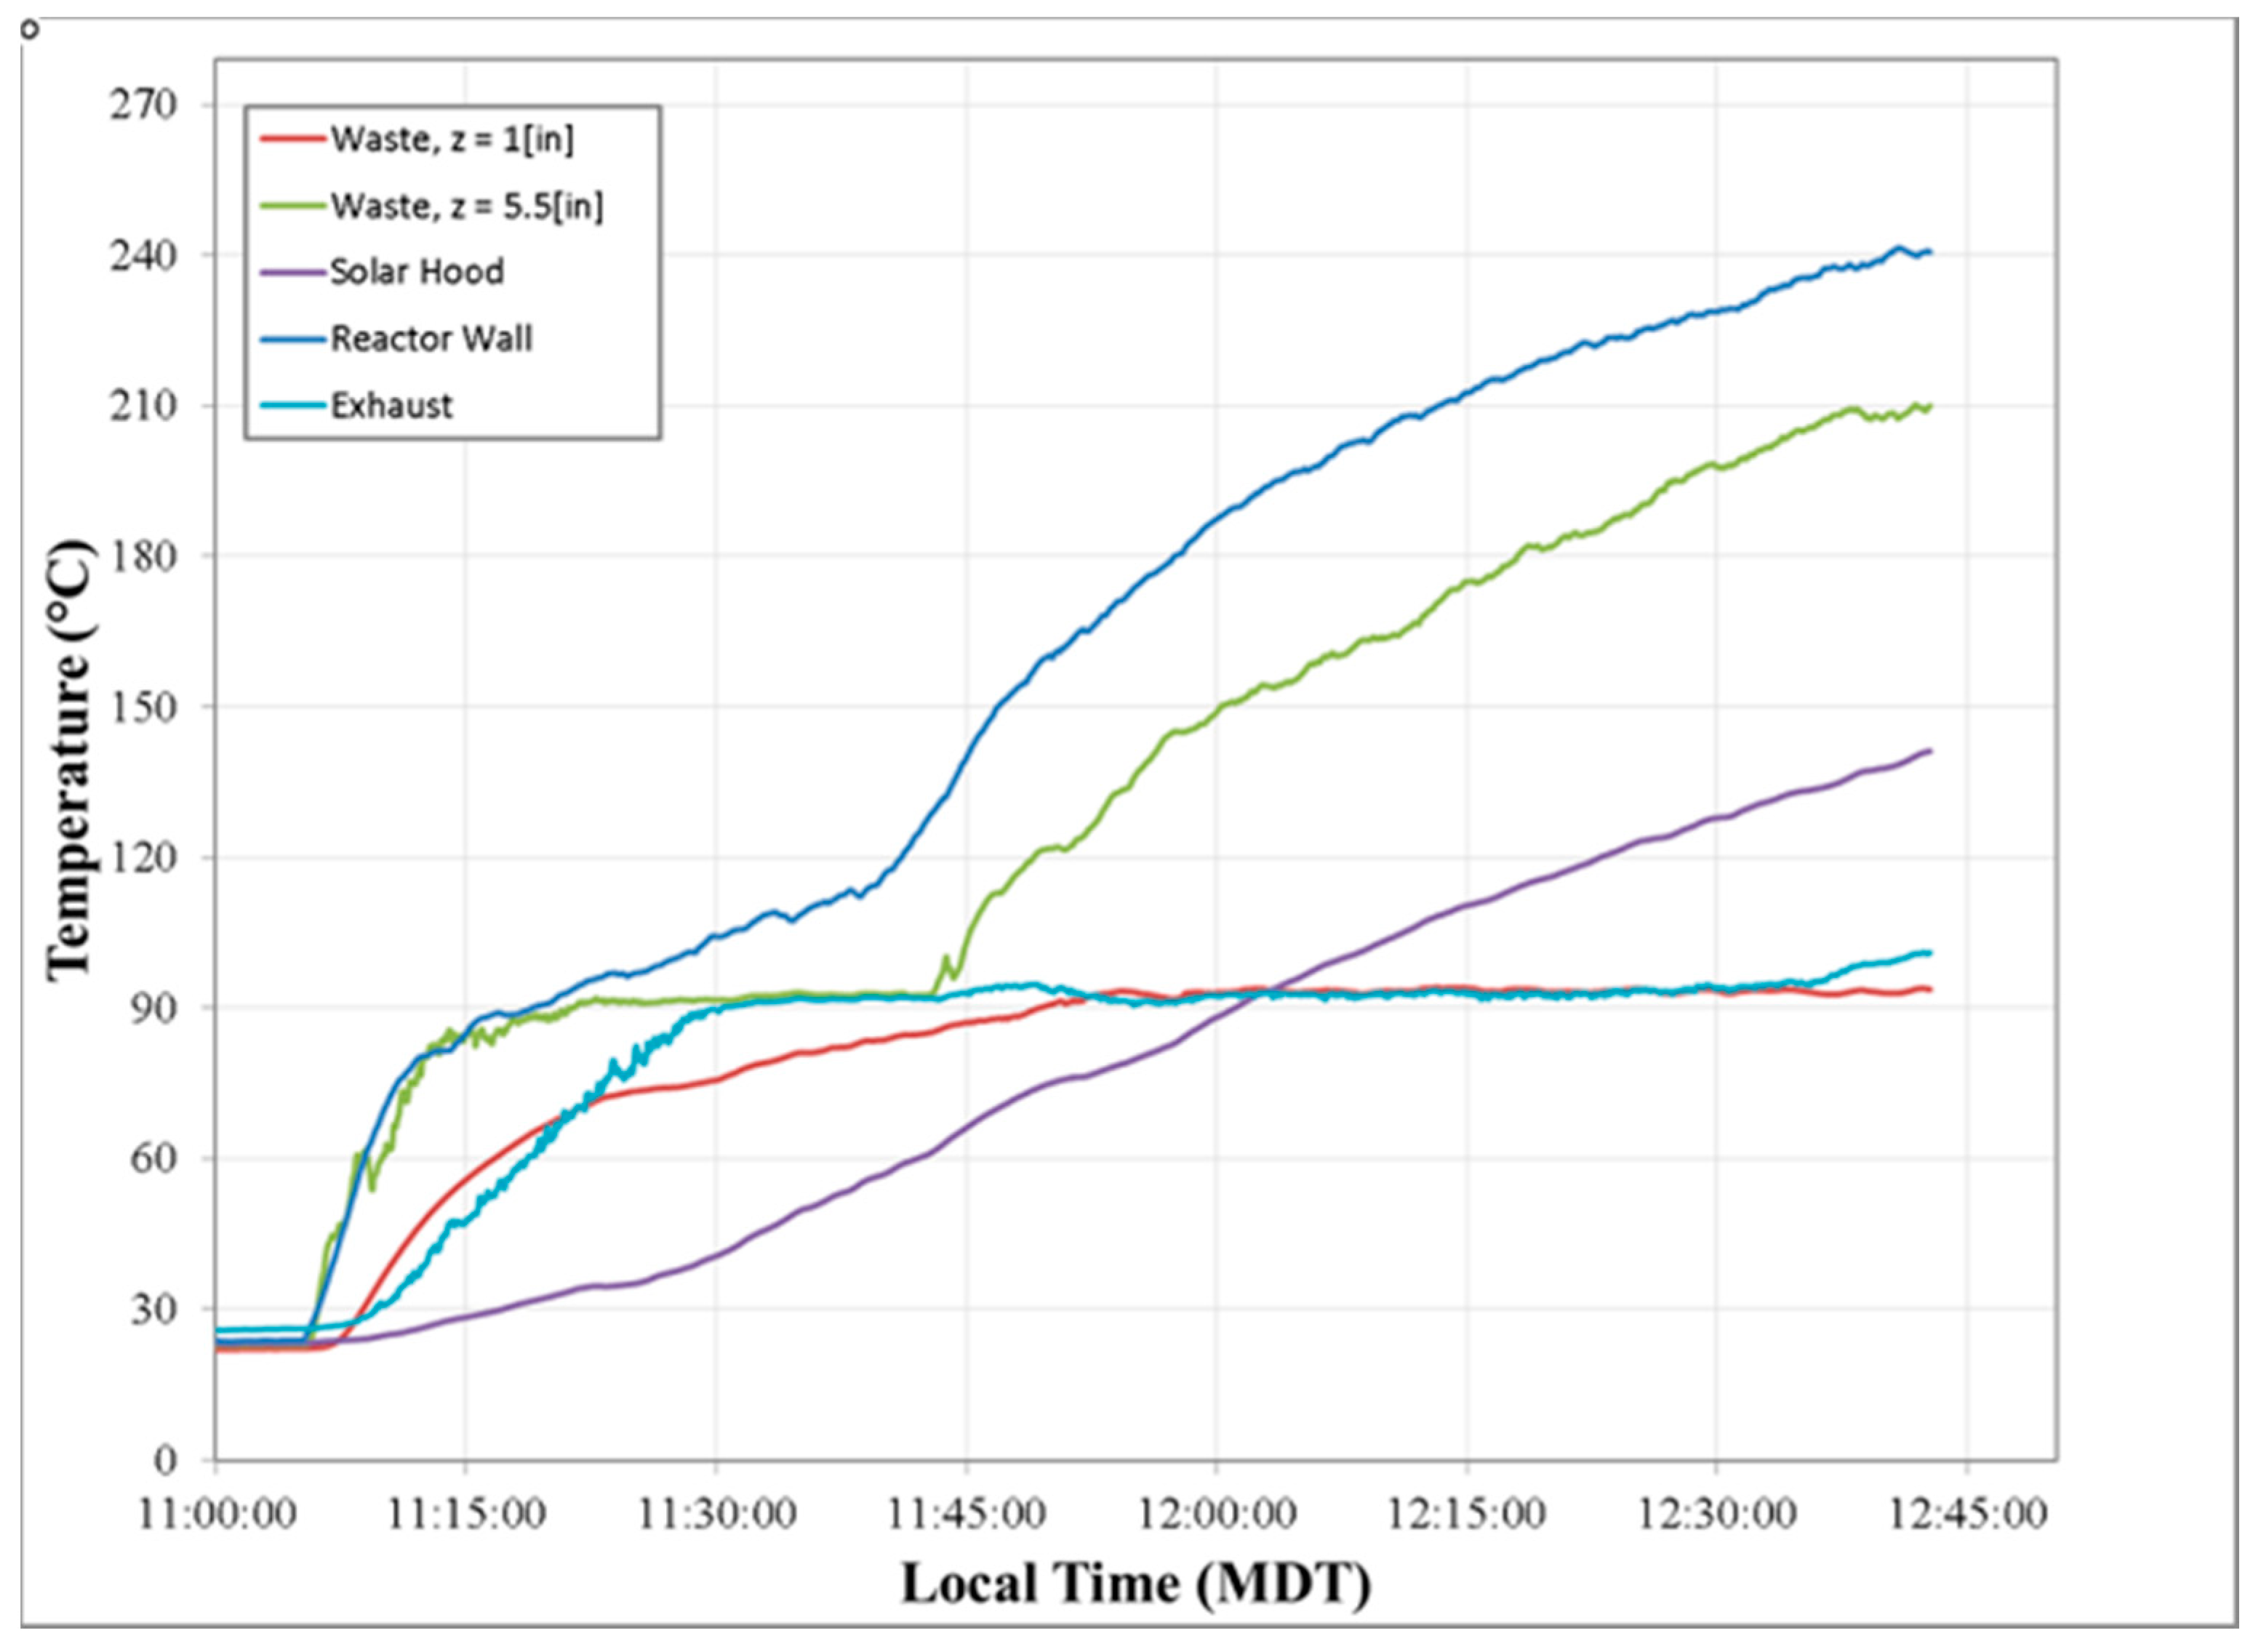
Feces from four healthy adults, weighing 814 g in total, were collected in the receiver occupying a volume of approximately 600 cm3. Temperatures were measured at several key positions on the outside of the receiver, inside the waste, and at the exhaust of the receiver, as shown in Figure 8. Temperature of the waste over time of irradiation varied with height. At 2.54 cm from the receiver floor, the waste reached over 90 °C within 40 min and stabilized there. At 14 cm from the reactor floor, the temperature of the waste rose to over 90 °C in 10 min and reached over 210 °C within 90 min. This level of temperature is effective for disinfection of the waste. Thermal disinfection of fecal-contaminated water is achieved with inversely related time and temperature conditions, e.g., temperatures as low as 55 °C for 10 h or 75 °C for roughly 10 min.
A simplified simulation tool is presented in the Supplementary Materials (SM) that incorporates key phenomena of the Sol-Char sanitation receiver such as heat transfer, light flux distributions, variable solar irradiance, and feces pyrolysis reaction kinetics. The effective thermal conductivity of the feces, k F , was approximated by an expression with a “wet” and a “dry” coefficient that impacts the value depending on temperature and conversion, respectively:
k F (   T ) = β F ( k F 0 [ k F 0 k C ] U ( α ) )
where β F is a coefficient used to adjust the thermal conductivity of feces. The expression for β F is dependent upon temperature T .
β F = β w e t ( β w e t β d r y ) U ( T v a p )
When the waste reaches the temperature   T v a p , the coefficient β F undergoes a step change from β w e t to   β d r y as the feces are first dried out and then further heated to pyrolysis temperatures. The coefficient β F accounts for the presence of water in untreated human feces, as well as for the unmeasurable effects in the experimental system, e.g., partial oxidation of the feces that promotes heat transfer.
The feces contained in the Sol-Char reactor were modeled simply as a solid cylinder cut into a one-quarter symmetrical section, shown in Figure S8, built and simulated using COMSOLTM Multiphysics finite element software. Since the thickness of the stainless-steel reactor wall is more than an order of magnitude smaller than the thickness of the feces domain, and the thermal conductivity of steel is more than an order of magnitude greater than that of feces, the steel wall was not modeled explicitly due to its negative impact on the mesh quality. Instead, the steel wall was treated with a Very Thin Conductive Layer (VTCL) boundary condition rather than a meshed domain. Temperature fields in the feces domain were modeled by a transient conduction model with isotropic temperature-dependent physical properties approximated by analytic functions for thermal conductivity ( k ), heat capacity ( C p ), and density ( ρ ), with nominal values listed in the SM. Reaction kinetics for pyrolysis used the rate expression derived previously [44].
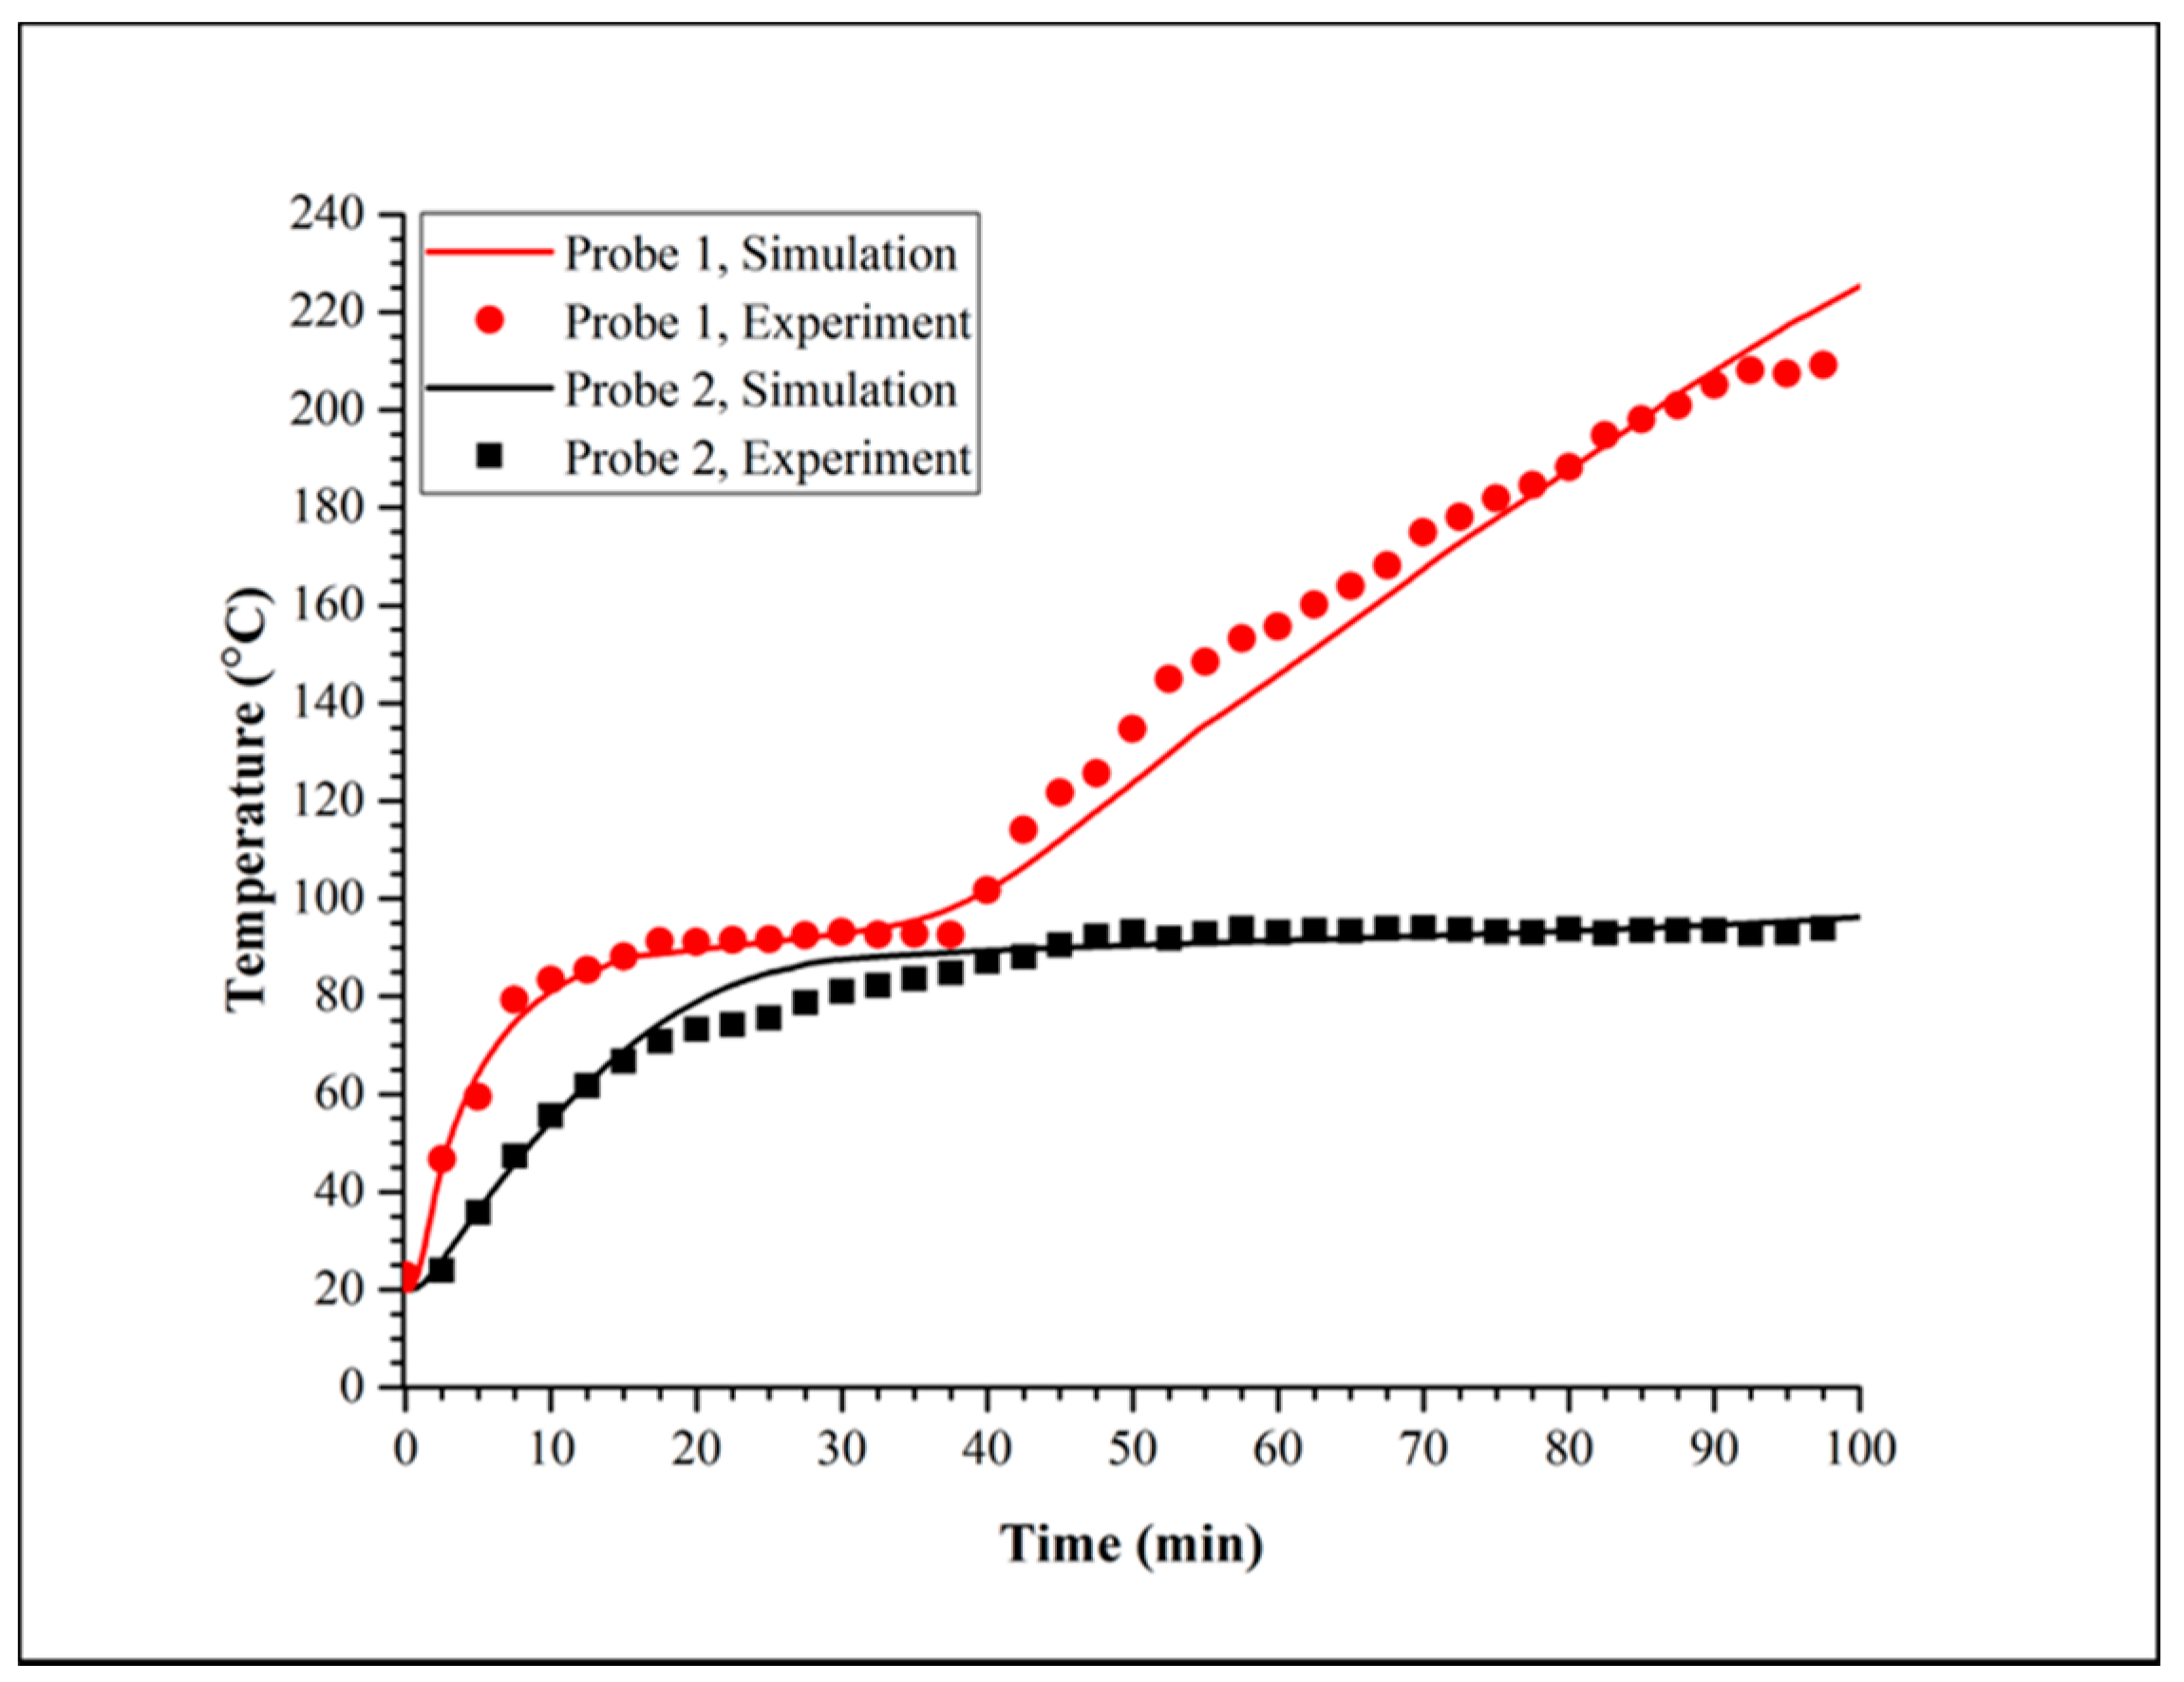
Details of the model development and simulation with coupled heat transfer and kinetics are contained in the SM. After developing the model, the β w e t and β d r y coefficients of the effective thermal conductivity, as defined by Equations (3) and (4), were optimized to fit the experimental data obtained during solar thermal drying, using least squares minimization. The coefficients β w e t and β d r y were the optimization parameters adjusted to evaluate the sum squared error (SSE) between experimental temperatures and the simulated temperatures, predicted by the model, until the SSE was minimized. The final values of the coefficients of the effective thermal conductivity, β w e t and   β d r y , are listed in Table 1. The response of the effective thermal conductivity, k F ( T ) , to both temperature and extent of conversion is shown in a contour plot in Figure 9. A comparison of the experimental and simulated temperature data in the Sol-Char sanitation prototype in Figure 10 shows the close fit of the model predictions to observation. Probe 1 was located approximately 25 mm from the receiver’s centerline and 150 mm from the bottom of the receiver. Probe 2 was located approximately 25 mm from the receiver’s centerline and 40 mm from the bottom of the receiver.
Based on experiments conducted on-sun, this novel solar thermal disinfection process can disinfect between 4 and 6 people’s waste in 30 min without the use of grid electricity, chemical input, or added water. One can envision a process where the feces collected during a 24-h period from dawn to dawn is disinfected using sunlight from dawn to dusk. Two receivers are switched out in the morning. It is anticipated that since disinfection can occur in 30 min that the process allows for compensation of cloudy days. Furthermore, although not demonstrated here, it is anticipated that improved receiver insulation and system design will allow for pyrolysis to char and that the char may be a suitable fertilizer or burned for heating, thus reducing the use of vegetation and wood for this purpose.
Pyrolysis is an endothermic process of devolatilization of organic material, usually coal or biomass, in the absence of air/oxygen into carbon-enriched products [45]. It is anticipated that the fecal waste can be converted to char with longer times on sun, and with improved insulation around the receiver. Human fecal chars have been shown to have a higher heating value (HHV) comparable to that of cooking and heating fuels commonly used throughout the world, such as wood charcoal or bituminous coal [46].

4. Conclusions and Path Forward

This work demonstrates the feasibility of using concentrated sunlight to drive the disinfection of human waste without electricity, chemicals, or water. A simple model provides preliminary understanding of the process with a key consideration being the effective thermal conductivity of the feces. The process is not optimized and the model is very preliminary, thus allowing for substantial improvement with future research. It is shown here that silica fibers have the most attractive performance in terms of attenuation loss (as low as 0.2 dB/km or almost 3 orders of magnitude better than a borosilicate fiber). This performance advantage represents essentially no transmittance loss over a 4 m length compared to a transmission of 0.63 at 500 dB/km for borosilicate fiber. Future work should focus on eliminating the use of fused bundles coupled with a homogenizing rod and instead, use silica fibers coupled with an optical concept that allows sufficient solar concentration to mate those optics with individual fibers. Such a design would increase the turning mirror to fiber optical efficiency for transmitting concentrated sunlight since it would eliminate the packing loss for circular fibers in the fused bundle. An improved model should include accounting for feces non-uniformity in the receiver and the impact that this has on the effective thermal conductivity, a key model parameter. Additional considerations include the insulation surrounding the receiver, the positioning of the optical fiber bundles, and time at temperature to produce char. The system is easily scaled-up by providing more power using additional and/or larger parabolic concentrators and associated fiber optics. The use of fiber optics to bring concentrated sunlight safely indoors provides a platform technology that is particularly useful in regions of the world where electricity, water, and chemicals are not readily available or are in short supply.

Supplementary Materials

The following are available online at https://www.mdpi.com/article/10.3390/su13094935/s1, Figure S1: The Sol-Char Sanitation Prototype. Noted in the photograph are the (1) parabolic concentrators, (2) fiber optic bundles, (3) the squat plate toilet, and the (4) solar thermal reactor, Figure S2: Concentrator–fiber relationship. The data point represents the design point chosen for the system, Figure S3: Measured flux map at the redirected focal point (left). The predicted flux map (right) is shown at the same linear scale and same relative color scale. The measured flux map has not been scaled to intensity, Figure S4: Impact of concentrator slope error on power available at the 12.5 mm diameter aperture of the fiber optic bundles. The red circle shows the approximate value of slope error matching the average delivered power of the eight concentrators, Figure S5: Acrolite bundle A4 (A end) showing 12.5 mm fused bundle and housing in the ferrule before on-sun testing (left). The area between the bundle and ferrule is black glass. There are an unavoidable number of broken fibers which can be seen as small black spots within the bundle. For comparison A4 (B end) is shown after on-sun receiver testing, Figure S6: Bundle performance showing normalized power (left) and efficiency or net transmittance (right), Figure S7: Experimental data from 3 July 2014, showing the Direct Normal Irradiance (W/m2) over the experimental period, Figure S8: The geometry, in inches, of the simulated feces in COMSOL (R) Multiphysics. The dimensions are listed in Table S3, Figure S9: Variation of the kinetic parameters derived from the DAEM, (a) frequency factor, 𝐴_𝛼, and (b) activation energy, 𝐸_𝛼, with extent of conversion, α, Figure S10: Function used in COMSOL to describe the heat capacity of waste over a temperature range that includes vaporization and pyrolysis. The area under the curve is equal to that of the sum of latent heat of vaporization and endothermic heat of pyrolysis, Figure S11: Normalized flux distribution from images obtained for the Sol-Char Sanitation prototype. The optical fiber was situated in front of an opaque quartz plate and a camera behind the plate was used to capture the image. The normalized power exiting the fiber was measured to be 78.1 W. The direct normal irradiance was also measured during the image capture with a Kipp & Zonen CHP-1 normal incidence pyrheliometer, Figure S12: Integrated heat flux on waste boundary from two optical fibers on the Sol-Char Sanitation prototype. This value matches the power measured in experiment by a Coherent PM-150 UCB power meter, Table S1: Initial values selected for solar concentrator sizing, Table S2: Optical and geometric inputs for concentrator analysis, Table S3: Geometrical dimensions of the Sol-Char Sanitation prototype, Table S4: Thermophysical properties used in the simulation, Development of the Simple COMSOL Model.

Author Contributions

Conceptualization, A.W.W. and K.G.L.; methodology, A.L. and R.P.F.; software, R.P.F. and D.H.H.; validation, R.P.F., T.W.Y., B.J.W., R.B.M., L.M.H., C.J.O., R.S.S., D.M., and D.H.H.; formal analysis, R.P.F. and A.L.; investigation, R.P.F., T.W.Y., B.J.W., R.B.M., L.M.H., C.J.O., R.S.S., D.M., and D.H.H.; resources, K.G.L.; data curation, R.P.F. and A.L.; writing—original draft preparation, R.P.F. and A.L.; writing—review and editing, A.W.W. and K.G.L.; visualization, R.P.F. and A.L.; supervision, K.G.L. and A.W.W.; project administration, K.G.L. and L.M.H.; funding acquisition, K.G.L. and A.W.W. All authors have read and agreed to the published version of the manuscript.

Funding

This research was funded by The Bill & Melinda Gates Foundation Reinvent the Toilet Challenge. “Reinvent the Toilet Challenge: Solar Biochar Toilet” Bill & Melinda Gates Foundation; Grant #OPP1065047.

Data Availability Statement

The data presented in this study are available on request from the corresponding authors.

Acknowledgments

The authors would like to acknowledge Jonas Waterman, Anna Segur, Anthony Anderson, and Maria Toscano for their support to the research presented herein.

Conflicts of Interest

The authors declare no conflict of interest. The funders had no role in the design of the study; in the collection, analyses, or interpretation of data; in the writing of the manuscript, or in the decision to publish the results.

References

  1. World Health Organization. Sanitation. 2020. Available online: https://washdata.org/sites/default/files/documents/reports/2019-07/jmp-2019-wash-households.pdf (accessed on 5 March 2021).
  2. World Health Organization. Progress on Household Drinking Water, Sanitation and Hygiene, 2000–2017. In Special Focues on Inequalities; United Nations Children Fund (UNICEF) and World Health Organization (WHO): New York, NY, USA, 2019; Available online: https://www.who.int/news-room/fact-sheets/detail/sanitation (accessed on 5 March 2021).
  3. Gupta, D.; Fischer, H.; Shrestha, S.; Ali, S.S.; Chhatre, A.; Devkota, K.; Fleischman, F.; Khatri, D.B.; Rana, P. Dark and bright spots in the shadow of the pandemic: Rural livelihoods, social vulnerability, and local governance in India and Nepal. World Dev. 2021, 141, 105370. [Google Scholar] [CrossRef]
  4. Liu, L.; Hu, J.; Hou, Y.; Tao, Z.; Chen, Z.; Chen, K. Pit latrines may be a potential risk in rural China and low-income countries when dealing with COVID-19. Sci. Total Environ. 2021, 761, 143283. [Google Scholar] [CrossRef] [PubMed]
  5. Mahmud, M.; Riley, E. Household response to an extreme shock: Evidence on the immediate impact of the Covid-19 lockdown on economic outcomes and well-being in rural Uganda. World Dev. 2021, 140, 105318. [Google Scholar] [CrossRef]
  6. Leich, H. Viewpoint. A challenge to the environment pro. Environ. Sci. Technol. 1971, 5, 11. [Google Scholar] [CrossRef]
  7. Fry, L.M.; Mihelcic, J.R.; Watkins, D.W. Water and Nonwater-related Challenges of Achieving Global Sanitation Coverage. Environ. Sci. Technol. 2008, 42, 4298–4304. [Google Scholar] [CrossRef]
  8. Langergraber, G.; Muellegger, E. Ecological Sanitation—A way to solve global sanitation problems? Environ. Int. 2005, 31, 433–444. [Google Scholar] [CrossRef]
  9. Blackett, I.C.H.P.; Heymans, C. The Missing Link in Sanitation Service Delivery: A Review of Fecal Sludge Management in 12 Cities (English); The World Bank: Washington, DC, USA, 2014; Available online: http://documents.worldbank.org/curated/en/395181468323975012/The-missing-link-in-sanitation-service-delivery-a-review-of-fecal-sludge-management-in-12-cities (accessed on 5 March 2021).
  10. Gambrill, M.; Gilsdorf, R.J.; Kotwal, N. Citywide Inclusive Sanitation—Business as Unusual: Shifting the Paradigm by Shifting Minds. Front. Environ. Sci. 2020, 7. [Google Scholar] [CrossRef] [Green Version]
  11. Cooney, C.M. Why is global sanitation so elusive? Environ. Sci. Technol. 2008, 42, 4240. [Google Scholar] [CrossRef] [Green Version]
  12. Starkl, M.; Brunner, N.; Feil, M.; Hauser, A. Ensuring Sustainability of Non-Networked Sanitation Technologies: An Approach to Standardization. Environ. Sci. Technol. 2015, 49, 6411–6418. [Google Scholar] [CrossRef] [PubMed] [Green Version]
  13. Wald, C. The Economy in the Toilet. Nature 2017, 549, 146–148. [Google Scholar] [CrossRef] [Green Version]
  14. Brands, E. Prospects and challenges for sustainable sanitation in developed nations: A critical review. Environ. Rev. 2014, 22, 346–363. [Google Scholar] [CrossRef]
  15. Katukiza, A.; Ronteltap, M.; Niwagaba, C.; Foppen, J.; Kansiime, F.; Lens, P. Sustainable sanitation technology options for urban slums. Biotechnol. Adv. 2012, 30, 964–978. [Google Scholar] [CrossRef]
  16. Inyang, M.; Dickenson, E. The potential role of biochar in the removal of organic and microbial contaminants from potable and reuse water: A review. Chemosphere 2015, 134, 232–240. [Google Scholar] [CrossRef]
  17. Kearns, J.P.; Shimabuku, K.K.; Knappe, D.R.; Summers, R.S. High Temperature Co-pyrolysis Thermal Air Activation Enhances Biochar Adsorption of Herbicides from Surface Water. Environ. Eng. Sci. 2019, 36, 710–723. [Google Scholar] [CrossRef]
  18. Paz-Ferreiro, J.; Nieto, A.; Méndez, A.; Askeland, M.P.J.; Gascó, G. Biochar from Biosolids Pyrolysis: A Review. Int. J. Environ. Res. Public Health 2018, 15, 956. [Google Scholar] [CrossRef] [Green Version]
  19. Shimabuku, K.K.; Kearns, J.P.; Martinez, J.E.; Mahoney, R.B.; Moreno-Vasquez, L.; Summers, R.S. Biochar sorbents for sulfamethoxazole removal from surface water, stormwater, and wastewater effluent. Water Res. 2016, 96, 236–245. [Google Scholar] [CrossRef] [PubMed] [Green Version]
  20. Kesier, G. Optical Fiber Communications. In Encyclopedia of Telecommunications; John Wiley & Sons: Hoboken, NJ, USA, 2003. [Google Scholar]
  21. Kandilli, C.; Ulgen, K. Review and modelling the systems of transmission concentrated solar energy via optical fibres. Renew. Sustain. Energy Rev. 2009, 13, 67–84. [Google Scholar] [CrossRef]
  22. Kato, D.; Nakamura, T. Application of Optical Fibers to Transmission of Solar-Radiation. J. Appl. Phys. 1976, 47, 4528–4531. [Google Scholar] [CrossRef]
  23. Amara, S.; Nordell, B.; Benyoucef, B.; Benmoussat, A. Concentration Heating System with Optical Fiber Supply. In Impact of Integrated Clean Energy on the Future of the Mediterranean Environment, Proceedings of a Meeting Held 14–16 April 2011, Beirut, Lebanon; Salame, C., El Charif, H., El Hajj Hassan, F., El Tahchi, M., Eds.; Elsevier Procedia: Amsterdam, The Netherlands, 2011; pp. 805–814. [Google Scholar]
  24. Feuermann, D.; Gordon, J.M. Solar fiber-optic mini-dishes: A new approach to the efficient collection of sunlight. Sol. Energy 1999, 65, 159–170. [Google Scholar] [CrossRef]
  25. He, K.; Zheng, H.; Li, Z.; Tao, T.; Dai, J. Design and investigation of a novel concentrator used in solar fiber lamp. Sol. Energy 2009, 83, 2086–2091. [Google Scholar] [CrossRef]
  26. Kribus, A.; Zik, O.; Karni, J. Optical fibers and solar power generation. Sol. Energy 2000, 68, 405–416. [Google Scholar] [CrossRef]
  27. Peill, N.J.; Hoffmann, M.R. Solar-Powered Photocatalytic Fiber-Optic Cable Reactor for Waste Stream Remediation. J. Sol. Energy Eng. 1997, 119, 229–236. [Google Scholar] [CrossRef]
  28. Zik, O.; Karni, J.; Kribus, A. The TROF (tower reflector with optical fibers): A new degree of freedom for solar energy systems. Sol. Energy 1999, 67, 13–22. [Google Scholar] [CrossRef] [Green Version]
  29. Rahou, M.; Mojiri, A.; Rosengarten, G.; Andrews, J. Optical design of a Fresnel concentrating solar system for direct transmission of radiation through an optical fibre bundle. Sol. Energy 2016, 124, 15–25. [Google Scholar] [CrossRef]
  30. Jaramillo, O.A.; Del Río, J.A. Optical fibres for a mini-dish/Stirling system: Thermodynamic optimization. J. Phys. D Appl. Phys. 2002, 35, 1241–1250. [Google Scholar] [CrossRef]
  31. Maxey, L.C.; Parks, I.J.E.; Beshears, D.L.; Earl, D.D.; Lapsa, M.V.; Muhs, J.D. Spectral Transmission of a Solar Collector and Fiber Optic Distribution Hybrid Lighting System. In Proceedings of the ASME 2007 Energy Sustainability Conference, Long Beach, CA, USA, 27–30 June 2007; pp. 549–557. [Google Scholar]
  32. Schlegel, G.; Burkholder, F.; Klein, S.; Beckman, W.; Wood, B.; Muhs, J. Analysis of a full spectrum hybrid lighting system. Sol. Energy 2004, 76, 359–368. [Google Scholar] [CrossRef]
  33. Antón, I.; Silva, D.; Sala, G.; Bett, A.; Siefer, G.; Luque-Heredia, I.; Trebst, T. The PV-FIBRE concentrator: A system for indoor operation of 1000X MJ solar cells. Prog. Photovolt. Res. Appl. 2007, 15, 431–447. [Google Scholar] [CrossRef]
  34. Joo, H.; Jeong, H.; Jeon, M.; Moon, I. The use of plastic optical fibers in photocatalysis of trichloroethylene. Sol. Energy Mater. Sol. Cells 2003, 79, 93–101. [Google Scholar] [CrossRef]
  35. Marinangeli, R.E.; Ollis, D.F. Photo-assisted heterogeneous catalysis with optical fibers. Part III: Photoelectrodes. AIChE J. 1982, 28, 945–955. [Google Scholar] [CrossRef]
  36. Nakamura, T.; Smith, B.K. Solar Thermal System for Lunar ISRU Applications: Development and Field Operation at Mauna Kea, HI. In Nonimaging Optics: Efficient Design for Illumination and Solar Concentration Viii, Proceedings of a Meeting Held 21–22 August 2011, San Diego, CA, USA; Gordon, R., Ed.; At SPIE Optical Engineering + Applications Winston; SPIE-International Society for Optics and Photonics: Bellingham WA, USA, 2011. [Google Scholar]
  37. Nakamura, T.; Senior, C.L. Solar Thermal Power for Lunar Materials Processing. J. Aerosp. Eng. 2008, 21, 91–101. [Google Scholar] [CrossRef]
  38. Feuermann, D.; Gordon, J.M.; Huleihil, M. Light leakage in optical fibers: Experimental results, modeling and the consequences for solar concentrators. Sol. Energy 2002, 72, 195–204. [Google Scholar] [CrossRef]
  39. Wendelin, T.; Dobos, A.; Lewandowski, A. SolTrace: A Ray-Tracing Code for Complex Solar Optical Systems; NREL/TP-5500-59163; Office of Science and Technical Information: Oak Ridge, TN, USA, 2013. [Google Scholar]
  40. Liang, D.; Nunes, Y.; Monteiro, L.F.; Monteiro, M.L.F.; Collares-Pereira, M. 200-W solar energy delivery with optical fiber bundles. SPIE-Int. Soc. Opt. Eng. 1997, 3139, 217–224. [Google Scholar]
  41. Arnaoutakis, G.E.; Marques-Hueso, J.; Mallick, T.K.; Richards, B.S. Coupling of sunlight into optical fibres and spectral dependence for solar energy applications. Sol. Energy 2013, 93, 235–243. [Google Scholar] [CrossRef]
  42. Debongnie, J.; Phillips, S. Capacity of the human colon to absorb fluid. Gastroenterology 1978, 74, 698–703. [Google Scholar] [CrossRef]
  43. Ho, C.K.; Mahoney, A.R.; Ambrosini, A.; Bencomo, M.; Hall, A.C.; Lambert, T.N. Characterization of Pyromark 2500 Paint for High-Temperature Solar Receivers. J. Sol. Energy Eng. 2013, 136, 014502. [Google Scholar] [CrossRef]
  44. Yacob, T.W.; Fisher, R. (Chip); Linden, K.G.; Weimer, A.W. Pyrolysis of human feces: Gas yield analysis and kinetic modeling. Waste Manag. 2018, 79, 214–222. [Google Scholar] [CrossRef] [PubMed]
  45. Babu, B.V. Biomass pyrolysis: A state-of-the-art review. Biofuels Bioprod. Biorefining 2008, 2, 393–414. [Google Scholar] [CrossRef]
  46. Ward, B.J.; Yacob, T.W.; Montoya, L.D. Evaluation of solid fuel char briquettes from human waste. Environ. Sci. Technol. 2014, 48, 9852–9858. [Google Scholar] [CrossRef]
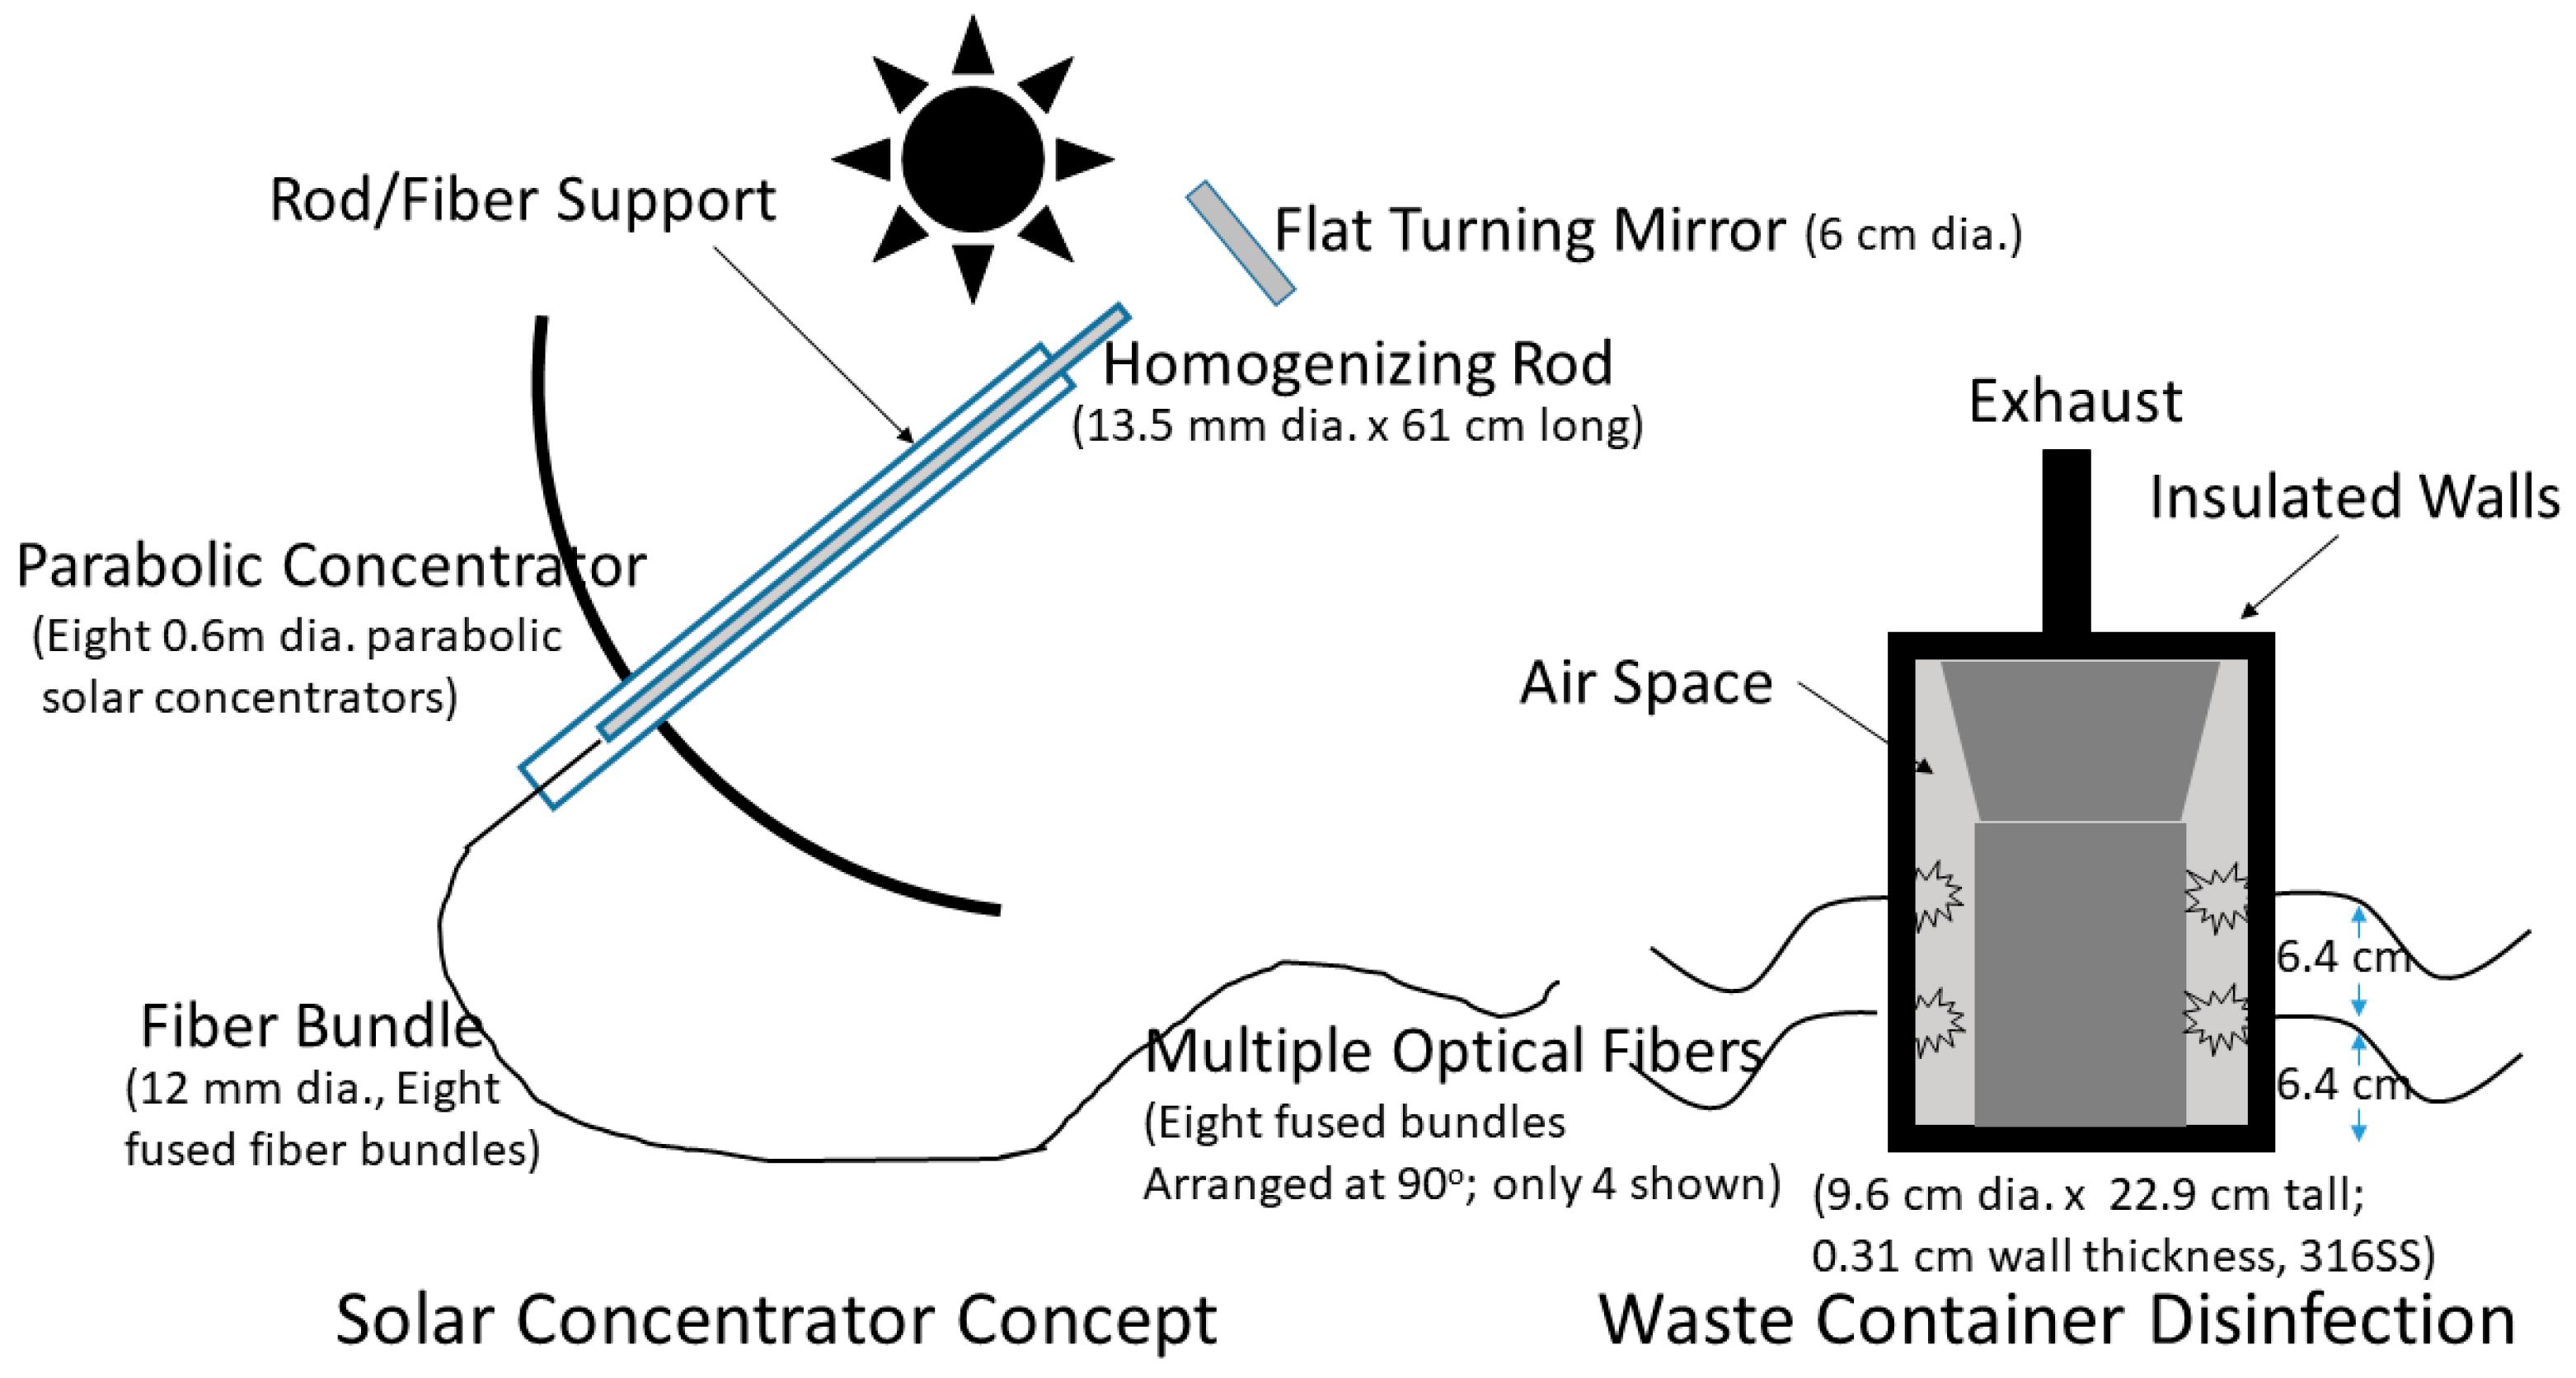
Figure 1. Schematic of solar thermal disinfection system (not drawn to scale).
Sustainability 13 04935 g001
Figure 2. (a) Concentrator system on sun; (b) Detailed view of the parabolic solar concentrators actively on-sun.
Sustainability 13 04935 g002
Figure 3. Image of the fused end of the fiber optic bundle.
Sustainability 13 04935 g003
Figure 4. Modeled flux distribution at (a) the entrance of the homogenizing rod and (b) after the exit of the rod.
Sustainability 13 04935 g004
Figure 5. SolTrace model visualization of the homogenizing rod.
Sustainability 13 04935 g005
Figure 6. Tracking performance for solar concentration.
Sustainability 13 04935 g006
Figure 7. Power measurements for each concentrator with 12 mm diameter homogenizing rods.
Sustainability 13 04935 g007
Figure 8. Experimental data from the Sol-Char sanitation prototype on July 3, 2014, in Boulder, CO.
Sustainability 13 04935 g008
Figure 9. Contour map of the effective thermal conductivity of feces, as it responds to values of temperature and extent of conversion.
Sustainability 13 04935 g009
Figure 10. Temperature trace at two points from experiment on July 3, 2014, and the predictions of the optimized simulation.
Sustainability 13 04935 g010
Table 1. Value of the coefficients in the proposed expression for the thermal conductivity of human feces.
CoefficientValueDescription
β w e t 8.40Wet coefficient in the effective thermal conductivity of human feces
β d r y 5.88Dry coefficient in the effective thermal conductivity of human feces
Publisher’s Note: MDPI stays neutral with regard to jurisdictional claims in published maps and institutional affiliations.