1. Introduction
More than 58% of the world population lived in urban areas in 2018, and the number is expected to increase to 75% in 2050 [
1]. Unfortunately, urbanization in developing countries is not always linked to economic development [
2] and may lead to an increase in the number of people without access to basic infrastructure and the proliferation of informal settlements or slums. Informal settlements usually lack access to basic services and are not included during the planning of the cities, leading to these areas having poor living standards and being a source of social ills, such as crime and drug abuse [
3]. With future urbanization expected to take place in towns and cities of developing countries, the number of people living in slums is expected to double, i.e., more than 3 billion by 2050 [
4]. While most developing countries are already struggling with the effects of rapid urbanization, future urbanization may result in increased development of informal settlements, poverty and inequality. Information on the extent, population or condition of the informal settlement of informal settlements is not always available, which results in these areas not included in the government plans and policies [
5]. This calls for a need to develop new methodologies to generate data and information to support the management of informal settlements.
The common source of information on informal settlements in many countries is census data. Census is usually done every five to ten years period, leading to data gap challenges [
6,
7]. In addition, information collected during the census contains mainly headcount information and lacks the spatial dimension on the informal settlement [
8]. Information on the population and condition of informal settlements is also collected through surveys to support specific projects. These projects may vary from informal upgrade programs to the provision of services by non-governmental institutions. This leads to spatial and temporal gaps in informal settlement data as the procedures used to survey informal settlements are not always published [
9]. In addition, data collection using surveys is a time-consuming and resource-intensive exercise that governments are unable to maintain due to prohibitive costs associated with these data collection methods [
10].
Remote sensing provides an opportunity to map and characterize human settlements based on their morphology, allowing for the cost-effective data collection on informal settlements [
11]. The use of remote sensing data can independently map a countrywide to a city-wide location and condition of informal settlements. Remote sensing technologies that have been investigated in the literature for informal settlements mapping include aerial photography [
12,
13], unmanned aerial vehicles [
14] and satellite imagery [
8,
15,
16,
17,
18,
19].
Methodologies used in mapping informal settlements from remote sensing data include visual image interpretation, traditional pixel-based classification, Object-based image analysis (OBIA) and machine learning techniques. The visual image interpretation method is usually applied to very high spatial resolution satellite imagery. Even though this methodology is time-consuming and resource-intensive, it is still commonly used as it produces higher accurate results when performed by experienced technicians than automated methodology [
20].
The detection of settlement types using spectral characteristics alone is not possible. This is due to varying physical characteristics of informal settlements [
15,
21], roof materials of the dwelling structures within informal settlements [
22,
23] and development stages [
16,
24]. Many studies in the literature used object and settlement characteristics to detect informal settlements from satellite imagery with varying accuracy based on the informal settlement indicator and geographic area. To solve the problem associated with the detection of informal settlements using only spectral characteristics, generic slum ontology (GSO) was developed to assist with the detection and mapping of informal settlements from remotely sensed data across the globe. The GSO is based on the built morphology of informal settlements at three spatial levels, i.e., environment, settlement and object [
8]. Building density remains the most explored settlement indicator that produces high accuracy compared to other indicators [
8,
16,
18,
25,
26,
27]. The use of gray-level co-occurrence matrix (GLCM) textural statistics has been investigated with varying accuracies depending on the morphology of the informal settlements and surrounding settlements [
25]. In some cases, GLCM textural analysis fails to detect informal settlements from the built-up area [
26,
27].
Even though several studies have focused on detecting informal settlements in different geographic areas, an automated methodology for informal settlement mapping from remotely sensed data still does not exist. In addition, varying accuracies are achieved using the same indicators for informal settlement detection in different geographical areas. This study investigates the performance of twelve image-based indicators on the detection of informal from formal settlements in Mamelodi, in South Africa, using WorldView 2 satellite imagery. In addition to commonly used informal settlement indicators, the study investigates two informal settlement indicators that can be derived from high-resolution satellite imagery.
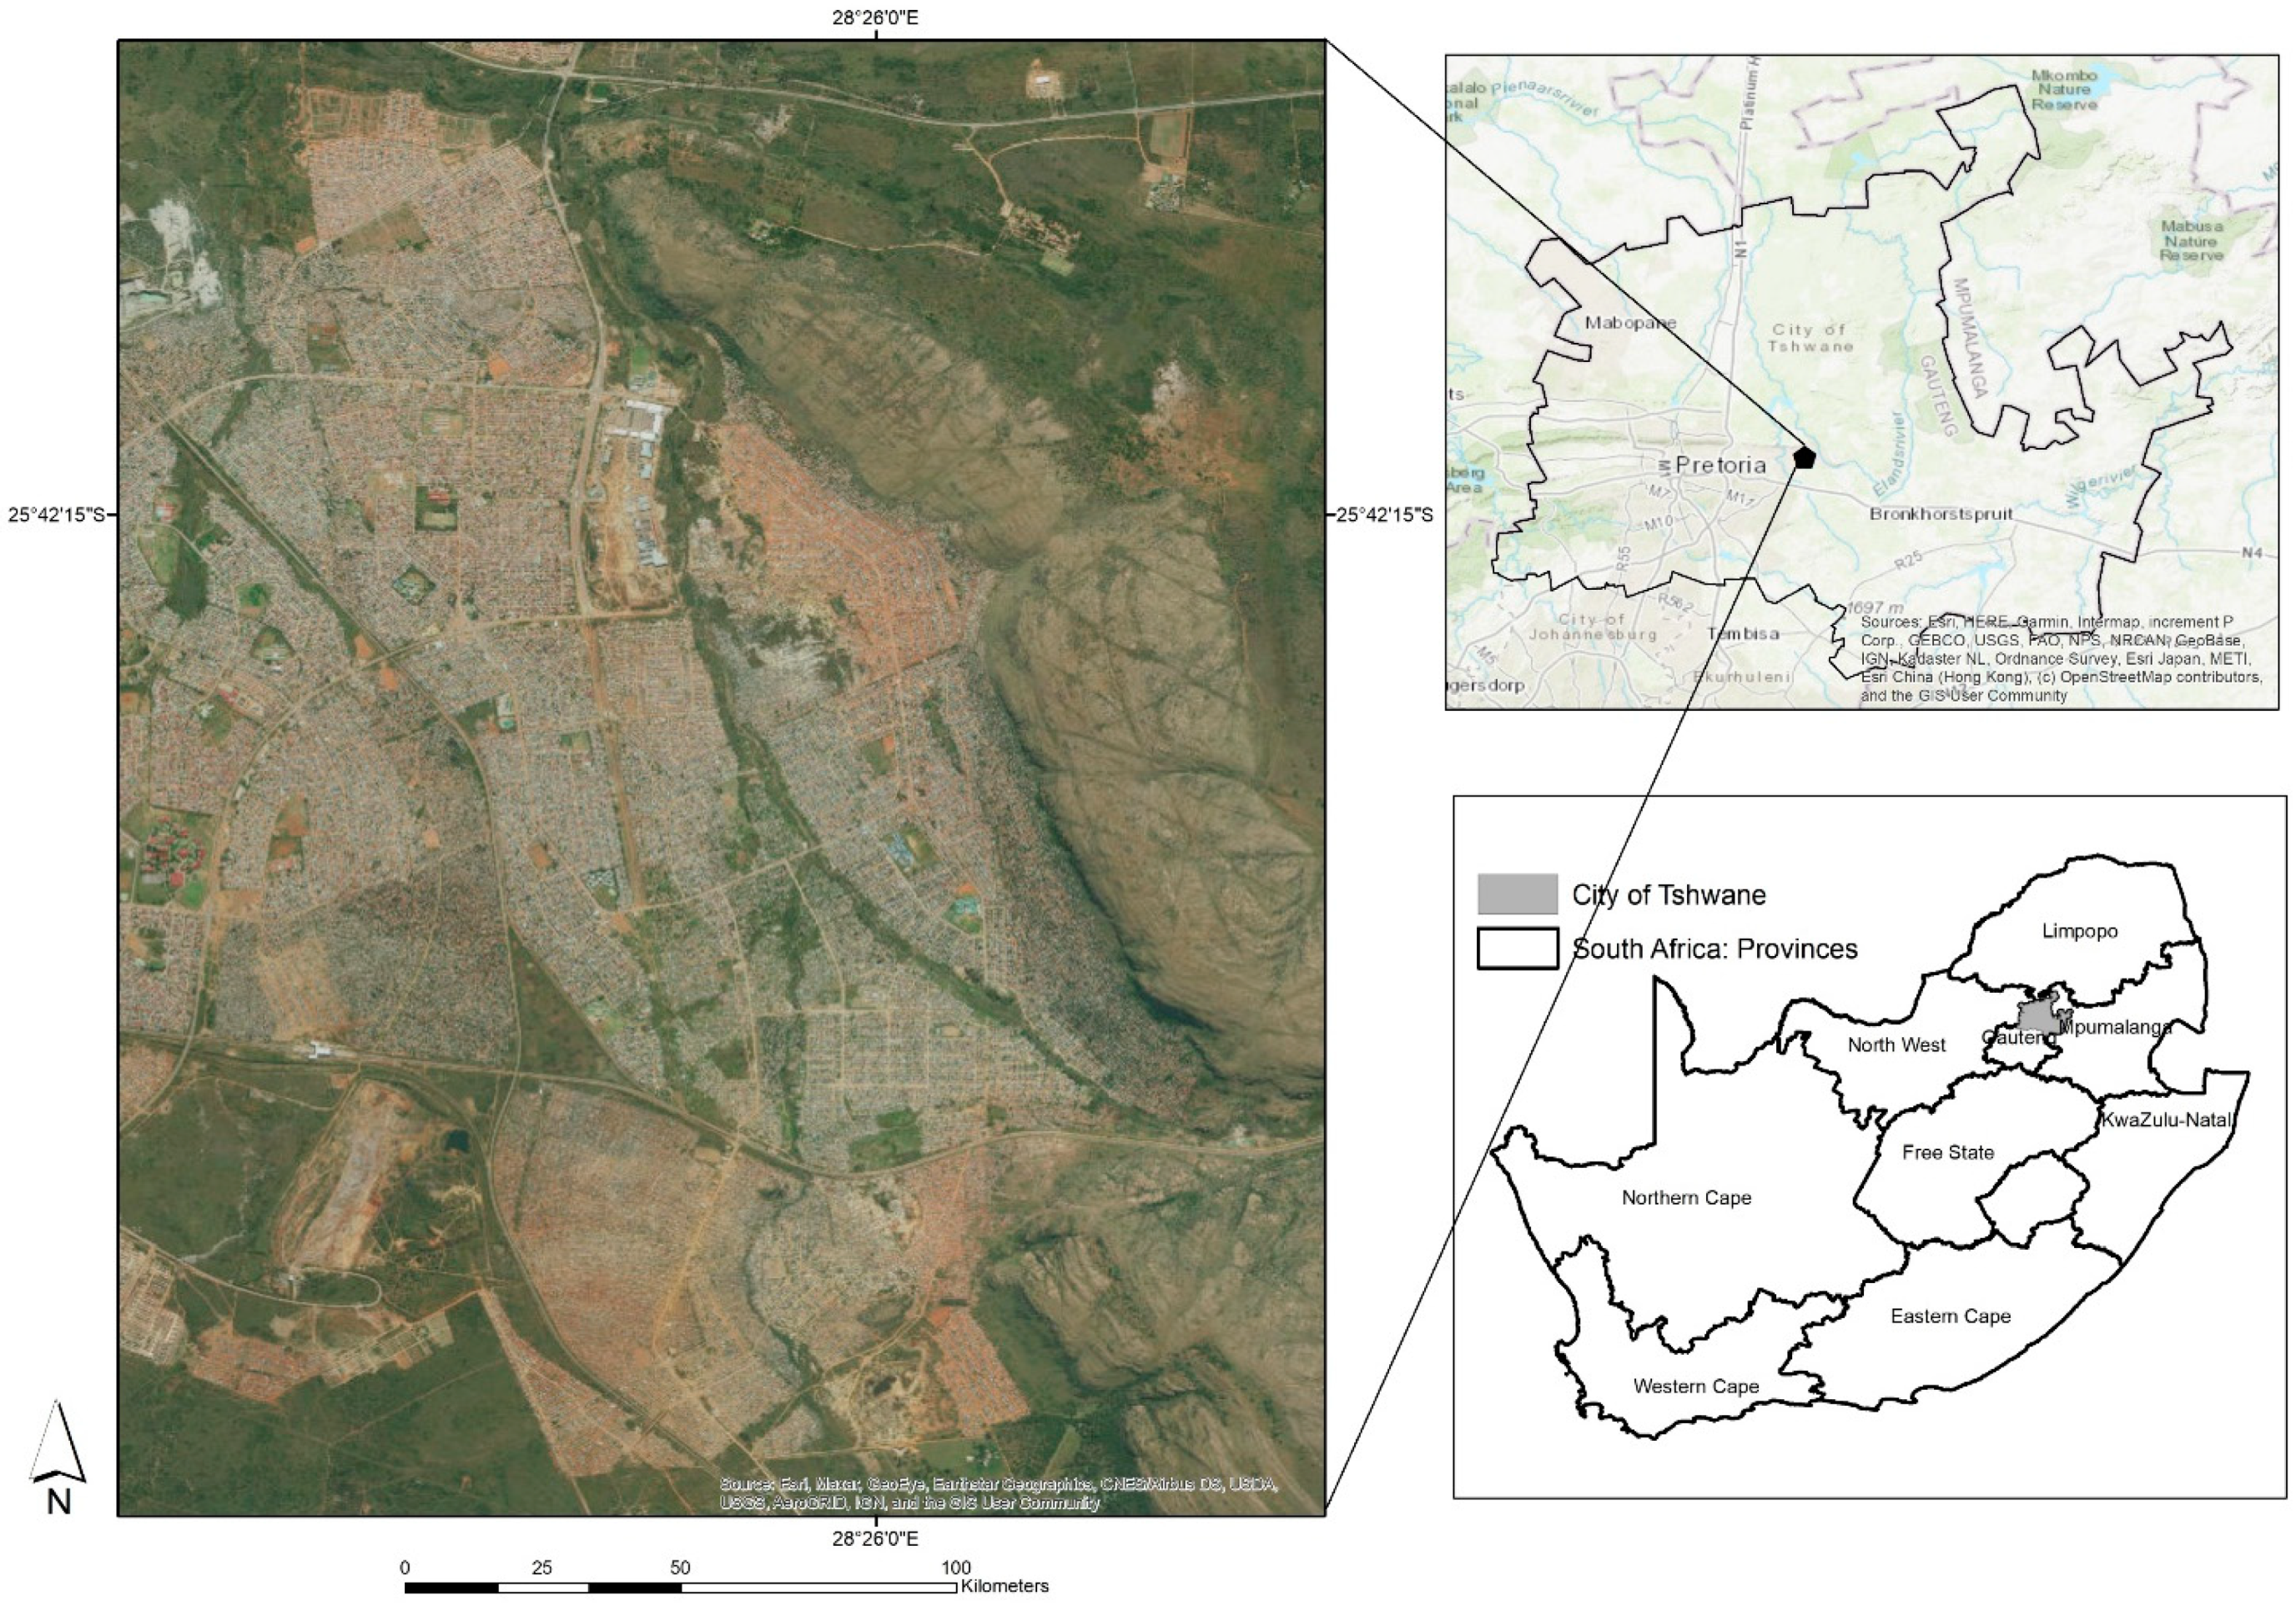
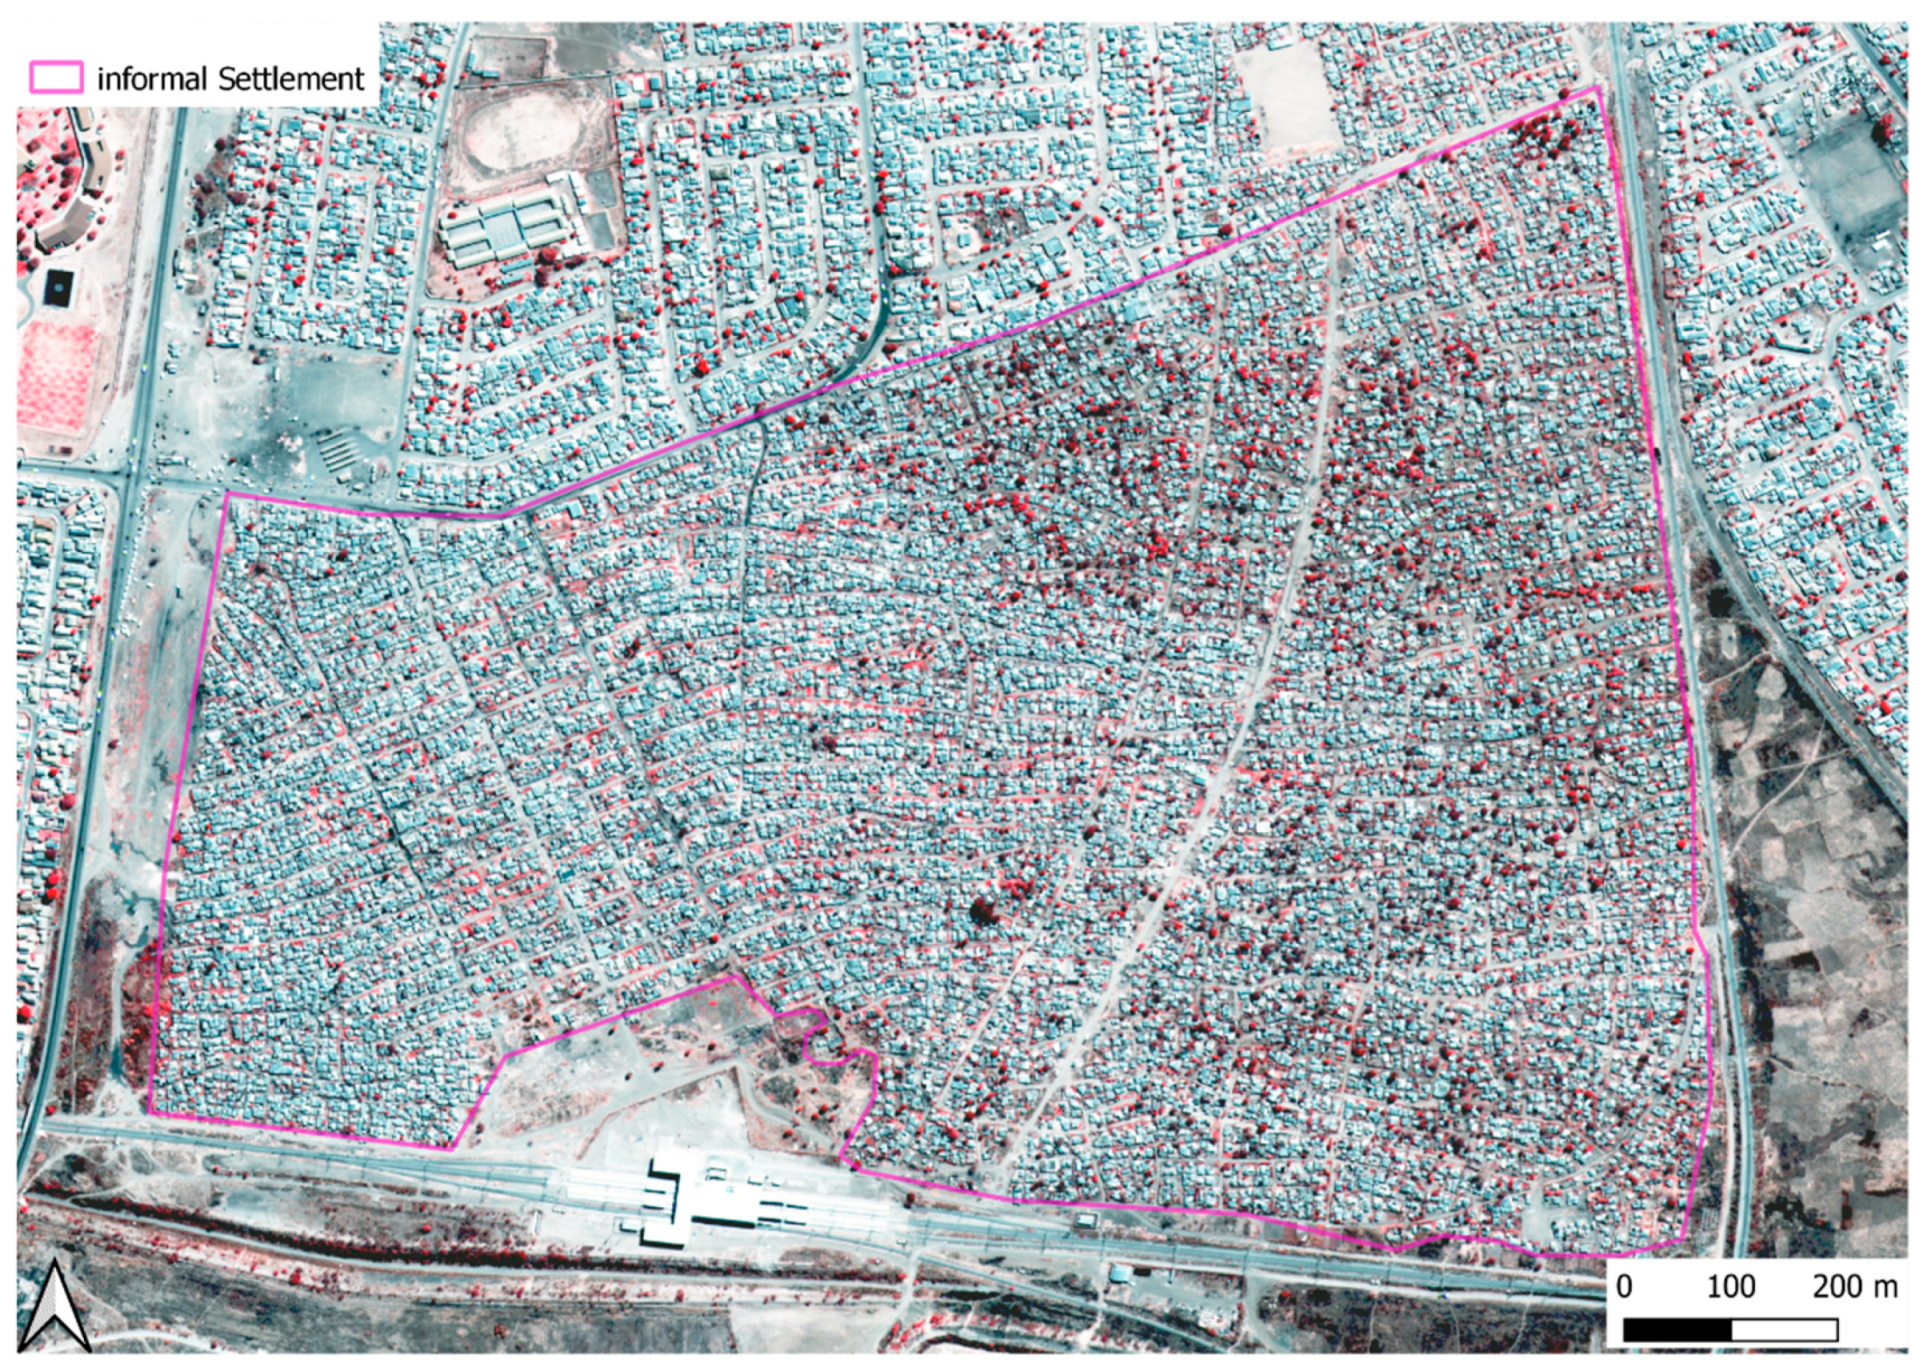
2. Study Area
Mamelodi is one of the biggest townships in the city of Tshwane, South Africa, located 20 km east of the city, see
Figure 1. The total area of Mamelodi Township is around 32 km
2. Mamelodi was established in 1953 as an urban housing scheme designed exclusively for occupation by black African residents. In line with Apartheid planning, Mamelodi was intended to provide a cheap labor pool for industries in Pretoria and the wider Gauteng region [
28].
Mamelodi Township has a population of 334,577 [
29] and is home to many immigrants due to its connectivity to the Tshwane Central Business District. Consequently, this township is densely populated with large areas of informal settlements. About 50% of dwellings in Mamelodi were informal in 2011 [
29]. Due to this high number of informal dwellings, the authorities are struggling to meet the housing demands and the provision of basic services. Additionally, Mamelodi is faced with many social and environmental challenges, including high crime rates, water pollution and solid waste management. In terms of the impact of informal settlements on the environment, the stream that flows through one informal settlement in Mamelodi is odorous and contaminated but still used for household chores putting the health of the people at risk [
30]. Despite several informal settlement upgrade projects taking place in Mamelodi, the expansion of informal settlement is still on the rise. Spatial information on informal settlements is vital to ensure that local authorities and policymakers put necessary measures and resources aimed at upgrading informal settlements and managing their development.
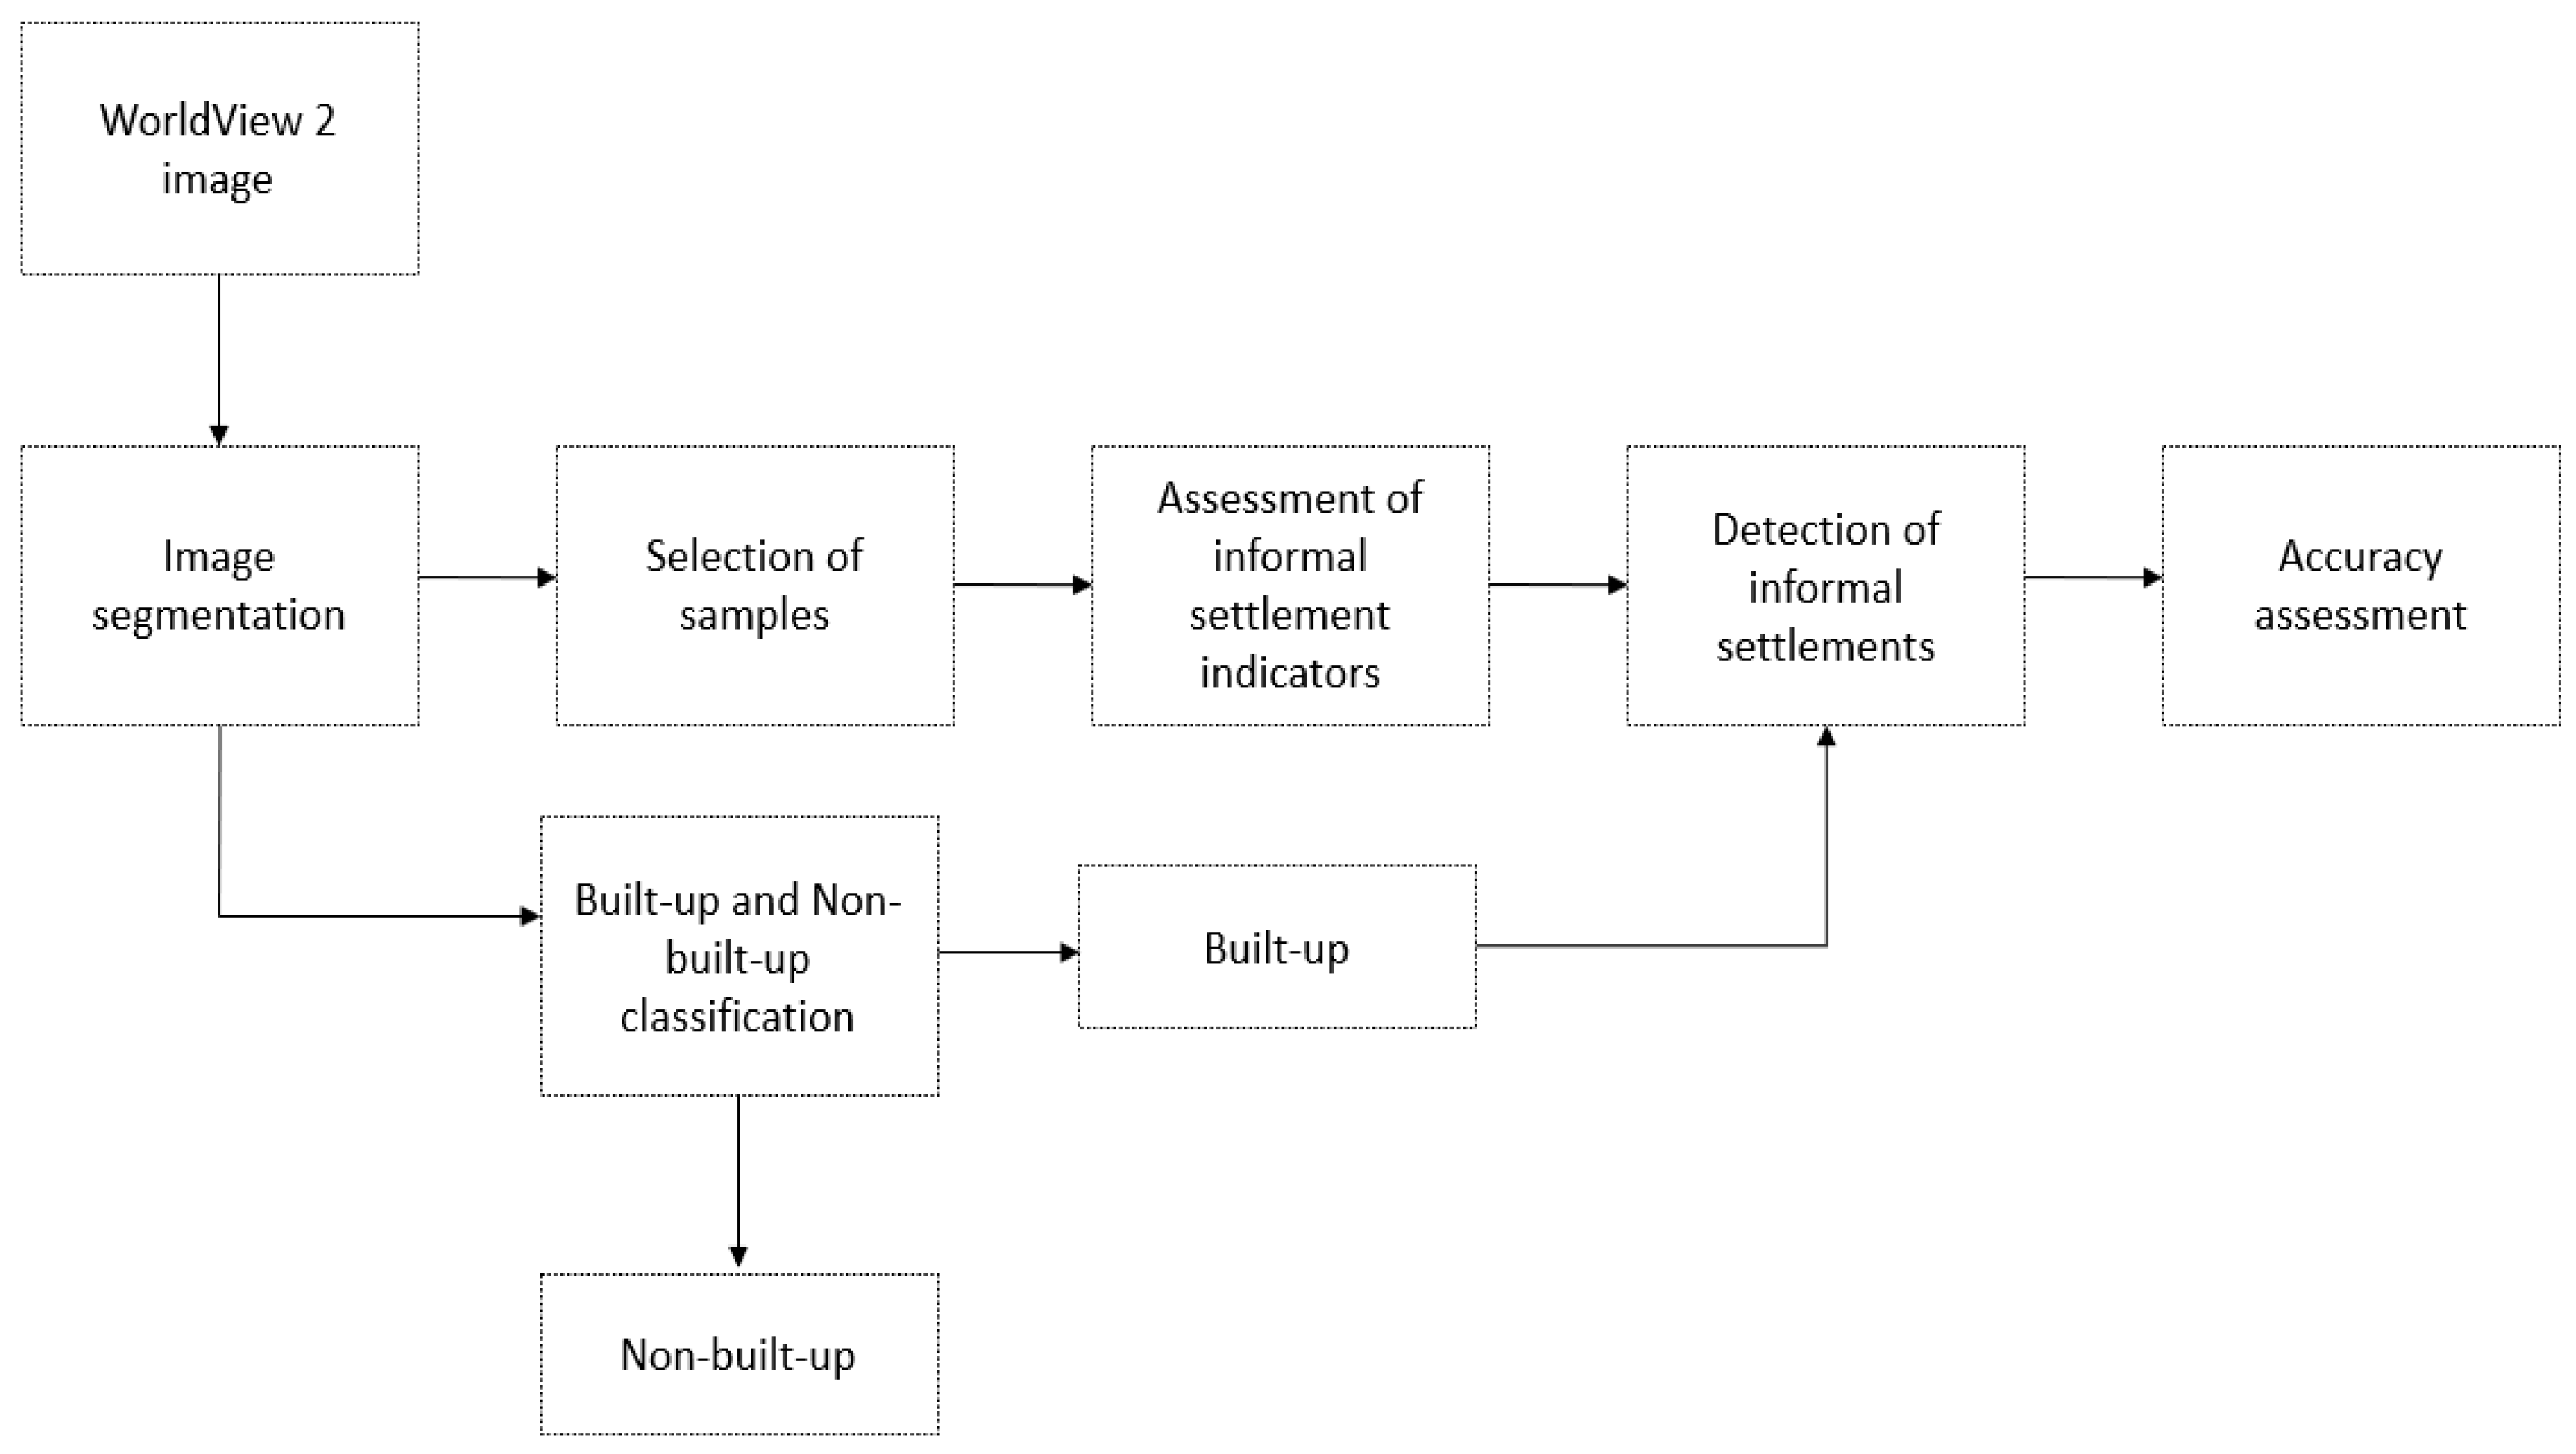
4. Method
In this study, we used object-based image analysis (OBIA) to detect informal from formal settlements. The methodology followed involves segmentation of an image into smaller image tiles, selection of samples, assessment of informal settlement indicators, built-up and non-built-up classification, detection of informal settlements and accuracy assessment,
Figure 3. The processing was done using Trimble eCognition Developer 9 software.
Section 4.1,
Section 4.2,
Section 4.3 and
Section 4.4 explain the processes followed.
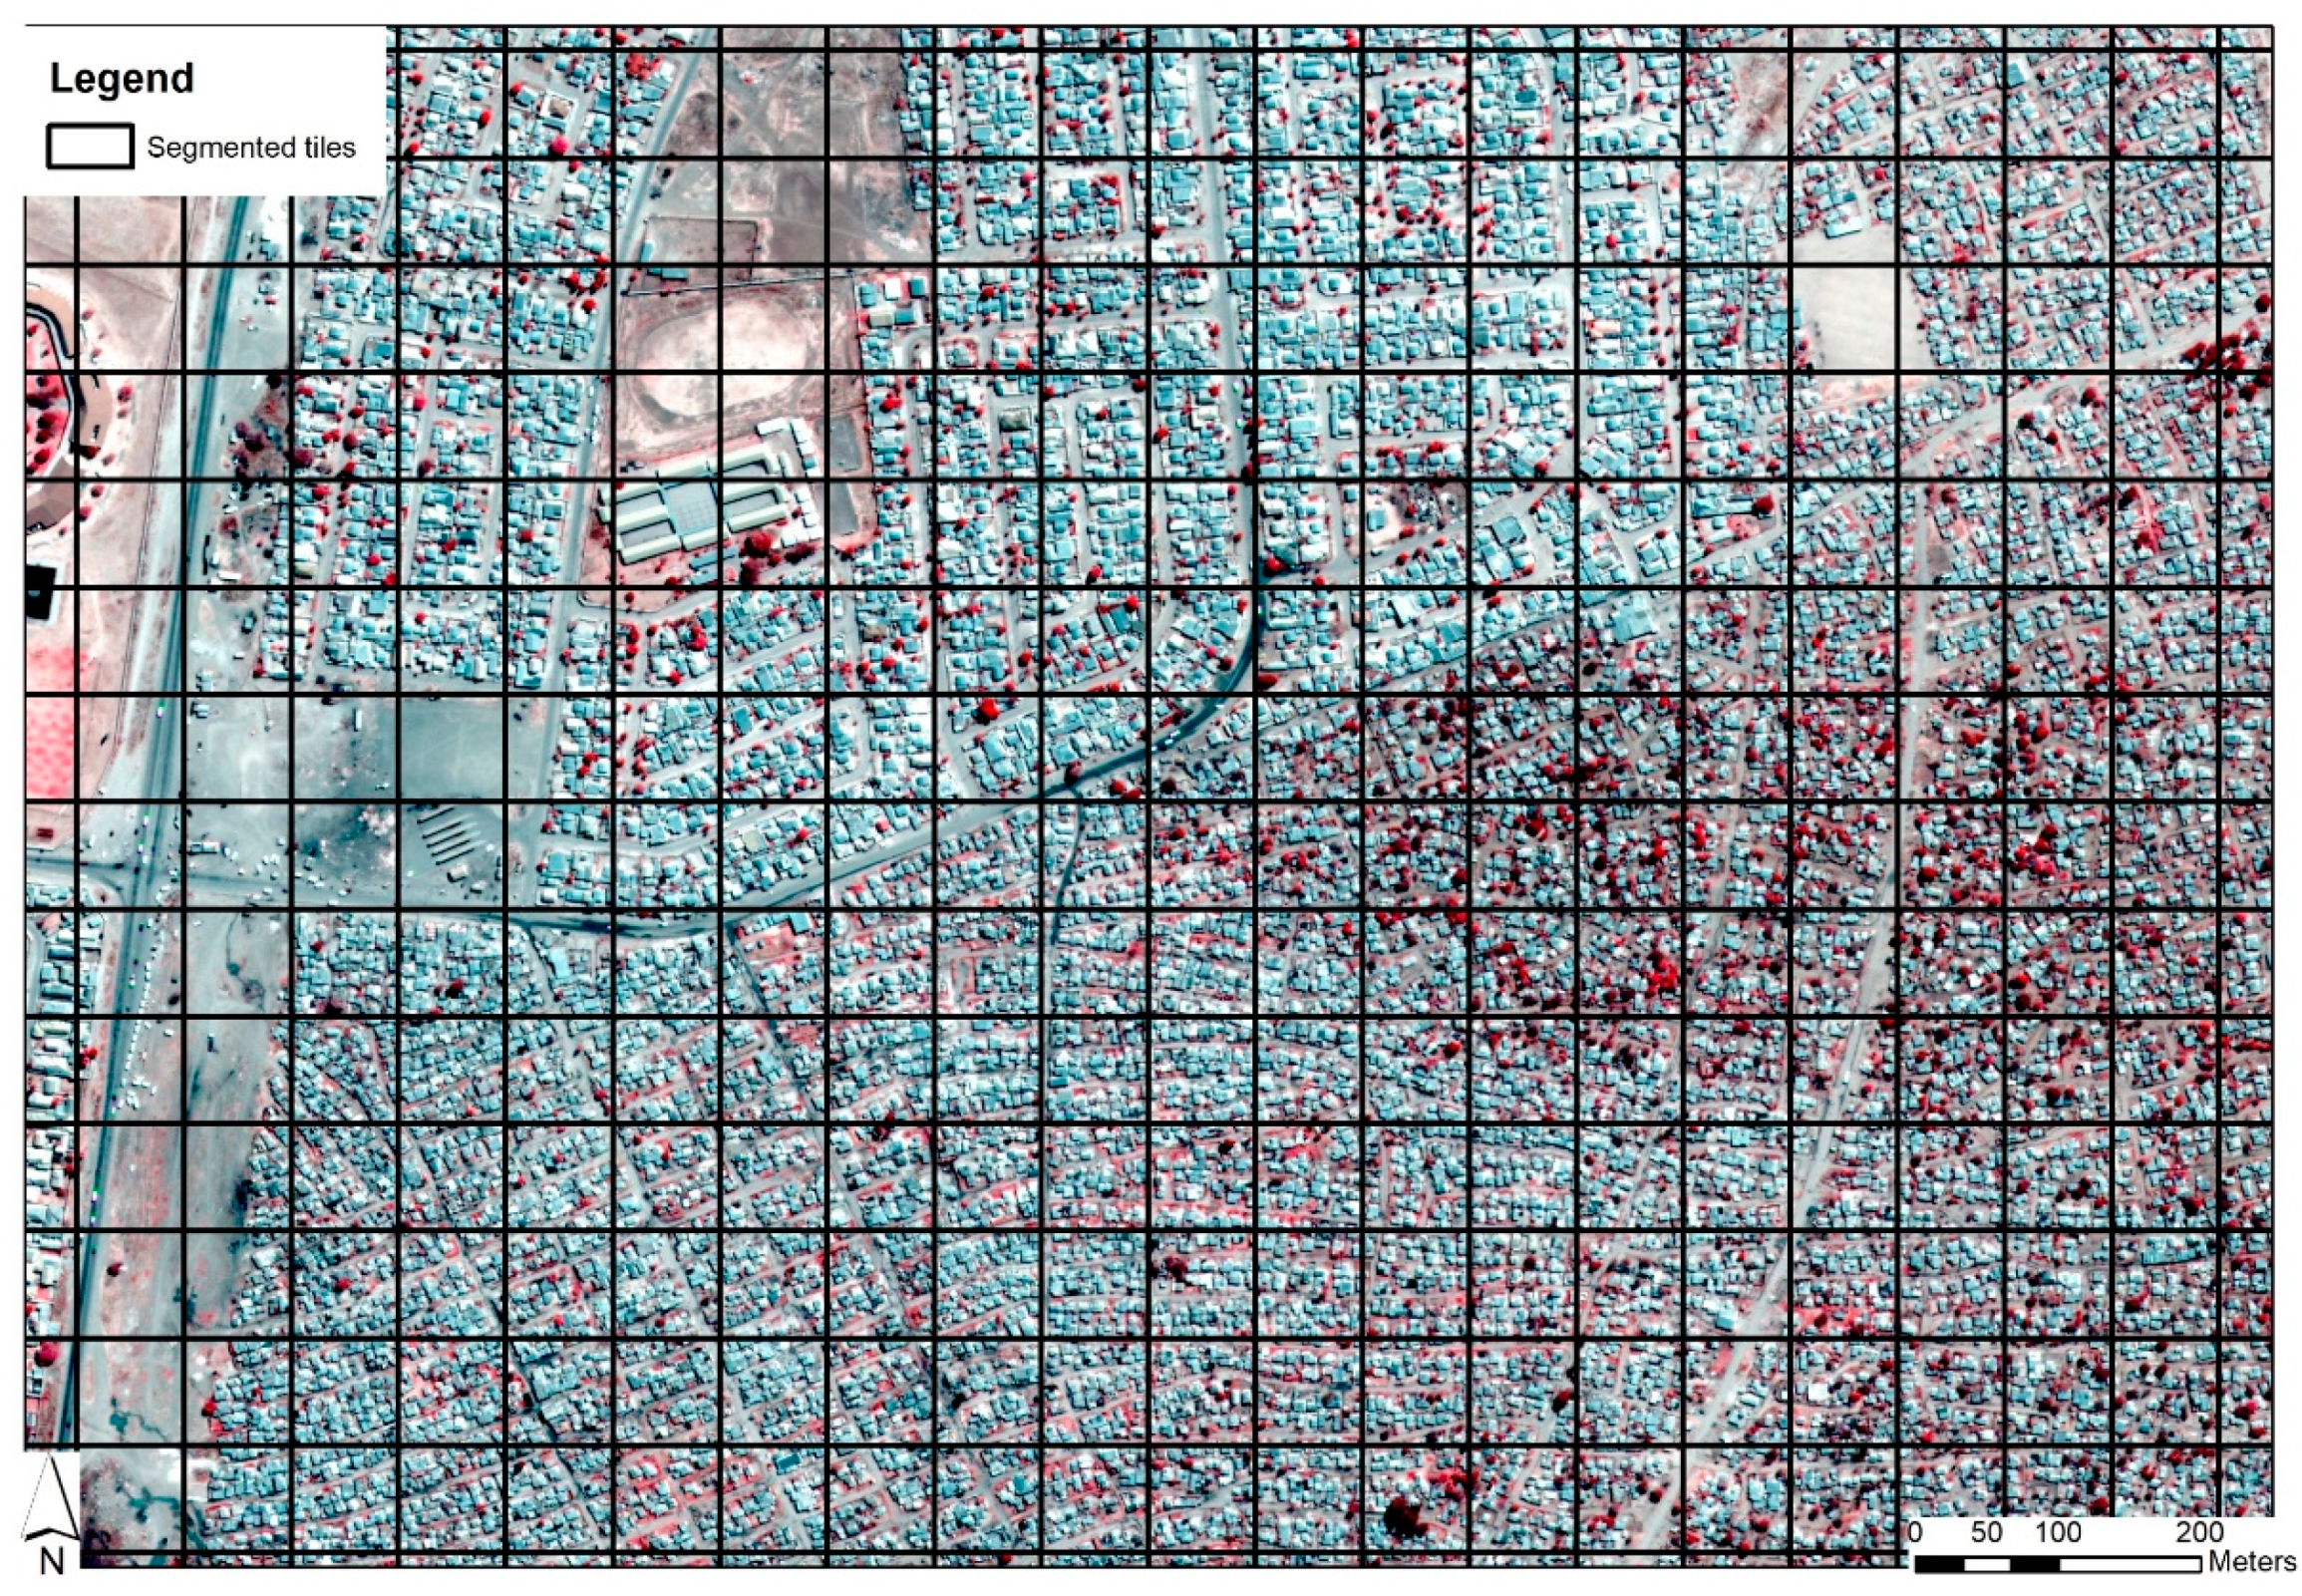
4.1. Image Segmentation
The most important step in OBIA classification is image segmentation, which partitions an image into desired objects, which are used during image classification or image interpretation. In this study, a grid-based segmentation was chosen to allow for the assessment and classification of formal and informal settlements based on the characteristics and patterns of the land-use features within a grid. We used the chessboard segmentation techniques to segment the image into 150 by 150 pixels tiles or grids. Chessboard image segmentation algorithm partitions an image into smaller square objects [
31]. This segmentation algorithm uses only the scale parameter and does not consider the spectral or shape features of the objects [
32]. The selection of the tile size was done using an interactive approach based on expert knowledge of the study area.
4.2. Assessment of Informal Settlement Indicators
Table 1 lists the informal settlement indicators that were assessed and image-based indicators investigated.
The indicators assessed included the commonly investigated informal settlement indicators, which are vegetation cover, asphalt cover and texture [
8]. In addition, we assessed the performance of the built-up area and iron cover in distinguishing between informal and formal settlements.
The density of building structures in the informal settlements varies across the study area from 5 to more than 15 building structures per 100 m
2. Lack of vegetation or limited vegetation has been used as an indication of informal settlements [
23]. Several studies have concluded that vegetation cover in informal settlements is lower than in low-density formal settlements [
15,
23,
27]. We used vegetation cover derived using normalized difference vegetation index (NDVI) to investigate its performance in the detection of informal settlements.
Built-up area indices have been used to highlight built-up areas from other land cover features from satellite imagery [
33,
34,
35]. Areas with high built-up density have higher built-up index values compared to areas with lower density built-up areas. We used the built-up area index (BAI) [
36] to assess the separation of formal and informal settlements. In addition to BAI, we developed a new built-up index, which is based on the coastal band, i.e., coastal blue index and assessed the separability of the two settlement types.
Absence or irregular roads have been identified as an indicator of informal settlements [
8]. We used the road extract index (REI) [
37] to investigate the separation of informal and formal settlements. The REI highlights asphalt surfaces from other land-use features. The road surfaces or paths in informal settlements in the study area are not paved.
In addition to the commonly used spectral indicators, we investigated the effectiveness of the iron index in separating informal from formal settlements. The roofs of building structures in informal settlements in the study area contain various materials, such as corrugated iron, woods, stones, and/or cloth sheets. The formal settlements contain roofs with iron oxide roof tiles or iron sheets and are, therefore, expected to have higher values of the iron index.
Texture is one of the most important spatial characteristics used in identifying the object of regions of interest [
38]. Gray level co-occurrence matrix (GLCM) is a second-order statistic measure and one of the commonly used methods in urban mapping. GLCM measures the spatial relations of neighboring pixels and is one of the investigated texture analysis methods in informal settlements detection. The GLCM textural measures have been used towards slum or informal settlements detection with varying accuracy from one area to the other due to the morphology of informal settlements [
25,
26,
27,
39]. We have assessed the performance of GLCM mean, variance, contrast and homogeneity textural features in separating informal from formal settlements.
Lastly, we assessed the performance of first-order statistics (FOS) measurement, mean, variance and skewness in distinguishing informal from formal settlements. These measurements calculate statistics based on the individual pixels and do not take into account the relationship to the neighboring pixels [
40,
41]. The informal settlements are illegal in nature, leading to an organic pattern of dwelling pattern and irregular or lack of road networks and other land use activities. Consequently, the texture measures between formal and informal settlements vary [
39]. We used feature space optimization (FSO) to determine the separability of 72 and 78 informal and formal sample objects against all the twelve image-based indicators listed in
Table 1. The samples were selected using visual image interpretation and contained settlements with varying dwelling structure density and vegetation cover. Image tiles created during the segmentation process, which contained formal or informal settlements, were selected as samples. The FSO is an eCognition software tool that evaluates the Euclidean distance in feature space between sample objects to determine the best separation distance [
42].
4.3. Detection of Informal Settlements
The first step in the detection of informal settlements was to separate built-up from non-built-up areas. We used GLCM dissimilarity textural analysis to classify built-up from non-built-up objects. The GLCM dissimilarity textural analysis separates built-up from non-built-up areas with higher accuracy than other GLCM textural features and spectral indices [
33].
The classification of informal from formal settlements was applied on the built-up class using indicators and image-based indicators that produced high informal settlement class separation as explained in 4.2. The ruleset to detect informal settlement was developed using FOS mean, BAI and coastal blue index and thresholding technique. The thresholds were determined by visually inspecting informal and formal objects.
Table 2 lists the values of the image-based indicators used in the detection of informal settlements.
4.4. Accuracy Assessment
Accuracy assessment was done by comparing informal and formal sample objects created in
Section 4.2 and the classified informal settlement objects using a confusion matrix.
5. Results
5.1. Image Segmentation
The chessboard segmentation method was able to create formal settlements, informal settlements and non-built-up objects. Open spaces, such as sports fields and parks within the built-up area, were separated from other land-use features,
Figure 4. There were, however, tiles that contained parts of open areas and a small portion of settlements. In addition, there were few areas where both formal and informal settlements formed part of one tile. This was observed mostly in the edges of informal and formal settlements.
5.2. Performance of Selected Image-Based Indicators in Separating Informal and Formal Settlements
The FSO class separability results are shown in
Table 3. The results show that the GLCM mean, variance, homogeneity and contrast, produced the lowest class separation distance of informal and formal settlements compared to spectral indices and FOS measurements. The GLCM variance, homogeneity and contrast had the best separating distance of the two classes of less than 0.02, with GLCM contrast having the least separation distance of 0.001. The results indicate that the selected GLCM textural measures are not effective in distinguishing informal from formal settlements in a densely populated area. This can be attributed to the varying densities of building structures and other land-use features in informal settlements resulting in varying co-occurrence values within the informal settlements class.
The separation of informal and formal classes using NDVI and REI yielded the least separability distances of 0.075 and 0.036, respectively, compared to other spectral indices. The poor performance of NDVI can be attributed to the fact that the informal settlements in the study area vary in vegetation cover and density. Low vegetation cover was observed in high-density informal settlements, whereas some of the lower-density informal settlements had higher vegetation cover than some of the formal settlements. The lower separation distance of the two classes using REI can be attributed to similar spectral properties of road and building structures in the study area. In addition, unpaved roads can be observed in both formal and formal settlements adding the confusion between the two classes.
The coastal blue index and BAI resulted in a better separability between informal and formal settlements with the best separation distances of 0.219 and 0.201, respectively, compared to other spectral indices. Most of the informal settlement tiles have lower built-up index values compared to formal areas. The use of the coastal blue index slightly increased the separability of the two classes compared to BAI. The coastal blue index was able to separate some of the dense informal settlements from formal areas that have similar values when using BAI.
The iron index performed better than NDVI and REI, with the best separation distance of 0.191 between the two classes. The informal settlements have lower values of the iron index compared to formal areas. This is due to the diversity of roof material found in informal settlements, whereas the roofs in formal settlements contain a mixture of iron sheets or iron oxide tiles, resulting in higher iron index values. The iron index failed to detect high-density informal settlements and resulted in an increased confusion between low-density informal and formal areas.
The FOS mean produced the highest separability distance of 0.235 compared to all image-based indicators investigated, whereas FOS skewness and FOS variance performed slightly better than the GLCM variance, homogeneity and contrast. The FOS mean was effective in detecting low-density informal settlements with lower spectral values but failed to detect high-density informal settlements.
5.3. Informal and Formal Settlements Classification Results
This section presents the classification results of built-up and non-built-up classes, informal and formal settlements, and accuracy assessment results achieved on the classification of informal settlements using the top three image-based indicators, which, i.e., FOS mean, coastal blue index and BAI.
The GLCM dissimilarity was successful in classifying built-up and non-built-up areas. Some of the image tiles with more than 50% non-built-up were classified as non-built-up. These areas were found mostly in the edges of the settlements.
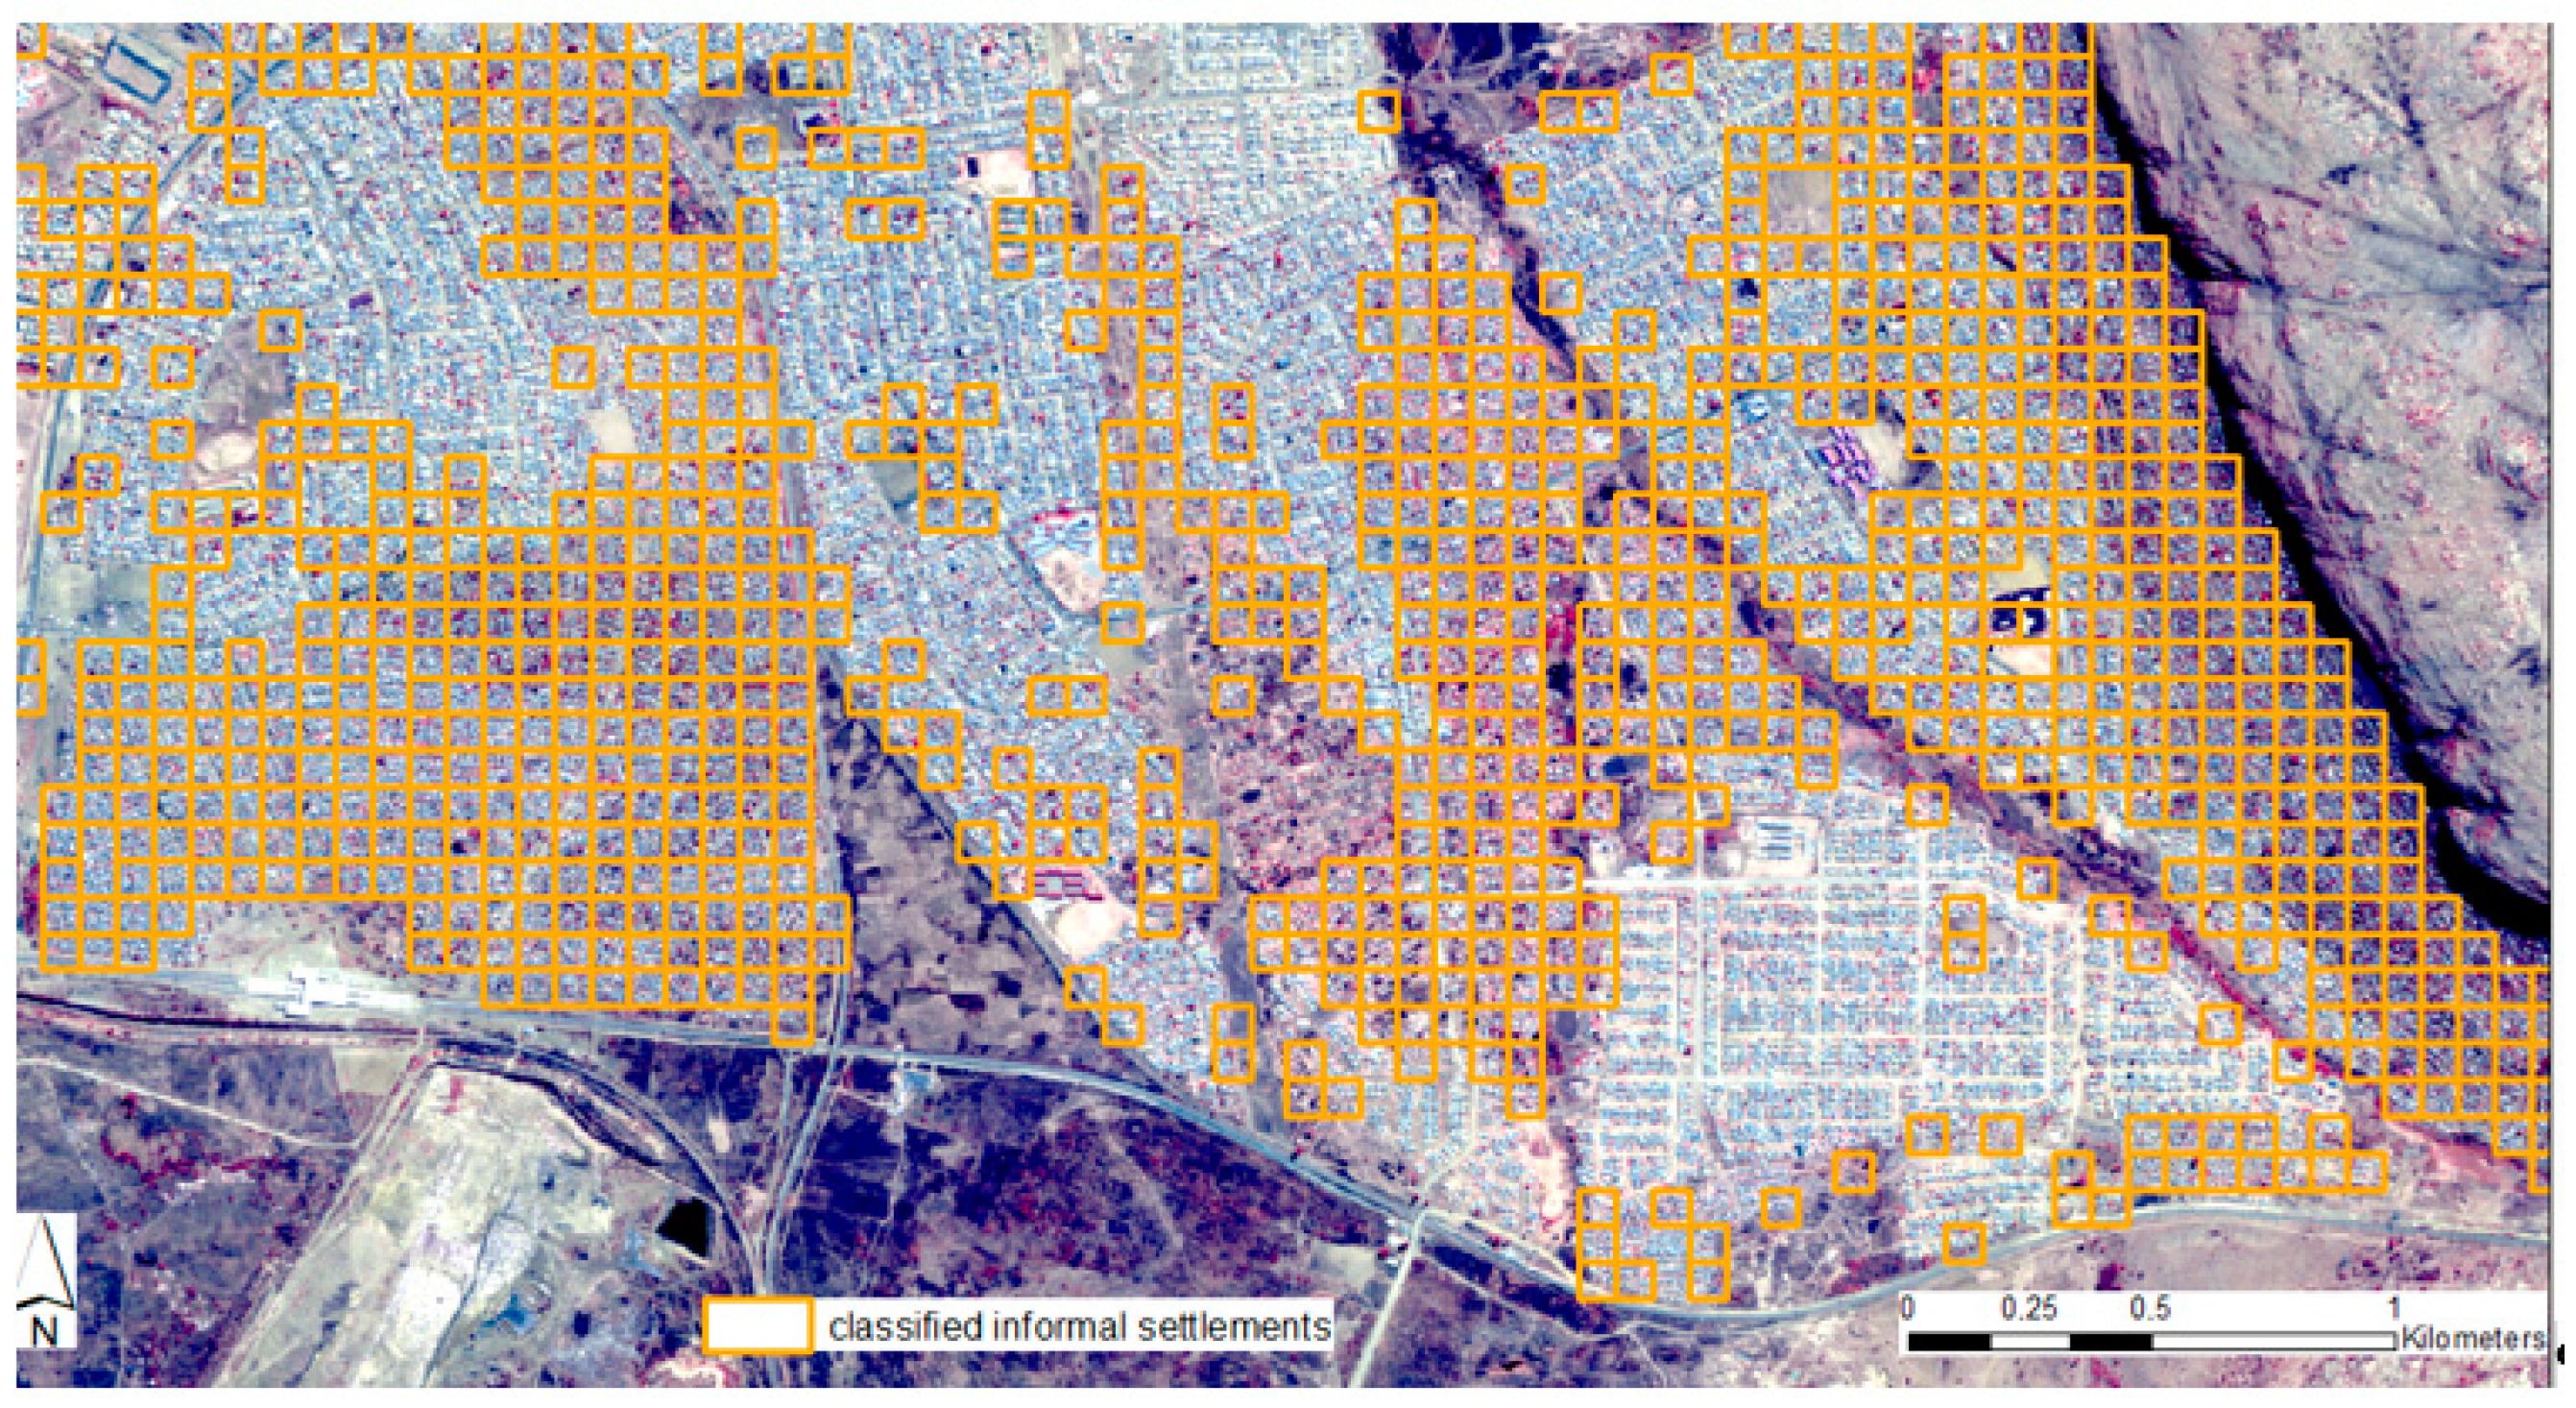
The use of the FOS, coastal blue index and BAI were successful in classifying informal from formal settlements,
Figure 5. Most of the informal settlements in the study have lower values of the built-up index than formal settlements. This is due to a lower amount of impervious surface in informal settlements in the study area. Hence they were detectable using BAI and the coastal blue index. Some of the lower-density informal settlements also have lower values of FOS mean compared to formal settlements. The FOS mean and BAI are unable to separate high-density informal settlements from formal areas. These areas have a higher amount of impervious surface and high mean values compared to low-density informal settlements. The detection of high-density informal settlements was slightly improved by the coastal blue index though at the same time introducing commission errors in some of the high-density formal settlements tiles. Some of the tiles representing formal settlements that are on the edges of settlements were also misclassified due to the contribution of spectral properties of open spaces, which are similar to some of the informal settlement tiles.
Assessment top three image-based indicators used separately show that BAI produced the highest overall accuracy of 90%, followed by coastal blue index with 88%. The coastal blue index produced the highest producer accuracy of informal settlements of 94%, followed by BAI with 84%, while the FOS mean yielded producer accuracy of 80%. The use of FOS mean and BAI resulted in an overall accuracy of 90% and a producer accuracy of informal settlements of 87%. The use of BAI and coastal blue index in the ruleset produced an overall accuracy of 88% and producer accuracy of informal settlements of 95%. The inclusion of the coastal blue index with BAI and FOS in the ruleset increased the overall accuracy by 1% and the producer accuracy of informal settlements by 6%. In addition, the use of coastal blue index with FOS mean and BAI in the detection of informal settlements increased the kappa index Agreement of informal settlements from 75% to 87% but reduced the kappa index Agreement of formal settlements from 88% and 69%. This shows that the coastal blue index increased the amount of correctly classified informal settlement tiles but also increased the confusion between informal and formal settlements.
The areas detected by FOS mean overlap with the areas detected by BAI and coastal blue index, whereas the built-up indices can detect additional informal settlements with higher FSO mean values. This shows that the proposed methodology depends highly on the built-up indices. BAI may be applied on very high spatial resolution images that do not have a coastal blue band, whereas the coastal blue index can be applied in images with the coastal blue band.
6. Conclusions
Our study showed the importance of studying the characteristics of informal settlements in different geographic areas to develop methodologies to automatically detect informal settlements. In this study, we investigated the performance of twelve informal settlement indicators in classifying informal from formal settlements. Using the FSO class separation assessment tool, only three out of twelve indicators had the best separation distance of informal and formal settlements of more than 0.2. These indicators are the FOS mean and built-up indices, i.e., BAI and coastal blue index. The study successfully identified and demonstrated a built-up area as an informal settlement indicator and a built-up index derived using the coastal band. The study also identified iron cover as an informal settlement indicator that can improve the detection of informal settlements. The study showed that the GLCM measurements performed poorly in distinguishing informal and formal settlements in the study area. The FOS variance and skewness were not successful in distinguishing between informal and formal settlements. The study also showed that vegetation cover was not effective in detecting informal settlements. This contradicts many studies that suggested that informal settlements have lower vegetation cover than formal areas. Asphalt cover derived using REI was also not effective in detecting informal settlements in the study area.
The study results contributed additional informal settlement indicators and image-based indicators that can be tested in certain areas and contribute to developing tools to detect informal settlements. Even though higher accurate results were achieved in the study, the proposed methodology needs to be tested in other areas with informal settlements of similar characteristics. In addition, there is a need to performs a thorough assessment of the twelve indicators using class separability tools with higher accuracy, such as Jeffries Matusita distance, to assess the limitation and opportunities of the indicators investigated. The performance of these indicators can also be tested using the multiresolution segmentation method. Lastly, there is a need to investigate the informal settlement indicators that distinguish high-density informal settlements from high-density formal settlements with backyard shacks using very high spatial resolution imagery acquired by drone or aerial photography.


