Abstract
Resource recovery through reuse of by-products of the sanitation chain presents a great potential towards ensuring universal access to safely managed sanitation. Many developing countries are faced with uncertainty over public and environmental health concerns associated with use of faecal sludge in agriculture. Due to resource constraints, limited data exists on the characteristics of faecal sludge to inform proper and safe use in agriculture. Despite predictive characterisation being demonstrated to be a resource-efficient approach to generate data in other fields, its application in agricultural resource recovery from faecal sludge is lacking in the literature. This paper explored predictive modelling as a less resource-intensive approach for characterisation of nutrients and pathogens in faecal sludge. Specifically, it investigated the extent to which gravimetric parameters could predict nutrients and pathogens in pit latrine sludge from informal settlements in the cities of Malawi. The study explored predictive models to estimate total ammoniacal nitrogen (TAN), total phosphorus (TP), E.coli and helminth eggs from gravimetric parameters (total solids [TS] and total volatile solids [TVS]) in pit latrine sludge. The models developed in the study allow substantially reliable estimation of TAN (R2pred = 75.4%) and TP (R2pred = 78.2%); they also provide moderately reliable predictions for E.coli (R2pred = 69.1%) and helminth eggs (R2pred = 74.3%) from total solids. Since total solids are easy and inexpensive to measure, the models present an option that can reduce resource requirement for characterisation of pit latrine sludge for informed decision-making when using pit latrine sludge in agriculture. In the absence of data on faecal sludge characteristics at the national level, the models provide a starting point for estimation of pathogens and nutrients in sludge for agricultural use. However, stepwise refinement of the models needs to be done through their validation for different types of sludge and inclusion of spatially available demographic, technical and environmental (SPA-DET) data.
1. Introduction
About 55% of the global population does not have access to safely managed sanitation [1]. Within the sustainable sanitation framework, resource recovery from by-products of the sanitation chain presents an opportunity towards ensuring universal access to safely managed sanitation in line with Sustainable Development Goal (SDG) 6. From a public health point, resource recovery has the potential to reduce pathogen transmission pathways [2]. For low-income countries, where faecal sludge management (FSM) frequently fails due to limited financial resources, resource recovery can lead to reduced resource requirement and generate additional financial flows to sustain the FSM chain [2,3,4]. Available options for resource recovery from faecal sludge include use as a source of energy, as protein for animal feed, as building materials and as soil conditioner or fertiliser [5,6,7]. In Sub-Saharan Africa (SSA), the use as a soil conditioner or fertiliser is the most established option for resource recovery from faecal sludge [2,8]. The use of human excreta in agriculture has for a long time supported and continues to support livelihoods in both rural and peri-urban areas in different parts of the world [9,10]. However, one concern with use of human excreta in agriculture is the presence of pathogens that pose a public health risk [11,12]. In addition, despite human excreta providing an affordable supplement of the nutrients in the soil, there is a risk of environmental pollution if not properly managed. Excess nutrients from the land application of human excreta may lead to eutrophication and algal blooms in surface waters, and contamination of drinking water [13,14]. There is need, therefore, to have data that informs safe and proper use of human excreta in a manner that ensures public and environmental health safety.
Many low-income countries, however, lack such accurate and reliable data to inform agricultural use of faecal sludge from onsite sanitation systems prevalent in their urban areas [15,16]. The commonly used traditional laboratory-based approach for generation of data on faecal sludge is too resource-intensive for these countries [17]. In such resource-constrained settings, some researchers advocate for development of approaches of similar accuracy but lower resource requirements [13]. One of such approaches with demonstrated feasibility for generation of data in a resource-efficient manner is predictive modelling [18,19]. In wastewater management, for example, predictive modelling has been used to estimate wastewater quality parameters and quantity; and predict the performance of the treatment systems and processes [19,20,21]. In other studies such as Nevers and Whitman [19], the predictive modelling approach has been used to develop tools for estimating surface water quality parameters. The modelling approaches mostly employed in these studies include the auto regressive integrated moving average (ARIMA) models, multivariate adaptive regression splines (MARS) method, principal component regression (PCR), partial least squares (PLS), ordinary least squares (OLS) and artificial neural networks (ANNs) [18,19,20,21,22,23].
Despite the demonstrated potential of predictive modelling in other fields, there is little application of the same in faecal sludge management. Although faecal sludge management is a relatively new area greatly informed by experiences from wastewater management, transferability of the empirical relationships from wastewater to faecal sludge management remains limited due to differences in strength and variability of wastewater and faecal sludge [17,24]. The few studies that have attempted to model faecal sludge characterisation have focussed on sludge accumulation rates [25,26], prediction of organics [17,24,27], emptying frequency [28] and sludge dewatering performance [29]. Literature is lacking on the modelling for characterisation of faecal sludge for agricultural resource recovery in the form of soil conditioner or fertiliser. Hence, there is a need to develop reliable and less-resource-intensive methods for the estimation of faecal sludge characteristics that inform the use of faecal sludge in agriculture in resource-constrained settings. This study investigated the extent to which gravimetric parameters could predict nutrients and pathogens in pit latrine sludge from informal settlements in the cities of Malawi. The knowledge from this investigation could assist in ensuring proper and safe use of pit latrine sludge in agriculture.
2. Materials and Methods
2.1. Study Area
The modelling was undertaken using data collected from pit latrines in informal settlements of the cities of Blantyre, Lilongwe, Mzuzu and Zomba in Malawi.
2.2. Pit Latrine Sludge Sampling
In each city, sludge sampling was done from 20 pit latrines in the informal settlements. For each latrine, grab samples were collected at four points (surface and depths 0.5 m, 1 m and 1.5 m from the sludge surface) of the sludge column in the latrine. This resulted in 80 sludge samples being obtained from each city and a total of 320 for the four cities. Sampling was done in conjunction with established pit latrine emptiers. The latrines included in the study were only those that were lined and had a minimum sludge column depth of 1.5 m that was viscous enough to be sucked by a vacuum tanker during sampling. Sludge depth and viscosity criteria were checked by driving a marked wooden plank into the pit latrine sludge. Verbal informed consent to get samples from a pit latrine was obtained from an adult member of the household. The study did not collect any identifiable information for households where sludge sampling was done. Figure 1 illustrates the sampling process. Collected sludge samples were immediately stored in plastic bottles in a transport box with ice packs before being transported to laboratory for analyses. Frequent monitoring of the boxes was done to ensure the samples remained cool [24]. At the Malawi Polytechnic Laboratory, the samples were kept at ≤4 °C in the refrigerator for a maximum of 28 days [13].
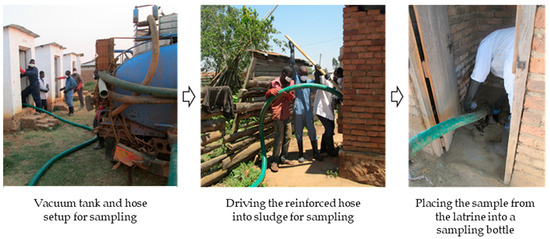
Figure 1.
Collage of three photographs arranged to show the pit latrines sludge sampling process.
2.3. Pit Latrine Sludge Laboratory Analyses
Each of the 320 unfiltered samples was homogenised and analysed separately for total ammoniacal nitrogen (TAN), total phosphorus (TP), moisture content (MC), total solids (TS), total volatile solids (TVS), fixed solids (FS), E. coli and helminth eggs. Laboratory analyses were undertaken using standard laboratory methods. Total ammoniacal nitrogen was analysed using the titrimetric method described in WRC 2137 [30] on a sample prepared from mixing 1 g of sludge with 1 litre of water. Total phosphorus was analysed using the spectrophotometric method in AOAC (Association of Official Analytical Chemists) [31]. Moisture content, total solids, total volatile solids and fixed solids were determined using the gravimetric method in WRC 2173 [31] and AOAC [31]. Sludge weighing 30 mg was dried at 103–105 °C overnight to determine moisture content and total solids. The sludge was further ignited at 550 °C to determine total volatile solids and fixed solids. E. coli concentration was determined using the plate count method in AOAC [31]. Helminth eggs were quantified using the USEPA Modified Method [32]. For helminth eggs, the samples that were analysed did not include the 80 samples from informal settlements of Blantyre. This was the case because all the data was collected under the Sanitation Research Fund for Africa (SRFA) project and at the time of sludge sampling and analysis for Blantyre, the project team was still refining the parameters to investigate. At this initial stage, helminth eggs were not among the parameters to be investigated. All analyses on the samples were performed in duplicate with the average values presented in this study.
2.4. Model Building, Selection and Evaluation
Like studies such as Strande et al. [17], Nevers and Whitman [18], Junglen et al. [24], Kalulu et al. [27], Englund et al. [28] and Bakare et al. [33], the modelling approach in this study was one of establishing statistical relationships for prediction as opposed to understanding the fundamental mechanisms underlying the relationships. The study took an iterative approach to model building and selection, as shown in Figure 2.
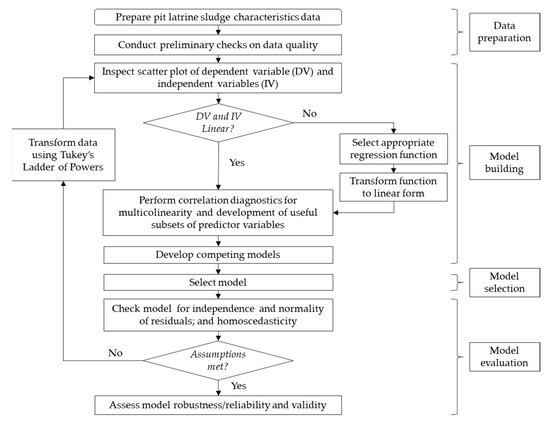
Figure 2.
Model building and selection flow chart.
2.5. Model Building
The dependent variables investigated in the modelling were TAN, TP, E. coli and helminth eggs. The predictor variables were the gravimetric parameters of the pit latrine sludge. Gravimetric parameters were selected to be predictors because they are accurate, easy to measure and relatively inexpensive [24,34,35]. In addition, gravimetric parameters are also very common and important in the design and operation of most wastewater and faecal sludge treatment options deemed to be appropriate for developing countries (e.g., unplanted drying beds, planted drying beds, composting, ponds, settling/thickening tanks and lime stabilisation [36]. In wastewater management, a number of studies have also investigated gravimetric parameters as predictors of chemical and microbiological parameters in wastewater [37,38]. Among the gravimetric parameters, dependent relationships exist between moisture content and total solids and between total volatile and fixed solids. As such, the study investigated total solids and total volatile solids as predictor variables as informed by other studies such as Junglen et al. [24] and Strande et al. [17]. Generally, increasing concentrations of TS and TVS. are associated with more organic matter that creates conducive environment for multiplication of microorganisms. The increased activity of the microorganisms increases the mineralization of nutrients in the sludge [13].
A quality check was done on the pit latrine sludge characteristics data for missing values and outliers. No missing values were found for the 320 samples. All outliners were verified with the raw results from the laboratory and none was excluded from the model development. This was followed by visual inspection of the scatter plots of the dependent variables and each of the predictor variables. The linearity of the dependent and predictor variables was checked from the scatter plot. In cases where the relationship was not linear, an appropriate mathematical function linking the dependent and independent variables was selected guided by the shape of the scatter plot. For each predictor-response relation of the sludge parameters, the function considered for regression was the one had the highest R2 among the trendline options in MS Excel 2013. The selected function was transformed into a linear form so that linear regression could be used to determine the coefficients of the selected mathematical expression. The linear regression approach to coefficients determination was chosen because, unlike nonlinear models, linear models are simpler to interpret and give more statistics that help to evaluate and verify the model [39].
Linear relationships among the variables were explored using Pearson correlation. The correlation coefficients were used to select the predictor variables to be used in the development of competing models. For any response variable modelled, predictor variables were included in the development of competing models if the absolute magnitude of their correlation coefficient was ≥0.3. Correlations with coefficients of magnitude less than 0.3 are considered negligible [40]. In addition, the correlation coefficients assisted in the identification of the combinations of the predictor variables in building competing models with a low probability of multicollinearity from highly correlated predictor variables. Highly correlated predictor variables were those with |r| ≥ 0.7 [40,41]. The competing models were developed using the Best Subset function in Minitab 17.
2.6. Model Selection
From among the list of the candidate models, the best model was selected using the prediction sum of squares (PRESS) statistic whereby the model with the lowest PRESS was selected. In the instances where competing models had the same PRESS value, Akaike Information Criterion (AIC) values were calculated and the model with the smallest AIC value was selected. The use of the AIC statistic was chosen as it aims at achieving parsimony, which augurs well with maximisation from limited resources [22,42]. The selected model was adjusted for location based on findings of a study by Kalulu et al. [43] that established variation in pit latrine sludge characteristics across the cities of Malawi. In the models adjusted for location, Blantyre was taken as the reference city except for helminth eggs, for which Lilongwe was the reference category because data was captured in alphabetical order of the cities in Minitab 17, which automatically selects the first category as the reference category.
2.7. Model Evaluation
The selected model was checked for significance, homoscedasticity, randomness of residuals, outliers, amount of data for precise estimation of the strength of the regression relationship and multicollinearity of predictor variables. Visual inspections for randomness of points on both sides of zero and large residuals in the Residuals vs. Fitted Values plots were used to assess homoscedasticity, normality of residuals and outliers. All the large residuals and unusual values were investigated back to the untransformed data. The sufficiency of data to precisely estimate the strength of the regression relationship without model overfitting was assessed using the observation-to-predictor ratio. Literature presents the values ranging from 10 to 30 as the minimum observation-to-predictor ratio for precise estimation of the strength of the regression relationship [44]. Multicollinearity among the predictors was checked using the variance inflation factor (VIF). Based on Moustris et al. [45], VIF values range of 0 < VIF < 5 suggest that there is no multicollinearity problem. VIF values of 5 ≤ VIF ≤ 10 show moderate multicollinearity and VIF > 10 indicates significant multicollinearity. In cases where selected model did not satisfy these linear regression checks, data transformation was done and the procedure repeated starting from linearity check of the transformed values of the dependent and predictor values. The Tukey Ladder of Powers [46] informed the transformations in this study.
A modelled relationship was considered to have reached significance when the p-value was less than 0.05. The proportion of the dependent variable variation explained by the model was determined using the R2. Model predictive accuracy was checked using the predicted r-squared value (R2pred). The R2pred is a form of the leave-one-out cross-validation and measures how well a model predicts responses for the missing observation [47]. The predictive accuracy of the models was categorised as weak (25% ≤ R2pred < 50%), moderate (50% ≤ R2pred < 75%) and substantial (R2pred ≥ 75%) [48].
3. Results
3.1. Laboratory Characterisation
Table 1 presents the characteristics of the pit latrine sludge sampled in this study. The table presents ranges, median and mean values because faecal sludge characteristics are often not normally distributed [17,24].

Table 1.
Characteristics of the sampled pit latrine sludge.
3.2. Correlations of Predictor Variables
For all the parameters, the scatter plots of untransformed values of the response variables and predictor that had the highest R2 followed the shape of power and exponential functions. The natural log transformation was thus used to get the linear function. A weak correlation existed between ln TS and ln TVS (|r|= 0.20).
3.3. Total Ammoniacal Nitrogen Model
Figure 3 shows the correlations of ln TAN with the natural log values of total solids (TS) and total volatile solids (TVS). A high correlation existed between ln TAN ln TS (r = −0.79). There was a negligible correlation for ln TAN and ln TVS (r = 0.25).
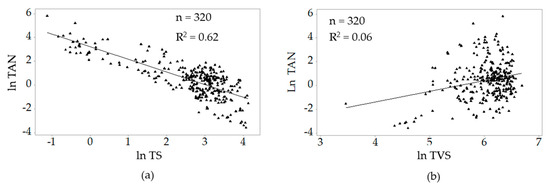
Figure 3.
Correlations between ln total ammoniacal nitrogen (TAN) and (a) ln total solids (TS) and (b) ln total volatile solids (TVS).
From the competing candidate models, the best model was the one that had total solids (TS) as the predictor variable. The observation-to-predictor ratio for the model (320) was greater than the minimum of 10 to 30. With a VIF value of 1, the model had no multicollinearity issues. No observable trend was found in the Residuals vs. Fitted values plot implying homoscedasticity and randomness of residuals are met. Table 2 shows the statistics of the best TAN model.
Table 2.
TAN model statistics.
A significant model was found which successfully predicted the natural log values of the TAN concentrations ((F (4315) = 251.1, p < 0.001). The model explains 76.1% of the variation in the natural log values of TAN concentration. The modelled relationship gives substantially valid predictions of the natural log values of TAN from natural log values of total solids (R2pred = 75.4%). The validity of predictions holds in the TAN concentration range 0.03 to 353 mg/g dry solids within which the model was developed. All other factors being equal, increasing total solids value by a unit percentage is associated with a 1.16% decrease in the mean TAN value. Direct estimation of TAN in the sludge from total solids for Blantyre, Lilongwe, Mzuzu and Zomba can be made using Equations (1)–(4), respectively.
where TAN is total ammoniacal nitrogen (mg/g dry solids)
TS is total solids (%)
3.4. Total Phosphorus Model
The correlations of ln TP with the natural log values of total solids and total volatile solids are presented in Figure 4. Ln TP correlated highly with ln TS (r = −0.85). Ln TP had a negligible correlation with and ln TVS (r = 0.12).
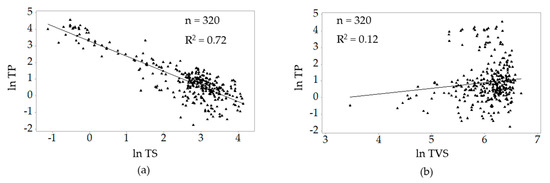
Figure 4.
Correlations between ln TP and (a) ln TS and (b) ln TVS.
The best TP model arrived at was the regression model with total solids (TS) as the predictor variable. The observation-to-predictor ratio (320) for the model was greater than the minimum range of 10 to 30. The model had no multicollinearity issues with a VIF value of 1. The Residuals vs. Fitted values scatterplot did not funnel out or curve, thus the assumptions of linearity and homoscedasticity are met. The statistics of the best TP model are presented in Table 3.
Table 3.
TP model statistics.
A significant model successfully predicting the natural log values of TP concentration was found ((F (4315) = 294.8, p < 0.001). The model explains 78.9% of the variation in the natural log values of TP concentration. Substantially accurate predictions of the natural log values of TP concentration can be made from the natural log values of total solids using the model (R2pred = 78.2%). The prediction validity holds for the TP concentration range of 0.02 to 98 mg/g dry solids within which the model was developed. All other factors being equal, for a unit percentage increase in the value of total solids (TS), there is a corresponding 0.97% decrease in the mean TP value. Direct estimates of TP concentration in the sludge from total solids for Blantyre, Lilongwe, Mzuzu and Zomba can be obtained from Equations (5)–(8), respectively
where TP is total phosphorus (mg/g dry solids) and TS is total solids (%).
3.5. E. coli Model
Figure 5 shows the correlations of ln E. coli with the natural log values of total solids and total volatile solids. High correlation existed between ln E. coli and ln TS (r = −0.76). There was a negligible correlation for ln E. coli ln TVS (r = 0.25).
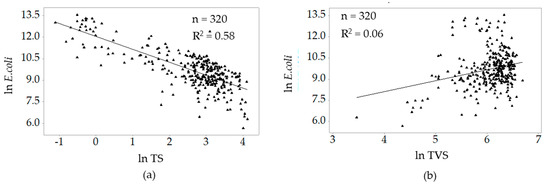
Figure 5.
Correlations between ln E. coli and (a) ln TS and (b) ln TVS.
From the competing candidate models, the best model was the one with total solids (TS) as the predictor variable. The observation-to-predictor ratio for the model (320) was greater than the minimum of 10 to 30. The VIF value (1) was within the range 0–5, implying that no multicollinearity existed in the model. No observable trend was found in the Residuals vs. Fitted values plot, implying that it meets the assumptions of homoscedasticity and randomness of residuals. Table 4 presents the statistics of the best E. coli model.
Table 4.
E. coli model statistics.
A significant model was found which successfully predicted the natural log values of E. coli concentration (F (4315) = 184.3, p < 0.001). The model explains 70.1% of the variation in natural log values of E. coli concentration. The model provides a moderately accurate prediction of the natural log values of E. coli concentration from natural log values of total solids (R2pred = 69.1%). The prediction validity holds for an E. coli concentration range 293 to 798,000 cfu/g dry solids within which the model was developed. From the model, all other factors being equal, a unit percentage increase in the value of total solids corresponds to a 0.99% decrease in the mean E. coli value. Direct estimates of E. coli in the sludge from total solids for Blantyre, Lilongwe, Mzuzu and Zomba can be obtained from Equations (9)–(12), respectively
where E. coli is in cfu/g dry solids and TS is total solids (%)
3.6. Helminth Eggs Model
The correlations of natural log of helminth egg values with the natural log values of total solids and total volatile solids are presented in Figure 6. Ln helminth eggs correlated highly with ln TS (r = −0.85) and had a negligible correlation with ln TVS (r = 0.15).
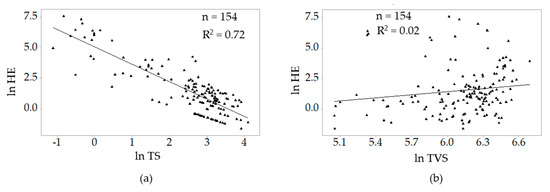
Figure 6.
Correlations between ln helminth eggs and (a) ln TS and (b) ln TVS.
Since the modelling used the log transformation, the modelling of helminths was based only on samples in which helminths eggs were detected so as not to have zero values in the modelling as suggested by Bellego and Pape [49]. Helminth eggs were detected in 154 (64%) that were analysed in Lilongwe, Mzuzu and Zomba Cities. From the competing candidate models, the best model had total solids (TS) as the predictor variable. The observation-to-predictor ratio for the model (154) was greater than the minimum of 10 to 30. The VIF value (2.1) was within the range 0–5 implying that the assumption of no multicollinearity has been met. The Residuals vs. Fitted values scatterplot did not funnel out or curve, thus the assumptions of linearity and homoscedasticity are met. The statistics of the best helminth eggs model are presented in Table 5.
Table 5.
Helminth eggs model statistics.
A significant model successfully predicting the natural log values of helminth eggs concentration was found (F (3150) = 147.8, p < 0.001). The model explains 74.7% of the variation in the natural log values of helminth eggs concentration. Moderately accurate predictions of the natural log values of helminth eggs concentration can be made from the natural log values of total solids using the model (R2pred = 73.1%). This prediction accuracy holds in the helminth egg concentrations in the range 0.2 to 2090 eggs/g dry solids within which the model was developed. All other factors being equal, for a unit percentage increase in the value of total solids (TS), there is a corresponding 1.13% decrease in the mean TP value. Direct estimates of helminth eggs in the sludge from total solids for Lilongwe, Mzuzu and Zomba can be obtained from Equations (13)–(15), respectively
where HE is helminth eggs concentration in in eggs/g dry solids, while TS is total solids (%).
4. Discussion
The values of the gravimetric parameters for the pit latrine sludge in this study were comparable to values established from pit latrine sludge elsewhere [50,51,52]. In general, the levels of nutrients (TAN, TP) and pathogens (E. coli, helminth eggs) in pit latrine sludge in this study were lower in comparison to values reported in the literature. The TAN concentration range in this study was lower than the mean range 61.5 to 153.8 mg/g TS from studies reported by Strande et al. [13]. This difference could be attributed to differences in the diets of the users of onsite sanitation systems from which the sludge was sampled. Sludge from users that take diets with high levels of lignin tends to have increased production of ammonia [53]. The TP concentrations in the study were slightly lower than the mean range of 13.8 to 30.8 mg/g TS reported in the literature [13,54]. This might have resulted from differences in the diets of the users and the quantities of detergents used introduced into the latrines. The total solids content from the pit latrine sludge in the four cities were comparable to range of 9.3% to 18.2% reported on faecal sludge by Zavala et al. [50] and Greya et al. [52]. The median and mean total volatile solids were lower than the range of 58% to 77% TS reported in other studies [51,52]. The difference in the length of time to which the sludge had been subjected to degradation in the containment could be one explanation for this difference. The E.coli concentration in this study was lower than the values of 1 x 10⁶ cfu/g TS found in the literature [52,53,55]. This could have resulted from pathogen die-off due to food depletion through the stabilisation process in the latrines in this study. The median and mean helminth egg concentration in this study were lower than values of 30–52 egg/g TS reported by Jimenez et al. [55] and Koné et al. [56]. One explanation for the difference in the helminth egg concentration could be the higher prevalence of helminths among users in Ghana than Malawi [57,58]. This implies that unless verified, the application of the models may be limited for other pit latrine sludge with higher concentrations of nutrients and pathogens. Since the study investigated sludge up to a sludge depth of 1.5 m from the surface, the models may also be limited in the estimation of nutrients and pathogens in pit latrine sludge from layers beyond a 1.5 m depth. Application may be limited in the case of septage, which generally has low levels of stabilized solids [36].
From the study, total solids were found to be the best predictor for reliable estimation of both nutrients and pathogens. This finding was in agreement with other studies that also found TS to correlate strongly with other parameters in faecal sludge. Strande et al. [17] and Junglen et al. [24], for example, found a strong relationship between TS and COD, TSS and turbidity in faecal sludge with an R2 ranging from 86% to 98%. One possible reason for total solids to be the best predictor in this study could be the use of dry weight concentrations (which are derived based on the total solids concentration in the sludge sample) in the modelling. Location was also found to be a significant variable in the prediction of most of the response variables (p ≤ 0.05). For most of the predicted parameters, the study established different relationships for predicting nutrients and pathogens from total solids for each of the cities. This finding was in agreement with the wide spatial variability in the characteristics of faecal sludge as reported in the literature [33,51,59,60,61]. The variability established in this study underscores the need for localisation of decisions on use of pit latrine sludge for agricultural purposes in different geographic locations.
The study found that substantially reliable estimations of total ammoniacal nitrogen and total phosphorus concentrations could be made from total solids in pit latrine sludge. Moderate estimations of E. coli and helminth eggs concentrations from total solids were achievable in the pit latrine sludge. Although the E. coli and helminth eggs models achieved moderate predictive accuracy, they may still provide a more informative estimation of the public health risk that needs to be dealt with when using pit latrine sludge in agriculture in the cities of Malawi than relying on literature from elsewhere. Nevers et al. [18], for example, argued that a model with an R2 of 63.5% gave an adequate prediction of E. coli concentrations at effluent-dominated beaches and was comparably reliable for lab-based determination. However, there is room for improvement of the models developed in this study by exploring other models that could improve the accuracy of E. coli and helminth eggs prediction to substantial levels. The models developed in this study may also be improved by inclusion of spatially available demographic, technical and environmental (SPA-DET) data. However, considering that such data is not readily available in low-income countries [17], consideration may need to be given to SPA-DET data that might not be hard to get from latrine users. Inclusion of such data could provide more practical guidance on the application of the models. For example, inclusion of sludge age might inform the recommendation of emptying frequencies for optimal resource recovery. Another way of improving the models would be validating and refining them with sludge from both the cities covered in this study and settings outside the delimitations in terms of location, sludge type and sludge depth. However, in the absence of data on faecal sludge at the national level, the models serve as a starting point for further refinement of the estimations in a stepwise manner, as more data and resources become available, to inform national sanitation planning in the country [62,63].
The statistical relationships established in the study could reduce the resource requirement for generation of nutrient and pathogen data for informed pit latrine sludge for use in agriculture. Determination of total solids is easy to measure, inexpensive and requires little time to establish [17,24,31]. As such, prediction from total solids could reduce the costs, time and technical capacity required to sample and analyse pit latrine sludge. With reduced resource requirements, there is a high likelihood of sustainability in proper management of pit latrine sludge in the cities of resource-constrained developing countries. For example, practitioners will be able to determine the optimal quantity of the pit latrine sludge to apply to the soil based on the crop nutrients requirements and nutrient level in the soil and the sludge. Since direct use of pit latrine without prior treatment for pathogens is discouraged, the estimates from the models may need to factor in losses of nutrients that might occur in making the sludge safe. Composting and lime treatment for example, may lead to nutrient loss through the production of gaseous ammonia [13]. Introduction of excessive lime in agriculture has the potential to reduce a plant’s uptake of other nutrients, resulting in deficiencies of these nutrients [64]. Since the models were developed from raw untreated sludge, the validity of the models may need to be investigated using nutrients and gravimetric parameters from sludge that has been treated for pathogens. Such models could inform decision-making that reduces the threat to public and environmental health through pathogens and nutrients respectively [11,12,13,14]. Additionally, such use in agriculture could spur the livelihoods of communities in peri-urban areas of cities in developing countries and could generate additional financial flows to sustain the FSM chain in these cities [2,4,10].
5. Conclusions
The study demonstrates the potential of predictive characterisation as a tool to generate data on nutrients and pathogens to inform pit latrine sludge use in agriculture in resource-constrained settings. The models developed in the study allow moderately to substantially reliable estimation of nutrients (TAN and TP) and pathogens (E. coli and helminth eggs) in pit latrine sludge from total solids that are easy and inexpensive to determine. In application of the models, there is need to take into consideration the spatial variation that exists for pit latrine sludge and localise decision informed by the predicted characteristics. There is also a need to take into account the nutrient losses that might occur as a result of treating the sludge for human safety before application in agriculture. In the absence of data on faecal sludge characteristics at the national level, the models provide a starting point for estimation of pathogens and nutrients in sludge for agricultural use. However, stepwise refinement of the models needs to be done through their validation for different types of sludge and inclusion of spatially available demographic, technical and environmental (SPA-DET) data.
Author Contributions
This work was carried out as part of K.K.’s PhD study. K.K. was involved in conceptualisation, funding acquisition, data collection and analysis as well as manuscript preparation. B.T. was involved in conceptualisation, funding acquisition, manuscript review and editing as well as supervision. T.M. was involved in manuscript review and editing as well as supervision. G.K. was involved in manuscript review and editing as well as supervision. All authors have read and agreed to the published version of the manuscript.
Funding
This research was funded by the Water Research Commission (WRC) through the Sanitation Research Fund for Africa Project. K.K. was also supported by the Consortium for Advanced Research Training in Africa (CARTA). CARTA is jointly led by the African Population and Health Research Center and the University of the Witwatersrand and funded by the Carnegie Corporation of New York (Grant No—G-19-57145), Sida (Grant No:54100113), Uppsala Monitoring Centre and the DELTAS Africa Initiative (Grant No: 107768/Z/15/Z). The DELTAS Africa Initiative is an independent funding scheme of the African Academy of Sciences (AAS)’s Alliance for Accelerating Excellence in Science in Africa (AESA) and supported by the New Partnership for Africa’s Development Planning and Coordinating Agency (NEPAD Agency) with funding from the Wellcome Trust (UK) and the UK government. The statements made and views expressed are solely the responsibility of the Fellow.
Institutional Review Board Statement
Not applicable.
Informed Consent Statement
A verbal informed consent to get samples from the pit latrine was obtained at all households from an adult household member. The study objectives and sampling method were explained to the household members before requesting for their voluntary consent. In addition, no identifiable information was collected for the households from which the sludge sampling was done.
Data Availability Statement
The data presented in this study are available on request from the corresponding author. The data are not publicly available as they were generated for the Sanitation Research Fund for Africa Project of the Water Research Commission.
Acknowledgments
The authors wish to thank the Water Research Commission (WRC) and the Consortium for Advanced Research Training in Africa (CARTA) for supporting the study. The authors would also like to acknowledge the support from the team of laboratory technicians from the Faculty of Applied Sciences of the University of Malawi for carrying out the analyses.
Conflicts of Interest
The authors declare no conflict of interest. The funders played no role in the study design; data collection, analyses or interpretation; manuscript writing or in the decision to publish the results.
References
- UNICEF; WHO. State of the World’s Sanitation: An Urgent Call to Transform Sanitation for Better Health, Environments, Economies and Societies; WHO: New York, NY, USA, 2020. [Google Scholar]
- Gold, M.; Niwagaba, C.; Studer, F.; Getkate, W.; Babu, M.; Strande, L. Production of Pellets and Electricity from Faecal Sludge; Sandec Water and Sanitation in Developing Countries; Eawag: Swiss Federal Institute of Aquatic Science and Technology: Dübendorf, Switzerland, 2015. [Google Scholar]
- Murray, A.; Ray, I. Commentary: Back-end users: The unrecognized stakeholders in demand-driven sanitation. JPER 2010, 30, 94–102. [Google Scholar] [CrossRef]
- Muspratt, A.M.; Nakato, T.; Niwagaba, C.; Dione, H.; Kang, J.; Stupin, L.; Regulinski, J.; Mbéguéré, M.; Strande, L. Fuel potential of faecal sludge: Calorific value results from Uganda, Ghana and Senegal. WASHDEV 2014, 4, 223–230. [Google Scholar] [CrossRef]
- Hegazy, B.E.; Fouad, H.A.; Hassanain, A.M. Incorporation of water sludge, silica fume, and rice husk ash in brick making. AER 2012, 1, 83–96. [Google Scholar] [CrossRef]
- Seck, A.; Gold, M.; Niang, S.; Mbéguéré, M.; Diop, C.; Strande, L. Faecal sludge drying beds: Increasing drying rates for fuel resource recovery in Sub-Saharan Africa. WASHDEV 2015, 5, 72–80. [Google Scholar] [CrossRef]
- Koottatep, T.; Fakkaew, K.; Tajai, N.; Pradeep, S.V.; Polprasert, C. Sludge stabilization and energy recovery by hydrothermal carbonization process. Renew. Energy 2016, 99, 978–985. [Google Scholar] [CrossRef]
- Diener, S.; Semiyaga, S.; Niwagaba, C.B.; Muspratt, A.M.; Gning, J.B.; Mbéguéré, M.; Ennin, J.E.; Zurbrugg, C.; Strande, L. A value proposition: Resource recovery from faecal sludge-Can it be the driver for improved sanitation? Resour. Conserv. Recycl. 2014, 88, 32–38. [Google Scholar] [CrossRef]
- Singh, R.P.; Agrawal, M. Potential benefits and risks of land application of sewage sludge. Waste Manag. 2008, 28, 347–358. [Google Scholar] [CrossRef] [PubMed]
- Chen, H.; Yan, S.H.; Ye, Z.L.; Meng, H.J.; Zhu, Y.G. Utilization of urban sewage sludge: Chinese perspectives. ESPR 2012, 19, 1454–1463. [Google Scholar] [CrossRef] [PubMed]
- Fuhrimann, S.; Winkler, M.S.; Schneeberger, P.H.; Niwagaba, C.B.; Buwule, J.; Babu, M.; Medlicott, K.; Utzinger, J.; Cissé, G. Health risk assessment along the wastewater and faecal sludge management and reuse chain of Kampala, Uganda: A visualization. Geospatial Health 2014, 9, 251–255. [Google Scholar] [CrossRef][Green Version]
- Nordin, A.C.; Olsson, J.; Vinnerås, B. Urea for sanitization of anaerobically digested dewatered sewage sludge. Environ. Eng. Sci. 2015, 32, 86–94. [Google Scholar] [CrossRef]
- Strande, L.; Brdjanovic, D. (Eds.) Faecal Sludge Management: Systems Approach for Implementation and Operation; IWA Publishing: London, UK, 2014. [Google Scholar]
- Cosgrove, W.J.; Loucks, D.P. Water management: Current and future challenges and research directions. Water Resour. Res. 2015, 51, 4823–4839. [Google Scholar] [CrossRef]
- Kennedy-Walker, R.; Holderness, T.; Alderson, D.; Evans, B.; Barr, S. Network modelling for road-based Fecal Sludge Management. Munic. Eng. 2014, 167, 157–165. [Google Scholar] [CrossRef]
- Chirwa, C.; Hall, R.; Krometis, L.A.; Vance, E.; Edwards, A.; Guan, T.; Holm, R. Pit latrine fecal sludge resistance using a dynamic cone penetrometer in low income areas in Mzuzu City, Malawi. Int. J. Environ. Res. Public Health 2017, 14, 87. [Google Scholar] [CrossRef]
- Strande, L.; Schoebitz, L.; Bischoff, F.; Ddiba, D.; Okello, F.; Englund, M.; Ward, B.J.; Niwagaba, C.B. Methods to reliably estimate faecal sludge quantities and qualities for the design of treatment technologies and management solutions. J. Environ. Manag. 2018, 223, 898–907. [Google Scholar] [CrossRef] [PubMed]
- Nevers, M.B.; Whitman, R.L. Nowcast modeling of Escherichia coli concentrations at multiple urban beaches of southern Lake Michigan. Water Res. 2005, 39, 5250–5260. [Google Scholar] [CrossRef] [PubMed]
- Nasr, M.S.; Moustafa, M.A.; Seif, H.A.; El Kobrosy, G. Application of Artificial Neural Network (ANN) for the prediction of EL-AGAMY wastewater treatment plant performance-EGYPT. Alex. Eng. J. 2012, 51, 37–43. [Google Scholar] [CrossRef]
- Aguado, D.; Ferrer, A.; Seco, A.; Ferrer, J. Comparison of different predictive models for nutrient estimation in a sequencing batch reactor for wastewater treatment. Chemom. Intell. Lab. Syst. 2006, 84, 75–81. [Google Scholar] [CrossRef]
- Khataee, A.R.; Kasiri, M.B. Modeling of biological water and wastewater treatment processes using artificial neural networks. CLEAN–Soil Air Water 2011, 39, 742–749. [Google Scholar] [CrossRef]
- Dellana, S.A.; West, D. Predictive modeling for wastewater applications: Linear and nonlinear approaches. Environ. Model. Softw. 2009, 24, 96–106. [Google Scholar] [CrossRef]
- Szeląg, B.; Barbusiński, K.; Studziński, J.; Bartkiewicz, L. Prediction of wastewater quality indicators at the inflow to the wastewater treatment plant using data mining methods. In Proceedings of the E3S Web of Conferences, Szczyrk, Poland, 25–27 October 2017; Volume 22. [Google Scholar]
- Junglen, K.; Rhodes-Dicker, L.; Ward, B.J.; Gitau, E.; Mwalugongo, W.; Stradley, L.; Thomas, E. Characterization and Prediction of Fecal Sludge Parameters and Settling Behavior in Informal Settlements in Nairobi, Kenya. Sustainability 2020, 12, 9040. [Google Scholar] [CrossRef]
- Bourgault, C. Characterization and Quantification of Faecal Sludge from Pit Latrines. Ph.D. Thesis, Laval University, Québec, QC, Canada, 2019. [Google Scholar]
- Lugali, Y.; Zziwa, A.; Banadda, N.; Wanyama, J.; Kabenge, I.; Kambugu, R.; Tumutegyereize, P. Modeling sludge accumulation rates in lined pit latrines in slum areas of Kampala City, Uganda. AJEST 2016, 10, 253–262. [Google Scholar]
- Kalulu, K.; Thole, B.; Mkandawire, T.; Kululanga, G. Predictive Modelling for Characterisation of Organics in Pit Latrine Sludge from Unplanned Settlements in Cities of Malawi. J. Ecol. Eng. 2018, 19, 141–145. [Google Scholar] [CrossRef]
- Englund, M.; Carbajal, J.P.; Ferré, A.; Bassan, M.; Vu, A.T.H.; Nguyen, V.A.; Strande, L. Modelling quantities and qualities (Q&Q) of faecal sludge in Hanoi, Vietnam and Kampala, Uganda for improved management solutions. J. Environ. Manag. 2020, 261, 110202. [Google Scholar]
- Ward, B.J.; Traber, J.; Gueye, A.; Diop, B.; Morgenroth, E.; Strande, L. Evaluation of conceptual model and predictors of faecal sludge dewatering performance in Senegal and Tanzania. Water Res. 2019, 167, 115101. [Google Scholar]
- Water Res. Commission. WRC 2173: Protocol for LaDePa Sludge Characterisation; WRC: Pretoria, South Africa, 2013. [Google Scholar]
- AOAC. Official Methods of Analysis of AOAC International, 17th ed.; AOAC International: Gaithersburg, MD, USA, 2000. [Google Scholar]
- Roussel, S.; Simonart, T.; Gireaudot, M.F. Draft Method for the Detection and Enumeration of Viable Helminth Eggs in Bio-Wastes (Untreated or Treated Sewage Sludge, Compost, Soil); Institut Pasteur de Lille: Lille, France, 2003. [Google Scholar]
- Bakare, B.F.; Foxon, K.M.; Brouckaert, C.J.; Buckley, C.A. Variation in VIP latrine sludge contents. Water SA 2012, 38, 479–486. [Google Scholar] [CrossRef]
- Chilev, C.; Pentchev, I.; Weinberger, B.; Lamari, F.D. A comparison between the different methods for the measurement of an excess adsorption of pure gases on porous adsorbents at high pressure. J. Univ. Chem. Technol. Metall. 2007, 42, 77–84. [Google Scholar]
- O’Connor, S.; O’Connor, P.F.; Feng, H.A.; Ashley, K. Gravimetric analysis of particulate matter using air samplers housing internal filtration capsules. Gefahrstoffe Reinhaltung der Luft= Air quality control/Herausgeber BIA und KRdL im VDI und DIN 2014, 74, 403. [Google Scholar]
- Tayler, K. Faecal Sludge and Septage Treatment: A Guide for Low and Middle Income Countries; Practical Action Publishing: Rugby, UK, 2018. [Google Scholar]
- Mjalli, F.S.; Al-Asheh, S.; Alfadala, H.E. Use of artificial neural network black-box modeling for the prediction of wastewater treatment plants performance. J. Environ. Manag. 2007, 83, 329–338. [Google Scholar] [CrossRef]
- Heddam, S.; Lamda, H.; Filali, S. Predicting effluent biochemical oxygen demand in a wastewater treatment plant using generalized regression neural network based approach: A comparative study. Environ. Process. 2016, 3, 153–165. [Google Scholar] [CrossRef]
- Spiess, A.N.; Neumeyer, N. An evaluation of R2 as an inadequate measure for nonlinear models in pharmacological and biochemical research: A Monte Carlo approach. BMC Pharmacol. 2010, 10, 6. [Google Scholar] [CrossRef]
- Mukaka, M.M. A guide to appropriate use of correlation coefficient in medical research. MMJ 2012, 24, 69–71. [Google Scholar]
- Vatcheva, K.P.; Lee, M.; McCormick, J.B.; Rahbar, M.H. Multicollinearity in regression analyses conducted in epidemiologic studies. Epidemiology 2016, 6, 1–20. [Google Scholar] [CrossRef]
- Bozdogan, H. Akaike’s information criterion and recent developments in information complexity. J. Math. Psychol. 2000, 44, 62–91. [Google Scholar] [CrossRef] [PubMed]
- Kalulu, K.; Thole, B.; Thengolose, A.; Chikhwenda, E. Comparison of Characteristics of Pit Latrine Sludge from Informal Settlements in Cities of Malawi. In Proceedings of the 4th International Faecal Sludge Management Conference, Chennai, India, 19–23 February 2017. [Google Scholar]
- Pedhazur, E.J.; Schmelkin, L.P. Measurement, Design, and Analysis: An Integrated Approach; Psychology Press: London, UK, 2013. [Google Scholar]
- Moustris, K.P.; Nastos, P.T.; Larissi, I.K.; Paliatsos, A.G. Application of multiple linear regression models and artificial neural networks on the surface ozone forecast in the greater Athens area, Greece. Adv. Meteorol. 2012. [Google Scholar] [CrossRef]
- Barker, L.E.; Shaw, K.M. Best (but oft-forgotten) practices: Checking assumptions concerning regression residuals. AJCN 2015, 102, 533–539. [Google Scholar] [CrossRef]
- Frost, J. Multiple Regression Analysis: Use Adjusted R-Squared and Predicted R-Squared to Include the Correct Number of Variables. Available online: https://blog.minitab.com/blog/adventures-in-statistics-2/multiple-regession-analysis-use-adjusted-r-squared-and-predicted-r-squared-to-include-the-correct-number-of-variables (accessed on 15 December 2020).
- Hair, F.J., Jr.; Sarstedt, M.; Hopkins, L.; Kuppelwieser, G.V. Partial least squares structural equation modeling (PLS-SEM): An emerging tool in business research. Eur. Bus. Rev. 2014, 26, 106–121. [Google Scholar] [CrossRef]
- Bellego, C.; Pape, L.D. Dealing with the log of zero in regression models. Série Doc. Travail 2019, 13, 1–20. [Google Scholar]
- Zavala, M.A.L.; Funamizu, N.; Takakuwa, T. Temperature effect on aerobic biodegradation of feces using sawdust as a matrix. Water Res. 2004, 38, 2406–2416. [Google Scholar] [CrossRef] [PubMed]
- Bassan, M.; Tchonda, T.; Yiougo, L.; Zoellig, H.; Mahamane, I.; Mbéguéré, M.; Strande, L. Characterization of faecal sludge during dry and rainy seasons in Ouagadougou, Burkina Faso. In Proceedings of the 36th WEDC International Conference, Nakuru, Kenya, 30 July 2013. [Google Scholar]
- Greya, W.; Thole, B.; Anderson, C.; Kamwani, F.; Spit, J.; Mamani, G. Off-Site Lime Stabilisation as an Option to Treat Pit Latrine Faecal Sludge for Emergency and Existing On-Site Sanitation Systems. J. Waste Manag. 2016, 2016, 1–8. [Google Scholar] [CrossRef][Green Version]
- Mensah, P.Y.; Kuffour, R.A.; Baidoo, P.K.; Awuah, E. The effect of different percentages of bulking agent (sawdust) on microbial quality of faecal sludge. Water Sci. Technol. 2013, 67, 1728–1733. [Google Scholar] [CrossRef] [PubMed]
- Doku, I.A. Anaerobic Treatment of Nightsoil and Toilet Sludge from on-Site Sanitation Systems in Ghana. Ph.D. Thesis, The University of Leeds, Leeds, UK, 2020. [Google Scholar]
- Jimenez, B.; Austin, A.; Cloete, E.; Phasha, C. Using Ecosan sludge for crop production. Water Sci. Technol. 2006, 54, 169–177. [Google Scholar] [CrossRef]
- Koné, D.; Cofie, O.; Zurbrügg, C.; Gallizzi, K.; Moser, D.; Drescher, S.; Strauss, M. Helminth eggs inactivation efficiency by faecal sludge dewatering and co-composting in tropical climates. Water Res. 2007, 41, 4397–4402. [Google Scholar] [CrossRef]
- Bowie, C.; Purcell, B.; Shaba, B.; Makaula, P.; Perez, M. A national survey of the prevalence of schistosomiasis and soil transmitted helminths in Malaŵi. BMC Infect. Dis. 2004, 4, 49. [Google Scholar] [CrossRef] [PubMed]
- Adu-Gyasi, D.; Asante, K.P.; Frempong, M.T.; Gyasi, D.K.; Iddrisu, L.F.; Ankrah, L.; Dosoo, D.; Adeniji, E.; Agyei, O.; Gyaase, S.; et al. Epidemiology of soil transmitted Helminth infections in the middle-belt of Ghana, Africa. Parasite Epidemiol. Control 2018, 3, e00071. [Google Scholar] [CrossRef] [PubMed]
- Gudda, F.O.; Moturi, W.N.; Omondi, S.O.; Muchiri, E.W. Analysis of physiochemical characteristics influencing disposal of pit latrine sludge in Nakuru Municipality, Kenya. AJEST 2017, 11, 139–145. [Google Scholar]
- Fanyin-Martin, A.; Tamakloe, W.; Antwi, E.; Ami, J.; Awarikabey, E.; Apatti, J.; Mensah, M.; Chandran, K. Chemical characterization of faecal sludge in the Kumasi metropolis, Ghana. Gates Open Res. 2017, 1, 12. [Google Scholar] [CrossRef]
- Changara, M.C.; Bangira, C.; Sanyika, W.T.; Misi, S.N. Characterisation of pit latrine sludge from shackleton, a peri-urban residential area of Zimbabwe. WASHDEV 2018, 8, 568–577. [Google Scholar] [CrossRef]
- Parkinson, J.; Lüthi, C.; Walther, D. Sanitation 21: A Planning Framework for Improving: City-Wide Sanitation Services; IWA: Lodon, UK, 2014. [Google Scholar]
- Kerstens, S.M.; Spiller, M.; Leusbrock, I.; Zeeman, G. A new approach to nationwide sanitation planning for developing countries: Case study of Indonesia. Sci. Total Environ. 2016, 550, 676–689. [Google Scholar] [CrossRef]
- Lalljee, B.; Facknath, S. Effect of lime on nutrient content of soils, yield and nutrient content of potato and infestation by leafminers. In Proceedings of the Fifth Annual Meeting of Agricultural Scientists, Moka, Mauritius, 3–4 May 2001. [Google Scholar]
Publisher’s Note: MDPI stays neutral with regard to jurisdictional claims in published maps and institutional affiliations. |
© 2021 by the authors. Licensee MDPI, Basel, Switzerland. This article is an open access article distributed under the terms and conditions of the Creative Commons Attribution (CC BY) license (https://creativecommons.org/licenses/by/4.0/).