Abstract
Snow plays an important role in air quality and winter geochemical monitoring in the South Ural region. This study deals with the air pollution monitoring of particle-bound metal(loid) concentrations using snow cover around the deepest coal mine in Eurasia, the Korkinsky coal mine. We studied the concentrations and ratios of suspended and dissolved forms of metal(loid)s (Al, As, Cd, Co, Cr, Cu, Fe, Mn, Ni, Pb, Sb, Sr, and Zn) in snow samples. We examined 56 snow cover samples, collected at 12 sites located north, south, east and west of the Korkinsky coal mine. All snow samples were taken in January 2020. The spectral reflectance curves, cluster analysis, and spatial distribution maps were used to evaluate the potential sources of PM-bound metal(loid)s and the potential relationship among them. The highest concentrations (μg/L) were reported for Fe, Al, and Zn. In addition to the mine influence, burning coal for residential heating was identified as the major anthropogenic metal(loid) source. It was shown that elevated concentrations of some trace metals in snow samples were associated with southerly winds and the location of spoil heaps.
1. Introduction
Russia is one of the largest producers of coal and has one of the largest coal reserves in the world [1]. The Korkinsky mine is the deepest coal mine in Eurasia (over 500 m) and second largest globally. A 3.5 km wide open pit spreads for over 3 km lengthwise. Pit development launched in 1931 and was completed in 2017. Over the 70 years that the Korkinsky coal mine operated, it produced over 250 million tons of coal and about 1.5 billion tons of waste rock [2]. There are some environmental problems resulting from the mining. Chemical reactions inside the mine are out of control; coal oxidation can lead to spontaneous combustion and such fires cannot be extinguished with water. Pollutants generated by such combustion incidents are composed of gases, particulate matter (PM), volatile organic compounds, and trace elements. These are known to be deleterious to human health [3]. The Korkinsky mine is an example of the technological impact of human activity on the environment and poses dangers for residents of the nearby settlements of Korkino and Roza. The prevailing southerly wind transfers pollutants towards Chelyabinsk, which has a population of more than 1 million people.
Airborne particulate matter with a particle diameter in the 2.5–10 µm range (PM10) and of ≤2.5 µm (PM2.5) are the most important components of coal mine fire emissions. There is much evidence of the impact on human health associated with PM exposure. PM2.5 are able to penetrate deeply within the alveoli and significantly effect human health, in particular respiratory and cardiovascular morbidity [4,5]. PM contains metal(loid)s, which may induce cell damage [6]. Recent studies of coal mine dust showed that some of the metallic elements can be concentrated in PM2.5, the most deeply inhalable and therefore potentially most bioreactive size [7].
Atmospheric processes such as dry and wet deposition of metal(loid)s play a crucial role in air cleansing. During the winter period in mid-latitudes, snowfall can effectively remove PM from the air [8]. Snow covering the ground can also block soil/dust suspension into the air, which reduces natural sources of atmospheric particulates and makes the remaining sources mostly anthropogenic [9]. Chemical analysis of snow cover presents the chemical composition of its parent aerosol, dry fallout, and surface adsorbed material. Information about atmospheric pollution can be stored in snow cover [10]. However, it was shown that PM2.5 during snowfall pose stronger mass-based cytotoxicity and genotoxicity [9].
A study of the Korkinsky mine territory in winter has not been carried out. There have been a few works devoted to the study of the heavy metals content in soils around the Korkinsky mine. Elevated soil concentrations of Cr, Zn, Ni, Mn, and Co were found [11]. Air pollution as a result of endogenous fires in the mine was studied for the summer period (June–August) [12]. Aerosol air pollution by PM10 and PM2.5 has not been investigated in summer or winter. At the same time, there is little literature data about the influence of snow cover on air purification from PM. The efficiency of air purification from particle-bound metal(loid)s is dependent on many meteorological parameters. Precipitation, wind speed, turbulence, and humidity are important factors that can change the snow cover. Understanding of the impact of the Korkinsky coal mine on air pollution and the role of snow in air purification is important for improving mining processes, for remediation activities, and to capture airborne pollution. Such an understanding can be used for developing geochemical monitoring of the urban environment in winter.
The aim of this study was to investigate particle-bound metal(loid)s in snow cover collected from the Korkinsky mine area. The study aimed to improve understanding of the metal(loid)s sources in snow cover and the possibility of using snow cover for geochemical monitoring of the mine. We tested the following hypotheses:
- (1)
- The condition of the snow cover in the zone of influence of the Korkinsky mine reflects its negative impact on the lower atmosphere in the winter. To investigate this issue, remote sensing is the one of the most effective tools for snow assessment [13].
- (2)
- Snow covers the soil and reduces natural emission of dust; the snow cover is not active chemically or biologically, therefore, the upper layer of the snow cover contains PM, and, from a chemical point of view, the composition of the snow cover reflects the metal(loid)s composition of PM.
2. Materials and Methods
2.1. Study Area and Sites Description
The South Ural region is a part of the Urals, stretching from the Ufa River to the Ural River (Figure S1). From east and west, it is bounded by the East European and West Siberian plains.
The climate in the South Ural region is continental. Winter (mid-November to March) is long, severe, and clear sunny days prevail. There are blizzards and snowstorms, especially in February (2–16 days a month). Average monthly air temperature in January is −22 °C (minimum −45 °C). Sometimes, Atlantic cyclones bring thaws with sleet, rain, and fog (1–6 foggy days per month). Snow cover appears in October. The height of the snow cover in March is 40–80 cm. Spring (April to May) is cool with frosts. It is characterized by an alternation of cloudy days with rain and sleet and clear sunny days. Snow cover melts in mid-April, in some years it lasts until early May, the spring thaw lasts more than one month. Frosts occur until the first half of July. More precipitation falls on the western (windward) slopes of the Southern Urals (550–650 mm, and in some places more) than on the eastern (leeward) slopes (400–450 mm). The wettest months are in summer, when about half of the annual rainfall falls; the winter period accounts for no more than 25% of the annual rainfall.
The Chelyabinsk coal basin is located along the eastern slope of the Urals. Coal seams were discovered in 1832. In 1934, the Korkinsky open-cut mine No. 1 was commissioned. It flourished in the 1970s and 1980s, when up to 3 million tons of coal were mined annually. Over the 70 years of its operation, the Korkinsky open-pit mine became one of the largest open-pit mines in Russia, the largest coal mine in Europe. Nowhere else is coal open-cut mined from a depth of 540 m. The bottom of the quarry is 250 m below sea level, and half a kilometer below the erosion base of this area. In November 2017, a decision was made to end coal mining at the Korkinsky open-pit mine. Its reclamation began in 2020. Over the past year, most spontaneous fires were stopped at the Korkinsky mine as a result of the implementation of measures for the recultivation of the area: deciduous trees were planted, the upper edge of the section was strengthened, and a fire extinguishing system was built. Currently, air quality is negatively affected by the quarry itself and the long ridge of spoil heaps resulting from many years of field development. In winter, houses in the nearby Korkino and Roza settlements are heated with coal and wood, only a small number of households are supplied with gas. This also influences the PM levels in the air.
The locations of sampling sites are shown in Figure 1. The sampling sites were chosen with a radial distribution around the Korkinsky mine and with linear distributions to assess the effects of prevailing winds and the influence of Korkino and Roza. The coordinates and site descriptions are presented in Table 1. A flowchart showing the methodological steps for environmental characterization and analysis of snow cover is presented in Figure 2.
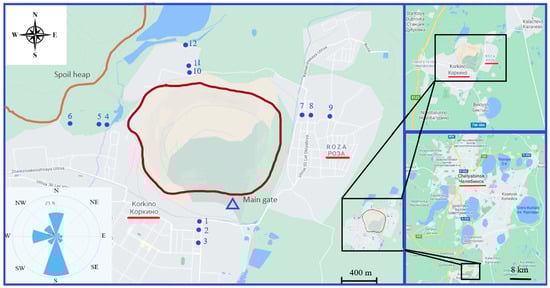
Figure 1.
Study area. (Blue points are sampling sites).

Table 1.
Location and characteristics of sampling sites.
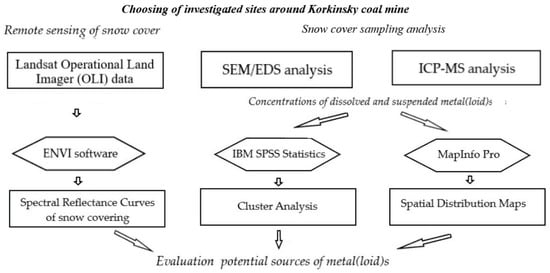
Figure 2.
Flowchart showing the methodological steps of this study.
At the time of sampling in January 2020, the Korkinsky mine was surrounded by a security fence. All snow samples were taken in safe areas, outside the fence. A total of 56 snow cover samples were collected from 12 sites. We chose sites to the north, south, east, and west of the mine (Figure 1). Snow samples were collected directly near the mine fence (Sites 1, 4, 7, 10), and at a distance of 100 and 500 m from the mine fence (Sites 2, 5, 8, 11 and 3, 6, 9, 12, respectively).
2.2. Snow Cover Studies
Samples were collected on 5 January 2020 after a snowfall. The snow cover settled at the end of November 2019. Snow depth on the date of collection of samples was 25–30 cm. In total, 56 snow samples were taken within the investigated territory (see Figure 1) at 12 sites, each consisting of 3–5 individual samples taken by plastic pipe with the cross-section area of 20 cm2 (one plastic pipe corresponded to one snow core) [14].
Snow cover samples were melted in the laboratory at 20–22 °C. Previous studies indicated that the concentrations of metal(loid)s can vary significantly between filtered and unfiltered snow samples loaded with higher concentrations of mineral dust [14,15]. Immediately after melting, filtration through cellulose acetate membrane filters with a 47 mm diameter and 0.45 μm pore size (EMD Millipore, Burlington, MA, USA) was applied to isolate filtrate with dissolved (or soluble) forms of metal(loid)s and particles on the filter with suspended (or insoluble) forms. Filters with a pore diameter of 0.45 μm are widely used to separate dissolved and suspended metals when studying the composition of snow cover [14,15,16,17]. Filters were dissolved using nitric acid and hydrogen peroxide in closed Teflon beakers at 95 °C for 16 h [18].
The samples were analyzed for metal(loid)s (Al, As, Cd, Co, Cr, Cu, Fe, Mn, Ni, Pb, Sb, Sr, and Zn) using ICP-MS (Perkin Elmer ELAN 9000). All the readings were taken three times. The detection limit for most elements in solution was 0.01 ppb. The chemical composition of the melt water and undissolved solids were equal to the concentrations of the dissolved and suspended forms of metal(loid)s in snow cover in μg/L.
We used certified reference materials GSO 10413-2014 CO of the structure (agrochemical indicators) of cespitose and podsolic srednesuglinisty soil (I BEND Rosselkhozakademiya’s VNIIA, Russia, Moscow) and GSO 7186-95 of loess soil (Bronnitsky geological and geochemical expedition “Institute of Mineralogy, Geochemistry and Crystal Chemistry of Rare Elements”, Russia, Bronnitsy). The recoveries for elements ranged from 87% to 119%. The total dissolved solids of filtrates were measured in situ by a Portable Meter (Multitest KSL-111, Semico Ltd., Novosibirsk, Russia). Filtrate pH was measured in situ by a Portable Meter (Multitest IPL-513, Semico Ltd., Novosibirsk, Russia).
The cellulose acetate membrane filters containing particulate fractions were characterized by scanning electron microscopy (SEM). SEM analyses were performed on a Jeol JSM-7001F Scanning Electron Microscopy Complex, 30 keV, EDS Oxford INCA X-max 80, WDS Oxford INCA WAVE, EBSD, and HKL. The samples were coated with carbon using a hard vacuum system for wet specimens.
2.3. Snow-Cover Spectral Signature
Remote sensing techniques such as Spectral Reflectance Curves have been effectively applied in studies of snow cover [19,20,21]. The ENVI software (version 3.2, ITT Visual Information Solutions, USA, Boulder, Colorado)) provided the spectral library, and a spectral re-sampling algorithm was used for building Spectral Reflectance Curves. The spectral curve of “normal” snow from the ENVI spectral library of the software package was chosen as the standard snow sample (anthropogenically uncontaminated snow).
2.4. Data Processing
Cluster analysis (CA) was conducted to evaluate the potential sources of metal(loid)s and the potential relationship among them. Cluster analysis was then applied to define metal groups with similar geochemical behavior, to create a dendrogram for each group [22,23,24], and to apportion them to natural vs. anthropogenic sources [24,25].
Microsoft Excel 2013 and SPSS 27.0 software was used to organize and analyze the data. The Kolmogorov–Smirnov test was used to test data normality. The concentrations were not found to follow a normal distribution. The relationship between the data was determined using Spearman’s test. MapInfo Pro 2019 was used to build the spatial distribution maps of metal(loid)s concentrations in the snow cover.
3. Results and Discussion
3.1. Optical Properties of Snow
Figure 3 presents the changes in pollution over the years. For example, the change in the spectral curves of snow were analyzed in Site 1 from 2003 to 2020. It was noted that reflection values during all observation years were lower than the reflection of a standard sample of pure snow. However, it can be seen that the pollution of the snow cover decreased from 2003 to 2020. Comparison between curves shows that reflectance increased from 0.9 to 0.13 from January 2003 to 2020; this was due to decreasing coal production. In 2020, when coal mining stopped and the recultivation of the area and the decontamination of the mine started, the state of the snow cover at the selected site became close to the background. In 2020, the Korkinsky mine had a minimal impact on the state of the snow cover.
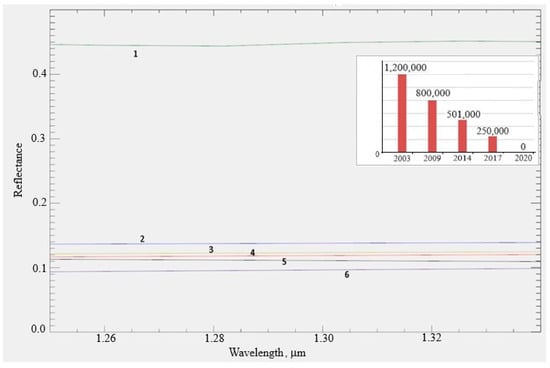
Figure 3.
Spectral reflectance curves of Site 1 of the Korkinsky mine, 1—spectrum of a standard sample of snow, 2—2020, 3—2017, 4—2014, 5—2003, 6—2009.
The spectral characteristics of snow at the sites of study in January 2020 are shown in Figure 4.
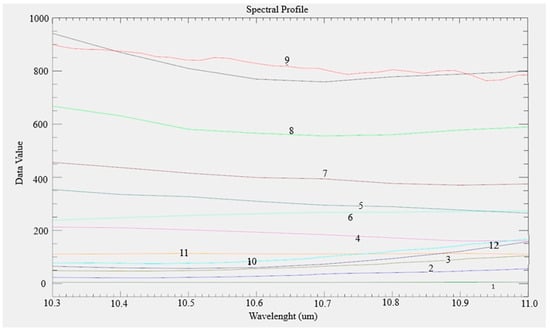
Figure 4.
Spectral reflectance curves of 12 sampling sites of the Korkinsky coal mine in 2020. The spectrum of a standard sample of snow is in black.
Figure 4 shows that the contamination of the snow cover can be arranged as Site 1 > Site 2 > Site 3 > Site10 > Site 11 > Site12 > Site 4 > Site 6 ≥ Site 5 > Site 7 > Site 8 > Site 9 = standard snow sample. The cleanest snow was at Site 9, the spectral curve practically corresponds to the spectrum of standard snow. It is well known that snow captures PM scattered in the air during snowfalls, purifying the air [26]. Snow cover gradually accumulates pollution over the winter period so its spectral characteristics vary [13]. As pollution increases, the spectral brightness coefficient of the snow cover decreases [17,18,19]. Site 9 was located to the east of the Korkinsky mine at a distance of 500 m from the mine fence. At this site, the anthropogenic influence from the mine was minimal, since easterly winds are not typical for this area. The minimum PM pollution in the snow cover was in the eastern Sites (7–9). Site 9 was located within the territory of the Roza settlement, where residents use coal for heating. However, the population of Roza has decreased in the last few years, so the influence of the settlement is minimal.
Sites 4–6 were located west of the mine. They had higher contamination levels compared with those of Sites 7–9. Since there were practically no westerly winds, we assume that pollution at those sites was not due to the mine. The first and main source of snow pollution in Sites 4–6 was the burning of coal in the Korkino settlement. Korkino is larger than Roza (the population of Korkino and Roza are 34,000 and 12,600, respectively). The second source of PM-related pollution at Sites 4–6 was the spoil heap located north-west of the mine. Northerly winds transported PM emissions here. This assumption was confirmed by SEM/EDX analysis (Figure 5). Figure 5a shows porous spherical carbonaceous ash particles with a spongy interior. Those particles are formed during the high-temperature combustion of coal, they were often found at Sites 4–6.
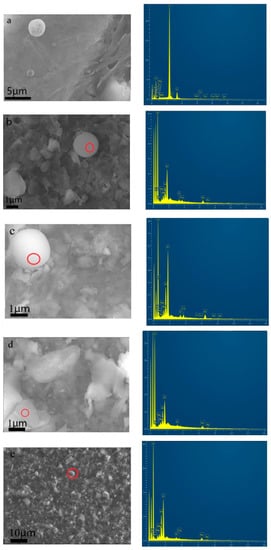
Figure 5.
SEM images of selected suspended particles of snow cover collected around the Korkinsky mine and their energy-dispersive X-ray spectra: (a–c)—ash; (d,e)—minerals.
Sites in the north (10–12) and in the south (1–3) were characterized by a greater contamination of the snow cover by PM than those located in the west and east. Site 1 was the most polluted. It was located near the main gate of the mine. Equipment and vehicles entered the Korkinsky open-cut mine from this gate for carrying out reclamation work. The results of microscopy (Figure 5) show the presence of suspended PM with spherical shape (a–c), and particles of uneven minerals with sizes from 1 to 10 microns (d,e). Particles of spherical shape were formed as a result of temperature processes, for example, combustion in the body of a spoil heap. The brown coals of the Korkinsky open-cut mine contained low levels of sulfur-containing compounds and metals, they were mainly represented by various aluminosilicates.
3.2. Chemical Analysis of Snow Cover
Background snow waters were slightly acidic (pH 5.4–6.7), with low mineralization (7.4–16 mg/L) (Table 2).
Table 2.
Physicochemical properties of snow cover.
Concentrations of dissolved and suspended metal(loid)s in snow cover from the sites are presented in Table 3 and Table 4, respectively. The results reveal that Fe (459 ± 93 μg/L), Zn (439 ± 80 μg/L), and Al (420 ± 127 μg/L) were the most abundant components of melt water (see Table 3). Concentrations of other elements in the soluble fraction decreased in the following order Mn > Sr > Cu > As > Cr > Co ≥ Pb. The contents of Cd and Ni were below the detection threshold.
Table 3.
Concentrations of dissolved metal(loid)s in snow cover, μg/L. SD: standard deviation (analytical error for reference profile), n = 56, N—not detected.
Table 4.
Concentrations of suspended metal(loid)s in snow cover, μg/L. SD: standard deviation (analytical error for reference profile), n = 56.
The standard deviation (SD) and coefficient of variance (CV) showed that dissolved metal(loid)s had low variability. Variability for Cr was the highest (0.43). This proves that natural sources of elements in melt water predominated [24,27], while the anthropogenic influence was minimal.
The undissolved solids mostly contained Fe (440 ± 401 μg/L) and Al (490 ± 153 μg/L). The contents of Cd (29 ± 20 μg/L) and Ni (56 ± 49 μg/L) were minimal.
The high CV values of most of the elements for undissolved solids reflected their heterogeneity in the environment, which indicates the existence of anthropogenic sources of suspended metal(loid)s [24,27].
3.3. Dissolved and Suspended Metal(loids) in Snow Cover
Aluminum and Fe were found in both dissolved and suspended forms, they were the predominant elements in both forms. The maximum concentrations of dissolved Al and Fe were found at Sites 1–3, south and southeast of the mine (Figure 6 and Figure 7). The source of these elements is construction equipment and vehicles at the southern gate.
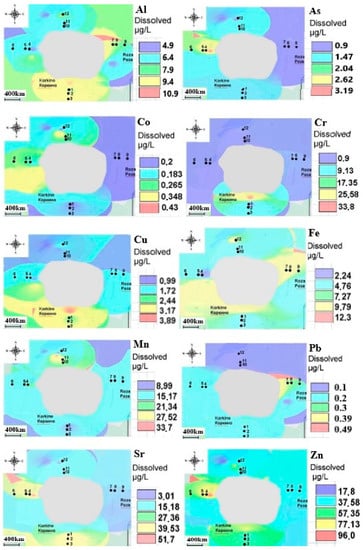
Figure 6.
Spatial distribution maps of the concentrations of dissolved forms of metal(loid)s in snow cover from all sampling sites.
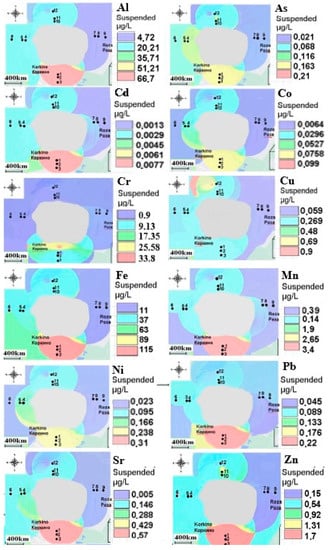
Figure 7.
Spatial distribution maps of the concentrations of suspended forms of metal(loid)s in snow cover from all sampling sites.
Mn predominated in dissolved form and was equally abundant at all sites. It is well known that Mn leaches out in an acidic environment. Suspended forms were most common at Sites 1–3, which indicated a high natural Mn content.
The total of the dissolved forms of Co was about 20%. That was in good agreement with the literature; Co is usually found in snow as an oxide and is weakly leached [28]. Nickel and Cd had the same behavior, they did not leach; therefore, there were no dissolved forms of those elements and suspended amounts were very small and mostly at Sites 1–3. The main source of Ni and Cr was the wear of parts of motor vehicles and construction equipment (excavators, etc.)
Coal combustion for heating private houses was the main source of As. A second source could be the spoil heaps (soluble metal(loid)s, Site 6) located northwest of the mine. The maximum concentration of suspended forms was at Sites 1–6, located in the zone of influence of the Korkino settlement. Strontium was most common in dissolved forms and correlated with As (Table 5). Similar to the pattern of dissolved As, Sr was abundant at Site 6, where the main source was the combustion of solid fuel used in furnace heating in Korkino (coal, firewood). The southerly wind prevailing in wintertime was an additional source of Sr at Site 6. Suspended Sr correlated with Ni and Cu, which were predominate in suspended form at Sites 1–3. The main source of the suspended forms of Sr, Ni, and Cu was construction equipment. The maximum concentrations of Zn were at Sites 1–3 (Figure 7). Zinc entered the air from vehicles with the wear of brake pads and tires. Figure 6 and Figure 7 show that dissolved Zn did not correlate with suspended Zn in all samples (Figure 8). However, the dissolved form of Zn was most prevalent, because Zn easily leaches from both acidic and alkaline environments. Dissolved forms of Zn, Cr, and Cu were most common at Site 1 near the main gate, the main pollution source here was construction equipment. There was also a lot of dissolved Zn at Site 6, where the spoil heap was located. Pb was mainly contained in the suspended form (Figure 8) and the highest concentrations were at Sites 1–3 near the southern gate through which vehicles and equipment entered the mine. The dissolved forms of Pb corresponded to the natural background levels.
Table 5.
Spearman correlation coefficients between dissolved metal(loid)s in the snow cover (n = 56).
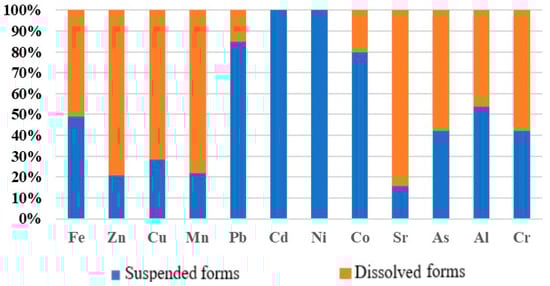
Figure 8.
Proportions of dissolved and suspended metal(loid)s in the snow cover.
Suspended forms of Pb were well correlated with insoluble Mn and Cd (Table 6), they were also highest at Sites 1–3, where the sources were transport and construction equipment (Figure 7).
Table 6.
Spearman correlation coefficients between suspended metal(loid)s in the snow cover (n = 56).
3.4. Cluster Analysis
Dendrograms indicating the results of CA by adopting the Euclidean distance and the Ward method for group aggregation [29] are presented in Figure 9 and Figure 10. The method joins a new object to the cluster whose farthest element is closer to the new object than the farthest elements of other clusters. There is a tendency to isolate a larger number of compact clusters consisting of the most similar elements. The method is applicable to objects that have different sources of origin, as in our case.
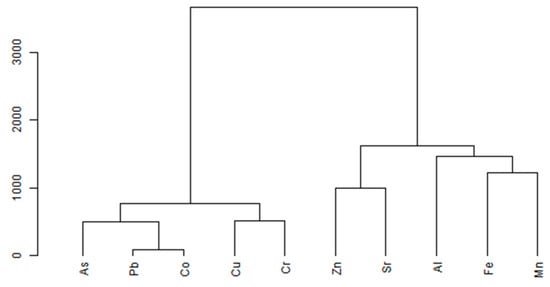
Figure 9.
Hierarchical dendrogram for dissolved metal(loid)s by adopting the Euclidean distance and the Ward method for group aggregation. The height reflects the degree of correlation between different elements.
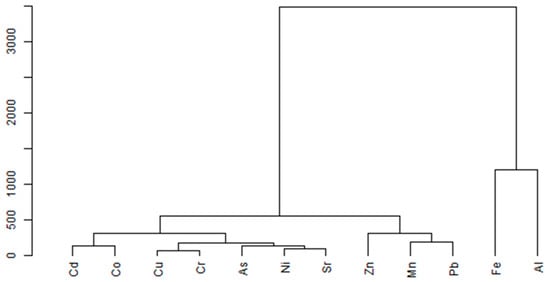
Figure 10.
Hierarchical dendrogram for suspended metal(loid)s by adopting the Euclidean distance and the Ward method for group aggregation. The height reflects the degree of correlation between different elements.
According to the results of CA, four clusters of dissolved metal(loid)s were identified: (1) As-Pb-Co; (2) Cu-Cr; (3) Zn-Sr; and (4) Al-Fe-Mn (Figure 9). The close association of metals within the clusters demonstrated that they had the same types of sources. The dissolved As, Pb, and Co formed one cluster, and joined the isolated cluster Cu and Cr. The close association of metal(loid)s suggests that they all had the same anthropogenic sources (mainly traffic emission, industrial activities, and the high-temperature combustion of coal for residential heating). Dissolved Zn and Sr were produced by transport and construction equipment. Aluminum, Fe, and Mn had the same source and were in one cluster, the dissolved forms of those elements had natural sources.
A cluster analysis of the suspended forms of metal(loid)s could distinguish various groups of anthropogenic sources, while the metal(loid)s were grouped in the following way: Cd-Co, Cu-Cr-As-Ni-Sr, Zn-Mn-Pb, and Fe-Al (Figure 10). Suspended metal(loid)s could occur in different amounts from all the above-discussed sources.
4. Conclusions
The studies carried out allowed us to identify four groups of processes that have a negative impact on the environment of the investigated area around the Korkinsky open-cut mine. The first group of processes was directly related to production activities of open pit coal mining operations. This mattered until 2017, when coal mining at the open pit was halted. Spectral reflectance curves shoed that the pollution of the snow cover around the Korkinsky mine decreased from 2003 to 2020.
The second group of processes with a negative environmental impact was associated with the emission of air pollutants during the combustion processes of coal seams and coal-containing dumps. At the moment of sampling in 2020, the Korkinsky mine had a minimal impact on the snow cover as mining had already stopped and active reclamation of the mine had begun.
The third group of hazardous processes was associated with PM emissions resulting from reclamation on machinery and equipment operation. During the study period, in January 2020, they had a great influence on the content of metalloids in the snow cover. Total metal(loid) concentrations (dissolved and suspended) were quantitatively determined in the snow cover around the Korkinsky mine during the winter season of 2020. The present study observed the dynamics in the distribution of chemical species and determined how meteorological conditions contribute to metal(loid) variation during snowfall. The results revealed that Fe (459 ± 93 μg/L), Zn (439 ± 80 μg/L), and Al (420 ± 127 μg/L) were the most abundant dissolved components, while levels of Cd and Ni were negligible. The suspended solids were mostly Fe (440 ± 401 μg/L) and Al (490 ± 153 μg/L). The levels of Cd (29 ± 20 μg/L) and Ni (56 ± 49 μg/L) were minimal. Dissolved metal(loid) occurrence in the snow cover of the territory results mainly from natural atmospheric deposition and less from anthropogenic sources. The chemical composition of the snow cover showed relatively high variability in suspended metal(loid) content during the snowy season, as a result of the combination of changes in weather conditions (wind direction) and the contribution of local/regional anthropogenic emission sources.
The fourth group of processes was formed based on the problems of solid fuel combustion in households in the settlements of Korkino and Roza. It made a significant contribution to the pollution of the snow cover with PM-born metalloids. It was shown that the contamination sources of bound metal(loid)s in snow cover were not only the Korkinsky mine but also coal combustion for residential heating. The solid residue of the snow cover from the areas remote from the Korkono and Roza settlements is mostly from natural sources (mineral dust).
We can recommend continuation of the measures for the reclamation of the Korkinsky open-cut mine to reduce the dispersion of dust and aerosols and minimize the possibility of fires. It is also necessary to recommend the transition to the use of gas fuel when providing heat to private households in the settlements close to the mine.
Supplementary Materials
The following are available online at https://www.mdpi.com/article/10.3390/su13094596/s1, Figure S1: Map of the study area.
Author Contributions
T.G.K. was responsible for supervision, funding, and project administration. T.G.K. and O.V.R. worked on the original draft and editing and performed the statistical analysis of the geochemical data. O.V.R. and O.N.Y. collected the field data and worked on the graphs. G.P.S., S.A.T. and T.A.K. gathered remote sensing data. S.V.G. performed snow cover ICP-MS studies. A.V.B. was responsible for the SEM-images and energy-dispersive X-ray spectra. All authors have read and agreed to the published version of the manuscript.
Funding
The work was supported by the Ministry of Science and Higher Education of the Russian Federation (government order FENU-2020-0022).
Institutional Review Board Statement
Not applicable.
Informed Consent Statement
Not applicable.
Data Availability Statement
No new data were created or analyzed in this study. Data sharing is not applicable to this article.
Acknowledgments
The authors express their gratitude to Polina Smirnykh and Pavel Muhin for helping with sampling of the snow cover.
Conflicts of Interest
The authors declare no conflict of interest.
References
- Wagner, N.J. Geology of Coal. Encycl. Geol. 2021, 745–761. [Google Scholar] [CrossRef]
- Tinterov, I.A. Korkinsky Coal Mine. Chelyabinsk. Encyclopedia Publ. 2000, p. 225. Available online: https://forpost-sz.ru/en/a/2019-09-03/korkinsky-coal-mine-most-ecologically-dirty-place-russia (accessed on 19 April 2021).
- Johnston, F.H. Coal mine fires and human health: What do we know? Int. J. Coal. Geol. 2015, 152, 1–14. [Google Scholar] [CrossRef]
- Xing, Y.F.; Xu, Y.H.; Shi, M.H.; Lian, Y.X. The impact of PM2.5 on the human respiratory system. J. Thorac. Dis. 2016, 8, 69–74. [Google Scholar] [CrossRef]
- Dean, E.S. The health effects of ultrafine particles. Exp. Mol. Med. 2020, 52, 311–317. [Google Scholar] [CrossRef]
- Shan, B.Y.; Shi, J. Data Mining for Source Apportionment of Trace Elements in Water and Solid Matrix. Trace Met. Environ. 2019. [Google Scholar] [CrossRef]
- Moreno, T.; Trechera, P.; Querol, X.; Lah, R.; Johnson, D.; Wrana, A.; Williamson, B. Trace element fractionation between PM10 and PM2.5 in coal mine dust: Implications for occupational respiratory health. Int. J. Coal. Geol. 2019, 203, 52–59. [Google Scholar] [CrossRef]
- Nazarenko, Y.; Fournier, S.; Rodrigo, Y.K.; Rangel-Alvarado, B.; Nepotchatykh, O.; Seers, P.; Ariya, P.A. Role of snow in the fate of gaseous and particulate exhaust pollutants from gasoline-powered vehicles. Environ. Pollut. 2017, 223, 665–675. [Google Scholar] [CrossRef] [PubMed]
- Huang, W.; Pang, Y.; Luo, X.-S.; Chen, Q.; Wu, L.; Tang, M.; Hong, Y.; Chen, J.; Jin, L. The cytotoxicity and genotoxicity of PM2.5 during a snowfall event in different functional areas of a megacity. Sci. Total Environ. 2020, 741, 140–267. [Google Scholar] [CrossRef]
- Dinu, M.; Moiseenko, T.; Baranov, D. Snowpack as Indicators of Atmospheric Pollution: The Valday Upland. Atmosphere 2020, 11, 462. [Google Scholar] [CrossRef]
- Gorbatenko, D.A.; Bykova, O.A.; Shakirov, D.R.; Gumenyuk, O.A.; Meshcheryakova, G.V.; Shakirova, S.S. The content of metal ions in the soil in the area of the korkinsky coal mine of the chelyabinsk region. Youth Sci. 2018, 7, 3–4. [Google Scholar]
- Danilov, A.S. Development of Remote Assessment Methods and Forecast of the State of Atmospheric Air on the Territories of Urban Industrial Agglomerations. Ph.D. Thesis, South Ural State University, Saint Petersburg, Russia, 2019. [Google Scholar]
- Pimentel, R.; Javier, H.; Polo, M.J. Quantifying Snow Cover Distribution in Semiarid Regions Combining Satellite and Terrestrial Imagery. Remote Sens. 2017, 9, 995. [Google Scholar] [CrossRef]
- Vlasov, D.; Vasilchuk, J.; Kosheleva, N.; Kasimov, N. Dissolved and Suspended Forms of Metals and Metalloids in Snow Cover of Megacity: Partitioning and Deposition Rates in Western Moscow. Atmosphere 2020, 11, 907. [Google Scholar] [CrossRef]
- Wang, X.; Xueying, W.P.; Zhang, X.; Ren, Y.; Huang, J. Water-soluble ions and trace elements in surface snow and their potential source regions across northeastern China. Atmospheric Environ. 2015, 114, 57–65. [Google Scholar] [CrossRef]
- Galfi, H.; Österlund, H.; Marsalek, J.; Viklander, M. Mineral and Anthropogenic Indicator Inorganics in Urban Stormwater and Snowmelt Runoff: Sources and Mobility Patterns. Water Air Soil Pollut. 2017, 263, 97–187. [Google Scholar] [CrossRef]
- Gustaytis, M.A.; Myagkaya, I.N.; Chumbaev, A.S. Hg in snow cover and snowmelt waters in high-sulfide tailing regions (Ursk tailing dump site, Kemerovo region, Russia). Chemosphere 2018, 202, 446–459. [Google Scholar] [CrossRef] [PubMed]
- Bacardit, M.; Camarero, L. Atmospherically deposited major and trace elements in the winter snowpack along a gradient of altitude in the Central Pyrenees: The seasonal record of long-range fluxes over SW Europe. Atmos. Environ. 2010, 44, 582–595. [Google Scholar] [CrossRef]
- Connette, K.J.; Connette, G.; Bernd, A.; Phyo, P.; Aung, K.H.; Tun, U.L.; Thein, Z.M.; Horning, N.; Leimgruber, P.; Songer, M. Assessment of Mining Extent and Expansion in Myanmar Based on Freely-Available Satellite Imagery. Remote Sens. 2016, 8, 912. [Google Scholar] [CrossRef]
- Maher, A.I.; Treitz, P.M.; Ferguson, M.A.D. Can Landsat data detect variations in snow cover within habitats of arctic ungulates? Wildl. Biol. 2012, 18, 75–87. [Google Scholar] [CrossRef]
- Wang, X.-Y.; Wang, J.; Jiang, Z.-Y.; Li, H.-Y.; Hao, X.-Y. An Effective Method for Snow-Cover Mapping of Dense Coniferous Forests in the Upper Heihe River Basin Using Landsat Operational Land Imager Data. Remote Sens. 2015, 7, 17246–17257. [Google Scholar] [CrossRef]
- Facchinelli, A.; Sacchi, E.; Mallen, L. Multivariate Statistical and GIS-based Approach to Identify Heavy Metal Sources in Soils. Environ. Pollut. 2001, 114, 313–337. [Google Scholar] [CrossRef]
- Christoforidis, A.; Stamatis, N. Heavy metal contamination in street dust and roadside soil along the major national road in Kavala’s region, Greece. Geoderma 2019, 15, 257–263. [Google Scholar] [CrossRef]
- Krupnova, T.G.; Rakova, O.V.; Gavrilkina, S.V.; Antoshkina, E.G.; Baranov, E.O.; Yakimova, O.N. Road dust trace elements contamination, sources, dispersed composition, and human health risk in Chelyabinsk, Russia. Chemosphere 2020, 261, 127799. [Google Scholar] [CrossRef] [PubMed]
- Ramírez, O.; Sánchez de la Campa, A.M.; Amato, F.; Moreno, T.; Silva, L.F.; de la Rosa, J.D. Physicochemical characterization and sources of the thoracic fraction of road dust in a Latin American megacity. Sci. Total Environ. 2019, 652, 434–446. [Google Scholar] [CrossRef] [PubMed]
- Shevchenko, V.P.; Vorobyev, S.N.; Krickov, I.V.; Boev, A.G.; Lim, A.G.; Novigatsky, A.N.; Starodymova, D.N.; Pokrovsky, O.S. Insoluble Particles in the Snowpack of the Ob River Basin (Western Siberia) a 2800 km Submeridional Profile settings. Atmosphere 2020, 11, 1184. [Google Scholar] [CrossRef]
- Pan, H.; Lu, X.; Lei, K. A comprehensive analysis of heavy metals in urban road dust of Xi’an, China: Contamination, source apportionment and spatial distribution. Sci. Total Environ. 2017, 609, 1361–1369. [Google Scholar] [CrossRef] [PubMed]
- Zykova, E.N.; Yakovlev, E.Y.; Druzhinin, S.V.; Bedrina, D.D.; Zykova, A.S. Comparison of the insoluble and soluble forms of heavy metals in the snow around the severodvinsk industrial district. Successes Mod. Nat. Sci. 2020, 1, 26–30. [Google Scholar]
- Gabrielli, P.; Cozzi, G.; Torcini, S.; Cescon, P.; Barbante, C. Trace elements in winter snow of the Dolomites (Italy): A statistical study of natural and anthropogenic contributions. Chemosphere 2008, 72, 1504–1509. [Google Scholar] [CrossRef]
Publisher’s Note: MDPI stays neutral with regard to jurisdictional claims in published maps and institutional affiliations. |
© 2021 by the authors. Licensee MDPI, Basel, Switzerland. This article is an open access article distributed under the terms and conditions of the Creative Commons Attribution (CC BY) license (https://creativecommons.org/licenses/by/4.0/).