Article

Recharge Sources and Genetic Model of Geothermal Water in Tangquan, Nanjing, China

1
The 1st Geological Brigade of Jiangsu Geology & Exploration Bureau, Nanjing 210041, China
2
School of Earth Sciences and Engineering, Hohai University, Nanjing 210098, China
*
Author to whom correspondence should be addressed.
Sustainability 2021, 13(8), 4449; https://doi.org/10.3390/su13084449
Submission received: 27 February 2021 / Revised: 10 April 2021 / Accepted: 12 April 2021 / Published: 16 April 2021
(This article belongs to the Section Resources and Sustainable Utilization)

Abstract

:
This paper introduces a method to study the origin of geothermal water by analysis of hydrochemistry and isotopes. In addition, the genetic mechanism of geothermal water (GTW) is revealed. The study of the origin of geothermal water is useful for the sustainability of geothermal use. As an example, Tangquan is abundant in GTW resources. Elucidating the recharge sources and formation mechanism of the GTW in this area is vitally important for its scientific development. In this study, the GTW in Tangquan was systematically investigated using hydrochemical and isotopic geochemical analysis methods. The results show the following. The GTW and shallow cold water in the study area differ significantly in their hydrochemical compositions. The geothermal reservoir has a temperature ranging from 63 to 75 °C. The GTW circulates at depths of 1.8–2.3 km. The GTW is recharged by the infiltration of meteoric water at elevations of 321–539 m and has a circulation period of approximately 2046–6474 years. The GTW becomes mixed with the shallow cold karst water at a ratio of approximately 4–26% (cold water) during the upwelling process. In terms of the cause of its formation, the geothermal system in the study area is, according to analysis, of the low-medium-temperature convective type. This geothermal system is predominantly recharged by precipitation that falls in the outcropping carbonate area within the Laoshan complex anticline and is heated by the terrestrial heat flow in the area. The geothermal reservoir is composed primarily of Upper Sinian dolomite formations, and its caprock is made up of Cambrian, Cretaceous, and Quaternary formations. Through deep circulation, the GTW migrates upward along channels formed from the convergence of northeast–east- and north–west-trending faults and is mixed with the shallow cold water, leading to geothermal anomalies in the area.

1. Introduction

Geothermal resources, consisting of heat, minerals and water, are types of green resources [1,2]. The development of geothermal has been popular all over the world. However, geothermal water extraction without scientific planning will destroy geothermal resources, which will cause a decline of the hydraulic head and the reservoir temperature [3].
One famous hot spring is located in Tangquan, Nanjing, which north of the Yangtze River. The geothermal water (GTW) is quite abundant. With a discharge rate of 4590 t per day and a maximum temperature of 47 °C, the GTW in Tangquan contains over 30 trace elements beneficial to the human body. The development of geothermal resources in Tangquan began in the 1960s. By 2010, a series of geothermal and geological surveys, detailed surveys, and explorations had been conducted in this area. These efforts yielded a relatively deep understanding of the formation conditions and geological structures in this area, determined its geothermal zone, and provided preliminary estimates of the quantity of GTW resources. However, the temperature of the geothermal reservoir (TR) and the age, recharge source, circulation process, and formation mechanism of the GTW in this area have yet to be systematically investigated. In recent years, Tangquan Township has mounted vigorous efforts to build a hot spring resort and has unremittingly expanded the application and development scope of its GTW. As a result, hot springs have ceased to overflow at some locations during the dry season. Thus, further determination of the recharge sources and formation mechanism of the GTW in this area is an essential precondition for guiding its scientific development and sustainable utilization. Geothermal system modeling is an important means for analyzing the formation mechanism of GTW resources. China’s hydrogeothermal resources can be categorized into convective geothermal resources in uplifted mountainous areas (volcanic and deep-circulation geothermal resources) and conductive geothermal resources in sedimentary basins (those in Mesozoic and Cenozoic graben basins, Mesozoic and Cenozoic depression basins, and Cenozoic depression basins), of which low-medium-temperature geothermal resources are the primary type [4]. Hydrochemical and isotopic geochemical methods are used extensively to study the recharge sources of GTW; determine whether groundwater (GW) originates from precipitation, magmatic water, or seawater [5]; calculate GTW recharge elevations; and analyze the mixing ratios of water from different types of sources [6]. These methods, combined with dating indices (e.g., 14C), can be employed to further determine the age or recharge period of GTW. Based on a mixing model, Zhang et al. estimated that the TR of the Gulu high-temperature geothermal system in Tibet ranged from 195 to 260 °C and that cold water was mixed at a ratio of 52–74% [7]. Ke et al. comprehensively studied the type of the geothermal system in the layered carbonate geothermal reservoir in an uplifted mountainous area at the Gujishan anticline in Beijing using geological and hydrochemical methods [8]. They found that the water in the geothermal reservoir originated from the karst fissure water in the dolomite of the Wumishan Formation of the Jixian System and that the geothermal reservoir was heated by the decay heat of radioactive elements from deep granitic masses. Yan et al. examined the characteristics and formation mechanism of the GTW resources in the basins in the basalt area of the Changbai Mountains based on stable D and O isotopes and geophysical survey data. They determined the heat source, the caprock, the geothermal reservoir, and the recharge source and circulation depth Z of the GTW [9]. Zhang and Yang et al. determined GTW recharge elevations and sources by comparing the linear relationships between the D and O isotopes in GTW and atmospheric precipitation [10,11].
This study examined the hydrochemical and environmental isotopic characteristics of the GTW in Tangquan and systematically analyzed the reservoir, caprock, source, and circulation conditions required for its formation to determine its formation mechanism and mode of occurrence, with the objectives of improving the understanding of the GTW system in Tangquan and providing a scientific basis for its sustainable development and utilization.

2. Materials and Methodology

2.1. Materials

The sampling campaign was implemented in April 2019; a total of 15 water samples were collected, including 6 GTW samples and 9 cold groundwater samples from civil wells. Figure 1 shows basic information about the sampling sites. All samples for hydrochemical analyses were filtered with a 0.45 μm membrane before bottling. Samples for cation analysis were acidified with ultra-purified HNO3 to adjust the sample to pH < 2. A total of 60 mL of filtered water was collected into High Density Polyethylene(HDPE) vials for anion analyses. A total of 20 mL of filtered water was collected into screw-capped HDPE vials for stable δ18O and δ2H analyses, whereas 1000 mL of unfiltered water was collected into screw-capped HDPE bottles for δ13C and δ14C analyses, 200 mL of water for 87Sr/86Sr analyses, and 1000 mL of water for δ34S analyses. K+, Na+, Ca2+, Mg2+, Cl, HCO3, SO42−, and H2SiO3 were tested at the Nanjing Supervision and Testing Center for Mineral Resources. 2H, 18O, 18O, 87Sr, 86Sr, and 14C were tested at the Ministry of Land and Resources of China and the Institute of Geographic Sciences and Natural Resources Research at the Chinese Academy of Sciences.

2.2. Methodology

Quartz geothermometers were used in this study to calculate TR. The circulation depth (Z) value of the geothermal fluid at each sampling site can be calculated based on TR using the following equation [12]:
Z = Z 0 + ( T R T 0 ) / grad T
where Z is the circulation depth (m), Z0 is the depth of the constant-temperature zone (m), TR is the temperature of the geothermal reservoir (°C), T0 is annual average the temperature of the constant-temperature zone (°C), and gradT is the geothermal gradient (°C/hm).
The following equation shows how to calculate the GW recharge elevation based on the elevation effect of the 18O isotope in precipitation [13]:
H = δ 18 O gw δ 18 O r g r a d δ 18 O + H r
where H is the GW recharge elevation (m), δ18OGTW is the isotopic composition of the sample collected at the GW sampling site, δ18Or is the isotopic composition of the sample of precipitation at the reference site, gradδ18O is the average gradient in the low-latitude southern region of China (−0.3‰/100 m) [14], and Hr is the ground elevation at the GW reference site (i.e., the Nanjing Observation Station of the GNIP) (26 m).
The mixing relationship between the GTW and the cold GW in the study area was examined using a binary mixing model based on Sr and 87Sr/86Sr, as shown below [15,16,17,18]:
( 87 Sr 86 Sr ) m × [ Sr ] m = f × ( [ 87 Sr 86 Sr ] 1 × [ Sr ] 1 ) + ( 1 f ) × ( [ 87 Sr 86 Sr ] 2 × [ Sr ] 2 )
where (87Sr/86Sr)m, (87Sr/86Sr)1, and (87Sr/86Sr)2 are the Sr isotope ratios for the mixed sample, end member 1, and end member 2, respectively; [Sr]m, [Sr]1, and [Sr]2 are the Sr contents of the mixed sample, end member 1, and end member 2, respectively; and f is the mixing ratio for end member 1.
The age of the GTW in Tangquan was determined by 14C using the following equation [19]:
t = 8267 ln ( α t α 0 )
where α 0 and α t are the initial 14C activity and the 14C activity after a time period t, respectively. However, the dissolution of carbonate minerals dilutes the initial 14C activity of the dissolved inorganic carbon (DIC) in GW, resulting in an older 14C age.

3. Results

3.1. General Information of Tangquan

Tangquan is located to the west of the main urban area of Nanjing and within the Yangtze Platform Fold Belt of the Yangtze Paraplatform. In terms of geotectonic elements, Tangquan encompasses low mountains and hills. All the hot springs and geothermal wells in Tangquan are distributed at the junction of the Laoshan Uplift and the Liuhe–Quanjiao Sag (Figure 1), where the terrain is high in the southeast and low in the northwest and faults and fissure structures have developed. The Laoshan complex anticline on the south side is distributed along the east–northeast (ENE) direction and covers an area of approximately 100 km2. In addition, the highest altitude of the Laoshan complex anticline is 442 m at its main peak, Longdongshan (also known as Dalashan), and the altitudes of the remaining areas are mostly 180–390 m. The transition zone of the plain polder area sits at altitudes of 15–40 m. Outcrops of Upper Sinian dolomite and limy dolomite are present at the core of the Laoshan complex anticline and plunge to the piedmont hillocky and plain area. With developed karst fissures and a relatively large thickness, this series of carbonate formations is the main geothermal reservoir being developed and used in the study area, which is overlain by thin-bedded Upper Cambrian dolomite, Upper Cretaceous silty and fine sandstone, and Neogene and Quaternary loose sedimentary formations.
In the study area, two main groups of faults control the Mesozoic and Cenozoic sedimentary characteristics and are closely related to the geothermal system. (1) ENE-trending Tangquan–Fanji Fault (F1). Located on the northwest side of Mount Laoshan, the Tangquan–Fanji Fault is a large normal fault that dips northwestward, cuts deep into the ground, and is composed of multiple parallel faults. (2) Northwest (NW)-trending Tangquan–Lulang Fault (F21) and East Tangquan–Jiangning Township Fault (F22). Formed in a relatively later period, this group of faults is large in size, cuts deep into the ground, and offsets earlier-formed northeast (NE)-trending faults. Figure 2 shows their planar locations [20].

3.2. Hydrochemical and İsotopic Composition

Table 1 summarizes some of the test results. The temperatures of the GTW samples ranged from 32 to 46 °C (the temperature of sample H3 was relatively low due to an insufficient water discharge time).

3.2.1. Hydrochemical Composition

The Total Dissolved Solids (TDS) of the GTW ranged from 776 to 2794 mg/L, with an average of 2070 mg/L. Hydrochemically, the GTW was primarily of the SO4-Ca type. The TDS of the cold GW was relatively low at 312–1610 mg/L, with an average value of 733 mg/L. The Piper diagram in Figure 3 shows the hydrochemistry of the GW in the study area. Hydrochemically, the cold GW was primarily of the SO4-HCO3-Ca/HCO3-SO4-Ca-Na type. Sampling site C1 was close to GTW well H1, which reaches to depths where carbonate rocks are distributed. As a result of the dissolution of carbonate rocks, hydrochemically, the sample collected from sampling site C1 was of the SO4-Ca-Mg type.
As demonstrated by the hydrochemistry represented by the Piper diagram, the cold-GW sampling C1–C9 points are scattered and distributed in areas different from those where the GTW H1–H6 are distributed. These differences in hydrochemical composition show that the GTW and shallow cold GW undergo different reactions with rocks, and that the formation of deep GTW is not closely hydraulically linked with the shallow cold GW.

3.2.2. Estimation of the Geothermal Reservoir Temperature (TR) and Depth (Z)

The concentrations of the major elements in the GTW in a geothermal reservoir depend heavily on the temperature, the variation of which significantly affects the cationic ratios and the concentration of water-soluble SiO2 in the GTW. Two main types of geothermometers are commonly used, namely cationic geothermometers (e.g., Na-K and Na-K-Ca geothermometers), which are obtained based on the relationship between the K-Ca-Na-Mg concentration ratio and the temperature [21,22,23], and SiO2 geothermometers [24], which depend on the solubility of minerals (e.g., quartz and chalcedony) that control water-soluble SiO2. All the GTW samples collected from the study area fall into the immature water area on the Na-K-Mg ternary diagram shown in Figure 4. Thus, the GTW in the study area has not reached equilibrium with feldspar silicate minerals such as Na, K, and Mg silicate materials. This finding suggests that general cationic geothermometers, such as Na-K, K-Mg and Na-K-Ca, are unsuitable for the study area.
Thus, quartz geothermometers were used in this study to calculate TR. Table 2 summarizes the calculation results. The TR values calculated using the amorphous silicon, α-cristobalite, and β-cristobalite geothermometers are lower than those measured in the field. Some of these calculated TR values are even negative and are therefore inconsistent with real-world conditions. The TR values calculated using the chalcedony geothermometer are slightly higher than those at the mouths of the wells and are consistent with real-world conditions and thus are the most reliable. TR in Tangquan, Nanjing, ranges from 63 to 75 °C, suggesting the presence of low-medium geothermal resources in normal geothermal background conditions. Well H3 was undisturbed prior to sampling in this study. The field sampling conditions precluded extraction of water for a protracted period of time. As a consequence, samples of hot water with a relatively low temperature (approximately 20 °C), which reached temperature equilibrium with the shallow water, instead of the in situ GTW, were collected. Thus, the TR values measured in the field and those calculated using the chalcedony geothermometer are relatively low.
According to the heat-flow data for the study area, gradT is 2.4 °C/hm, Z0 is 12–20 m, and the annual average temperature is 17 °C [25] Thus, the GTW in the study area circulates at depths of approximately 1.8–2.3 km. Table 3 summarizes the calculation results.

3.2.3. Characteristics of Stable D and 18O Isotopes

Fifteen isotope samples of D and 18O were collected from the GW in the study area. The test data for the D and 18O isotopes were plotted to show the δD–δ18O relationship (Figure 5). The local meteoric water line (LMWL) was produced by linear regression of the isotope data for monthly precipitation (Lu et al. 2018) provided by the Nanjing Observation Station of the Global Network for Isotopes in Precipitation (GNIP). As demonstrated in Figure 5, the δD (‰) and δ18O (‰) values for both the GTW and the cold GW fall near the global meteoric water line and the LMWL for Nanjing. This suggests that the GTW and the cold GW are primarily recharged by the infiltration of atmospheric precipitation.
The δD and δ18O values for the GTW range from –42.89‰ to –53.21‰ and from –7.11‰ to –8.40‰, respectively. The projected points are located in the lower left section in Figure 5. This result suggests that the GTW is recharged by the infiltration of atmospheric precipitation at relatively high elevations and with more depleted δD and δ18O values and is tenuously linked with the shallow cold GW.
Table 4 summarizes the calculated GW recharge elevations. The elevation calculated for the sample collected from well H3 is relatively low due to the mixing of cold GW and is unable to reflect the real-world recharge elevation. The recharge elevations calculated for the remaining samples range from 321 to 539 m, which are close to the elevation of the main body of Mount Laoshan.

3.2.4. Mixing Ratio for a Mixing Model Based on Sr and 87Sr/86Sr

GTW inevitably mixes with shallow cold GW during the upwelling process [26]. The aforementioned results reveal a certain mixing effect between the GTW sample collected from well H3 and the cold GW.
Karst GTW is insubstantially linked and highly unlikely to mix with fissure water in clastic rocks. However, it is possible that karst GTW becomes mixed with shallow cold karst water during the upwelling process. Here, the sample (87Sr/86Sr = 0.709417, Sr = 1060 μg/L) collected from sampling site C2 near the GTW is treated as a cold-water end member. In addition, the sample with the highest temperature and the highest Sr content of all the GTW samples (i.e., the sample collected from well H2) is treated as a hot-water end member. The above mixing model was used to calculate the mixing ratios for the other GTW samples. Table 5 summarizes the calculation results. The cold-water mixing ratio (87%) for the sample collected from well H3 is the highest. This result agrees with the aforementioned analysis. The cold-water mixing ratios for the other samples are relatively low (<30%).

3.2.5. Age of the GTW

Figure 6 shows the δ14C–δ13C relationship of the GTW in the study area. Overall, there is a negative correlation between δ14C and δ13C, demonstrating the dilution effect of the dissolution of carbonate minerals. In this study, the Pearson model, which takes into consideration the isotopic fractionation of CO2 and DIC in soils [27], was employed to correct the 14C age. Table 6 summarizes the calculation results. As demonstrated in Table 6, the GTW in the study area is relatively old, with an age varying from 2046 to 6474 aBP. As a result of its mixing with cold water, the age of the sample collected from well H3 is relatively young. Based on the calculated TR as well as the locations of the wells, the age of the sample collected from well H3 should be similar to that of the sample collected from well H1 [28,29].

4. Discussion

4.1. Analysis of the Heat Source

The terrestrial heat flow rate in Tangquan is approximately 58–62 mW/m2, which is close to the arithmetic mean (61.5 ± 13.9 mW/m2) of heat flow rate measurements for Mainland China [30]. The geothermal gradient in Tangquan is approximately 24 °C/km. According to the temperature measurements obtained by drilling in adjacent areas, in the study area, Z0 = 12–20 m and T0 = 17 °C.
In the following section, radioactive heat sources are discussed. Let us assume that radioactive elements are uniformly distributed in the topmost 10 km of the Earth’s crust. The upper limit A of the average heat generation rate of the Earth’s crust in the study area is 1.6 μW/m3 [31]. Thus, the upper limit of the heat generated by radioactive decay within the topmost 10 km of the Earth’s crust is as follows: △q = A△z = 16 mW/m2 [11]. The average heat generated by the decay of radioactive heat sources will be even lower. Thus, radioactive heat sources do not constitute special heat sources of the geothermal system in the study area.
In addition, there are no young magmatic intrusions within the shallow crust in the study area. Thus, there are no additional heat sources, such as magmatic heat. The contribution of the mechanical frictional heat generated by active faults and earthquakes to the terrestrial heat flow is extremely low and can be considered negligible. Thus, the geothermal system in Tangquan is of the nonvolcanic type and is heated by normal terrestrial heat flow. As a result, within the accessible depth (3 km), the conditions required for forming high-temperature geothermal resources are lacking, and the geothermal resources are low-temperature resources (<90 °C).

4.2. Geothermal Reservois and Caprock Conditions

The Sr isotope ratio of the GTW in Tangquan, Nanjing, ranges from 0.708876 to 0.709299, with an average of 0.709005. This result suggests that the GTW primarily flows through carbonate (Sr isotope ratio = 0.708–0.710) formations [32]. As the main constituent of the main body of Mount Laoshan, Upper Sinian dolomite, which is rich in carbonate minerals, outcrops in the middle of Mount Laoshan and becomes concealed in the piedmont zone at a depth that gradually increases northwestward from the piedmont zone. From the perspective of geological development, during the Late Sinian, the sedimentary dolomite of the Dengying Formation was elevated and underwent regression as a result of the Tongwan Movement and was subsequently subject to weathering and erosion. In addition, the Earth’s crust was intensely active during the Mesozoic. This series of carbonate formations underwent multiple episodes of fault activity, uplifting, erosion, and karstification during the Yanshanian period [33]. This process led to the development of karst fissures, which are favorable spaces for storing fluids.
At the northern foot of Mount Laoshan, a series of ENE-trending, NW-dipping tectonic fault zones with the downthrown side to the north have developed. In this area, sandstone sediments of the Cretaceous Chishan and Pukou Formations have been deposited, and their thickness increases northwestward. The abovementioned clastic assemblage and Quaternary loose sedimentary formations have a low permeability and a low thermal conductivity (generally 0.71–0.92 W/m°C), which is far lower than that (2.01 W/m°C) of limestone (dolomite), and can form good caprocks for geothermal reservoir aquifers [20,28].

4.3. Tectonic Control
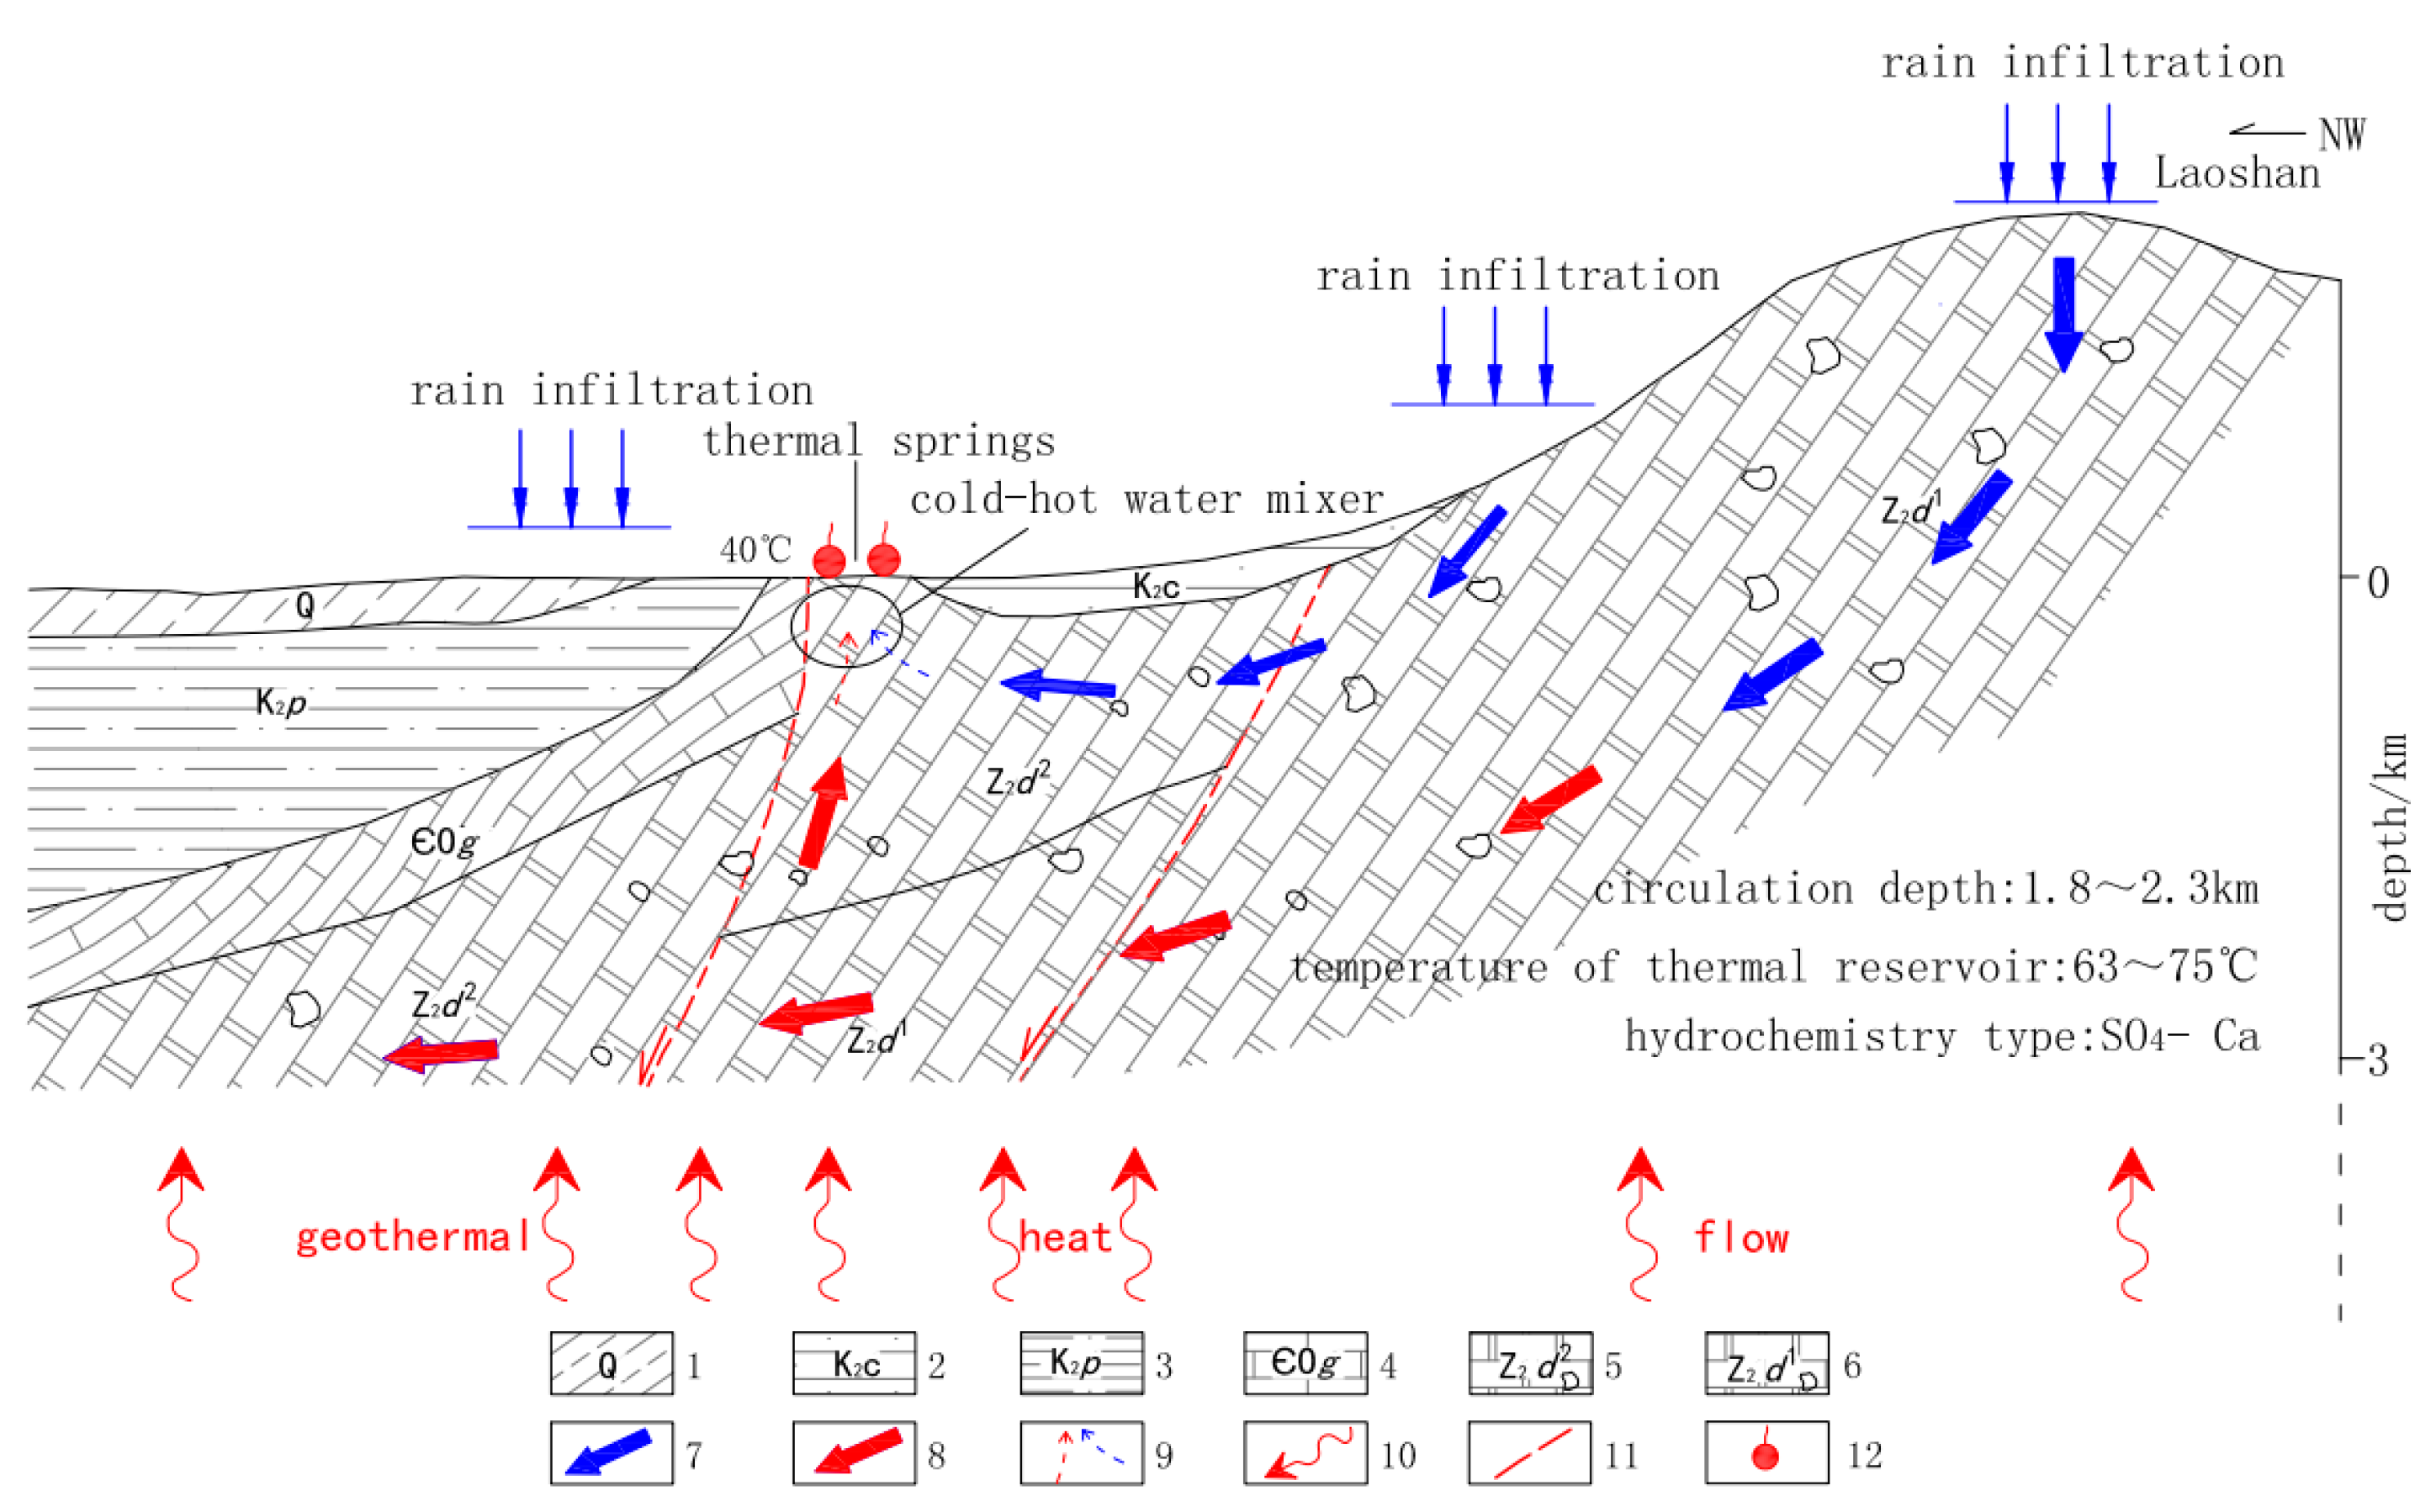
Tangquan is located on the southeastern margin of the Liuhe–Quanjiao Sag within the Mesozoic Fault Depression. The mountains south of Tangquan are a complex anticline structure composed of the Sinian formations of the Laoshan Uplift. The ENE-trending faults that control the distribution of the geothermal water wells in Tangquan are relatively large in size and are offset by later-formed NW-trending faults. These faults jointly form a tectonic framework that stores and diverts water and heat. The fracture zone is formed from the convergence and cutting of the nearly EW-trending Tangquang–Fanji Fault Zone (F1) and the NW-trending Tangquan–Lulang Fault (F21); the East Tangquan–Jiangning Township Fault (F22) is the main channel for the GTW and home to the majority of the existing geothermal water in Tangquan.
In addition, the GTW in the middle of Mount Laoshan is recharged at relatively high elevations (321–539 m), which differ relatively considerably (by approximately 40 m) from those (281–499 m) of the hot spring discharge zone in Tangquan. The resulting hydraulic pressure difference causes subsequent forced circulation of the infiltrated water.

4.4. Genetic Model

The geothermal resources currently being developed and used in Tangquan, Nanjing, are from a low-medium-temperature convective geothermal system. There are no local special heat sources in the shallow crust. Under the normal geothermal background of the area, the GW brings deep heat to the discharge zone on the north side of Mount Laoshan through deep circulation.
Atmosphere precipitation infiltrates in the outcropping carbonate area of Mount Laoshan and subsequently recharges the GW. The infiltrated water penetrates deep into the solution fissures in the Upper Sinian dolomite and tectonic fractures as it continuously absorbs heat from the rocks and gradually becomes heated. At a depth of 2.3 km, the infiltrated water reaches a temperature of approximately 75 °C, forming a deep geothermal reservoir. In addition, the infiltrated water reaches chemical equilibrium with the deep surrounding rocks during the prolonged seepage process. Eventually, GTW of the SO4-Ca type is formed. The ENE- and NW-trending tectonic faults on the north side of Mount Laoshan and their combinations form upwelling channels for the GTW. As a result of the hydraulic pressure difference, the GTW rises and becomes mixed with the shallow cold karst water in the discharge zone where the faults meet. The ENE- and NW-trending tectonic faults on the north side of Mount Laoshan and their combinations form upwelling channels for the GTW. As a result of the hydraulic pressure difference, the GTW rises and becomes mixed with the shallow cold karst water in the discharge zone where the faults meet. The mixed water forms a geothermal reservoir due to obstructions by upper low-permeability formations (e.g., Cretaceous and Quaternary formations) or rises to the surface and forms hot springs at locations where the caprock is discontinuous. Based on the above analysis, a genetic model is proposed for the geothermal system in Tangquan, Nanjing, as shown in Figure 7.

5. Conclusions

(1)
The temperature of the GTW in Tangquan, Nanjing, ranges from 32 to 46 °C. Thus, the GTW in this area is low-temperature hot water. Hydrochemically, the GTW in Tangquan is of the SO4-Ca type. TR ranges from 63 to 75 °C. The GTW circulates at depths of 1.8–2.3 km.
(2)
The GTW in the study area originates from meteoric water, has a depleted D and O isotopic composition compared to the cold GW, and is recharged at elevations of 321–539 m, close to the elevation of the main body of Mount Laoshan. During the upwelling process, the GTW becomes mixed with the shallow cold karst water at a ratio of approximately 4–26% (cold water). At a relatively low cold-water mixing ratio, the temperature of the GTW is relatively high, and vice versa. The age of the GTW in the study area is approximately 2046–6474 a.
(3)
The geothermal system in the study area is of the low-medium-temperature type. Atmospheric precipitation infiltrates in the high-elevation outcropping carbonate area of the Laoshan complex anticline and flows mainly through Upper Sinian dolomite formations. Under the background of the normal terrestrial heat flow, the infiltrated water is gradually heated by the surrounding rocks. Through long-term deep circulation, the GTW rises in the relatively low-lying area on the northwest side of Mount Laoshan, where the ENE- and NW-trending faults meet. During the upwelling process, the GTW becomes mixed with some shallow cold karst water. The mixed water forms a geothermal reservoir overlain by Cretaceous and Quaternary formations or rises to the surface at locations where the caprock is discontinuous and forms geothermal anomalies in the study area.
(4)
In order to ensure the sustainable development and utilization of GTW, it is suggested to further strengthen the dynamic monitoring of groundwater and the control of extraction amounts. A comprehensive plan for cascading development and utilization should be established—mainly for medical treatment, tourism, and bathing—and the management mode of GTW should be improved.

Author Contributions

Funding acquisition, C.X.; Data curation and investigation, D.Y.; Methodology, Z.L. All authors have read and agreed to the published version of the manuscript.

Funding

This research was funded by Jiangsu Geology and Mineral Exploration Bureau (Grant: No.dk2018KY02).

Informed Consent Statement

Not applicable.

Data Availability Statement

Not applicable.

Acknowledgments

The authors are also grateful to the two anonymous reviewers and editors whose insightful comments were very helpful in improving the quality of the manuscript.

Conflicts of Interest

The authors declare no conflict of interest.

References

  1. Montanari, D.; Minissale, A.; Doveri, M.; Gola, G.; Trumpy, E.; Santilano, A.; Manzella, A. Geothermal resources within carbonate reservoirs in western sicily (italy): A review. Earth-Sci. Rev. 2017, 169, 180–201. [Google Scholar] [CrossRef]
  2. Yang, P.; Cheng, Q.; Xie, S.; Wang, J.; Chang, L.; Yu, Q.; Zhan, Z.; Chen, F. Hydrogeochemistry and geothermometry of deep thermal water in the carbonate formation in the main urban area of Chongqing, China. J. Hydrol. 2017, 549, 50–61. [Google Scholar] [CrossRef]
  3. Duan, Z.; Pang, Z.; Wang, X. Sustainability evaluation of limestone geothermal reservoirs with extended production histories in Beijing and Tianjin, China. Geothermics 2011, 40, 125–135. [Google Scholar] [CrossRef]
  4. Zhang, C.; Guo, W.; Wang, X. Discussion on Types and Characteristics of Geothermal Resources in China. Ground Water 2018, 40, 1–5. [Google Scholar]
  5. Ahmad, M.; Akram, W.; Hussain, S.D.; Sajjad, M.I.; Zafar, M.S. Origin and subsurface history of geothermal water of Murtazabad area, Pakistan—Isotopic evidence. Appl. Radiat. Isot. 2001, 55, 731–736. [Google Scholar] [CrossRef]
  6. Minissale, A.; Donato, A.; Procesi, M.; Pizzino, L.; Giammanco, S. Systematic review of geochemical data from thermal springs, gas vents and fumaroles of Southern Italy for geothermal favourability mapping. Earth-Sci. Rev. 2019, 188, 514–535. [Google Scholar] [CrossRef]
  7. Zhang, M.; Lin, W.; Liu, Z.; Liu, Z.; Hu, X.; Wang, G. Hydrogeochemical characteristics and genetic model of Gulu high-temperature geothermal system in Tibet. China. J. Chengdu Univ. Technol. (Sci. Technol. Ed.) 2014, 41, 382–392. [Google Scholar]
  8. Ke, B.; Lin, T.; Li, W.; Yang, M.; Liu, Q.; Liu, A.; Zhao, L. Genetic model of Gujishan anticline geothermal system and prediction of potential areas in Western Hills of Beijing. Geol. Bull. China 2019, 38, 1378–1385. [Google Scholar]
  9. Yan, B.; Xiao, C.; Liang, X.; Jiang, H. Characteristics and Genetic Model of the Basin Type Geothermal Water Recourses in Basalt Area of Changbai Mountain. Geol. Rev. 2018, 64, 1201–1216. [Google Scholar]
  10. Zhang, W. Hydrogeochemical Method in Hengjing Area of South Jiangxi Province Application of geothermal water genesis analysis. Hydrogeol. Eng. Geol. 2001, 28, 45–48. [Google Scholar]
  11. Yang, F.; Pang, Z.; Wang, C. Genesis model of Laozishan geothermal field, Subei basin. J. Jilin Univ. (Earth Sci. Ed.) 2012, 42, 468–475. [Google Scholar]
  12. Pang, Z.; Wang, J.; Fan, Z. The heat storage temperature of Zhangzhou geothermal field was calculated by SiO2 hybrid model. Bull. Sci. Technol. 1990, 35, 57. [Google Scholar]
  13. Gu, W.; Pang, Z.; Wang, J.; Song, X. Isotope Hydrology; Science Press: Beijing, China, 2011; ISBN 9787030313621. [Google Scholar]
  14. Yu, J.; Yu, F.; Liu, D. Composition of hydrogen and oxygen isotopes in meteoric precipitation in eastern China. Geochimica 1987, 3, 22–26. [Google Scholar]
  15. Bakari, S.S.; Aagaard, P.; Vogt, R.D.; Ruden, F.; Johansen, I.; Vuai, S.A. Strontium isotopes as tracers for quantifying mixing of groundwater in the alluvial plain of a coastal watershed, south-eastern Tanzania. J. Geochem. Explor. 2013, 130, 1–14. [Google Scholar] [CrossRef]
  16. Faure, G. Principles of Isotope Geology, 2nd ed.; John Wiley and Sons: Chichester, UK, 1986; ISBN 0-471-86412-9. [Google Scholar]
  17. Lu, L.; Pang, Z.; Kong, Y.; Guo, Q.; Wang, Y.; Xu, C.; Gu, W.; Zhou, L.; Yu, D. Geochemical and isotopic evidence on the recharge and circulation of geothermal water in the Tangshan Geothermal System near Nanjing, China: Implications for sustainable development. Hydrogeol. J. 2018, 26, 1705–1719. [Google Scholar] [CrossRef]
  18. Négrel, P.; Petelet-Giraud, E.; Widory, D. Strontium isotope geochemistry of alluvial groundwater: A tracer for groundwater resources characterisation. Hydrol. Earth Syst. Sci. 2004, 8, 959–972. [Google Scholar] [CrossRef]
  19. Heine, F.; Einsiedl, F. Groundwater dating with dissolved organic radiocarbon: A promising approach in carbonate aquifers. Appl. Geochem. 2021, 125, 104827. [Google Scholar] [CrossRef]
  20. Li, Y.; Wang, J. Incised-valley sedimentary succession and evolution of the nanjing section of the yangtze river since the LGM. J. Coastal Res. 2020, 104, 785–794. [Google Scholar] [CrossRef]
  21. Fournier, R.O.; Truesdell, A.H. An empirical Na-K-Ca geothermometer for natural waters. Geochim. Cosmochim. Acta 1973, 37, 1255–1275. [Google Scholar] [CrossRef]
  22. Giggenbach, W.F. Geothermal solute equilibria. derivation of Na-K-Mg-Ca geoindicators. Geochim. Cosmochim. Acta 1988, 52, 2749–2765. [Google Scholar] [CrossRef]
  23. Giggenbach, W.F.; Gonfiantini, R.; Jangi, B.L.; Truesdell, A.H. Isotopic and chemical composition of Parbati valley geothermal discharges, north-west Himalaya, India. Geothermics 1983, 12, 199–222. [Google Scholar] [CrossRef]
  24. Fournier, R.O. Chemical geothermometers and mixing models for geothermal systems. Geothermics 1977, 5, 41–50. [Google Scholar] [CrossRef]
  25. Zhao, J.; Xu, J.; Wang, G. Geotemperature Field Feature and Distribution Law of Geothermal Anomaly and Their Control Conditions. Jiangsu Geol. 1997, 21, 21–35. [Google Scholar]
  26. Guo, Q.; Pang, Z.; Wang, Y.; Tian, J. Fluid geochemistry and geothermometry applications of the Kangding high-temperature geothermal system in eastern Himalayas. Appl. Geochem. 2017, 81, 63–75. [Google Scholar] [CrossRef]
  27. Clark, I.; Fritz, P. Environmental Isotopes in Hydrogeology; CRC: Boca Raton, FL, USA, 1997; ISBN 1-56670-249-6. [Google Scholar]
  28. Li, Z.; Luo, Z.; Wang, Q.; Du, J.; Lu, W.; Ning, D. A three-dimensional fluid-solid model, coupling high-rise building load and groundwater abstraction, for prediction of regional land subsidence. Hydrogeol. J. 2019, 27, 1515–1526. [Google Scholar] [CrossRef]
  29. Liu, X.; Cai, G.; Congress, S.S.C.; Liu, L.; Liu, S. Investigation of Thermal Conductivity and Prediction Model of Mucky Silty Clay. J. Mater. Civ. Eng. 2020, 32, 4020221. [Google Scholar] [CrossRef]
  30. Jiang, G.; Gao, P.; Rao, S.; Zhang, L.; Tang, X.; Huang, F.; Zhao, P.; Pang, Z.; He, L.; Hu, S.; et al. Compilation of Heat Flow Data in the Continental Area of China (4th edition). Chin. J. Geophys. 2016, 59, 2892–2910. [Google Scholar]
  31. Wang, Y.; Wang, J.Y.; Deng, J.F. Heat flow constraint on the abundance of uranium, thorium and potassium in crust and lithosphere of the continental area of China. Prog. Geophys. 2001, 16, 21–30. [Google Scholar]
  32. Huang, S.J.; Liu, S.G.; Li, G.R. Strontium isotope composition of marine carbonate and the influence of diagenetic fluid on it in Ordovician. J. Chengdu Univ. Technol. 2004, 31, 1–7. [Google Scholar]
  33. Zhou, H.; Li, W.; Zhang, B.; Liu, J.; Jiang, H. Formation and evolution of upper sinian to lower cambrian intraplatformal basin in sichuan basin. Shiyou Xuebao Acta Pet. Sin. 2015, 36, 310–332. [Google Scholar]
Figure 1. Schematic diagram of tectonic structures and sampling sites in the study area (1: Overturned anticline; 2: Anticline; 3: Measured (inferred) normal fault; 4: Measured (inferred) reverse fault; 5: Measured (inferred) fault of undetermined nature; 6: Geothermal water (GTW) sampling sites and ID; 7: Cold groundwater (GW) sampling sites and ID).
Sustainability 13 04449 g001
Figure 2. Geological scheme of the study area (Z2d—Sinian Dengying Formation; Z1h—Sinian Huangxu Formation; Є3O1g—Cambrian Guanyintain Formation; K2c—Cretaceous Chishan Formation; K2p—Cretaceous Pukou Formation; Q—Quaternary).
Sustainability 13 04449 g002
Figure 3. Piper diagram of the hydrochemistry of different bodies of water in Tangquan.
Sustainability 13 04449 g003
Figure 4. Giggenbach Na-K-Mg ternary diagram of the GTW.
Sustainability 13 04449 g004
Figure 5. δD–δ18O relationship for the water samples collected from Tangquan.
Sustainability 13 04449 g005
Figure 6. δ14C–δ13C relationship of the GTW.
Sustainability 13 04449 g006
Figure 7. Schematic diagram of the proposed genetic model for the geothermal system in Tangquan, Nanjing (1: Quaternary clay; 2: Sandstone of the Cretaceous Chishan Formation; 3: Argillaceous sandstone of the Cretaceous Pukou Formation; 4: Thin-bedded dolomite of the Cambrian Guanyintain Formation; 5: Karstified dolomite of the upper segment of the Sinian Dengying Formation; 6: Karstified dolomite of the lower segment of the Sinian Dengying Formation; 7: Migration of cold water; 8: Migration of hot water; 9: Mixing of hot and cold water; 10: Terrestrial heat flow; 11: Inferred fault; 12: Hot spring).
Sustainability 13 04449 g007
Table 1. Hydrochemical and isotopic test data.
Sample IDDepthWellhead Temp
°C
pHElectricTDSK+Na+Ca2+Mg2+ClHCO3SO42−H2SiO3δDδ18O
mμs/cmmg/Lmg/L/‰
H1>20037.07.0423202794.006.7712.4682.0102.05.55301178955.1−54.9−8.83
H2>20046.06.8923502420.006.9612.2566.0108.06.93299152360.2−56.2−8.71
H3>20022.08.30979776.003.6011.8174.033.920.813444420.3−49.9−8.00
H4>20032.47.0219701954.004.9212.0464.084.46.93332117848.0−54.3−8.62
H5>20035.57.1220301959.005.3113.2457.088.410.4332118046.8−54.2−8.74
H6>25041.46.9622502513.006.3812.6541.098.96.93314148954.5−55.8−9.27
C112.0015.87.6817521610.004.7921.7368.071.241.634390432.6−46.6−7.85
C210.0015.28.30875647.000.8117.4138.035.024.327023032.0−46.8−7.98
C310.0014.87.83820524.0061.8050.566.521.354.133975.530.0−43.9−7.58
C410.0016.27.98721468.000.6498.952.810.869.325749.927.0−46.0−7.16
C510.0014.67.30498312.001.6321.758.622.141.615762.931.9−44.2−7.69
C63.0016.57.651012694.002.9363.612632.770.738913935.3−44.4−7.47
C715.0016.58.52835532.002.0567.392.819.454.129911523.7−42.9−7.11
C86.0016.28.58798478.004.1046.684.523.061.021396.436.2−45.0−7.14
C910.0015.68.006791335.313.3966.457.220.561.016369.842.4−44.1−7.30
Table 2. TR values calculated using SiO2 geothermometer/°C.
Sample IDWellhead TempAmorphous Silicaα-Cristobaliteβ-CristobaliteChalcedony
Fournier, 1977
H137.0−1550370
H246.0−1254775
H322.0−4910−3327
H432.4−2044−264
H535.5−2143−363
H641.4−1650370
Table 3. Z values for the GTW/m.
Sample IDDepth/m
H12117
H22292
H3417
H41854
H51807
H62096
Table 4. Calculated GTW recharge elevations in Tangquan/m.
Sample IDδ18O/‰δ2H/‰Recharge Elevation/m
H1−8.83 −54.9 392
H2−8.71 −56.2 354
H3−8.00 −49.9 116
H4−8.62 −54.3 321
H5−8.74 −54.2 362
H6−9.27 −55.8 539
Table 5. Calculated mixing ratios for the GTW samples collected from Tangquan.
Sample ID87Sr/86SrSr
/(μg·L−1)
Thermal Water FractionCold Water Faction
H10.708876489096%4%
H20.7090415060100%0%
H30.709299158013%87%
H40.708916410076%24%
H50.708901402074%26%
H60.708997474092%8%
Table 6. Corrected 14C ages of the GTW/aBP.
Sample ID13C
/‰ VPDB
14C
/pMC
UncorrectedPearson Model
No. 2
H1−3.811.0618,2036474
H2−2.03820,8803709
H3−2.9935.498564Modern water
H4−5.0925.1511,4112046
H5−5.6924.2811,7023417
H6−4.4313.1116,7976206
Publisher’s Note: MDPI stays neutral with regard to jurisdictional claims in published maps and institutional affiliations.

