
Parametric Study on Residential Passive House Building in Different Chinese Climate Zones


Abstract
1. Introduction
2. Methodology
2.1. Simulation Models
2.1.1. Climate and Locations
2.1.2. Software and Building Models
2.1.3. Design Parameter
2.2. Research Methods
2.2.1. Sensitivity Analysis
2.2.2. Multiple Regression Analysis
2.3. Simulation Verification of PHPP
3. Results and Discussion
3.1. Energy Consumption Analysis
3.2. Sensitivity Analysis
3.2.1. General Parameter Analysis
3.2.2. Parameter Analysis for Different Climates
3.2.3. Parameter Analysis for Different Building Types
3.3. Meta-Model Analysis
3.3.1. Determine the Value of Key Parameters
3.3.2. Analyze Key Parameter Value
3.3.3. Chinese PH Design Zoning
4. Conclusions
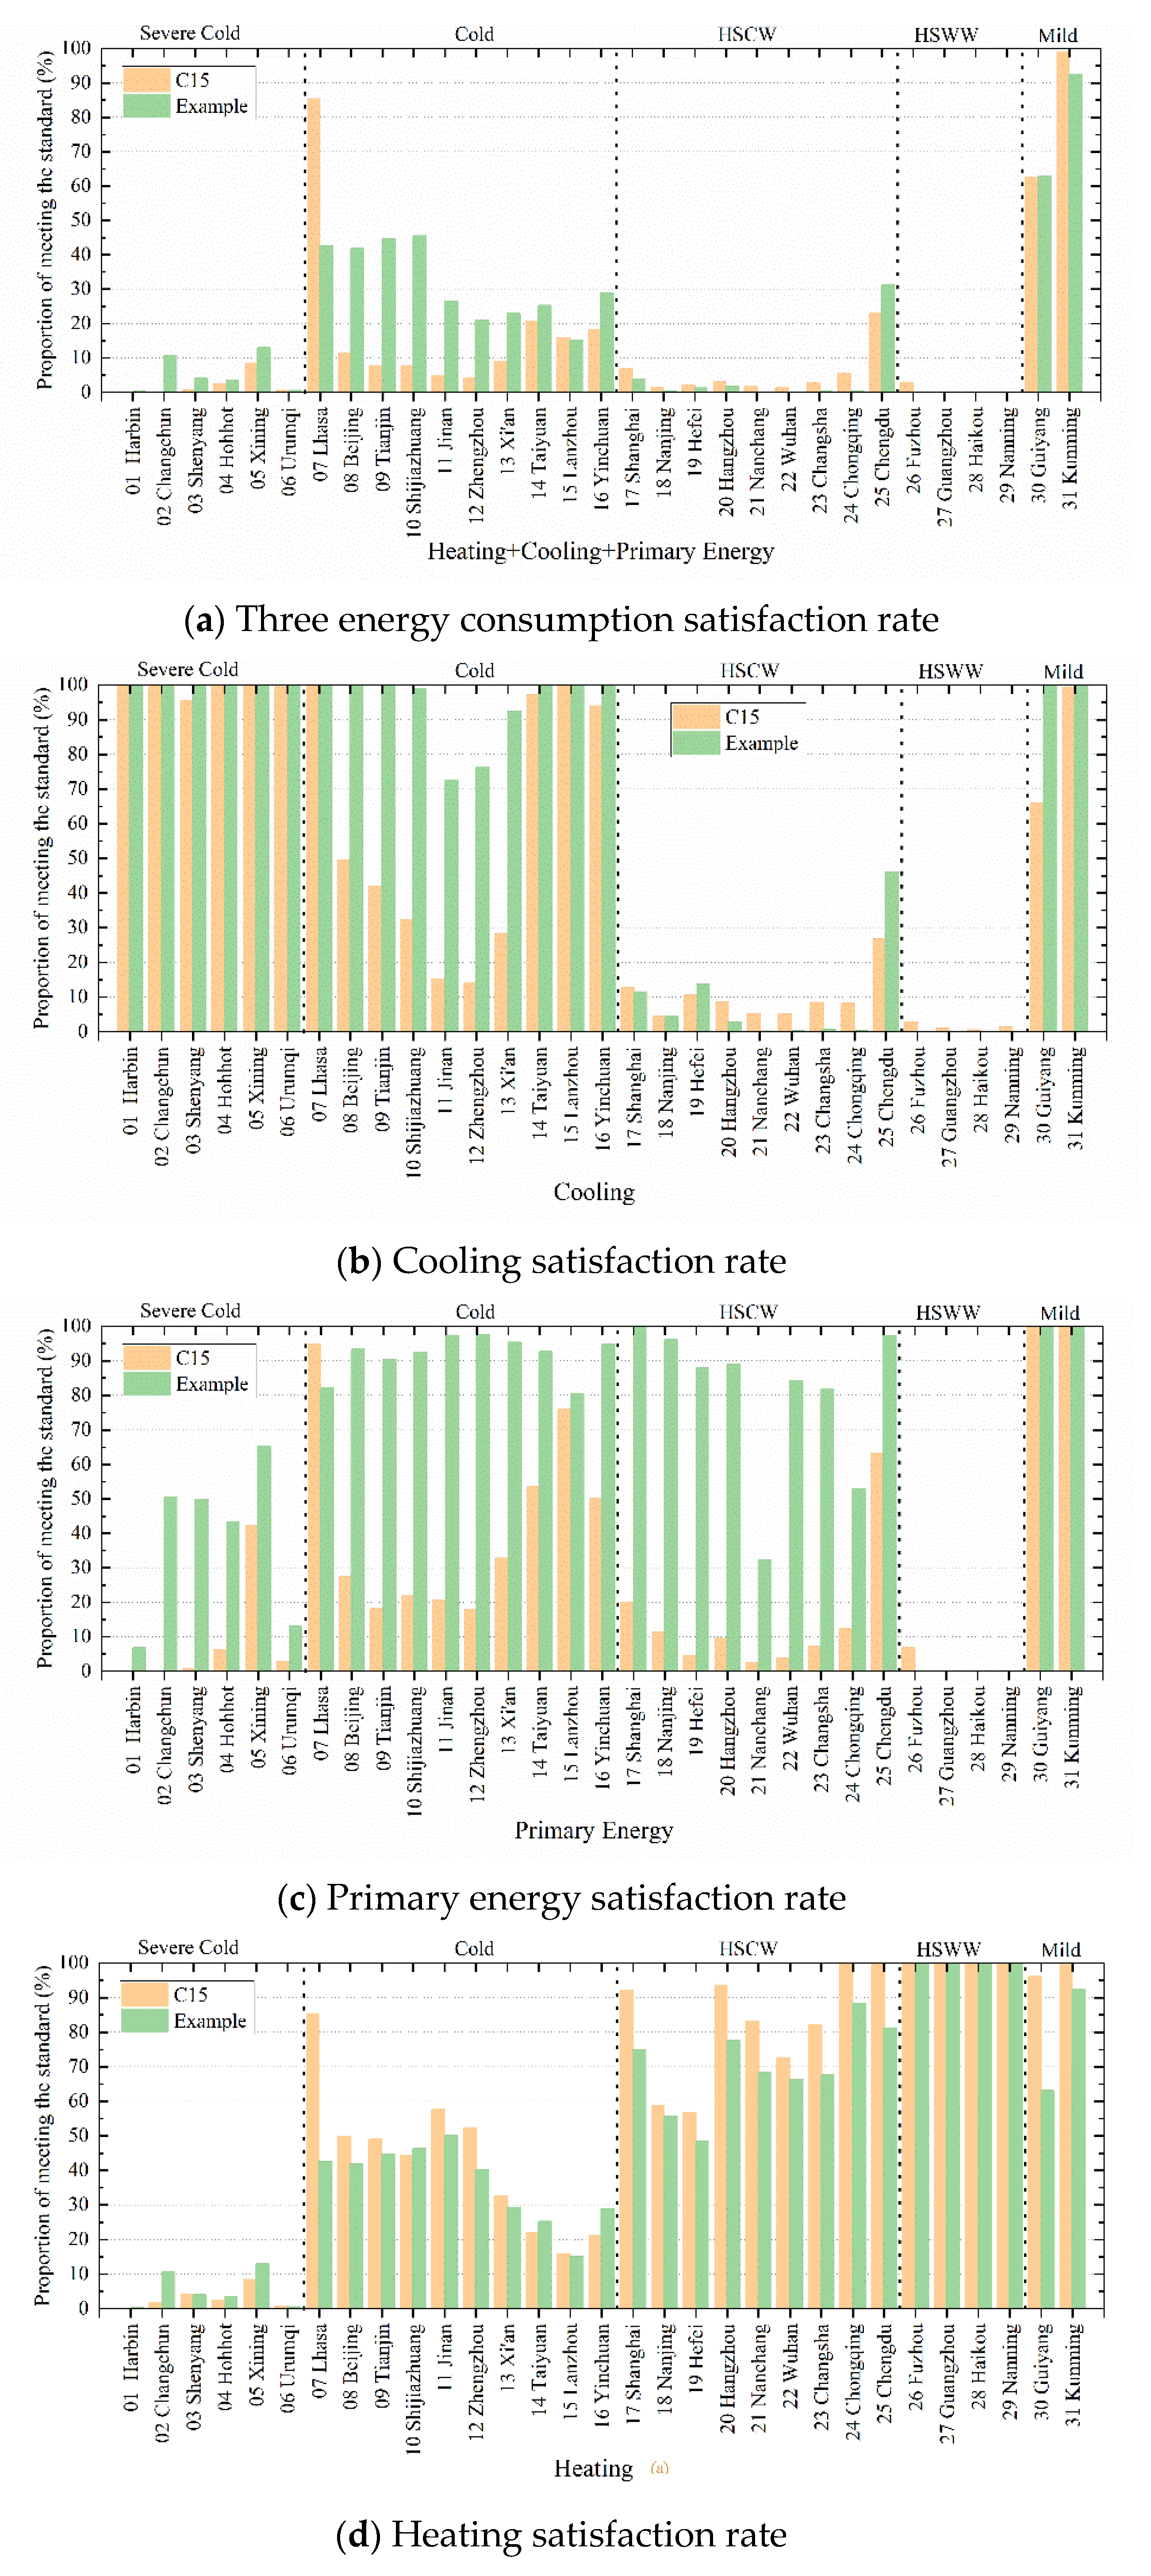
- As the energy consumption is greatly affected by climate conditions, the satisfaction rates of energy consumption index vary with climate regions. SC, C areas are easy to meet the cooling energy requirements; HSWW, followed by HSCW areas are relatively easy to meet the heating energy requirements. Building energy consumption in M areas are low and easy to meet PHS. Except for the M, it is difficult to achieve PHs in all climatic regions in China.
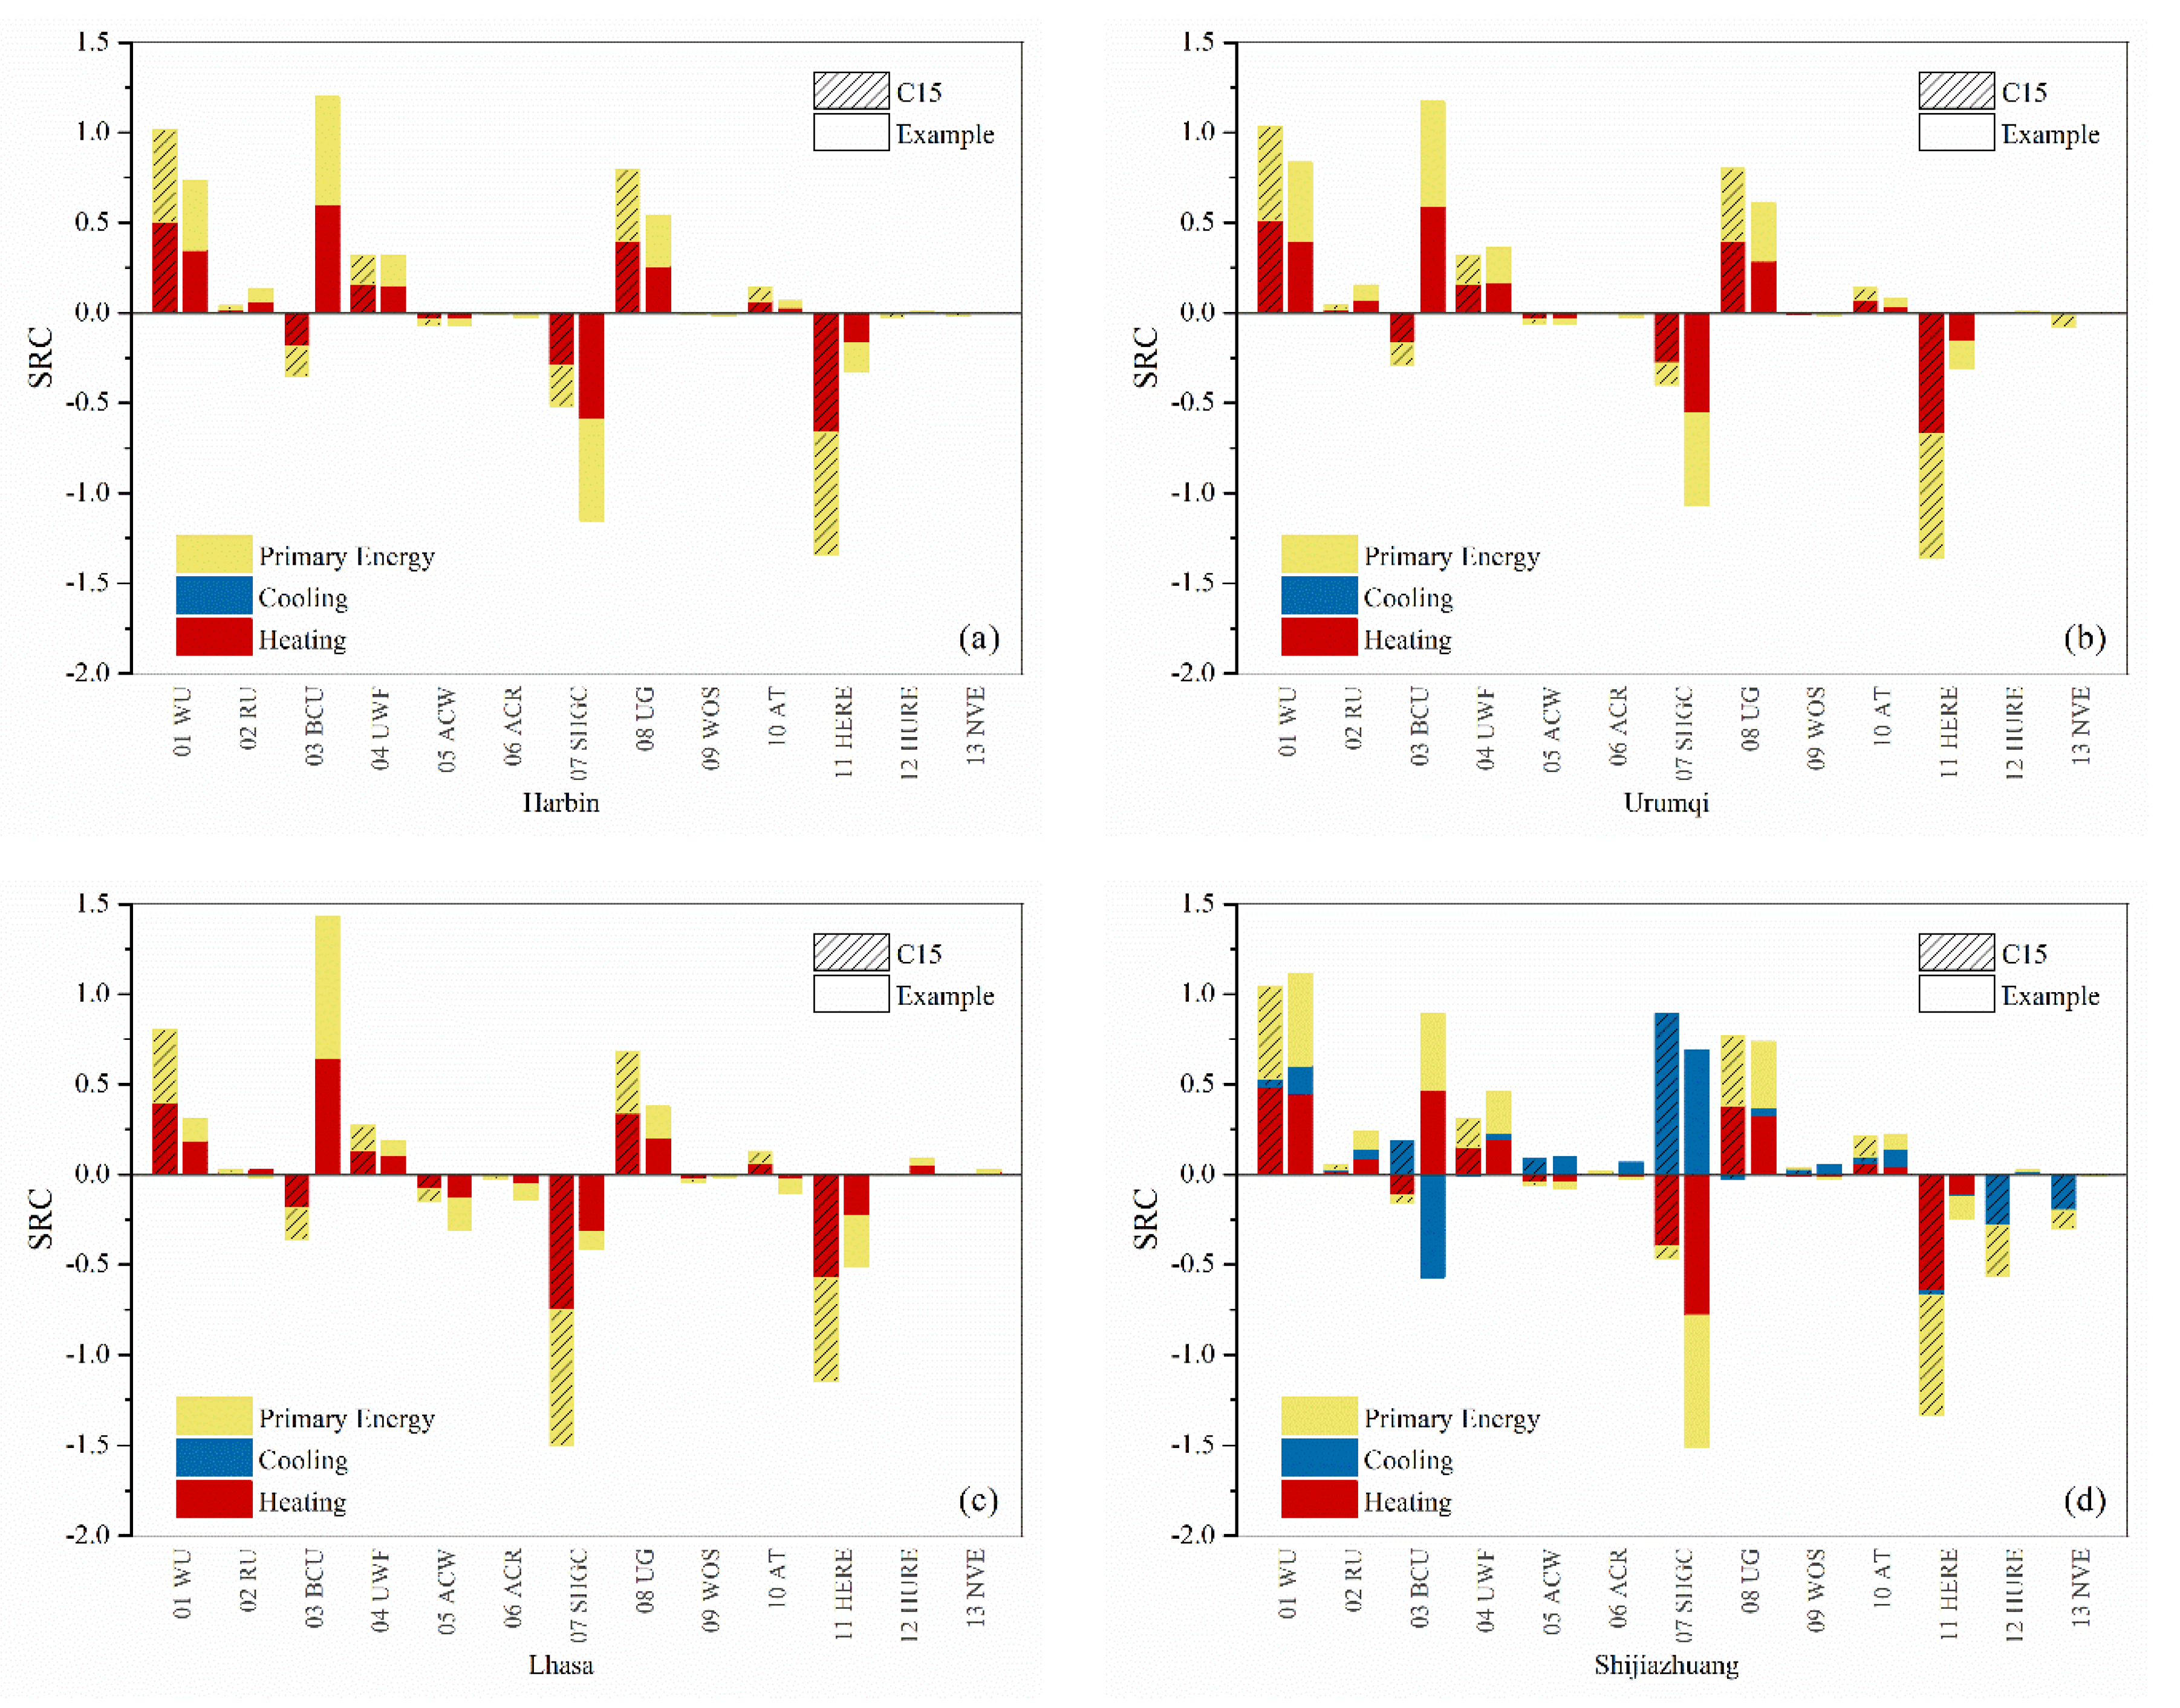
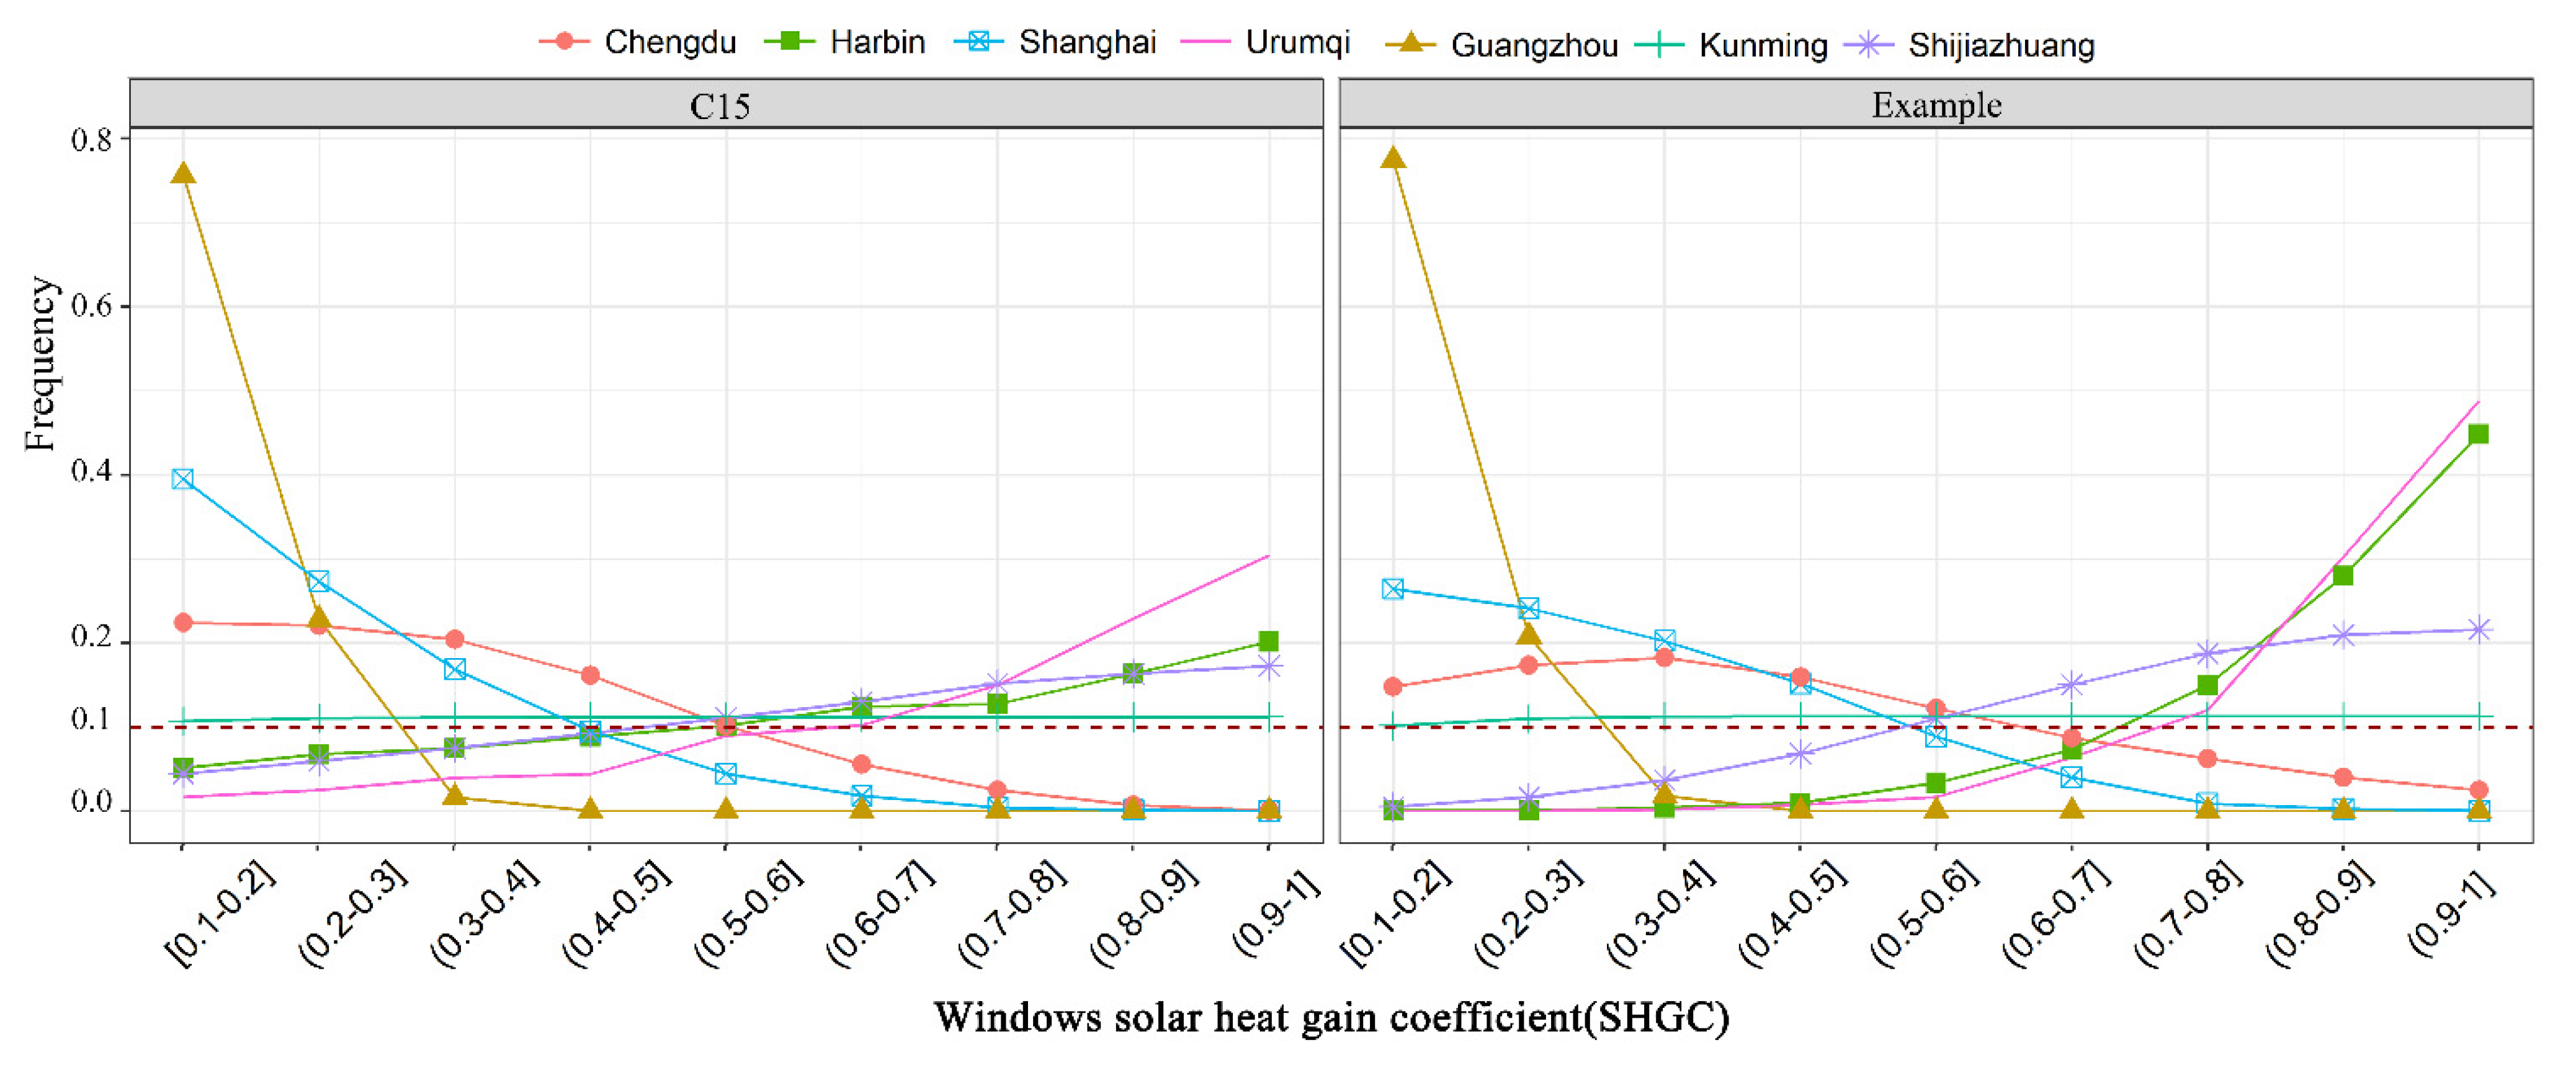
- The sensitivity of the key design parameters in different climate regions are different. SHCG is the most effect parameter for all climatic zones, followed by WU, BCU, UG, and HERE for heating zones. Furthermore, HURE is the key parameter in areas with high humidity. BCU has the largest difference in sensitivity to different types of buildings, followed by SHCG, especially in HSCW areas. Among the 13 design parameters, ACW and ACR have the least influence.
- The proposed residential PH design zoning is not consistent with traditional Chinese climate region. According to the difference of sensitive parameters, Chengdu with its surrounding areas and Urumqi with its surroundings are divided into two climate zones. Because HERE of Chengdu and its surrounding areas (0.45 ~ 0.95) is much higher than that of other areas in hot summer and cold winter areas (0 ~ 0.4), the optimized passive design can significantly reduce the annual heating load of Urumqi and its surrounding areas, and even replace the air conditioning system of Urumqi with high solar radiation. After optimizing the parameters, the number of buildings meeting the PHS based on the proposed design zoning has increased dramatically. Seven zones are proposed with optimized values for key design parameters. Therefore, the design zoning of PH in China is put forward, which can guide the design of PH as well as enhance the application of PH in China.
- The important challenge of this work is to propose residential PH design zoning. Architects can directly determine the appropriate passive design measures within the scope of zoning without simulation calculation. In addition, these results can be used as a reference for further optimization research, which can guide the design of PH as well as enhance the application of PH in China.
Author Contributions
Funding
Institutional Review Board Statement
Informed Consent Statement
Data Availability Statement
Acknowledgments
Conflicts of Interest
Appendix A

| City | Building Type | WU W/(m2 K) | BCU W/(m2 K) | SHGC | UG W/(m2 K) | HERE | HURE |
|---|---|---|---|---|---|---|---|
| Harbin | Example | 0.1–0.22 | 0.18–0.74 | 0.7–1.0 | 0.1–0.7 | 0.5–0.95 | - |
| C15 | 0.1–0.2 | 1.22–2.0 | 0.6–1.0 | 0.1–0.6 | 0.7–0.95 | - | |
| Changchun | Example | 0.1–0.24 | 0.18–0.98 | 0.7–1.0 | 0.1–0.7 | 0.5–0.95 | - |
| C15 | 0.1–0.2 | 1.22–2.0 | 0.7–1.0 | 0.1–0.7 | 0.65–0.95 | - | |
| Shenyang | Example | 0.1–0.22 | 0.18–0.74 | 0.7–1.0 | 0.1–0.7 | 0.6–0.95 | - |
| C15 | 0.1–0.2 | 1.22–2.0 | 0.6–1.0 | 0.1–0.6 | 0.7–0.95 | - | |
| Hohhot | Example | 0.1–0.2 | 0.18–0.82 | 0.7–1.0 | 0.1–0.7 | 0.6–0.95 | - |
| C15 | 0.1–0.2 | 1.14–2.0 | 0.6–1.0 | 0.1–0.6 | 0.7–0.95 | - | |
| Xining | Example | 0.1–0.24 | 0.18–0.9 | 0.7–1.0 | 0.1–0.7 | 0.5–0.95 | - |
| C15 | 0.1–0.2 | 1.14–2.0 | 0.6–1.0 | 0.1–0.7 | 0.65–0.95 | - | |
| Urumqi | Example | 0.1–0.18 | 0.18–0.66 | 0.7–1.0 | 0.1–0.6 | 0.55–0.95 | - |
| C15 | 0.1–0.18 | 1.38–2.0 | 0.7–1.0 | 0.1–0.5 | 0.75–0.95 | - | |
| Lhasa | Example | 0.1–0.4 | 0.18–2.0 | 0.5–1.0 | 0.1–1.0 | 0.0–0.95 | - |
| C15 | 0.1–0.4 | 0.18–2.0 | 0.4–1.0 | 0.1–1.0 | 0.0–0.95 | - | |
| Beijing | Example | 0.1–0.4 | 0.18–2.0 | 0.4–1.0 | 0.1–1.0 | 0.0–0.95 | - |
| C15 | 0.1–0.24 | 0.18–2.0 | 0.1–0.6 | 0.1–0.8 | 0.55–0.95 | - | |
| Tianjin | Example | 0.1–0.26 | 0.18–2.0 | 0.5–1.0 | 0.1–0.8 | 0.0–0.95 | - |
| C15 | 0.1–0.22 | 0.18–2.0 | 0.1–0.5 | 0.1–0.7 | 0.5–0.95 | - | |
| Shijiazhuang | Example | 0.1–0.24 | 0.18–1.14 | 0.6–1.0 | 0.1–0.8 | 0.0–0.95 | - |
| C15 | 0.1–0.24 | 0.18–2.0 | 0.6–1.0 | 0.1–0.8 | 0.5–0.95 | - | |
| Jinan | Example | 0.1–0.24 | 0.18–2.0 | 0.4–1.0 | 0.1–0.8 | 0.0–0.95 | - |
| C15 | 0.1–0.22 | 0.98–2.0 | 0.1–0.7 | 0.1–0.7 | 0.55–0.95 | - | |
| Zhengzhou | Example | 0.1–0.24 | 0.18–0.98 | 0.6–1.0 | 0.1–0.8 | 0.0–0.95 | - |
| C15 | 0.1–0.24 | 0.18–2.0 | 0.6–1.0 | 0.1–0.8 | 0.55–0.95 | - | |
| Xi’an | Example | 0.1–0.24 | 0.18–1.22 | 0.6–1.0 | 0.1–0.7 | 0.0–0.95 | - |
| C15 | 0.1–0.22 | 1.06–2.0 | 0.1–0.6 | 0.1–0.8 | 0.55–0.95 | - | |
| Taiyuan | Example | 0.1–0.24 | 0.18–0.98 | 0.7–1.0 | 0.1–0.8 | 0.0–0.95 | - |
| C15 | 0.1–0.22 | 0.18–2.0 | 0.6–0.7 | 0.1–0.7 | 0.55–0.95 | - | |
| Lanzhou | Example | 0.1–0.22 | 0.18–0.9 | 0.7–1.0 | 0.1–0.7 | 0.0–0.95 | - |
| C15 | 0.1–0.22 | 0.18–2.0 | 0.6–1.0 | 0.1–0.7 | 0.6–0.95 | - | |
| Yinchuan | Example | 0.1–0.26 | 0.18–0.98 | 0.6–1.0 | 0.1–0.8 | 0.0–0.95 | - |
| C15 | 0.1–0.22 | 0.18–2.0 | 0.6–1.0 | 0.1–0.7 | 0.6–0.95 | - | |
| Shanghai | Example | 0.1–0.22 | 1.06–2.0 | 0.1–0.5 | 0.1–0.8 | 0.0–0.5 | 0.45–0.9 |
| C15 | 0.1–0.24 | 1.14–2.0 | 0.1–0.4 | 0.1–0.8 | 0.0–0.95 | 0.5–0.9 | |
| Nanjing | Example | 0.1–0.18 | 0.9–2.0 | 0.1–0.5 | 0.1–0.6 | 0.35–0.95 | 0.5–0.9 |
| C15 | 0.1–0.22 | 1.3–2.0 | 0.1–0.4 | 0.1–0.7 | 0.6–0.95 | 0.55–0.9 | |
| Hefei | Example | 0.1–0.2 | 0.18–2.0 | 0.1–0.6 | 0.1–0.7 | 0.0–0.95 | 0.5–0.9 |
| C15 | 0.1–0.2 | 0.22–2.0 | 0.1–0.4 | 0.1–0.7 | 0.6–0.95 | 0.6–0.9 | |
| Hangzhou | Example | 0.1–0.2 | 1.22–2.0 | 0.1–0.3 | 0.1–0.7 | 0.0–0.4 | 0.5–0.9 |
| C15 | 0.1–0.2 | 1.3–2.0 | 0.1–0.3 | 0.1–0.7 | 0.55–0.95 | 0.65–0.9 | |
| Nanchang | Example | 0.1–0.2 | 1.3–2.0 | 0.1–0.4 | 0.1–0.6 | 0.0–0.35 | 0.65–0.9 |
| C15 | 0.1–0.18 | 1.62–2.0 | 0.1–0.3 | 0.1–0.5 | 0.3–0.95 | 0.75–0.9 | |
| Wuhan | Example | 0.1–0.2 | 1.3–2.0 | 0.1–0.4 | 0.1–0.6 | 0.0–0.35 | 0.6–0.9 |
| C15 | 0.1–0.16 | 1.46–2.0 | 0.1–0.3 | 0.1–0.7 | 0.0–0.7 | 0.5–0.9 | |
| Changsha | Example | 0.1–0.2 | 1.22–2.0 | 0.1–0.4 | 0.1–0.7 | 0.0–0.4 | 0.5–0.9 |
| C15 | 0.1–0.2 | 1.46–2.0 | 0.1–0.3 | 0.1–0.7 | 0.35–0.55 | 0.7–0.9 | |
| Chongqing | Example | 0.1–0.24 | 1.3–2.0 | 0.1–0.3 | 0.1–0.9 | 0.0–0.35 | 0.6–0.9 |
| C15 | 0.1–0.22 | 1.3–2.0 | 0.1–0.3 | 0.1–0.7 | 0.0–0.95 | 0.65–0.9 | |
| Chengdu | Example | 0.1–0.26 | 0.18–2.0 | 0.1–0.6 | 0.1–0.8 | 0.0–0.95 | 0.5–0.9 |
| C15 | 0.1–0.26 | 1.14–2.0 | 0.1–0.5 | 0.1–1.0 | 0.0–0.95 | 0.65–0.9 | |
| Fuzhou | Example | 0.1–0.22 | 1.14–2.0 | 0.1–0.3 | 0.1–1.0 | - | 0.65–0.9 |
| C15 | 0.1–0.4 | 0.18–2.0 | 0.1–0.3 | 0.1–1.0 | - | 0.6–0.9 | |
| Guangzhou | Example | 0.1–0.2 | 0.18–2.0 | 0.1–0.3 | 0.1–0.8 | - | 0.45–0.9 |
| C15 | 0.1–0.2 | 0.18–2.0 | 0.1–0.3 | 0.1–0.8 | - | 0.55–0.9 | |
| Haikou | Example | 0.1–0.22 | 0.18–1.06 | 0.1–0.3 | 0.1–0.7 | - | 0.7–0.9 |
| C15 | 0.1–0.28 | 0.18–2.0 | 0.1–0.3 | 0.1–1.0 | - | 0.65–0.9 | |
| Nanning | Example | 0.1–0.24 | 0.18–2.0 | 0.1–0.4 | 0.1–0.7 | - | 0.75–0.9 |
| C15 | 0.1–0.24 | 0.18–2.0 | 0.1–0.3 | 0.1–0.8 | - | 0.7–0.9 | |
| Guiyang | Example | 0.1–0.24 | 0.18–1.06 | 0.6–1.0 | 0.1–0.8 | - | - |
| C15 | 0.1–0.26 | 0.18–2.0 | 0.1–0.7 | 0.1–1.0 | - | - | |
| Kunming | Example | 0.1–0.4 | 0.18–2.0 | 0.1–1.0 | 0.1–1.0 | - | - |
| C15 | 0.1–0.4 | 0.18–2.0 | 0.1–1.0 | 0.1–1.0 | - | - |
Appendix B
| City | Building Type | WU W/(m2 K) | BCU W/(m2 K) | SHGC | UG W/(m2 K) | HERE | HURE |
|---|---|---|---|---|---|---|---|
| Harbin | Example | 0.1 | 0.18 | 1.0 | 0.1 | 0.95 | - |
| C15 | 0.1 | 2.0 | 1.0 | 0.1 | 0.95 | - | |
| Changchun | Example | 0.1 | 0.18 | 1.0 | 0.1 | 0.95 | - |
| C15 | 0.1 | 2.0 | 1.0 | 0.1 | 0.95 | - | |
| Shenyang | Example | 0.1 | 0.18 | 1.0 | 0.1 | 0.95 | - |
| C15 | 0.1 | 2.0 | 1.0 | 0.1 | 0.95 | - | |
| Hohhot | Example | 0.1 | 0.18 | 1.0 | 0.1 | 0.95 | - |
| C15 | 0.1 | 2.0 | 1.0 | 0.1 | 0.95 | - | |
| Xining | Example | 0.1 | 0.18 | 1.0 | 0.1 | 0.95 | - |
| C15 | 0.1 | 2.0 | 1.0 | 0.1 | 0.95 | - | |
| Urumqi | Example | 0.1 | 0.18 | 1.0 | 0.1 | 0.95 | - |
| C15 | 0.1 | 2.0 | 1.0 | 0.1 | 0.95 | - | |
| Lhasa | Example | 0.4 | 0.18 | 0.6 | 1.0 | 0.0 | - |
| C15 | 0.4 | 2.0 | 0.6 | 1.0 | 0.0 | - | |
| Beijing | Example | 0.4 | 0.18 | 0.6 | 1.0 | 0.8 | - |
| C15 | 0.1 | 2.0 | 0.35 | 0.1 | 0.8 | - | |
| Tianjin | Example | 0.1 | 0.18 | 0.7 | 0.1 | 0.8 | - |
| C15 | 0.14 | 2.0 | 0.1 | 0.1 | 0.8 | - | |
| Shijiazhuang | Example | 0.1 | 0.18 | 0.8 | 0.1 | 0.8 | - |
| C15 | 0.1 | 2.0 | 1.0 | 0.1 | 0.8 | - | |
| Jinan | Example | 0.1 | 0.18 | 0.5 | 0.1 | 0.8 | - |
| C15 | 0.1 | 2.0 | 0.1 | 0.1 | 0.8 | - | |
| Zhengzhou | Example | 0.1 | 0.18 | 0.8 | 0.1 | 0.8 | - |
| C15 | 0.1 | 2.0 | 1.0 | 0.1 | 0.8 | - | |
| Xi’an | Example | 0.1 | 0.18 | 0.8 | 0.1 | 0.8 | - |
| C15 | 0.1 | 2.0 | 0.45 | 0.1 | 0.8 | - | |
| Taiyuan | Example | 0.1 | 0.18 | 1.0 | 0.1 | 0.8 | - |
| C15 | 0.1 | 2.0 | 1.0 | 0.1 | 0.8 | - | |
| Lanzhou | Example | 0.1 | 0.18 | 1.0 | 0.1 | 0.8 | - |
| C15 | 0.1 | 2.0 | 1.0 | 0.1 | 0.8 | - | |
| Yinchuan | Example | 0.1 | 0.18 | 0.8 | 0.1 | 0.8 | - |
| C15 | 0.1 | 2.0 | 1.0 | 0.1 | 0.8 | - | |
| Shanghai | Example | 0.1 | 2.0 | 0.1 | 0.1 | 0.0 | 0.9 |
| C15 | 0.1 | 2.0 | 0.1 | 0.1 | 0.0 | 0.9 | |
| Nanjing | Example | 0.1 | 2.0 | 0.1 | 0.1 | 0.8 | 0.9 |
| C15 | 0.1 | 2.0 | 0.1 | 0.1 | 0.8 | 0.9 | |
| Hefei | Example | 0.1 | 2.0 | 0.3 | 0.1 | 0.0 | 0.9 |
| C15 | 0.1 | 2.0 | 0.1 | 0.1 | 0.8 | 0.9 | |
| Hangzhou | Example | 0.1 | 2.0 | 0.1 | 0.4 | 0.0 | 0.9 |
| C15 | 0.1 | 2.0 | 0.1 | 0.1 | 0.8 | 0.9 | |
| Nanchang | Example | 0.1 | 2.0 | 0.1 | 0.1 | 0.0 | 0.9 |
| C15 | 0.1 | 2.0 | 0.1 | 0.1 | 0.8 | 0.9 | |
| Wuhan | Example | 0.1 | 2.0 | 0.1 | 0.1 | 0.0 | 0.9 |
| C15 | 0.1 | 2.0 | 0.1 | 0.1 | 0.0 | 0.9 | |
| Changsha | Example | 0.1 | 2.0 | 0.1 | 0.1 | 0.0 | 0.9 |
| C15 | 0.1 | 2.0 | 0.1 | 0.1 | 0.4 | 0.9 | |
| Chongqing | Example | 0.1 | 2.0 | 0.1 | 0.5 | 0.0 | 0.9 |
| C15 | 0.1 | 2.0 | 0.1 | 0.1 | 0.0 | 0.9 | |
| Chengdu | Example | 0.12 | 2.0 | 0.35 | 0.3 | 0.0 | 0.9 |
| C15 | 0.1 | 2.0 | 0.3 | 1.0 | 0.0 | 0.9 | |
| Fuzhou | Example | 0.14 | 2.0 | 0.1 | 1.0 | - | 0.9 |
| C15 | 0.4 | 2.0 | 0.1 | 1.0 | - | 0.9 | |
| Guangzhou | Example | 0.14 | 2.0 | 0.1 | 0.5 | - | 0.9 |
| C15 | 0.1 | 2.0 | 0.1 | 0.35 | - | 0.9 | |
| Haikou | Example | 0.14 | 0.1 | 0.1 | 0.7 | - | 0.9 |
| C15 | 0.14 | 2.0 | 0.1 | 1.0 | - | 0.9 | |
| Nanning | Example | 0.14 | 2.0 | 0.1 | 0.1 | - | 0.9 |
| C15 | 0.1 | 2.0 | 0.1 | 0.1 | - | 0.9 | |
| Guiyang | Example | 0.4 | 0.1 | 1.0 | 0.1 | - | - |
| C15 | 0.1 | 2.0 | 0.45 | 1.0 | - | - | |
| Kunming | Example | 0.4 | 2.0 | 1.0 | 1.0 | - | - |
| C15 | 0.4 | 2.0 | 1.0 | 1.0 | - | - |
References
- Liu, D.; Zhao, F.-Y.; Tang, G.-F. Active low-grade energy recovery potential for building energy conservation. Renew. Sustain. Energy Rev. 2010, 14, 2736–2747. [Google Scholar] [CrossRef]
- Anderson, J.E.; Wulfhorst, G.; Lang, W. Energy analysis of the built environment—A review and outlook. Renew. Sustain. Energy Rev. 2015, 44, 149–158. [Google Scholar] [CrossRef]
- Yi, J. China Building Energy Saving Annual Development Research Report 2017; China Construction Industry Press: Beijing, China, 2017. [Google Scholar]
- Pérez-Lombard, L.; Ortiz, J.; Pout, C. A review on buildings energy consumption information. Energy Build. 2008, 40, 394–398. [Google Scholar] [CrossRef]
- Ministry of Housing and Urban-Rural Development. Technical Standards for Nearly Zero Energy Buildings; Ministry of Housing and Urban-Rural Development: Beijing, China, 2019.
- Dalbem, R.; da Cunha, E.G.; Vicente, R.; Figueiredo, A.; Oliveira, R.; da Silva, A.C.S.B. Optimisation of a social housing for south of Brazil: From basic performance standard to passive house concept. Energy 2019, 167, 1278–1296. [Google Scholar] [CrossRef]
- Mead, K.; Brylewsky, R. Passivhaus primer: Introduction. In An Aid to Understanding the Key Principles of the Passivhaus Standard; BRE: Darmstadt, Germany, 2015. [Google Scholar]
- Feist, W. The World’s First Passive House, Darmstadt-Kranichstein, Germany. Passipedia 2015. [Google Scholar] [CrossRef]
- Passive House Institute Certified Passive House. Certification Criteria for Residential Passive House Buildings; Passive House Institute: Christchurch, New Zealand, 2013. [Google Scholar]
- Wei, X. Research on China’s passive ultra low energy building technology system. Constr. Technol. 2015, 23, 15–16. [Google Scholar]
- Dan, D.; Tanasa, C.; Stoian, V.; Brata, S.; Stoian, D.; Gyorgy, T.N.; Florut, S. Passive house design—An efficient solution for residential buildings in Romania. Energy Sustain. Dev. 2016, 32, 99–109. [Google Scholar] [CrossRef]
- Mahdavi, A.; Doppelbauer, E.-M. A performance comparison of passive and low-energy buildings. Energy Build. 2010, 42, 1314–1319. [Google Scholar] [CrossRef]
- Dahlstrøm, O.; Sørnes, K.; Eriksen, S.T.; Hertwich, E.G. Life cycle assessment of a single-family residence built to either conventional- or passive house standard. Energy Build. 2012, 54, 470–479. [Google Scholar] [CrossRef]
- Liang, X.; Wang, Y.; Zhang, Y.; Jiang, J.; Chen, H.; Zhang, X.; Guo, H.; Roskilly, T. Analysis and Optimization on Energy Performance of a Rural House in Northe;rn China Using Passive Retrofitting. Energy Procedia 2017, 105, 3023–3030. [Google Scholar] [CrossRef]
- Sierra-Pérez, J.; Rodríguez-Soria, B.; Boschmonart-Rives, J.; Gabarrell, X. Integrated life cycle assessment and thermodynamic simulation of a public building’s envelope renovation: Conventional vs. Passivhaus proposal. Appl. Energy 2018, 212, 1510–1521. [Google Scholar] [CrossRef]
- Tanasa, C.; Dan, D.; Becchio, C.; Corgnati, S.P.; Stoian, V. Cost-optimal and indoor environmental quality assessment for resi-dential buildings towards EU long-term climate targets. Energy Sustain. Dev. 2020, 59, 49–61. [Google Scholar] [CrossRef]
- Mirela, M.; Vladimir, T.; Cristian, D.; Adrian, B.; Ruxandra, V. Passive house analysis in terms of energy performance. Energy Build. 2017, 144, 74–86. [Google Scholar] [CrossRef]
- Wang, Y.; Du, J.; Kuckelkorn, J.M.; Kirschbaum, A.; Gu, X.; Li, D. Identifying the feasibility of establishing a passive house school in central Europe: An energy performance and carbon emissions monitoring study in Germany. Renew. Sustain. Energy Rev. 2019, 113, 109256. [Google Scholar] [CrossRef]
- Ridley, I.; Clarke, A.R.; Bere, J.; Altamirano, H.; Lewis, S.; Durdev, M.; Farr, A.G. The monitored performance of the first new London dwelling certified to the Passive House standard. Energy Build. 2013, 63, 67–78. [Google Scholar] [CrossRef]
- Leardini, P.; Manfredini, M.; Callau, M. Energy upgrade to Passive House standard for historic public housing in New Zea-land. Energy Build. 2015, 95, 211–218. [Google Scholar] [CrossRef]
- Schnieders, J.; Feist, W.; Rongen, L. Passive Houses for different climate zones. Energy Build. 2015, 105, 71–87. [Google Scholar] [CrossRef]
- Badescu, V.; Rotar, N. Implementation of the German Passivhaus Concept in Southeast Europe: Considerations for Romania. J. Energy Eng. 2012, 138, 146–162. [Google Scholar] [CrossRef]
- Badescu, V.; Rotar, N.; Udrea, I. Considerations concerning the feasibility of the German Passivhaus concept in Southern Hemisphere. Energy Effic. 2015, 8, 919–949. [Google Scholar] [CrossRef]
- Obrecht, T.P.; Premrov, M.; Leskovar, V. Žegarac Influence of the orientation on the optimal glazing size for passive houses in different European climates (for non-cardinal directions). Sol. Energy 2019, 189, 15–25. [Google Scholar] [CrossRef]
- Fokaides, P.A.; Christoforou, E.; Ilic, M.; Papadopoulos, A. Performance of a Passive House under subtropical climatic conditions. Energy Build. 2016, 133, 14–31. [Google Scholar] [CrossRef]
- Badescu, V.; Laaser, N.; Crutescu, R. Warm season cooling requirements for passive buildings in Southeastern Europe (Romania). Energy 2010, 35, 3284–3300. [Google Scholar] [CrossRef]
- Figueiredo, A.; Kämpf, J.; Vicente, R. Passive house optimization for Portugal: Overheating evaluation and energy perfor-mance. Energy Build. 2016, 118, 181–196. [Google Scholar] [CrossRef]
- Chen, S.; Levine, M.D.; Li, H.; Yowargana, P.; Xie, L. Measured air tightness performance of residential buildings in North China and its influence on district space heating energy use. Energy Build. 2012, 51, 157–164. [Google Scholar] [CrossRef]
- Ferrante, A.; Cascella, M. Zero energy balance and zero on-site CO2 emission housing development in the Mediterranean climate. Energy Build. 2011, 43, 2002–2010. [Google Scholar] [CrossRef]
- Tommerup, H.; Rose, J.; Svendsen, S. Energy-efficient houses built according to the energy performance requirements introduced in Denmark in 2006. Energy Build. 2007, 39, 1123–1130. [Google Scholar] [CrossRef]
- Georges, L.; Skreiberg, Ø.; Novakovic, V. On the proper integration of wood stoves in passive houses under cold climates. Energy Build. 2014, 72, 87–95. [Google Scholar] [CrossRef]
- Parker, D.S. Very low energy homes in the United States: Perspectives on performance from measured data. Energy Build. 2009, 41, 512–520. [Google Scholar] [CrossRef]
- Chen, X.; Yang, H.; Wang, Y. Parametric study of passive design strategies for high-rise residential buildings in hot and humid climates: Miscellaneous impact factors. Renew. Sustain. Energy Rev. 2017, 69, 442–460. [Google Scholar] [CrossRef]
- Figueiredo, A.; Figueira, J.; Vicente, R.; Maio, R. Thermal comfort and energy performance: Sensitivity analysis to apply the Passive House concept to the Portuguese climate. Build. Environ. 2016, 103, 276–288. [Google Scholar] [CrossRef]
- China Architecture Press. China Construction Industry Press Special Meteorological Data Set for Thermal Environment Analysis of Buildings in China; China Construction Industry Press: Beijing, China, 2005; ISBN 7112072743. [Google Scholar]
- Ministry of Housing and Urban-Rural Development. Ministry of Housing and Urban-Rural Development Thermal Design Code for Civil Building; Ministry of Housing and Urban-Rural Development: Beijing, China, 2016; p. 128.
- Passive House Institute Criteria for the Passive House. EnerPHit and PHI Low Energy Building Standard; Passive House Institute: Christchurch, New Zealand, 2016; pp. 1–27. [Google Scholar]
- Passive House Institute. Passive Houses in Chinese Climates; Passive House Institute: Christchurch, New Zealand, 2015. [Google Scholar]
- Harkouss, F.; Fardoun, F.; Biwole, P.H. Passive design optimization of low energy buildings in different climates. Energy 2018, 165, 591–613. [Google Scholar] [CrossRef]
- Tushar, Q.; Bhuiyan, M.; Sandanayake, M.; Zhang, G. Optimizing the energy consumption in a residential building at different climate zones: Towards sustainable decision making. J. Clean. Prod. 2019, 233, 634–649. [Google Scholar] [CrossRef]
- Ballarini, I.; Corrado, V. Analysis of the building energy balance to investigate the effect of thermal insulation in summer conditions. Energy Build. 2012, 52, 168–180. [Google Scholar] [CrossRef]
- Fang, Z.; Li, N.; Li, B.; Luo, G.; Huang, Y. The effect of building envelope insulation on cooling energy consumption in summer. Energy Build. 2014, 77, 197–205. [Google Scholar] [CrossRef]
- Ministry of Housing and Urban-Rural Development. Ministry of Housing and Urban-Rural Development Assessment Standard for Green Building; Ministry of Housing and Urban-Rural Development: Beijing, China, 2015.
- Ministry of Housing and Urban-Rural Development. Ministry of Housing and Urban-Rural Development Technical Guidelines for Passive Ultra Low Energy Consumption Green Building; China Construction Industry Press: Beijing, China, 2015.
- Wei, T. A review of sensitivity analysis methods in building energy analysis. Renew. Sustain. Energy Rev. 2013, 20, 411–419. [Google Scholar]
- Ioannou, A.; Itard, L. Energy performance and comfort in residential buildings: Sensitivity for building parameters and occupancy. Energy Build. 2015, 92, 216–233. [Google Scholar] [CrossRef]
- Heiselberg, P.; Brohus, H.; Hesselholt, A.; Rasmussen, H.; Seinre, E.; Thomas, S. Application of sensitivity analysis in design of sustainable buildings. Renew. Energy 2009, 34, 2030–2036. [Google Scholar] [CrossRef]
- Borgonovo, E.; Plischke, E. Sensitivity analysis: A review of recent advances. Eur. J. Oper. Res. 2016, 248, 869–887. [Google Scholar] [CrossRef]
- Breesch, H.; Janssens, A. Performance evaluation of passive cooling in office buildings based on uncertainty and sensitivity analysis. Sol. Energy 2010, 84, 1453–1467. [Google Scholar] [CrossRef]
- Domínguez-Muñoz, F.; Cejudo-López, J.M.; Carrillo-Andrés, A. Uncertainty in peak cooling load calculations. Energy Build. 2010, 42, 1010–1018. [Google Scholar] [CrossRef]
- Hygh, J.S.; DeCarolis, J.F.; Hill, D.B.; Ranjithan, S.R. Multivariate regression as an energy assessment tool in early building design. Build. Environ. 2012, 57, 165–175. [Google Scholar] [CrossRef]


| No. | Climate Zone by China | City | Longitude, Latitude | Altitude (m) | CDD Base 26 °C | HDD Base 18 °C |
|---|---|---|---|---|---|---|
| 1 | SC | Harbin | 126.63° E, 45.75° N | 142 | 8 | 5418 |
| 2 | SC | Changchun | 125.30° E, 43.92° N | 237 | 5 | 4944 |
| 3 | SC | Shenyang | 123.38° E, 41.80° N | 45 | 15 | 4007 |
| 4 | SC | Hohhot | 111.63° E, 40.80° N | 1063 | 2 | 4528 |
| 5 | SC | Xining | 101.82° E, 36.62° N | 2295 | 0 | 4441 |
| 6 | SC | Urumqi | 87.60° E, 43.77° N | 935 | 33 | 4531 |
| 7 | C | Lhasa | 91.03° E, 29.65° N | 3649 | 0 | 3553 |
| 8 | C | Beijing | 116.47° E, 39.90° N | 31 | 71 | 2795 |
| 9 | C | Tianjin | 117.17° E, 39.17° N | 3 | 57 | 2738 |
| 10 | C | Shijiazhuang | 114.43° E, 38.05° N | 81 | 85 | 2558 |
| 11 | C | Jinan | 117.03° E, 36.67° N | 170 | 136 | 2252 |
| 12 | C | Zhengzhou | 113.70° E, 34.73° N | 110 | 114 | 2197 |
| 13 | C | Xi’an | 108.92° E, 34.25° N | 398 | 111 | 2349 |
| 14 | C | Taiyuan | 112.55° E, 37.85° N | 778 | 4 | 3115 |
| 15 | C | Lanzhou | 103.83° E, 36.05° N | 1517 | 2 | 3231 |
| 16 | C | Yinchuan | 106.22° E, 38.47° N | 1111 | 1 | 3556 |
| 17 | HSCW | Shanghai | 121.43° E, 31.20° N | 6 | 136 | 1586 |
| 18 | HSCW | Nanjing | 118.77° E, 32.05° N | 7 | 187 | 1936 |
| 19 | HSCW | Hefei | 117.27° E, 31.85° N | 27 | 176 | 1836 |
| 20 | HSCW | Hangzhou | 120.17° E, 30.25° N | 42 | 175 | 1555 |
| 21 | HSCW | Nanchang | 115.88° E, 28.68° N | 47 | 259 | 1425 |
| 22 | HSCW | Wuhan | 114.33° E, 30.62° N | 23 | 273 | 1632 |
| 23 | HSCW | Changsha | 112.92° E, 28.20° N | 68 | 180 | 1554 |
| 24 | HSCW | Chongqing | 106.55° E, 29.55° N | 259 | 184 | 1104 |
| 25 | HSCW | Chengdu | 104.07° E, 30.65° N | 506 | 32 | 1372 |
| 26 | HSWW | Fuzhou | 119.32° E, 26.03° N | 84 | 262 | 723 |
| 27 | HSWW | Guangzhou | 113.30° E, 23.17° N | 41 | 283 | 394 |
| 28 | HSWW | Haikou | 110.17° E, 20.05° N | 14 | 358 | 63 |
| 29 | HSWW | Nanning | 108.35° E, 22.78° N | 122 | 265 | 431 |
| 30 | M | Guiyang | 106.72° E, 26.57° N | 1224 | 6 | 1605 |
| 31 | M | Kunming | 102.70° E, 25.05° N | 1892 | 0 | 1224 |
| Model 1 | Model 2 | |
|---|---|---|
| Building area (m2) | 6718 | 148 |
| Treated floor area (m2) | 5689 | 156 |
| No. of dwelling units | 54 | 1 |
| No. of occupants | 133.1 | 2.9 |
| External wall U-Value (W/m2 K) | 0.13 | 0.14 |
| Roof U-Value (W/m2 K) | 0.11 | 0.11 |
| Basement ceiling U-Value (W/m2 K) | 0.12 | 0.13 |
| Partition wall U-Value (W/m2 K) | 0.27 | 0.38 |
| U-Value window frame (W/m2 K) | 0.65 | 0.59 |
| Absorption coefficient wall | 0.8/0.4 | 0.60 |
| Absorption coefficient roof | 0.90 | 0.90 |
| Window wall ratio (N.E.S.W) | 0.15/0.13/0.45/0.09 | 0.26/0/0.71/0.02 |
| Solar heat gain coefficient | 0.50 | 0.50 |
| U-value glazing (W/m2 K) | 0.58 | 0.70 |
| Shading (N.E.S.W) | 0.43/0.31/0.4/0.32 | 0.89/1/0.83/0.84 |
| Air tightness (h−1) | 0.50 | 0.22 |
| Heat recovery efficiency | 80% | 83% |
| Humidity recovery efficiency | Yes | No |
| Mechanical cooling | Yes | No |
| Window night ventilation in summer, manual, (h−1) | 0.36 | 0.15 |
| Air change rate via the vent. A system with supply air (h−1) | 0.50 | No |
| Window ventilation air change rate in summer (h−1) | 0.16 | 0.36 |
| Internal heat gains (W/m2) | 1.60 | 2.40 |
| No. | Parameter | Range | Unit | Probability Distributions |
|---|---|---|---|---|
| 1 | Wall U-Value | 0.1~0.3 | W/(m2 K) | continuous |
| 2 | Roof U-Value | 0.1~0.25 | W/(m2 K) | continuous |
| 3 | Basement ceiling U-Value | 0.18~2 | W/(m2 K) | continuous |
| 4 | U-Value window frame | 0.8~1.5 | W/(m2 K) | continuous |
| 5 | Absorption coefficient wall | 0.4~0.95 | - | continuous |
| 6 | Absorption coefficient roof | 0.4~0.95 | - | continuous |
| 7 | Solar heat gain coefficient | 0.1~1 | - | continuous |
| 8 | U-value glazing | 0.1~1.5 | W/(m2 K) | continuous |
| 9 | Windows overhang shading | 0~1 | m | continuous |
| 10 | Air tightness | 0.5~1.0 | h−1 | continuous |
| 11 | Heat recovery efficiency | 0~95% | - | continuous |
| 12 | Humidity recovery efficiency | 0~90% | - | continuous |
| 13 | Night ventilation efficiency via windows | 0~0.5 | - | continuous |
| Model 1 | Model 2 | |||||
|---|---|---|---|---|---|---|
| Location | Energy Consumption (kWh/m2 a) | Relative Error Rate (%) | Energy Consumption (kWh/m2 a) | Relative Error Rate (%) | ||
| PHPP | DB | PHPP | DB | |||
| Harbin | 82 | 78.3 | 4.5 | 77.2 | 73.5 | 4.8 |
| Beijing | 70.6 | 73.8 | −4.5 | 75.8 | 70.2 | 7.4 |
| Wuhan | 91.3 | 87.4 | 4.3 | 92.1 | 84.1 | 8.7 |
| Guangzhou | 98.5 | 92.9 | 5.4 | 93.7 | 89.7 | 4.3 |
| Kunming | 52.3 | 49.8 | 4.8 | 41.8 | 38.8 | 7.2 |
| City | Building Type | Heating Demand | Cooling Demand | Primary Energy Demand |
|---|---|---|---|---|
| Harbin | Example | 0.988 | - | 0.978 |
| C15 | 0.988 | - | 0.995 | |
| Urumqi | Example | 0.988 | - | 0.984 |
| C15 | 0.997 | - | 0.995 | |
| Lhasa | Example | 0.900 | - | 0.847 |
| C15 | 0.988 | - | 0.982 | |
| Shijiazhuang | Example | 0.989 | 0.849 | 0.968 |
| C15 | 0.997 | 0.975 | 0.990 | |
| Shanghai | Example | 0.939 | 0.952 | 0.769 |
| C15 | 0.990 | 0.982 | 0.982 | |
| Chengdu | Example | 0.981 | 0.897 | 0.950 |
| C15 | 0.993 | 0.993 | 0.991 | |
| Guangzhou | Example | - | 0.997 | 0.992 |
| C15 | - | 0.996 | 0.998 | |
| Kunming | Example | 0.693 | 0.447 | 0.364 |
| C15 | 0.863 | 0.665 | 0.554 |
| Zone No. | City | WU | BCU Basement | SHGC | UG | HERE | HURE | |
|---|---|---|---|---|---|---|---|---|
| With | Without | |||||||
| 1 | Harbin, Changchun, Shenyang, Hohhot, Xining | 0.1–0.2 | 1.22–2 | 0.18–0.82 | 0.6–1 | 0.1–0.7 | 0.7–0.95 | - |
| 2 | Beijing, Tianjin, Shijiazhuang, Jinan, Zhengzhou, Xi’an, Taiyuan, Lanzhou, Yinchuan | 0.1–0.24 | 0.18–2 | 0.18–1.14 | 0.5–1 | 0.1–0.7 | 0.6–0.95 | - |
| 3 | Shanghai, Nanjing, Hangzhou, Nanchang, Wuhan, Hefei, Changsha, Chongqing | 0.1–0.2 | 1.3–2 | 1.3–2 | 0.1–0.5 | 0.1–0.7 | 0–0.4 | 0.5–0.9 |
| 4 | Fuzhou, Guangzhou, Haikou, Nanning | 0.1–0.24 | 0.18–2 | 0.18–2 | 0.1–0.3 | 0.1–0.7 | - | 0.7–0.9 |
| 5 | Lhasa, Guiyang, Kunming | 0.1–0.4 | 0.18–2 | 0.18–2 | 0.1–1 | 0.1–1 | - | - |
| 6 | Urumqi | 0.1–0.18 | 1.38–2 | 0.18–0.66 | 0.7–1 | 0.1–0.5 | 0.6–0.95 | - |
| 7 | Chengdu | 0.1–0.2 | 1.14–2 | 0.18–2 | 0.1–0.5 | 0.1–0.9 | 0.45–0.95 | 0.6–0.9 |
| Zone No. | City | The Number of Cases | Cases after Optimization | Rate of Change (%) |
|---|---|---|---|---|
| 1 | Harbin | 2330 | 71,062 | 2950 |
| 2 | Shijiazhuang | 37,653 | 99,865 | 165 |
| 3 | Shanghai | 15,603 | 91,317 | 485 |
| 4 | Guangzhou | 3408 | 64,478 | 1792 |
| 5 | Kunming | - | - | 0 |
| 6 | Urumqi | 2194 | 67,200 | 2963 |
| 7 | Chengdu | 48,648 | 99,991 | 106 |
Publisher’s Note: MDPI stays neutral with regard to jurisdictional claims in published maps and institutional affiliations. |
© 2021 by the authors. Licensee MDPI, Basel, Switzerland. This article is an open access article distributed under the terms and conditions of the Creative Commons Attribution (CC BY) license (https://creativecommons.org/licenses/by/4.0/).
Share and Cite
Li, X.; Deng, Q.; Ren, Z.; Shan, X.; Yang, G. Parametric Study on Residential Passive House Building in Different Chinese Climate Zones. Sustainability 2021, 13, 4416. https://doi.org/10.3390/su13084416
Li X, Deng Q, Ren Z, Shan X, Yang G. Parametric Study on Residential Passive House Building in Different Chinese Climate Zones. Sustainability. 2021; 13(8):4416. https://doi.org/10.3390/su13084416
Chicago/Turabian StyleLi, Xing, Qinli Deng, Zhigang Ren, Xiaofang Shan, and Guang Yang. 2021. "Parametric Study on Residential Passive House Building in Different Chinese Climate Zones" Sustainability 13, no. 8: 4416. https://doi.org/10.3390/su13084416
APA StyleLi, X., Deng, Q., Ren, Z., Shan, X., & Yang, G. (2021). Parametric Study on Residential Passive House Building in Different Chinese Climate Zones. Sustainability, 13(8), 4416. https://doi.org/10.3390/su13084416