Article

The Virtual Online Supermarket: An Open-Source Research Platform for Experimental Consumer Research

by
Nils Engelbrecht
1,*,
Tim-Benjamin Lembcke
2,
Alfred Benedikt Brendel
3,
Kilian Bizer
1 and
Lutz M. Kolbe
2
1
Chair of Economic Policy and SME Research, University of Goettingen, 37073 Göttingen, Germany
2
Chair of Information Management, University of Goettingen, 37073 Göttingen, Germany
3
Chair of Business Informatics, Technische Universität Dresden, 01062 Dresden, Germany
*
Author to whom correspondence should be addressed.
Sustainability 2021, 13(8), 4375; https://doi.org/10.3390/su13084375
Submission received: 8 March 2021 / Revised: 5 April 2021 / Accepted: 13 April 2021 / Published: 14 April 2021
(This article belongs to the Collection Food Choice and Consumer Preferences)

Abstract

:
It is controversially discussed if and which interventions policymakers should implement to promote healthier, more sustainable, and more ethical food choices. Often, policy measures suffer from a lack of data. This is especially true for the growing field of online grocery shopping. Yet, it not always feasible to test the impact of each possible policy intervention in the field. Here, computer-simulated shopping experiments offer a complementary approach. Recent evidence suggests that they heighten the realism of consumer experiments and collect valid data at a relatively low cost. In this paper, we introduce an open-source toolset that offers multiple avenues to develop and run experiments in the context of online grocery shopping. Hence, it supports researchers and policy makers in evaluating instore-intervention aiming to support more sustainable food choices.

1. Introduction

Today, more and more governments, NGOs, and players from the food industry have started to follow the United Nations’ call to transition to a more healthy and sustainable food system [1]. In Western countries particularly, empirical evidence emphasizes the negative impact of the predominant dietary patterns on individuals’ health, the environment, and society [2]. Hence, policy measures limited to the supply side seem insufficient to trigger a sustainable transition of the food system [3]. Consequently, there is a controversial debate about what public and private institutions should or should not promote “better food choices” [4,5].
These days, most decisions about food still take place in traditional brick-and-mortar supermarkets. However, driven by the development and diffusion of new communication technologies, grocery shopping is undergoing a change in the 21st century [6]. As one major element of this change, online grocery shopping is becoming an increasingly more important retail channel, especially in urban centers [7]. Thus, in-store interventions in traditional brick-and-mortar stores and online supermarkets are crucial instruments for policymakers aiming to alter consumers’ sustainable food choices [8]. Here, they can draw on a variety of different intervention types ranging from economic interventions (e.g., taxes) to changes in a store’s microenvironment (e.g., choice architecture techniques; see [9] for an overview).
Due to this variety, evidence-based policymaking has a constant need for data to identify the right intervention type or a mix of interventions for the respective case. For instance, due to a lack of empirical evidence, the effectiveness of changes in a store’s microenvironment to promote sustainable food choices is still questioned [10,11]. Furthermore, little is known about the extent to which findings from traditional brick-and-mortar stores can be transferred to online supermarkets [7,12]. For instance, there is initial evidence that online supermarkets should not be regarded as perfect mirrors of their real-world equivalents. While some elements of the shopping environment like shelf placement strategies seem to be a relevant factor for both online and “offline” supermarkets [13,14], both channels differ in aspects like (i) in product presentation, e.g., physical vs. virtual [15], (ii) navigation pathways [16], or interpersonal interactions [17,18]. Moreover, compared to physical contexts, online environments allow an easier, faster, and more flexible integration of different design choices and interventions and provide enhanced functionalities like decision support systems [19].
Hence, as part of a transition to a sustainable food system, it is mandatory to gain further insights into the determinants of consumers’ in-store behavior patterns and food choices in online supermarkets and traditional brick-and-mortar stores. As one of the first, a survey study in Poland analyzed determinants and barriers of organic online shopping [20]. Only in this way, it will be possible to evaluate the current legal requirements (e.g., packing information) on their effectiveness in analog and digital choice environments and modify them if necessary. Nevertheless, empirical insights can support policymakers in developing, testing, and adopting new policies to govern sustainable food choices [21,22,23].
As it is not always feasible to run studies in actual (online) supermarkets, researchers have recently started to conduct studies in simulated virtual supermarkets [24,25,26]. Such an approach has the potential to heighten the realism level of consumer experiments and allow researchers to collect valid purchase data at a relatively low cost.
To make computer-simulated shopping experiments as accessible as possible to interested researchers, we developed an open-source, modular, and highly customizable virtual online supermarket application, called VOS. The application allows researchers to easily implement and perform experiments in the context of (online) grocery shopping. Thus, it can help to develop and evaluate policy measures aiming to support more sustainable food choices. All it takes is a server computer (e.g., a cloud server) to host the experiment and participants with access to a device using a modern web browser.
The tool’s front-end was designed to emulate the store design and functions (e.g., navigation tools) of a realistic online grocer environment. In addition, the back-end of the tool allows researchers to modify the research conditions and to configure and implement different experimental treatments. For universal access, the project’s source code, python scripts for automated treatment administration, and configuration snippets for local and server hosting are available on GitHub [27]. Moreover, user documentation, set-up instructions, and sample data are available in conjunction with the repository. Everyone should feel invited to use a VOS for academic purposes and improve our application and submit it via GitHub. However, we ask to cite this paper if the VOS is used for your publication.
The technical barriers for using our application were lowered so the product database and a couple of research conditions can be edited without any programming knowledge by using a visual administration interface (VAI). For instance, researchers can use predefined modification options (“Use Cases”; UC) to adjust food prices, implement different labeling strategies, or change the arrangement of food items. The aim was to make a preselection of modification options covering the broadest possible spectrum of varying research interests. Hence, use cases range from traditional economic instruments (e.g., taxes) over knowledge-based interventions (e.g., labeling strategies) to choice architecture and decision support tools. Researchers familiar with programming in Angular [28] are not limited to basic features. Instead, they can extend or change any aspect of the tool’s visual or functional implementation by altering the program’s code. In total, our application allows researchers to test a broad spectrum of interventions on consumers’ food purchases (i) at relatively low cost, (ii) without a complex implementation process, and (iii) without having to collaborate with a specific retailer. In addition to evaluating such interventions based on outcome variables like purchase data, the tool offers extensive possibilities for recording subjects’ in-store behavior dynamics. This way, a VOS generates both general information about users’ in-store behavior (e.g., the average use of filters) and detailed information about a single user’s “journey” (e.g., single user’s navigation pathway) during the shopping trip.
In this paper, we will first introduce the development, features, and implementation of our application. With this, we pay particular attention to describing opportunities for practical implementation. Secondly, we will present the results of an initial evaluation study on the tool’s functionality and realism level.

2. VOS in a Nutshell: Features and Functions

The VOS application was designed to enable researchers to conduct experiments in a realistic online shopping environment. It contains two core elements: The shop view and a visual administration interface (VAI). For more information about the technology and programming of the VOS application, see Appendix A.

2.1. Shop View

The shop view mimics the appearance and functionality of a realistic online supermarket. The design is not prohibitive and provides users with the services expected of an online store. Users can browse for products without any (visible) restrictions, e.g., by clicking on categories and subcategories or using a search bar for word searches (Figure 1). Participants see a list of all food items belonging to the selected category (or subcategory) on category pages. In this list, product names, product images, price, the price per unit (e.g., EUR 1.00/kilogram), and the package sizes (e.g., 100 g) are displayed. Researchers are free to decide which currency and quantity units (e.g., gram vs. ounces) are used for the shop. Clicking on a food item takes consumers to a product page, where more detailed information on the product is available (e.g., nutritional information). Further, our tool’s base version provides category, attribute, and open text filter options for filtering items. In addition, the items can be sorted via ascending or descending prices, and a virtual shopping cart (VSC) lets users add items to and delete them from their cart.
In the tool’s base version, the front-end design is very neutral to prevent any existing customer relationship bias towards the store’s design elements. However, as the application code is open-source, the design can be customized to suit researchers’ individual needs. The same applies to most of the elements, functions, and information displayed in the shop. As explained in the next section, researchers can use the visual administration interface’s support for some of these modifications.

2.2. Visual Administration Interface (VAI)

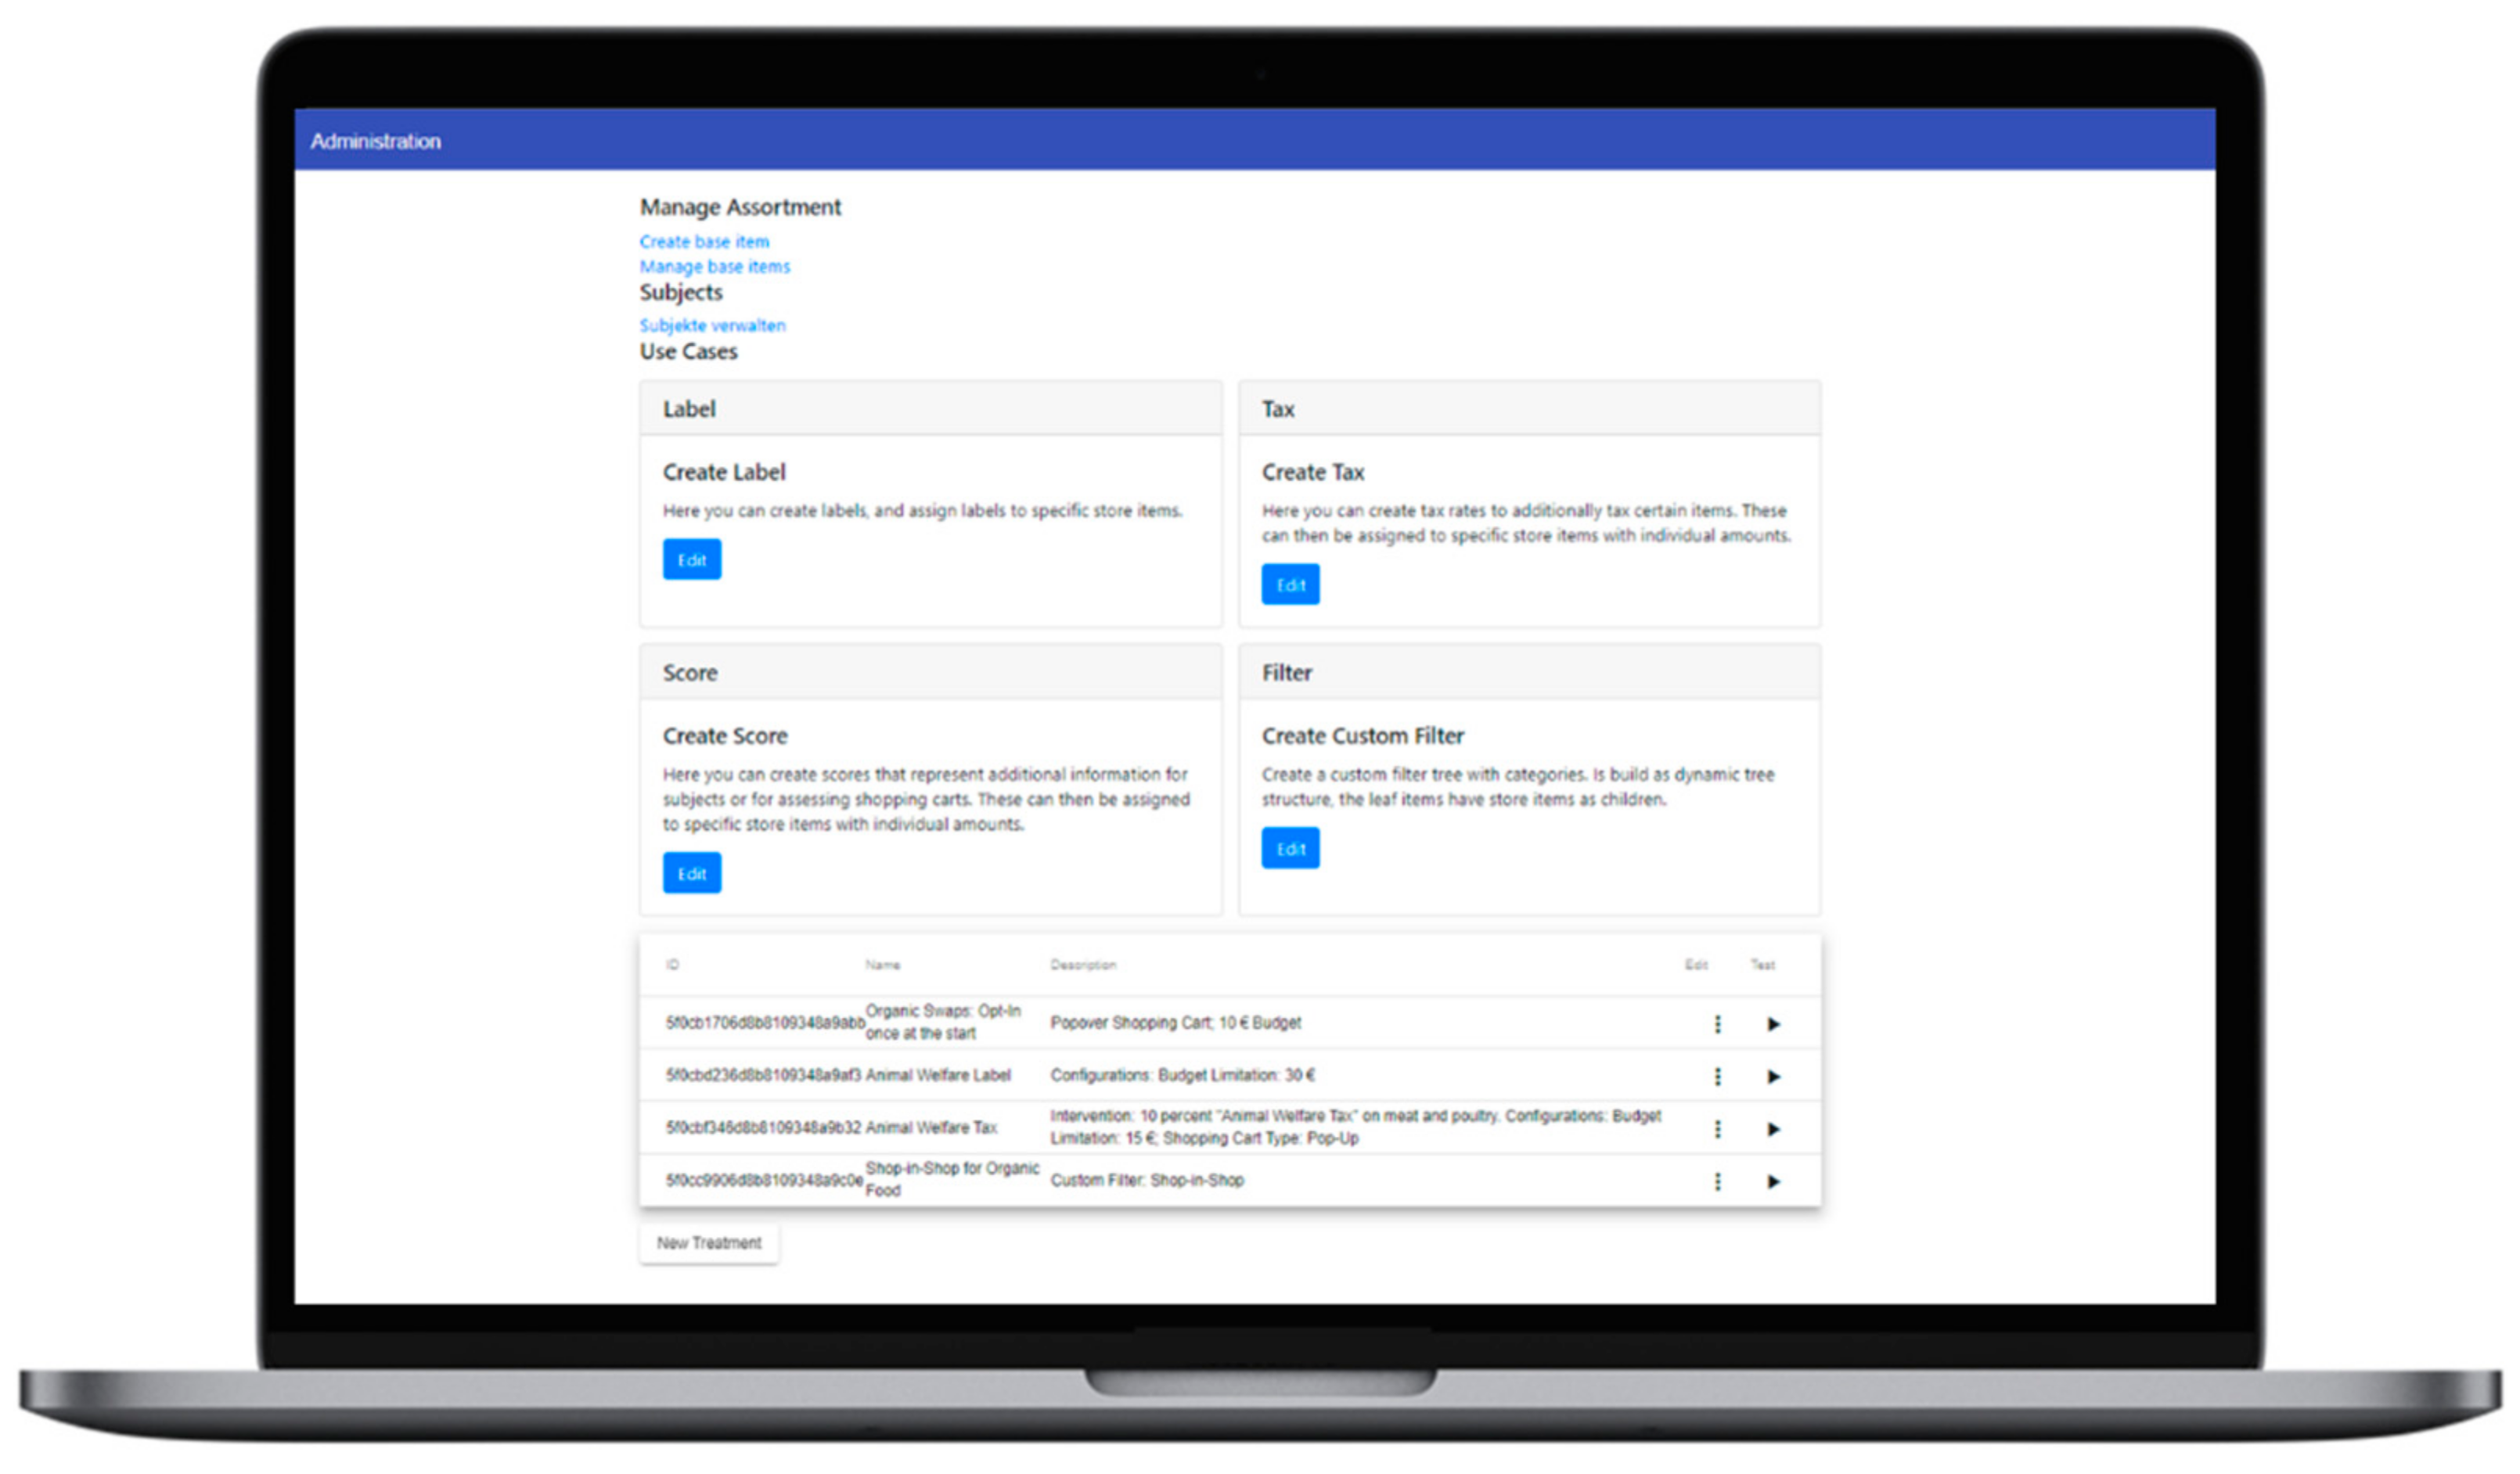
The VAI is a visual subdomain where each authenticated user (administrator) has their own workspace (Figure 2). It provides the means for managing the product database and various modification options that allow researchers to determine which information or functions the shop view presents. In the following, we refer to these predefined modification options as “Use Cases” because researchers can use and modify them to create their own experimental treatments. For instance, without any mandatory knowledge in programming, it is possible to create or edit the items, filter mechanisms, taxes, labels, scores, configure VCS’s functions, and implement swap interventions. Swap options offer consumers the opportunity to replace a selected food item, for instance, with a healthier or more sustainable one [25]. Furthermore, researchers can limit participants’ shopping budget for each treatment. This might be particularly relevant for spending tracking experiments [29]. In this manner, it can be safeguarded that subjects invest reasonable effort into the shopping task and do not merely click through it. Here, just one click is necessary for immediately testing all created treatments in a demo mode.
Via the VAI, it is also possible to administrate participants and to conduct experiments. Here, one can easily create (personal) links for all participants. These links refer participants to a unique URL, which presents the SV modified to the assigned treatment conditions. On this webpage, the VOS records participants’ behavior automatically and saves it on the employed server. Hence, a VOS solely requires the link, a connection to the hosting server, and a modern web browser for participating in the experiment.

2.3. Preconfigured Modification Options (“Use Cases”)

The application’s base version includes five use cases (UC.1 to UC.5). These cover four intervention types: (i) economic interventions (UC.1 taxes and subsidies), (ii) changes to the store’s microenvironment (UC.2 product arrangement), (iii) knowledge-based interventions (UC.3 product labeling and scores), and (iv) two decision-support tools (UC.4 different types of VSCs and UC.5 swap options). All use cases were selected and designed based on research findings on in-store interventions in (online) supermarkets (e.g., [8,30,31,32,33]). In addition, we conducted expert interviews with researchers from different disciplines to identify and prioritize their expectations and requirements for a research tool.

2.3.1. Use Case One: Taxes and Subsidies

In many cases, the price of a food product is the central criterion underlying the purchase decision. Hence, it does not seem very surprising that several studies analyze how economic interventions alter consumers’ food choices, for instance, by applying taxes, subsidies, or other monetary incentives (e.g., discounts and food coupons) on selected food items (see [34] for a review).
Overall, there is empirical evidence that monetary incentives effectively alter consumers’ food purchases and consumption (e.g., [8,35]). With this, salience seems to be an important determinant for the effectiveness of a tax or a subsidy [36]. This might be particularly relevant for online supermarkets as individuals tend to shift towards more shallow forms of information processing in digital environments such as browsing, scanning, or skimming [37,38,39]. Hence, an individual’s actual food choice in an online supermarket could be based more on a superficial first visual impression like the final price than consciously considering different internal and external aspects like health, price, or convenience [40]. Accordingly, the effect of taxes in an online supermarket could also depend on their visual presentation and salience.
Consequently, the need for empirical evidence for evidence-based policy-making prevails for at least two reasons: first, food prices remain a politically controversial topic, especially against the background of debates on sustainability and animal welfare (e.g., [41]). Second, little particular research on the effects of taxes in online supermarkets exists.
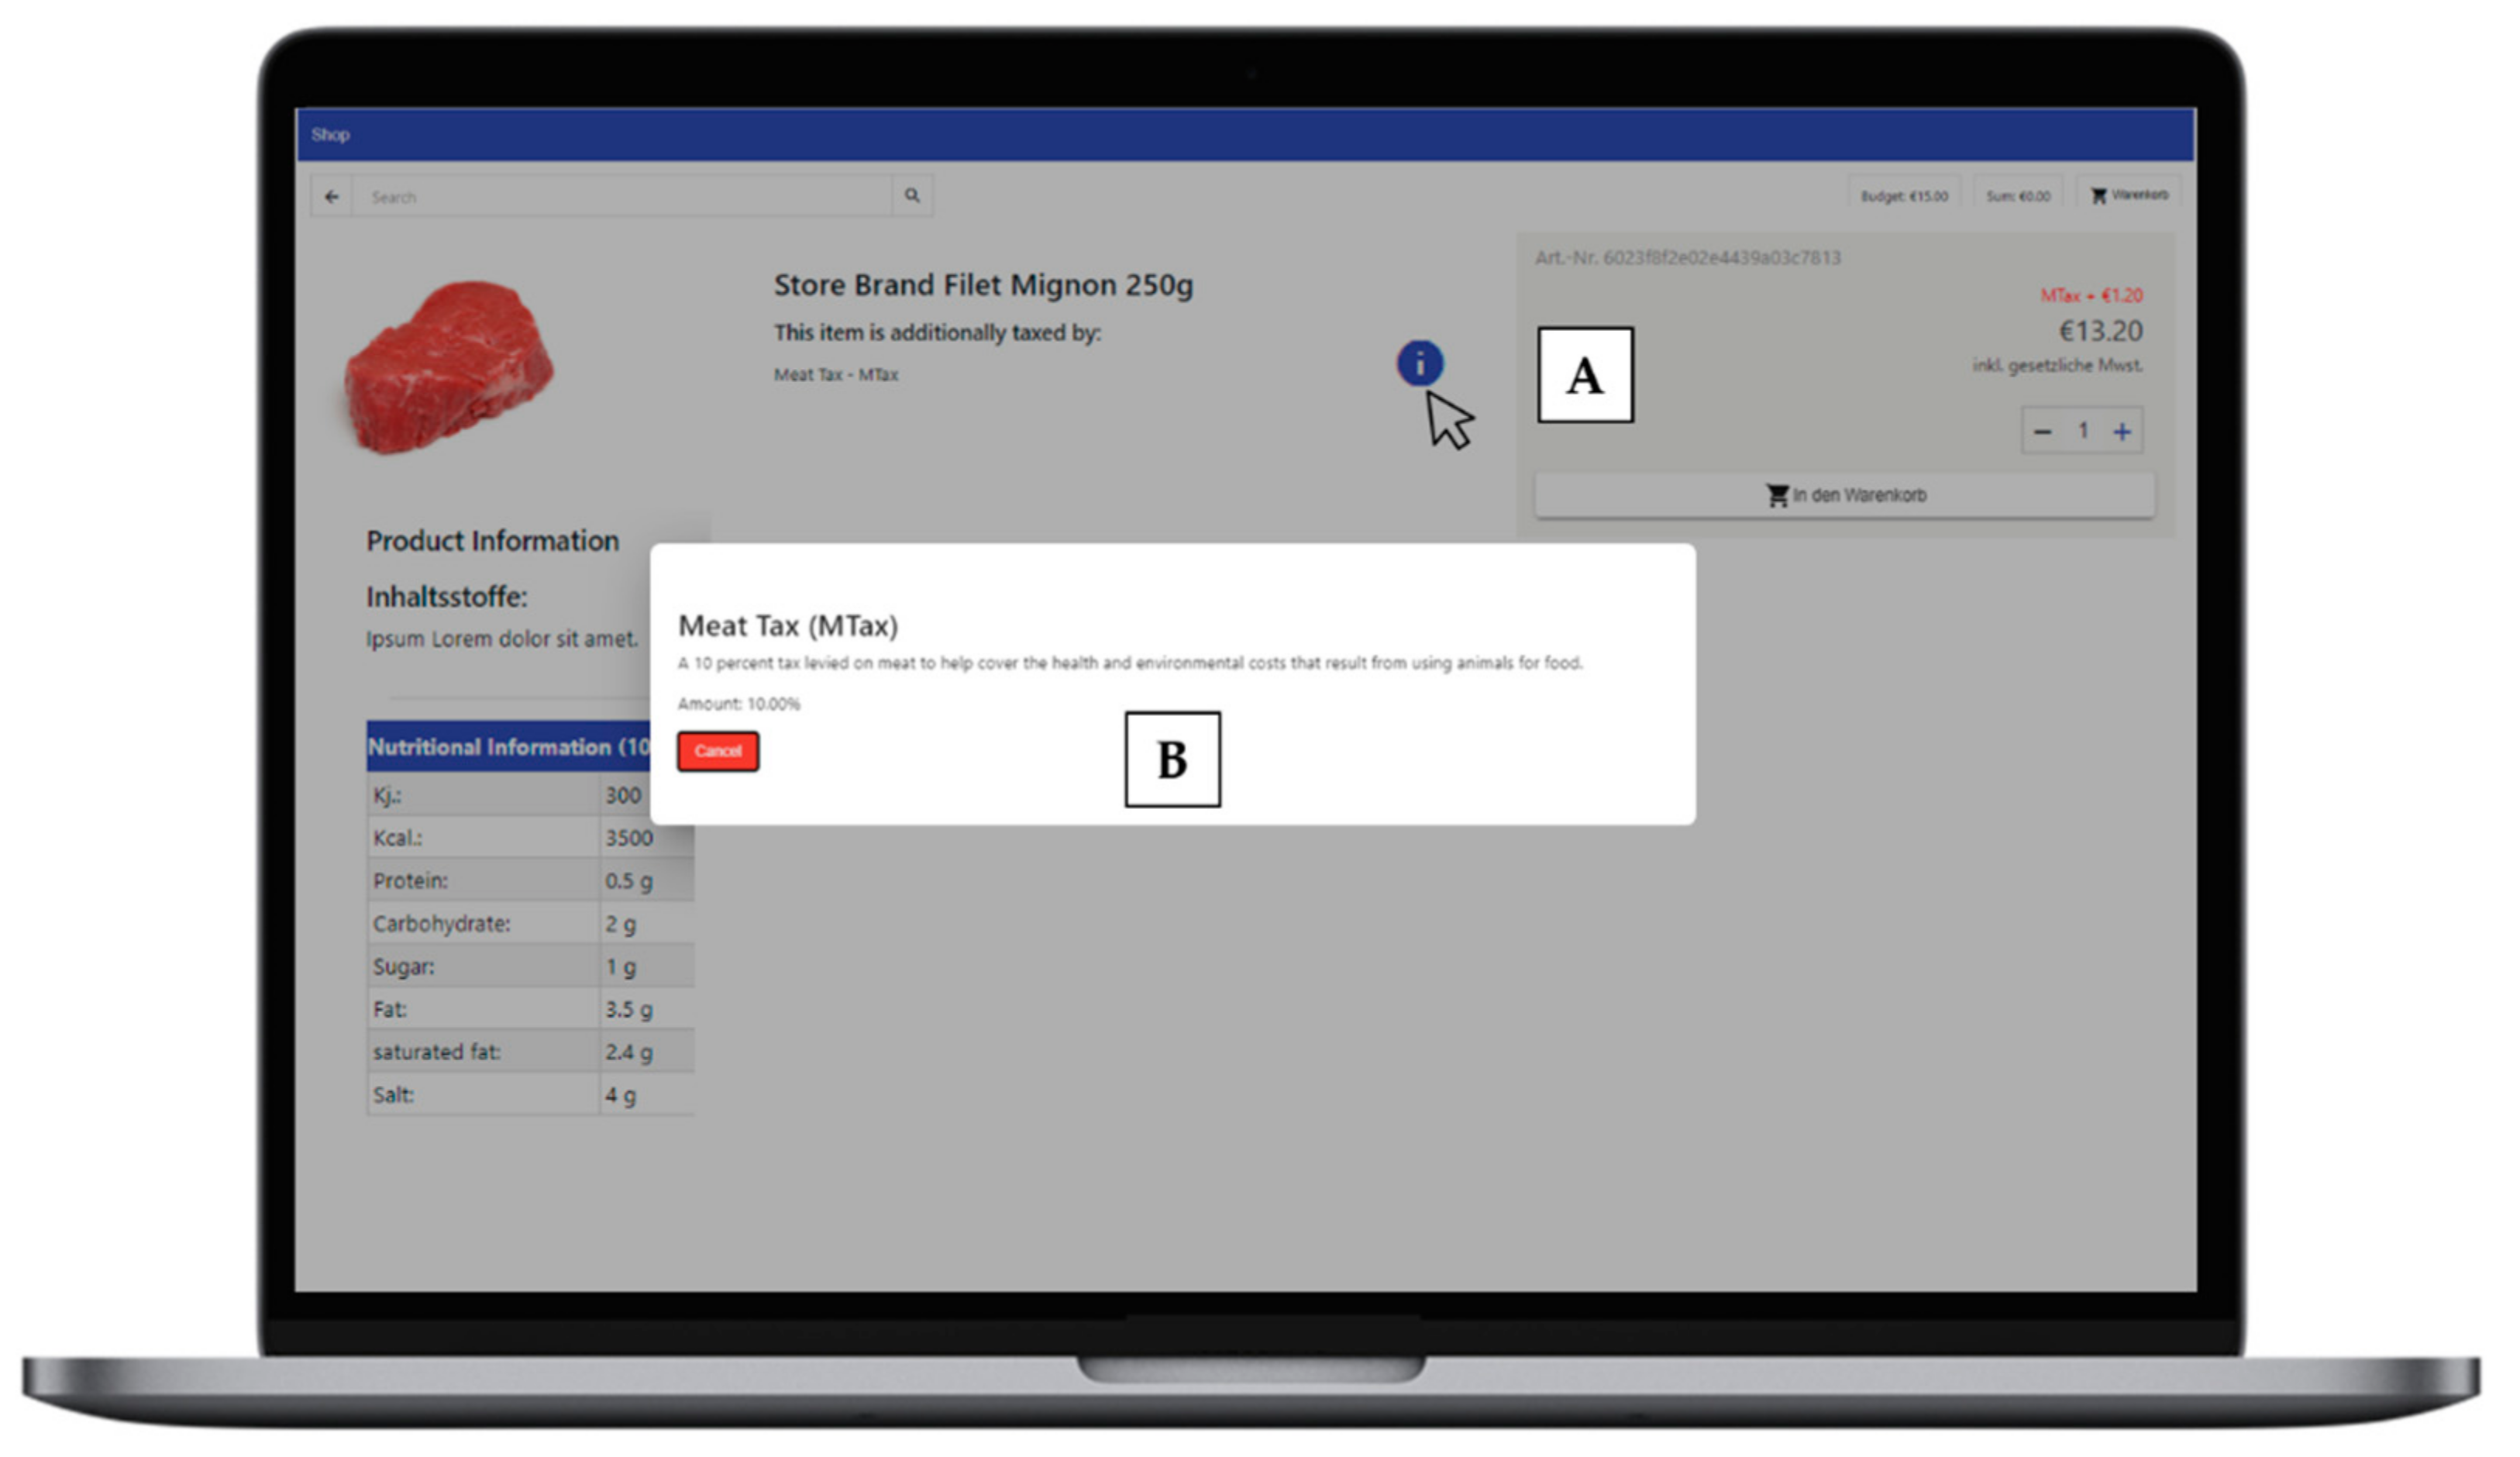
To this end, a VOS offers researchers an easy way to create their own or implement existing taxation models (e.g., meat tax) and evaluate their effect on consumers in a realistic online shopping environment. When defining an experimental treatment, researchers can configure whether and for which products taxes should be displayed and charged in the shop. Additionally, further information on the tax can be provided. Consumers will find this information on the product page of each item affected by the tax (Figure 3). Here, the VOS automatically tracks whether a consumer has retrieved this information or not.
Despite being labeled “taxes”, the function is not limited to taxation. Instead, it can also be used for other pricing mechanisms and strategies like subsidies, discount models, or dynamic pricing. In particular, the latter approach is coming into focus as recent technological advances have opened up unprecedented opportunities for retailers to implement interpersonal pricing strategies in a more flexible and prevalent manner (e.g., based on consumers’ individual characteristics).

2.3.2. Use Case Two: Product Arrangement

Previous research has demonstrated that even marginal and seemingly irrelevant changes in a store’s microenvironment can alter individuals’ food choices in a predictable way, e.g., a more “prominent” positioning of a food item [42]. This resonates in the well-known phrase “Eye-Level Is Buy-Level”. Indeed, the impact of these and other shelf placement strategies on consumers’ purchases are extensively documented in marketing literature (e.g., [14]). However, whether these interventions can also be successfully used to promote better food choices has not been completely evaluated [43].
Even if product presentation methods differ between traditional brick-and-mortar stores and online supermarkets, (digital) shelf placement seems to remain a relevant factor for online stores. Overall, initial findings suggest that small differences in assortment organization affect consumers’ behavior similarly when tested in an online store [13,14]. However, there are still a couple of unresolved research questions that concern both physical and online supermarkets. For instance, little is known about how product bundling strategies (e.g., Organic Box Schemes) [44,45] or store-in-store concepts affect consumers’ sustainable food choices. Even if some shelf management strategies show similar effects on consumers’ behavior for both retail channels, it is much easier to change or even customize shelf or product arrangements within an online supermarket [44,45]. Hence, future research may benefit from a systematic evaluation of how customized digital shelf placement strategies affect consumers’ food choices.
Accordingly, findings obtained in computer-simulated shopping experiments can provide generalizable insights. Thus, the VOS is suitable for both: studies aiming to gather general findings on how organizing an assortment affects food choices and analyzing particularities of absolute and relative display locations in online supermarkets. For product sorting and bundling, the application offers two kinds of filter types: Filters based on tags (e.g., name of a product category) and filters based on attributes (e.g., organic). For each item, tags and attributes can be defined directly in the product database (Figure 4).
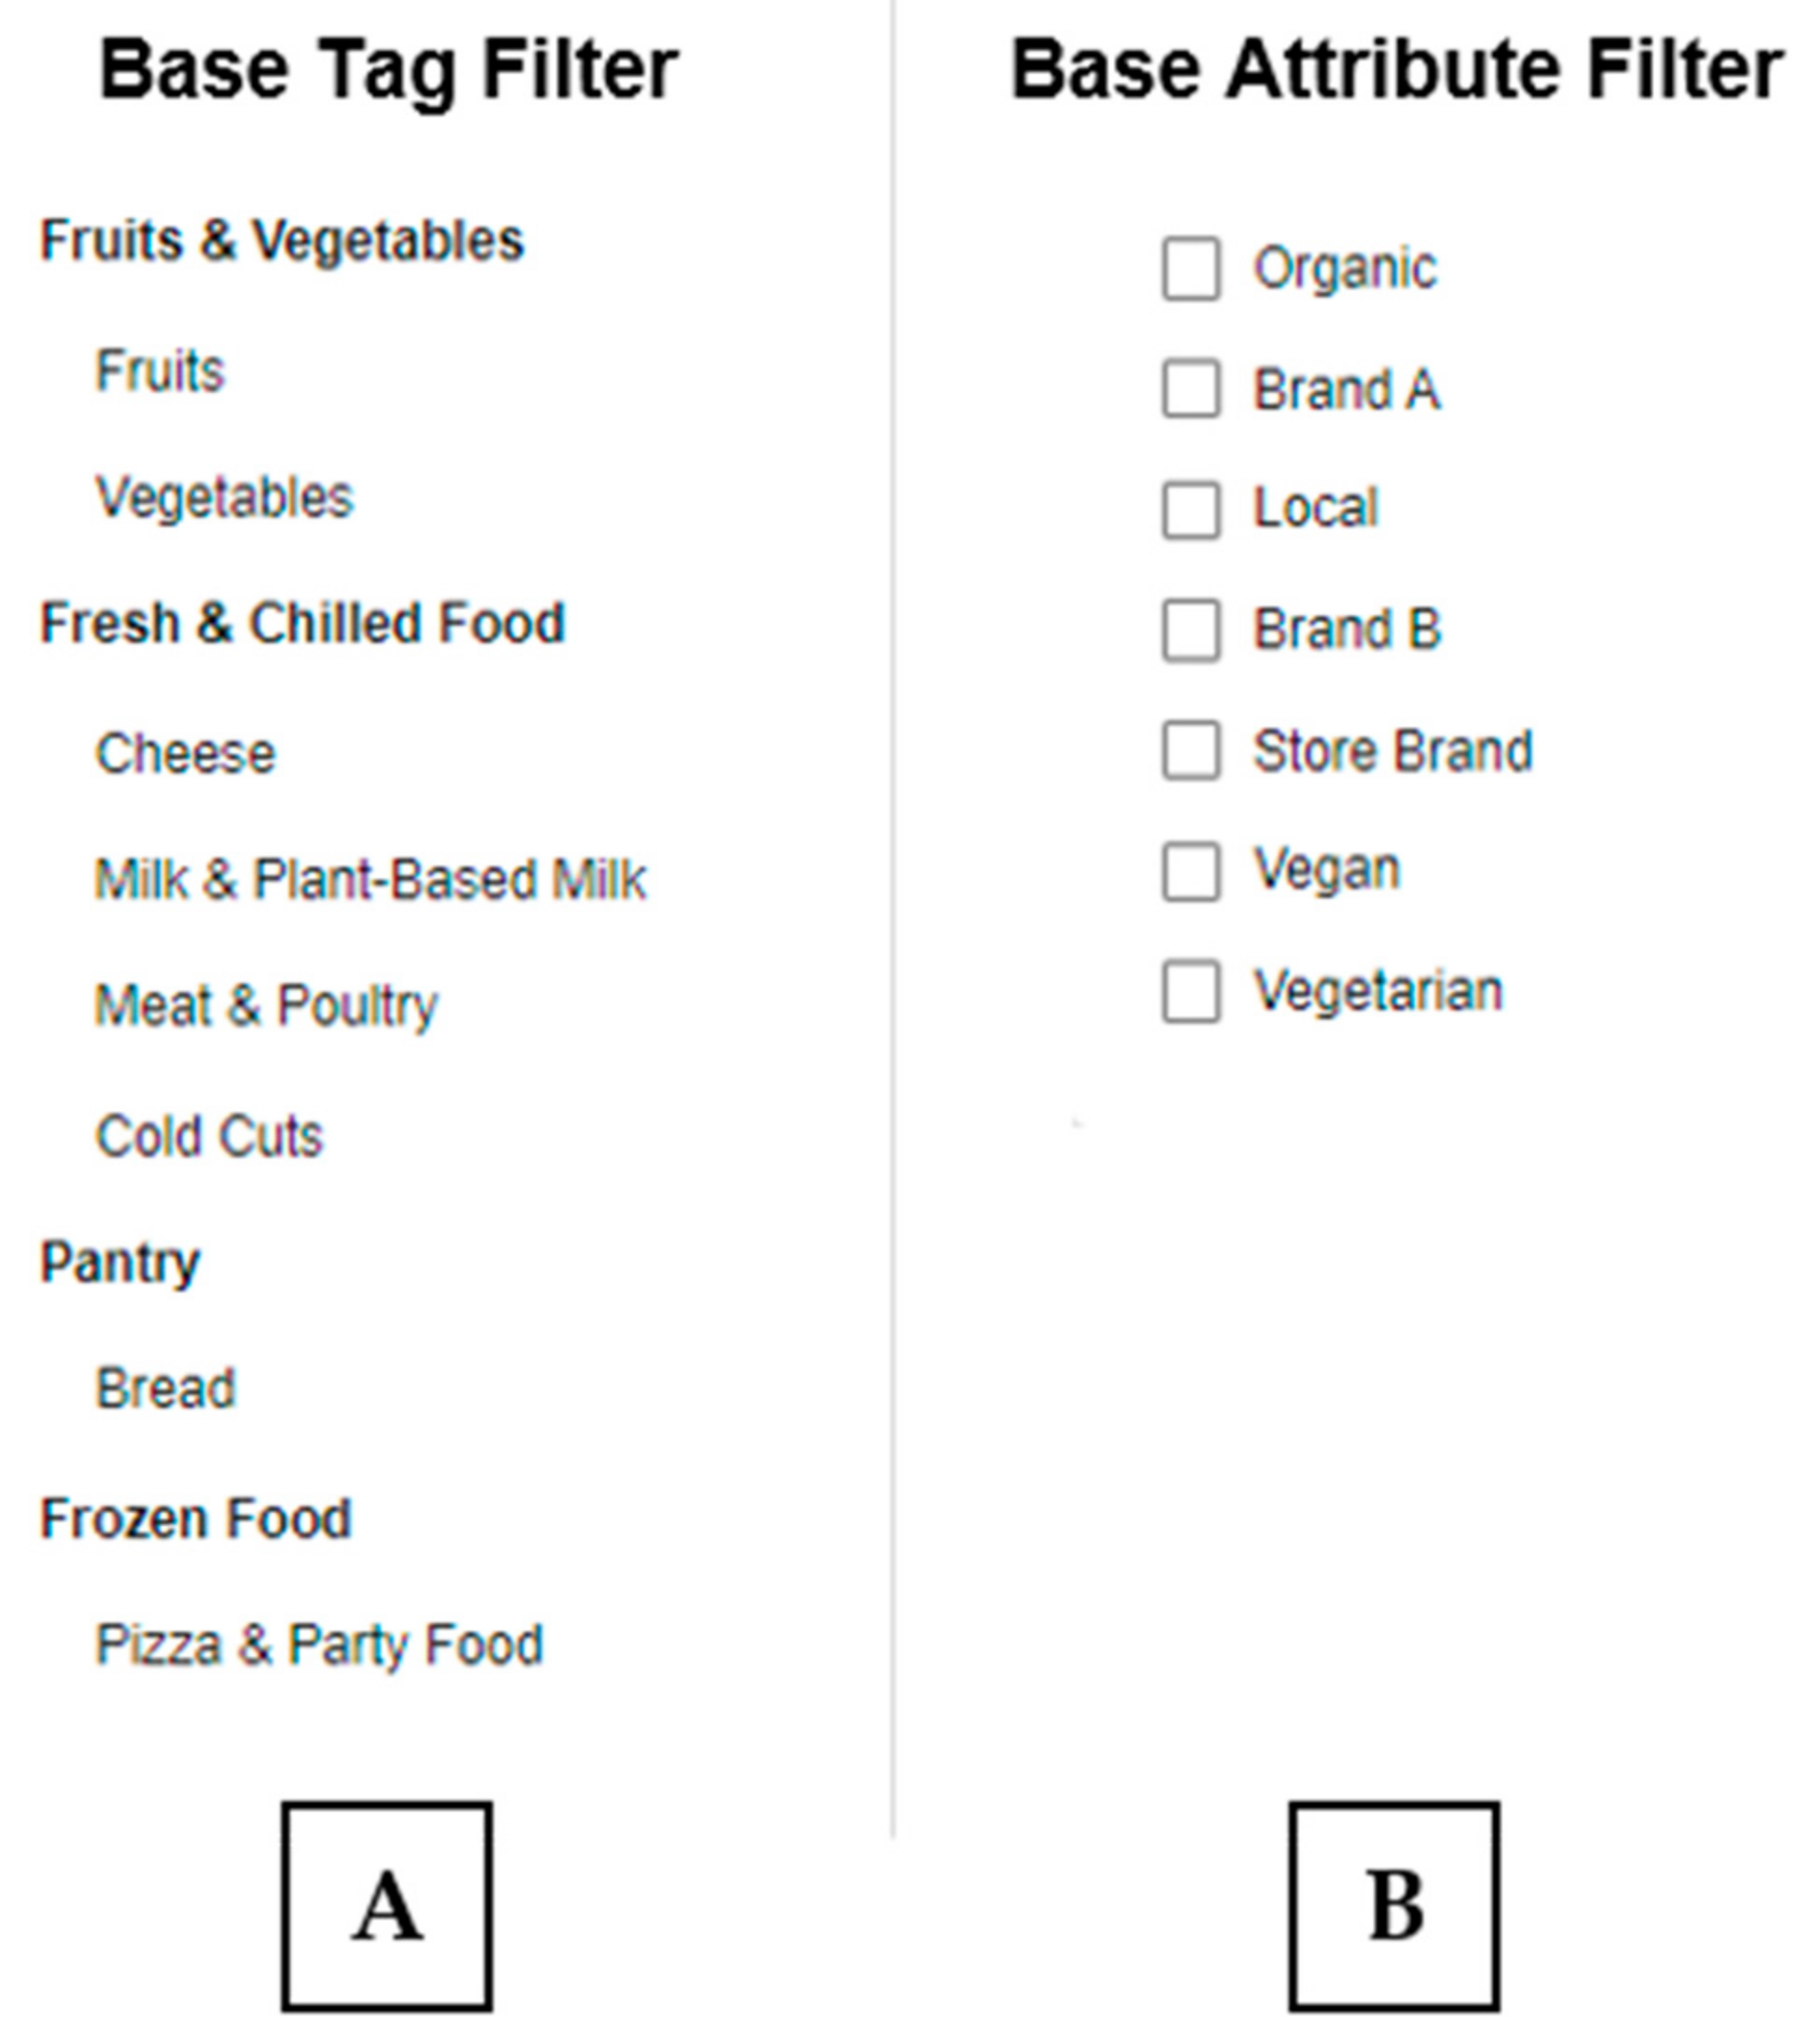
In this case, we created a filter tree for tags with one parent category and one child category, displayed automatically on the left-hand side of the shop view. In the same manner, a filter based on items’ base attributes will be automatically implemented. This can be used to limit the selection, e.g., only including items with the trait “organic”. Figure 5 shows a possible implementation.
The base attribute filter is a multiple-selection whereas the tag filter requires a single choice. Alternatively, researchers can create filter trees in the VAI. This way, there are no limits to the filter tree’s customizability and depth (see the VOS User Guide for further instructions on custom filtering). Further, researchers can use an additional sorting mechanism: “niceness.””. Niceness is an attribute on the item level, represented by a numeric value between zero and one. Based on this attribute, items from the database are sorted, beginning with the least nice items. This ordering mechanism allows individual researchers to define which items always are displayed first (see Figure 4).
Using these functions, researchers can edit (i) how products are arranged into categories and subcategories, (ii) how these categories are titled in the store, and (iii) which products are displayed in which order. Furthermore, they can use it to implement shop-in-shop concepts (e.g., sustainable food substore).

2.3.3. Use Case Three: Product Labels and Scores

Besides interventions geared towards human affection, cognitively-oriented interventions aiming to transfer knowledge and information remain widely used in food policies [33]. Prior research has illustrated that grocery shoppers do not pay much attention to detailed product information like nutritional information [45,46] but base their decisions on key information that is readily available and processable [47,48]. Consequently, simplified and salient front-of-package label formats may facilitate consumers’ processing of nutritional information and product attributes (e.g., organic) at the point of sale [49].
Based on these empirical insights, many different food labels have been developed, empirically tested, and in some cases, launched [50,51,52,53]. However, the empirical evidence on the effectiveness of labeling strategies to promote more sustainable and healthier food choices is overall inconclusive and inconsistent on the question of which label format works best [33,54]. Consequently, there are numerous starting points for further research, such as (i) evaluating new labeling strategies (e.g., for animal welfare-friendly standards), (ii) analyzing the effectiveness of existing labels in visual online shops, or (iii) exploring the impact of the above-mentioned new technological possibilities in online supermarkets.
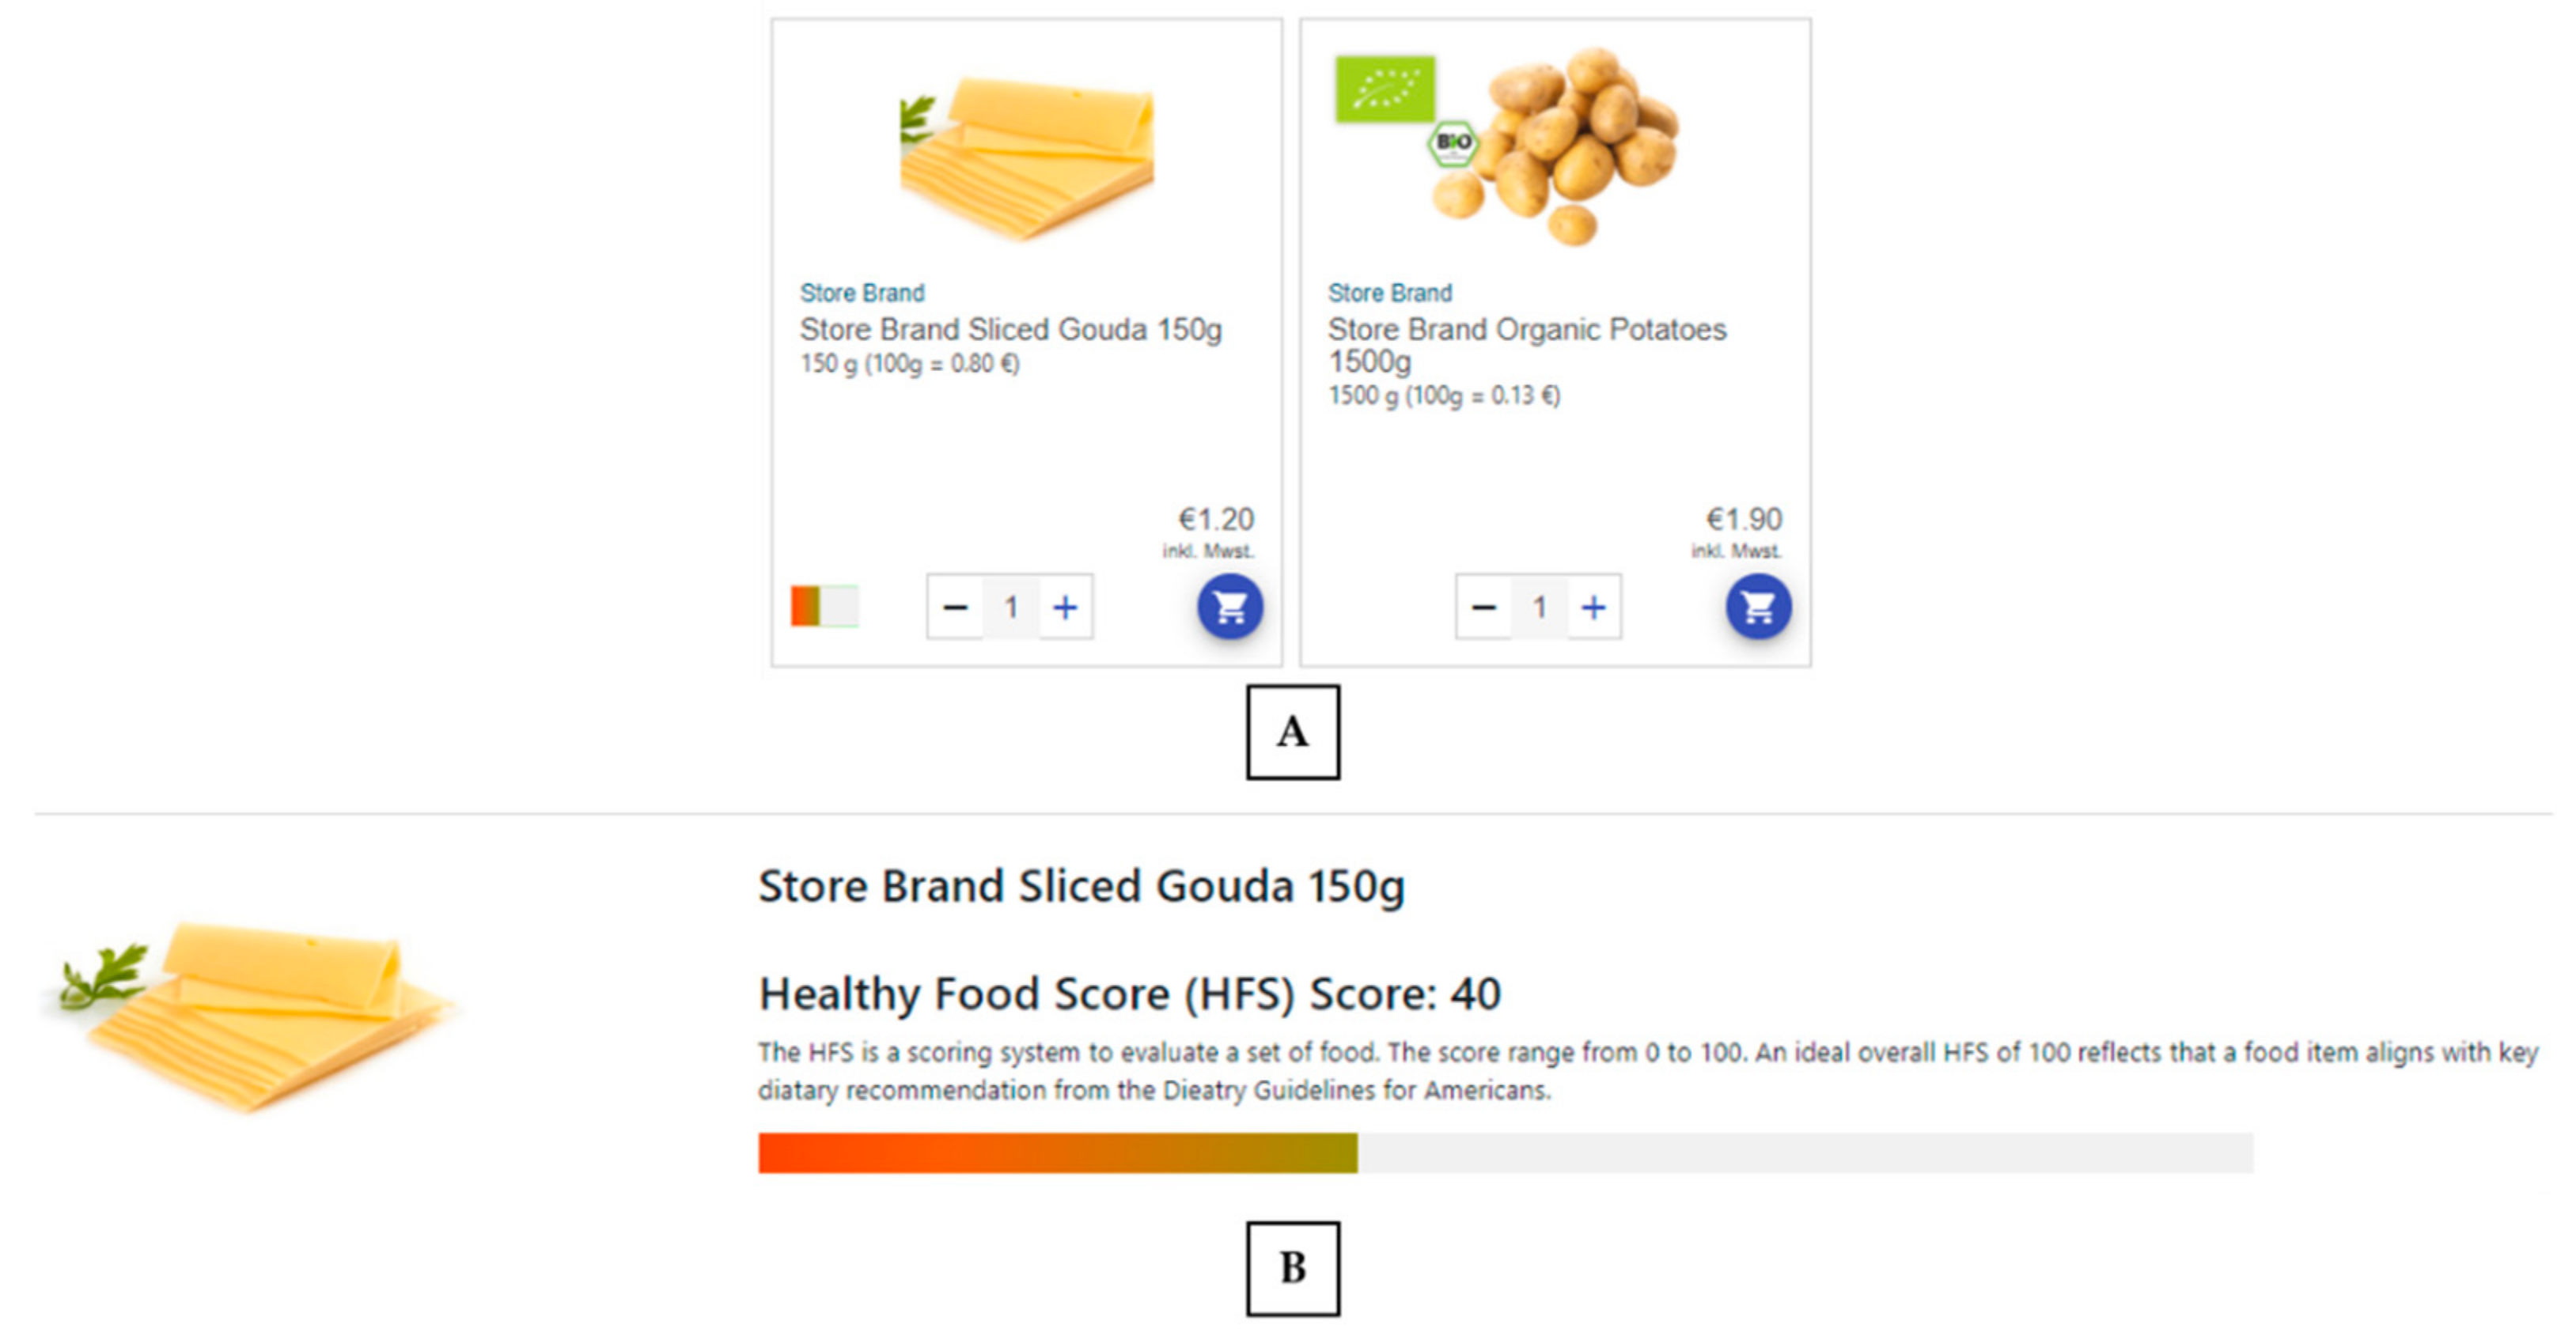
A VOS can support this type of research by allowing researchers to create a new binary or multi-level food labeling schemes and scores. These can be assigned to specific store items directly in the interface. Further, legal definitions or other explanations can be provided for each claim on the food label or score (Figure 6). Moreover, all product information and the nutrition facts labels (nutrition information panel) for each item in the database can be edited via the VAI.
Shoppers can access this information with just one click in shop view, and it is automatically recorded whether they have done so or not. This might be interesting because empirical evidence points out that some consumers willfully ignore information if it helps them avoid an inner conflict (e.g., animal welfare concerns vs. meat consumption; [55]). Moreover, those labels that guarantee only low sustainability standards or animal welfare might bias consumers to overrate the actual product quality in favor of these two aspects [56]. This has been referred to as the label halo effect [57].

2.3.4. Use Case Four: Virtual Shopping Carts

In contrast to traditional brick-and-mortar stores, consumers cannot physically interact with a salesperson in an online store. To compensate for this, vendors have already started implementing a wide variety of decision-support tools within their online shops. These tools aim to assist shoppers with their purchase; for instance, by providing information on demand (e.g., via a search-bar or a chatbot), (ii) providing real-time feedback (e.g., about spending), or (iii) present personalized product recommendations. According to Häubl and Trifts [58], the way in which consumers search for product information and make purchase decisions is always a result of the sum of all the single interactions with different decision-support tools available in an online shopping environment.
One decision-support tool and at the same time an integral part of every online store is a VSC. Even the most simplistic VSC enables consumers to accumulate all want-to-buy products in a list and provide real-time feedback about the price of their goods. In contrast to a shopping trip without decision support (e.g., in a physical store), this can increase consumers’ total spending and the spending for higher-priced, hedonic, or organic products [59,60]. Moreover, VSC’s lower transaction costs make it relatively convenient for consumers to adjust their current shopping cart by adding (or removing) single items or making changes in product quantity at any time and without much effort [61]. However, to the best of our knowledge, no research exists that analyzes the impact of different VSC designs on consumers’ food choices and in-store behavior.
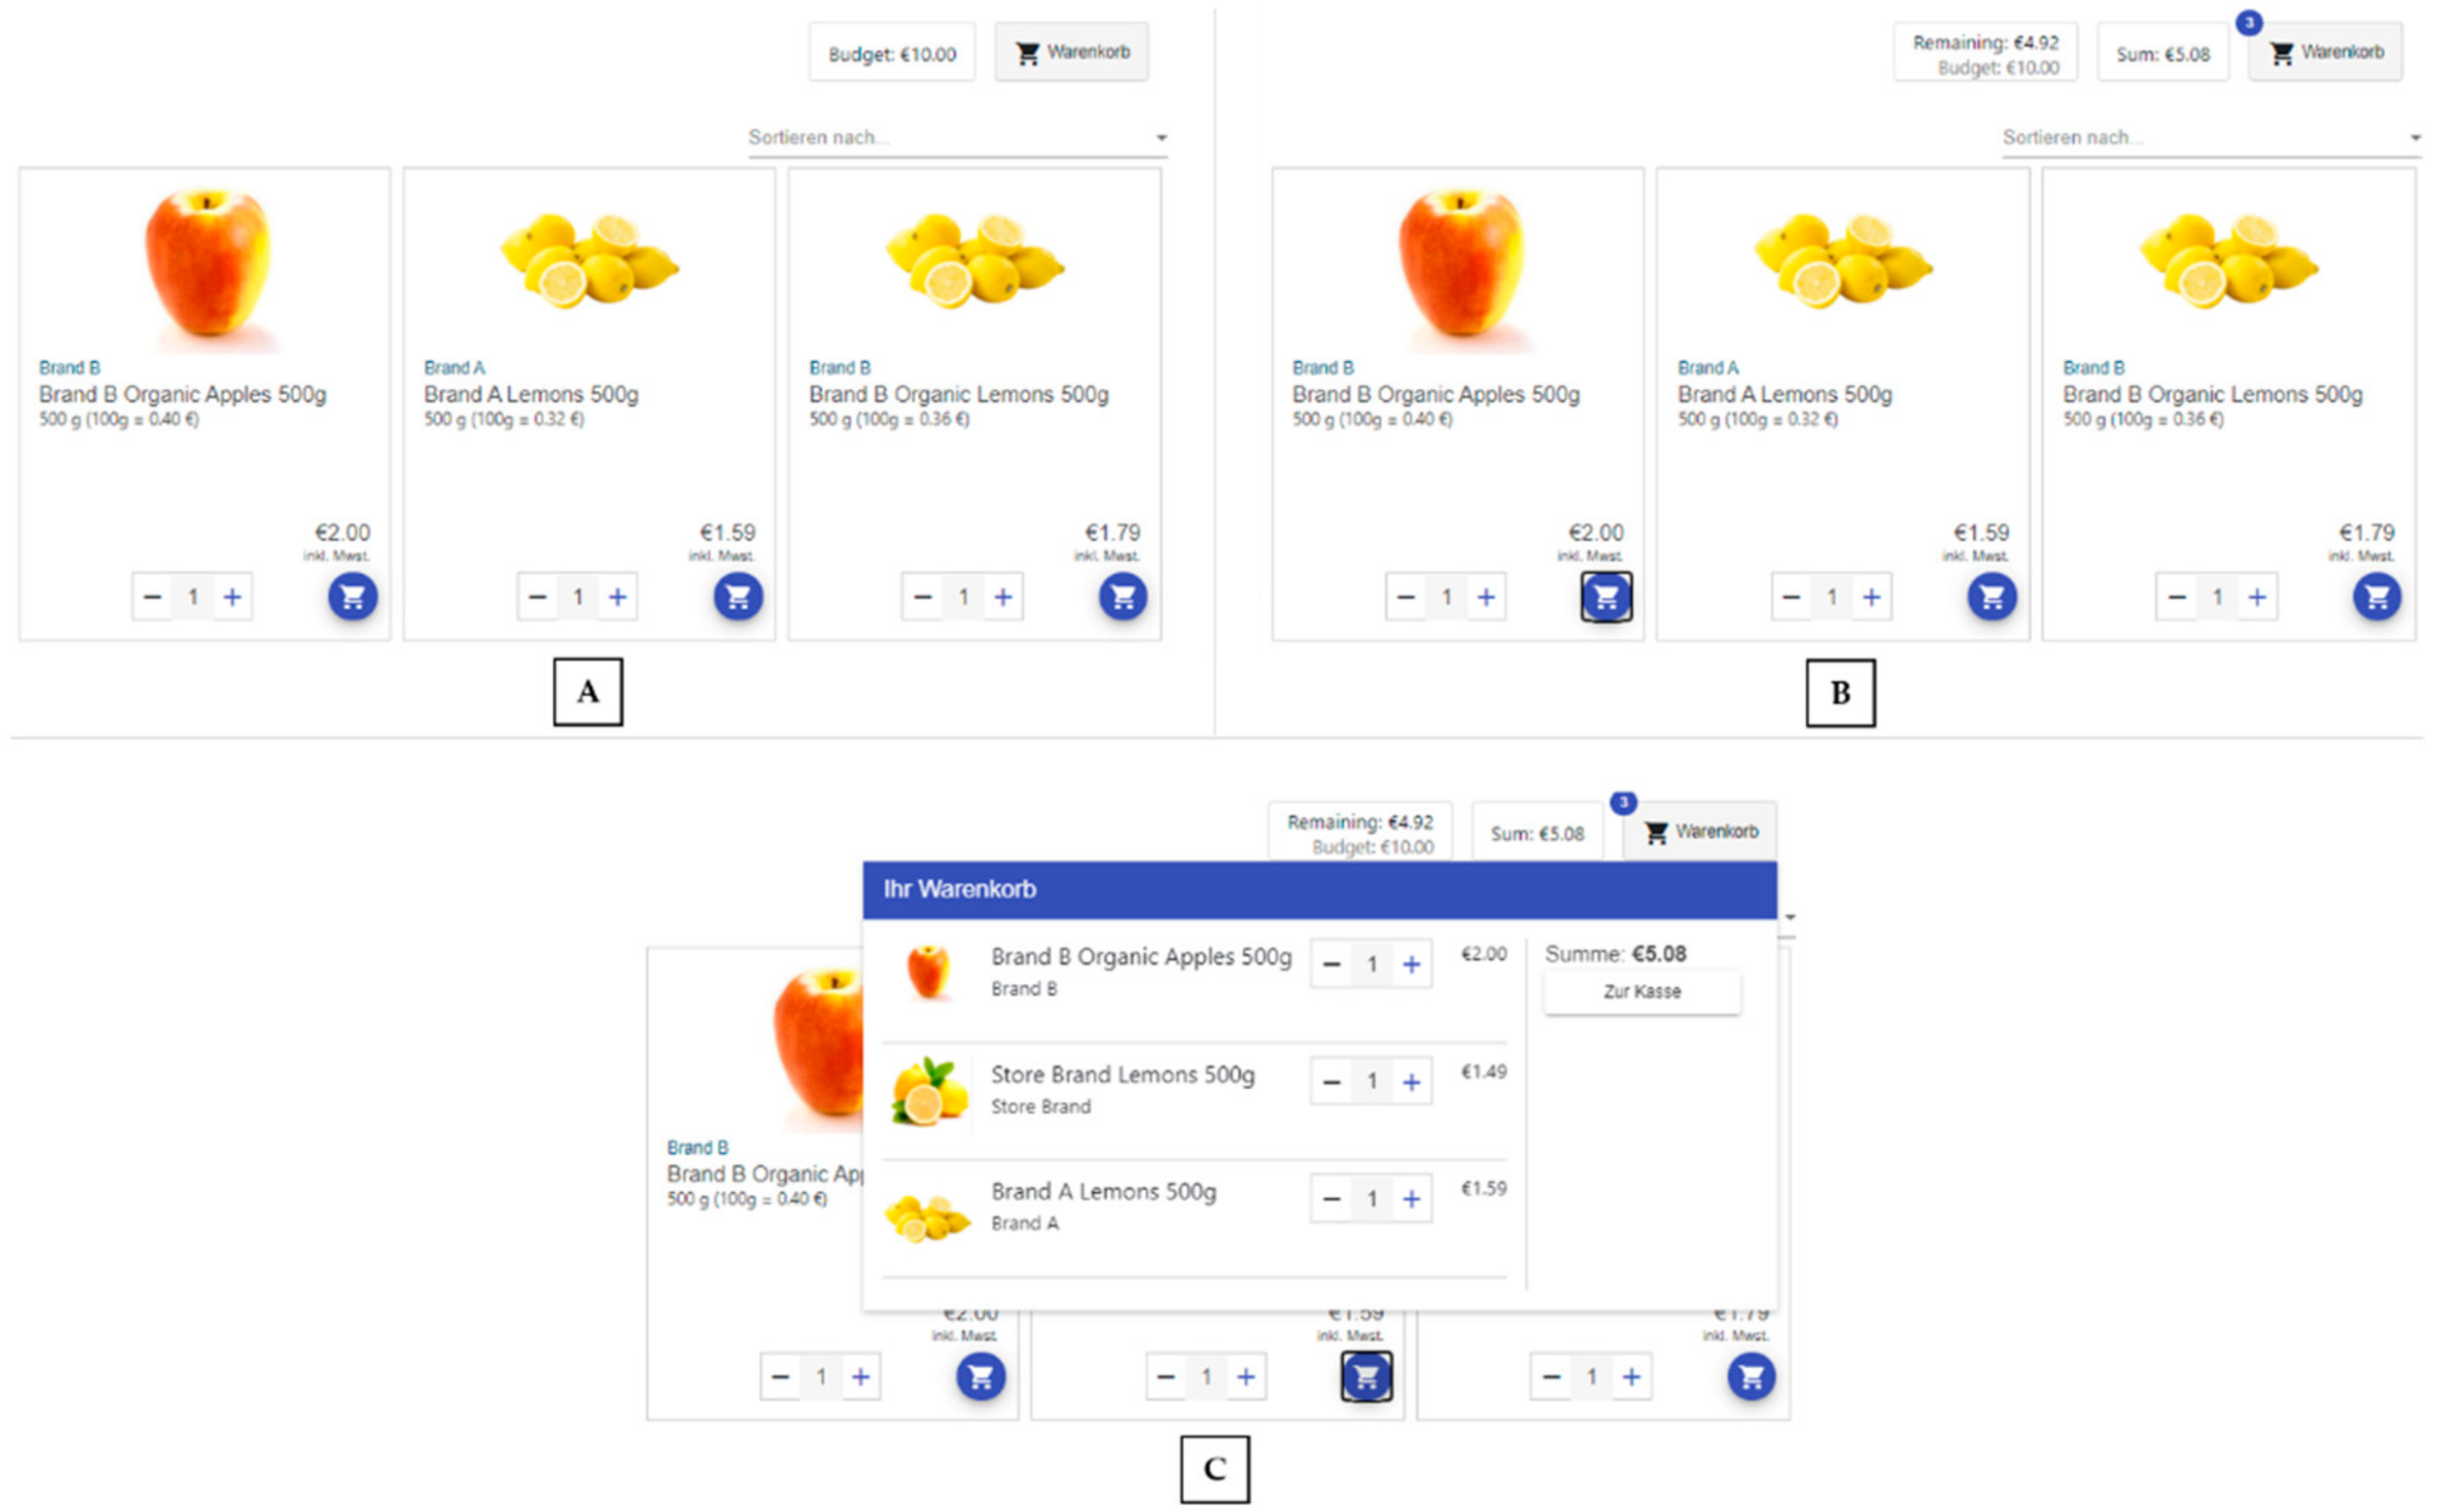
To capture this, VOS allows researchers to choose between three different types of VSCs: (i) “Icon Only”, (ii) “Icon Plus”, and (iii) “Pop-Up” (Figure 7). They vary in how many “clicks” a user has to invest in reviewing their present spending and adding, removing, or replacing items.
For the first type (Icon Only), only a small dynamic cart icon is displayed in the upper right corner of the header on category pages and product pages. This icon provides three basic functionalities: (i) notifies them when a new item is added to the shopping cart, (ii) shows the number of total items in the cart, and (iii) provides a link to a separate full-page cart. Only on the full-page cart can consumers find all the details of their transactions and edit their cart before continuing to shop or proceeding to the checkout page. The second type (Icon Plus) is identical to the previous version, except that the dynamic cart icon additionally shows the total spending. The third type (Pop-Up) includes a mini shopping cart, which will be displayed if users hover their mouse above the shopping cart icon. It is designed to provide users with a compact version of the main shopping cart page with all information and functionalities while keeping them on the product pages to continue shopping. Via the treatment configuration functions in the admin view, researchers can choose which VSC type they want to implement for which experimental treatment.

2.3.5. Use Case Five: Swap Options

We decided to include swaps as a second use case for decision-support tools because they represent a highly transparent and, at the same time, effective recommendation agent. On the one hand, users can easily identify when, where (type-transparency), how, and for what purpose (token-transparency) swap interventions were used [62,63]. On the other hand, various empirical studies document a statically significant effect of swap interventions on consumers’ food purchases in real and virtual supermarket settings [64,65,66].
However, there are still many open questions on the impact of swap interventions [66]. For instance, it is unknown which product categories and attributes consumers are more likely to accept swaps. In particular, there is no study to examine how effective this type of intervention is in promoting the sale of products with credence attributes like animal welfare or sustainability. Moreover, more evidence is needed to determine if swap interventions are more effective when presented immediately (e.g., after clicking on the “Add to Cart” button) or when bundled at checkout [25]. The same applies to the degree of freedom of choice that consumers should be given. For instance, should swaps options be automatically displayed per default, or should consumers be obliged to determine if and when swaps are displayed (forced-choice)?
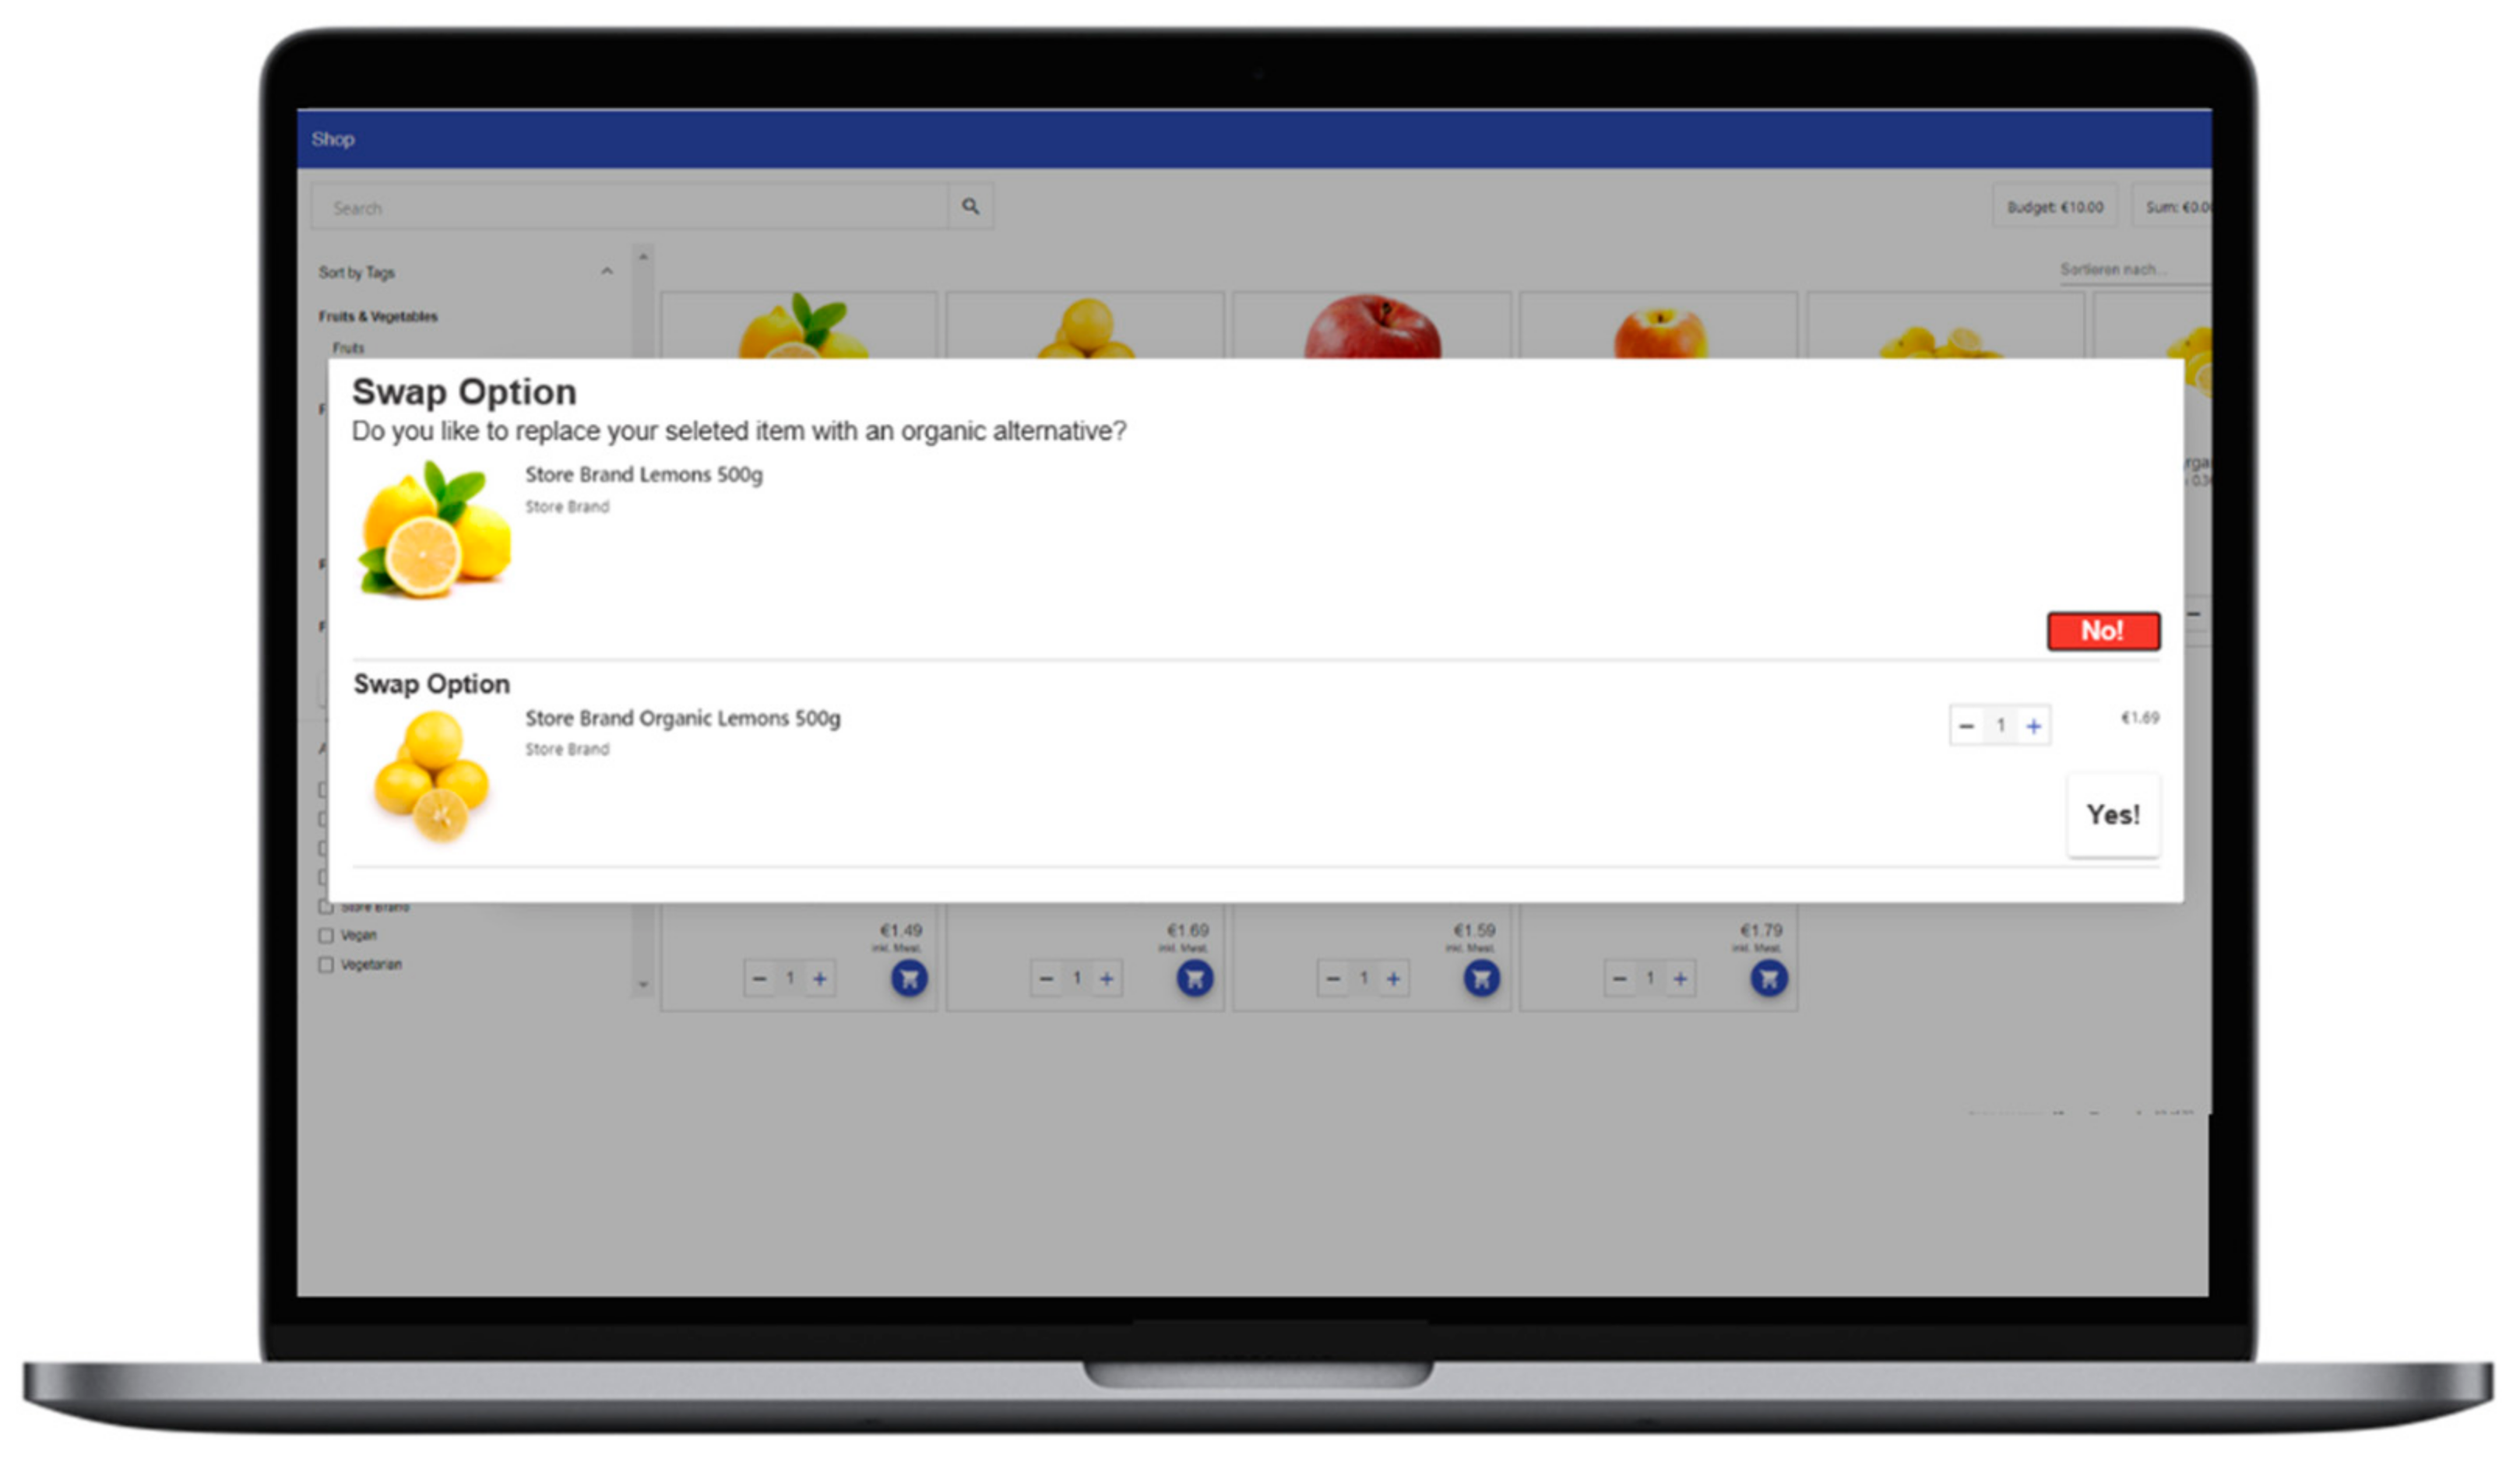
To address these and similar research questions, VOS provides swap options for food items at different points of the shopping trip: (i) when adding items to the shopping cart or (ii) when finishing the shopping trip by checking out (see Figure 8).
In each case, a pop-up notification informs participants that a swap option is available for the chosen product(s) (swap dialog). In addition, it can also be left for participants to decide whether they want to receive swap options or not (forced-choice). In this case, the swap dialog does not automatically provide a swap option. Instead, participants can determine whether they want to (i) see swap options if available or (ii) not to receive future notifications about swap options. Again, researchers can configure these aspects directly in the VAI. Unfortunately, so far, the VAI cannot define which swap options should be shown for which item. Instead, swaps must be assigned in the original product database on which the application is based. You can find more information about this procedure in the VOS User Guide.

2.4. Data Recording: Behavioral Outputs and Instore Behavioral Dynamics

The data’s scope automatically recorded by the application includes many outcome variables that cover participants’ purchases by default. However, by focusing on these outputs, in-store decision-making happens largely within a black box [67,68]. Hence, researchers interested in more in-depth insights about subjects’ shopping also need data on in-store behavioral dynamics. However, this kind of data is often not available or has to be reconstructed laboriously, e.g., by using complex procedures like video screen-capturing [69].
The VOS records several actions taken by a subject during an experimental shopping trip automatically in code to counteract this. This includes the navigation path (routing), filtering or sorting options used, all actions taken on a page (pagination events), and all additions, changes, and removals to and from the shopping cart. This data can later be converted into variables and thus used for statistical analysis. In this manner, we receive (among others) information about a shopper’s (i) shopping duration, (ii) first orientation time on the website, (iii) the add-purchase-ratio for items in the VSC, or (iv) the number of detailed product views. Furthermore, some use case-specific data is recorded. For example, for “Sustainable Swap Interventions”, data is recorded on (i) which item triggered a swap dialogue, (ii) the time when a swap dialogue starts/ends and (iii) whether a swap option offered was accepted or rejected. As each action has a unique timestamp, instore-behavior data can be used for aggregate-level analyses and in-depth analysis like tracking a single user’s behavior on the website. All data can be downloaded from the server in JavaScript Object Notation format and reformatted in any number of ways. Example scripts for extracting and reformatting the data can be found in the VOS User Guide.
In addition to behavioral data, it is possible to obtain further self-reported data by including configurable questionnaires. These can be positioned before and/or after the actual shopping task. Thus, they can function as screening questionnaires, comprehension checks, manipulation checks, or post-experimental questionnaires.

3. Using a VOS: Results from a Pilot Study

This section describes the results gained from a pilot study aiming to evaluate the app’s technical functionality and gain feedback about users’ shopping experience. For this study, we used the base version of our application, which was populated with a representative stock of food-items. Subjects in our study were free to choose between 6619 food items from seven general categories. However, this product database comes with a few drawbacks, especially compared to the offline shopping experience. This includes an over-representation of certain food categories. For instance, convenience foods and goods with long shelf lives are more commonly available in online supermarkets.
Since it is the application’s primary objective to enable researchers to conduct meaningful experiments, it needs to be able to generate genuine user data. Hence, this study should also verify if users have the sensation of interacting with a real online shopping environment. Additionally, it aimed to generate feedback for further refinement and development of the online shopping experience. Finally, yet notably, the pilot study served as a showcase to illustrate which data can be obtained from using the VOS and how it can be analyzed. The design and results of this pilot study are described below.

3.1. Procedure

The study was conducted online over ten days in December 2019. Subjects were recruited from a pool of students and university staff members. In total, the VOS was intensively tested among 29 people. All subjects had to complete the same shopping task. In particular, they were asked to shop for groceries to cover their household’s needs for one week. Subjects were prompted to select items and amounts similar to their actual grocery shopping behavior. There were few restrictions except that subjects were obliged to shop at least 12 unique items to complete the task. This was imposed for two reasons: (i) 12 items is the average number of products bought per supermarket trip (e.g., [70]) and (ii) we wanted to ensure that participants are interacting with the application seriously. Yet, subjects in our study did not actually purchase the selected items. Nonetheless, previous studies have illustrated that even hypothetical purchasing scenarios can provide pertinent data, in particular when focusing on in-store behavior rather than on analyzing the final VSC [71,72].
After subjects completed this task, they were asked to evaluate their shopping experience with a questionnaire. Besides, basic demographical facts, individuals’ grocery shopping habits, and basic economic data were queried.

3.2. Results and Discussion

None of our subjects reported any major technical problems with the VOS, and all data was accurately sent to our server. The subjects covered a wide age range from 18 up to 54 years (M = 28.76). Most subjects had a high level of education (this criterion was fulfilled if subjects indicated to hold at least a high school diploma) (75.9 percent), were single (51.7 percent), and lived in their own apartment (62.1 percent). This suggests that most subjects were responsible for grocery shopping in their households. Indeed, on average, they went grocery shopping 2.55 times per week and spent €30.10 per shopping trip.

3.2.1. User Experience

Further, we used four constructs to measure users’ experience with the VOS regarding their (i) general satisfaction (GS) with the application, (ii) its information quality (IQ), (iii) its system quality (SQ), and (iv) its realism level (RL). Table 1 provides an overview of all subconstructs belonging to these constructs and the associated descriptive statistics (for a complete overview of all questionnaire items used, see Appendix B). All items were measured using a seven-point Likert scale.
Overall, subjects were satisfied with their shopping experience in our online supermarket (GS.01mean: 4.89), and their expectations of the application were mainly met (GS.02mean: 4.96). In addition, the subjects agreed rather than disagreed on average with the statement “I would buy groceries in a real online supermarket, similar to the VOS” (GS.03mean: 4.93). Concerning the information quality, subjects predominantly rated the understandability (USSmean: = 5.68), reliability (RSmean: = 5.73), and usefulness (UFSmean: = 5.02) of the available product information positively.
The subjects were satisfied with information quality and system quality (SQmean: 5.43). In particular, subjects rate usability of our tool positively (USAmean: 5.80). For instance, they perceived good responsiveness (SQ.01mean: 6.00) and fast loading times (SQ.02mean: 6.04). Additionally, the tool’s user-friendliness was evaluated positively (UFSmean: 5.22). For instance, subjects stated that the shop had a straightforward design (SQ.10mean: 5.61), a simple layout (SQ.04mean: 5.7), where all functions could be found as expected (SQ.06mean: 5.71) and was easy to use (SQ.05mean: 5.96). In sum, the feedback indicates that the design and structure of the shopping user interface (UI) successfully guided our users. In this article, we refer to the term user interface (UI) to describe the graphical environment (shop view) that allows users to interact with an online shop.
However, comments in a free text field yielded valuable hints at what users perceived to impede their shopping experience. The main criticism referred to the free-text search bar at the top of the page because only specific terms yielded the desired results (e.g., baked beans vs. beans). This was mainly due to the information quality of the item pool. Here, the free-text search’s current implementation was based on pattern matching of the search term in the item name and brand attributes. For a more refined product search experience, well-annotated item data would be necessary. Secondly, several participants had issues with the absence of components usually featured in online shops. For example, they mentioned missing a landing page, remarked an unusual color scheme for a grocery store, and the absence of advertising, upselling, and product suggestions. These are valid points of criticism, but they were deliberately not included in the project’s scope. These features are broad and can be implemented in any fashion. We decided against having these in the base version of the application because their functionality is specific and not easily configurable.
Despite these limitations, subjects reported that VOS gave them the feeling of using a real online store (RL0.1mean: 5.32). Further, they stated that their purchases (RL.02mean: 5.61) and in-store behavior (e.g., use of information) were mostly in line with their usual shopping habits (RL.03mean: 4.93; RL.04mean: 5.29). Hence, the average realism level score of 5.28 points indicates that a VOS can convey an experience similar to a real online supermarket and can generate meaningful data about customer behavior exhibited. The next section shows exemplarily how this data might be analyzed.

3.2.2. Purchase Data

Besides user experience, we were also interested in finding out whether the application is able to provide a usable data structure for analyzing participants’ purchases. For this purpose, participants’ final shopping cart was recorded. Table 2 provides an overview of the variables we used exemplary for our study. Presented variables are only a selection of possible outcome-variables that might be calculated from the recorded data. For instance, as evident from the table, we focused on organically produced foods and store brands. However, these variables can easily be adapted for other product attributes like vegan, animal welfare, local origin, and much more.
It must be kept in mind that we primarily wanted to evaluate the functionalities of our application. Due to the small number of participants, no generalizable statements about shopping behavior in an online supermarket can be derived from this pilot study. Moreover, for the same reason, our data is biased by outliers. For this reason, we opted to report the median instead of the mean in the following.
However, in total, 788 items have been purchased, which is an indication that the VOS was tested extensively. On median average, subjects purchased 13 different food items. Moreover, total spending (median: €33.03) was relatively close to most subjects’ self-reported expenses for groceries per shopping trip (median: €25.00). Together with the median average basket size (18 items), subjects showed realistic shopping behavior. This impression coincides with subjects’ self-reported realism level presented in the previous section. The share of organic items in total purchases was relatively high (median: 26.67 percent) compared to the market share of organic food in Germany (11.97 percent in 2019; see [73]). Further, the majority of purchased organic food items were store brands (median: 85.00 percent). This is not surprising, as price premiums for organic food are high, and store brands can offer cheaper alternatives to other organic food brands.

3.2.3. In-Store Behavior

We used data about participants’ interactions with the website to derive several variables that helped us analyze participants’ in-store behavior dynamics while shopping online for groceries. Table 3 provides an overview of all considered variables and how these were conceptualized. The selection of variables presented here is based on our own research interests. Of course, researchers are not limited to this set of variables but can adapt or extend it to their own research question.
As evident in the table, subjects spent on median an average of 6 min and 19 s shopping in our virtual online supermarket. Hence, shopping was faster than previous studies, indicating where estimates for average (online) supermarket shopping durations ranged between 13 and 40 min [7,67,70]. The average number of total user interactions was relatively low (median: 47.00), and it took subjects on median an average of just 3.62 interactions on the website to purchase an item. Consequently, many selections were made without having viewed many different pages beforehand.
Moreover, most subjects did not or only slightly adjusted their VSC during their shopping trip. In particular, items were rarely removed or edited once they had been added to the shopping cart (e.g., change in amount). Consequently, the add-to-purchase ratio was almost one on average (mean: 0.96), respectively, the median average. Further, the cart-to-detail ratio (median: 0.14) is an indicator that subjects have not viewed the detailed product pages for the majority of items selected. Hence, it can be stated that most subjects in this sample showed a straightforward shopping behavior. They were not interested in extensively browsing and comparing different products in our online supermarket. Instead, purchasing decisions were made relatively quickly in most cases, without looking at individual items in more detail. This behavior is consistent with shopping patterns found in brick-and-mortar supermarkets (e.g., [74,75]). On median average, after logging onto our virtual online supermarket, it took subjects less than one minute to add their first item to the cart. In addition to subjects’ self-reported user experience, we considered this another indicator for good usability and user-friendliness of our tool.
Overall, data from this pilot study suggests that subjects exhibited a reasonable purchasing behavior and the application gave them the impression of shopping at a real online supermarket. This indicates that the VOS can convey an experience similar to a real online grocery store, thereby generating meaningful data about its customers’ behavior. Moreover, it recorded all actions taken by the individual subjects and provided this data as expected. Hence, VOS supplied the necessary means for conducting our study.
While users evaluated their experience predominantly positively, feedback also suggests areas for improvement: Regarding system quality, future research projects may improve query and data retrieval between front- and back-end. The free-text search bar, which currently only operates on searching the queried term in the product’s name or brand, should be extended to provide higher versatility. Furthermore, researchers may direct their attention towards augmenting the shopping experience, e.g., by implementing a dedicated landing page where subjects start their shopping task. Similar considerations apply to product pages. In addition, the user experience may benefit from viewing multiple product images, choosing between different display formats (e.g., zoom), or having complementary media such as product videos available.

4. Conclusions

This paper introduced the VOS, an open-source web-based application designed to run computer-simulated shopping experiments. While its front-end emulates a modern online supermarket’s design and functions, its back-end provides a visual administration interface that enables researchers to create and modify different experimental conditions easily. This feature makes VOS a modular, highly customizable, and usable research tool for analyzing consumer behavior in (online) supermarkets. Researchers can build on several preconfigured use cases to implement and test different in-store interventions, including economic incentives and choice architecture techniques. The base version already includes possibilities to configure (i) taxes and subsidies, (ii) product arrangement and placement, (iii) product labeling, and to choose between different (iv) types of VSCs and (v) swap options. Further, we present the results from a pilot study, which showed that the functionalities of our tool have been working and subjects evaluated their shopping experience to be realistic and user-friendly.
We considered the VOS to be a useful tool for testing a broad range of policy interventions in a realistic online shopping environment. This can be done at relatively low cost, without a complex implementation process, and without collaborating with a specific retailer. Hence, the VOS offers researchers the opportunity to heighten the realism level of their experimental designs. Moreover, vast options for automatic data recording allow analyzing purchases and bringing light into the black box of consumers’ in-store decision-making. In further analyzing the particularities of digital interactions in online grocery, scholars could also shed further light on ethical strings attached to influencing users and customers in digital environments [76].
In summary, we hope that our tool will support researchers in exploring key issues that might be conducive to understanding and promoting sustainable consumption. Policy makers and industrial stakeholders can benefit from knowledge that informs the design of future policy interventions, (in-store) marketing communication, product packaging, or the shop design of (online) supermarkets in general.

Supplementary Materials

The following materials are available online at https://www.mdpi.com/article/10.3390/su13084375/s1, VOS User Guide.

Author Contributions

Conceptualization, N.E., T.-B.L. and A.B.B.; Data curation, N.E.; Formal analysis, N.E.; Investigation, N.E. and T.-B.L.; Methodology, N.E., T.-B.L. and A.B.B.; Project administration, N.E., T.-B.L. and A.B.B.; Supervision, A.B.B., K.B. and L.M.K.; Validation, N.E., T.-B.L. and A.B.B.; Visualization, N.E. and T.-B.L.; Writing—original draft, N.E.; Writing—review & editing, T.-B.L. and A.B.B. All authors have read and agreed to the published version of the manuscript.

Funding

The research (excluding the open access publication) has partly been supported by (1) “Animal Welfare in Intensive Livestock Production Systems”, a PhD Program by the Ministry of Science and Arts in Lower Saxony, Germany, and (2) “Mobility Opportunities Valuable to Everybody” (MOVE), an Interreg project supported by the North Sea Program of the European Regional Development Fund of the European Union. Besides this, the research received no external funding.

Institutional Review Board Statement

Not applicable.

Informed Consent Statement

Not applicable.

Data Availability Statement

Not applicable.

Acknowledgments

We acknowledge support by the Open Access Publication Funds of the University of Goettingen. Further, we would like to thank Sebastian Kuiter for the extensive programming and technical support. Moreover, we thank our following interview partners for their time and consideration: (1) Paolo Crosetto, Senior Researcher at the French National Research Institute for Agriculture, Food and Environment (INRAE); (2) Achim Spiller, Professor of “Marketing for Food and Agricultural Products” at the Georg-August University of Göttingen; (3) Stefan Morana, Senior Researcher with the group Information Systems and Service Design at the Karlsruhe Institute of Technology (KIT); and (4) Alfred Benedikt Brendel, Professor for Business Informatics, especially Intelligent Systems and Services at the Technische Universität Dresden.

Conflicts of Interest

The authors declare no conflict of interest.

Appendix A. Brief Information about Technology and Programming

Appendix A.1. Application Development Frameworks

Our application is built upon two development frameworks to decrease development time, reduce maintenance cost, and quality assurance reasons. For the back-end, Node.js is used to make a web-based service, provide an Application Programming Interface (API) for handling requests, and run Create Read Update Delete (CRUD) operations on the database. Second, for implementing the web, the front-end Angular version 8 is used. Both frameworks are based on JavaScript.

Appendix A.2. Model View Controller (MVC)

The implementation style of our application follows the model view controller (MVC) concept. Working with MVC in web application development is different from conventional application development. The architecture has to be partitioned between the client and the server-side. The client-side always handles a web application’s view, but the model and controller can be partitioned in various ways between the client and server. Hence, a compelling architecture would rely exclusively on the server to refresh the client’s screen. In this case, the model and the view-generating logic for the client’s browser would reside entirely on the server. Moreover, the controller would partially reside on the client (detecting user interaction) but mostly reside on the server (code that updates the state of the model’s business objects based on a HTTP request). This describes a thin-client approach with the advantages of decreasing the client machine’s performance demand and providing greater security, performance, and data consistency for the application. Web application frameworks that reflect this paradigm are Django and ASP.NET.
The other extreme is maintaining the bulk of the application on the client-side (fat-client approach). This means that the model mostly resides on the client-side, but the database remains on the server-side. In particular, the view is exclusively implemented on the client-side, and the controller mostly resides there. This provides a more seamless and interactive experience through fewer load times, minimizing the need to make server calls. Frameworks that support this style of partitioning are AngularJS, EmberJS, and JavaScriptMVC.

Appendix A.3. Front-End Programming

The views are built directly with HTML5 in conjunction with style sheets written in SCSS (Sassy CSS) to provide a visually appealing and user-friendly experience. This combination is supported by most browsers natively, which means a wide range of devices can be supported. In this way, a responsive front-end web design is provided, which is consistent between devices and browsers. This combination allows for the separation of presentation and content, the reduction of repetitive code, flexibility, control of the presentation, and sharing of formats between views. The web-view also utilizes Bootstrap and Angular Material, which are CSS libraries that offer standardized web-content styling and component options. Therefore, developers benefit from the ease of use and accessibility of these frameworks for building visually engaging views. Moreover, they are still able to determine custom styles and layouts centrally.
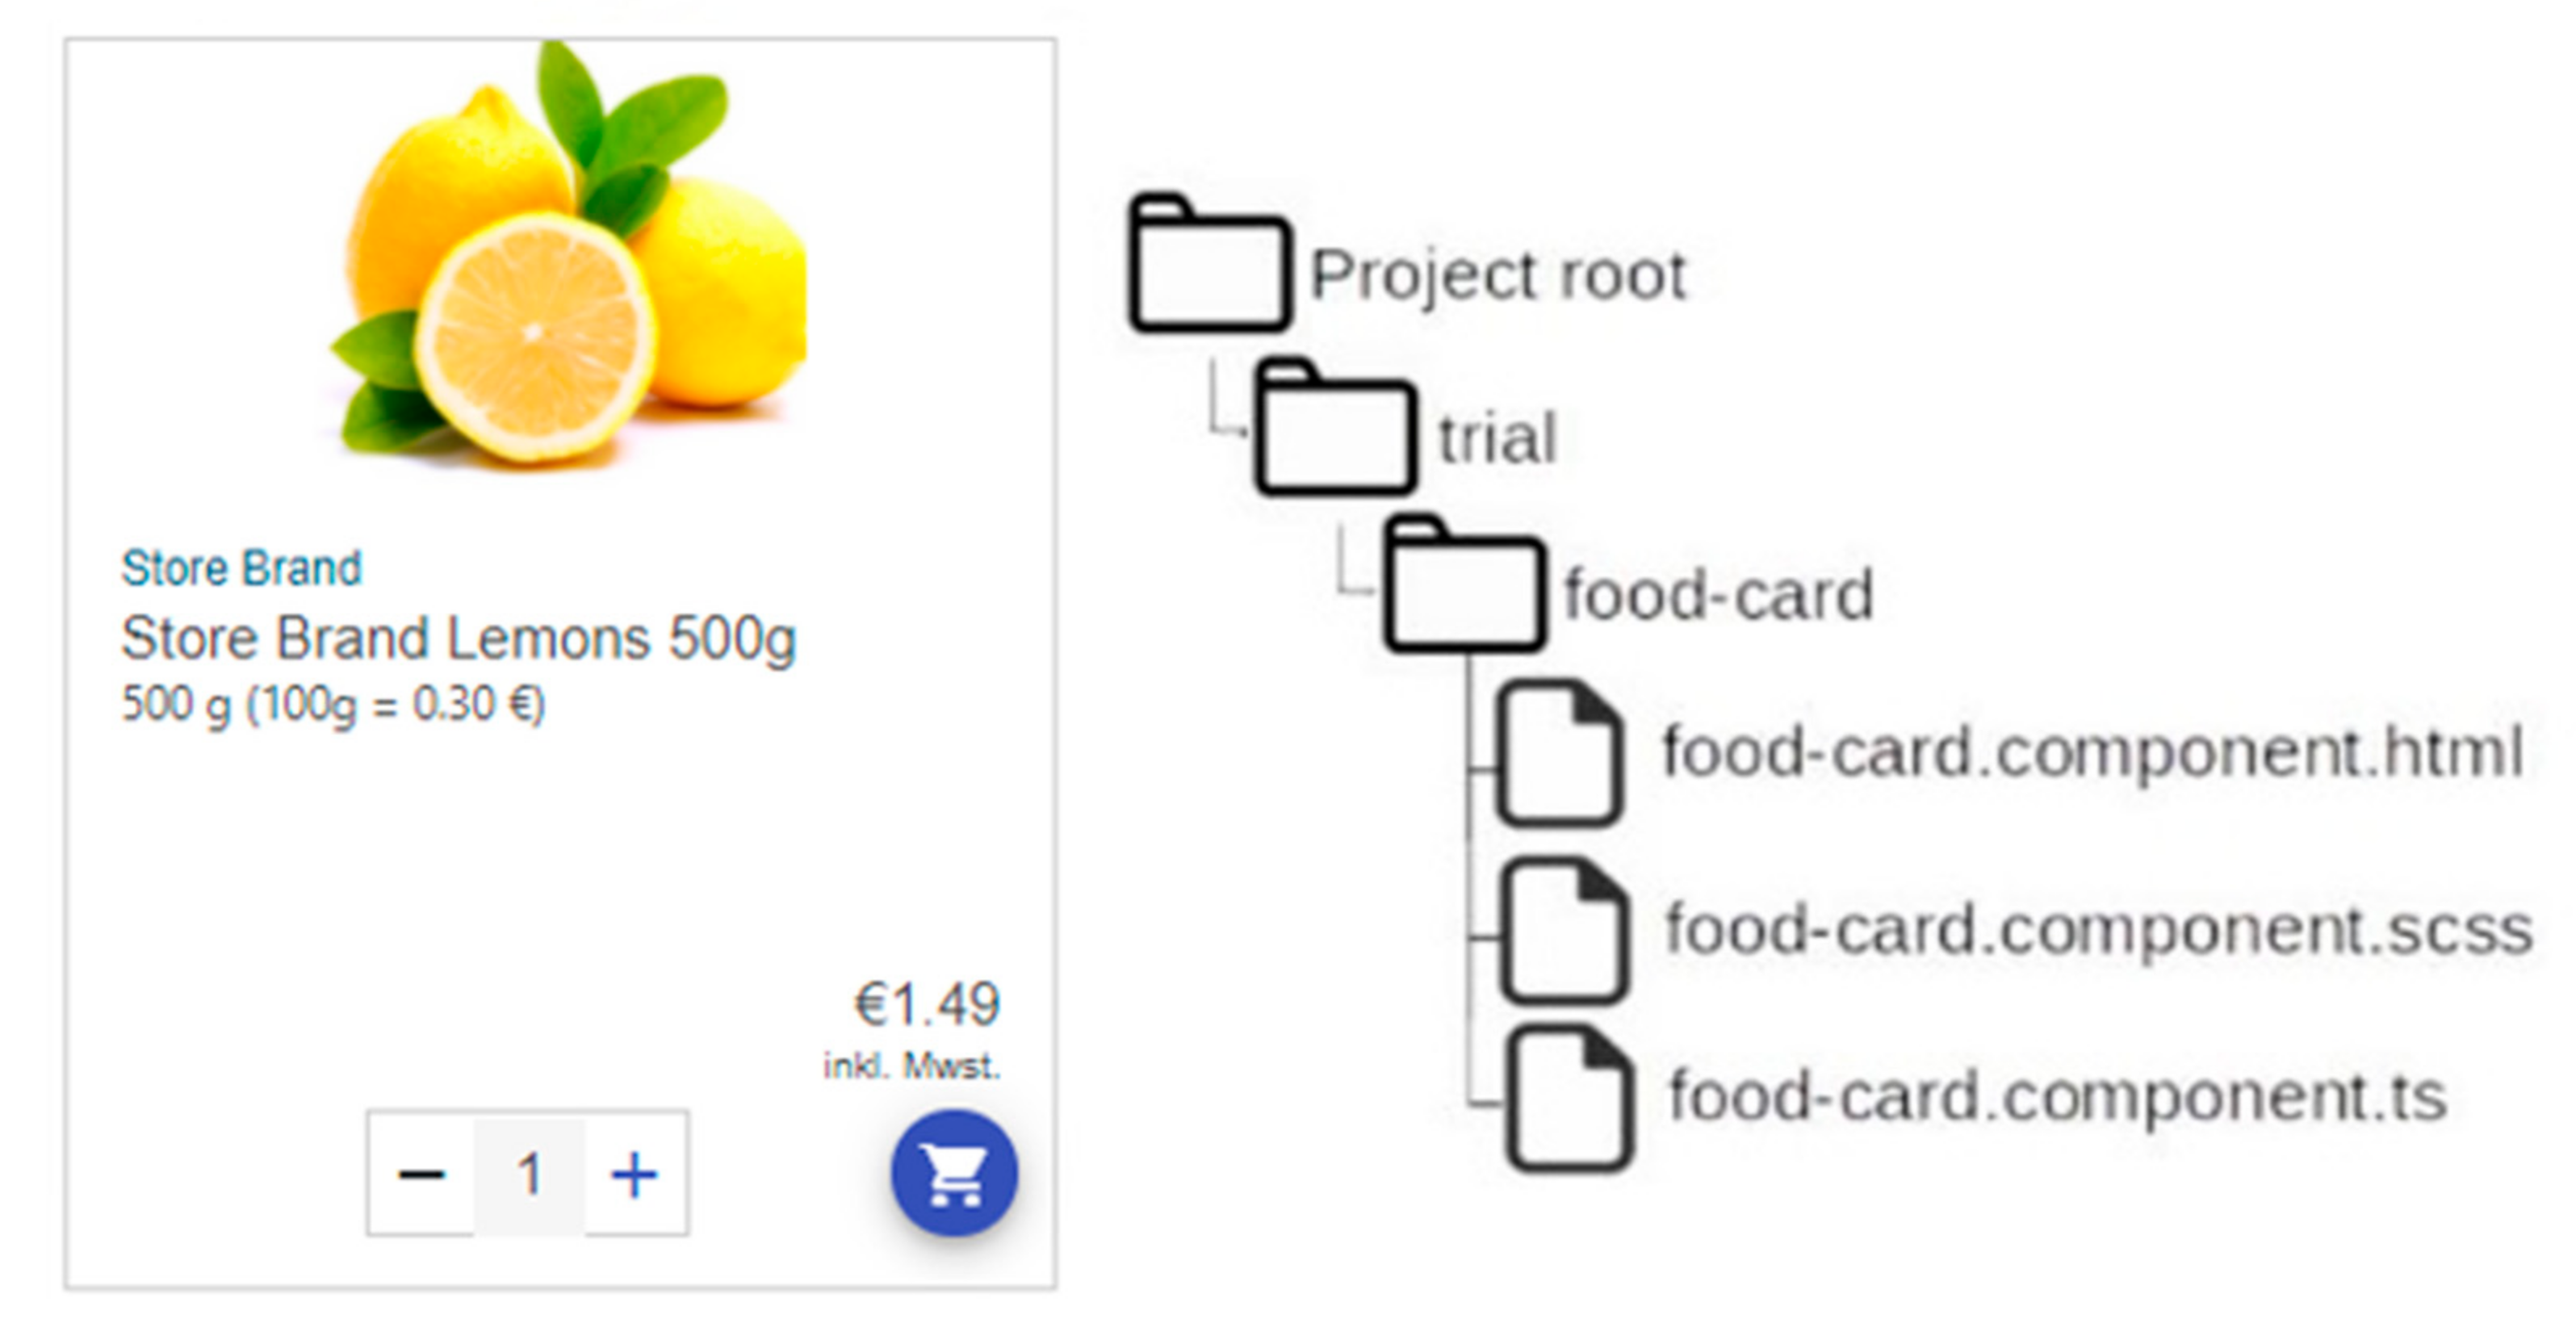
The front-end codebase is designed and implemented to deliver an accessible experience both to users and developers. Features and design elements are designed to encapsulate specific functionality or business logic. Hence, the code is partitioned into feature modules (which house the model’s logic), view, and controller, represented by the components contained. Utilizing this implementation logic makes it easy to tease apart singular design elements, use case implementations, and feature sets for subsequent expansion and development. Singular design elements of the application are thus contained in one subfolder easily recognizable (see Figure A1).
Figure A1. Example of component structure with design element “food card” on the left and associated folder structure representing the code on the right.
Sustainability 13 04375 g0a1
Changing the appearance or behavior of such a design feature would mean locating the associated component and altering the source files. These component definitions are divided into (i) the template (*.html file), which handles the display elements, (ii) the (*.sccs file), which defines the styles for this component, and (iii) the (*.ts file), which handles the data CRUD, data binding, and event handling of the specific component. In addition to this, the implementation of our application follows a strict separation of control. Functionality like data handling, CRUD operations, and event recording is centralized and separated from component view logic. Injectable services offer reusable access to functions, which are generally consumed by multiple components. Furthermore, the services are descriptively modeled to offer all functionality connected with a specific data model. For example, CRUD operations connected to the shopping cart component are combined into a shopping-cart.services.ts file. If any view component needs access to the specific functions and data of that topic, it has to inject the shared instance of the service into its constructor, thereby gaining access. This offers organized, reusable, and easy access to all operations needed throughout view components. Even if any implementation details change, these changes need only be applied in one file.

Appendix A.4. Back-End Programming

The back-end is a representational state transfer (REST) API. This exposes the data, functions, and facilitates the interaction between the database and the front-end application. Moreover, it exposes endpoints that respond to client requests in a predictable manner. The web services are stateless, as they do not maintain the state of each client application accessing the web-service, instead offering predefined sets of stateless operations. This allows it to remain independent of the front-end application, meaning that these web services may serve different client applications and can be interacted with or without using the front-end application. This independence offers the advantage that researchers are not limited to using the visual treatment edit interface to interact with and change treatment aspects or items. Scripts can be written that automate treatment creation, modification, and data analysis tasks (examples can be found in the VOS User Guide).
As mentioned above, the back-end is based on the application development frameworks Node.js, an event-driven JavaScript runtime environment that works outside of the browser. This allows for continuous utilization of JavaScript in both application areas and reduces entry barriers for developers, as only knowledge of one programming language is required.
However, using JavaScript for the REST API does not incur performance decreases, as could be generally expected. Node.js is built on the libraries V8 and libuv; these are responsible for partly converting the JavaScript code to C++ code, thereby combining the ease of use attributed to JavaScript and its high performance attributed to C++. It is also highly scalable without threading, instead of utilizing a simplified model of event-driven programming with callbacks to signal the task’s completion. However, this essentially single-threaded approach means that the application cannot scale vertically, which means that merely adding computing power to a given system will not directly translate to an increase in application performance. Despite this, it is still capable of scaling by running several concurrent instances of the same application within one cluster manager (cluster mode). This distributes the workload among the available application instances. A production-ready and open-source load balancing software for Node.js applications is already available free of charge; see, for example, PM2.
Moreover, the repository structure of the back-end application is modeled to promote easy access and understandability. Thereby, the subfolder structure represents the data structure utilized throughout the project. For instance, an item and all its associated CRUD operations are contained in one subfolder (see Figure A2): models (*.model.js files) enforce the document structure, routes (*.route.js files) define the request endpoints, and with that access to all the operations that can be performed on the data objects. Additionally, functions collect reusable logic used throughout the route definitions. Middleware functions (*.middleware.js files) provide necessary state information to the otherwise stateless endpoints. This makes the project accessible for further development, as the application structure can be deduced from the repository structure. Effects from changing aspects of the data structure are contained in this subfolder and do not affect the overall application. This makes it easy to add or change and customize the functions, data models, and route specifications implemented in the base application.
Figure A2. Sample repository structure as used in the back-end.
Sustainability 13 04375 g0a2

Appendix A.5. Availability

The code is developed using Git, a source-code versioning system. This encourages good backup and versioning practices and allows developers to synchronize files across computers, develop collaboratively, manage separate branches, and merge synchronization conflicts. The project is open for other researchers to join, collaborate, or just download the source code on GitHub. Developers will find more detailed information on the VOS programming in the VOS User Guide.

Appendix B

Table A1. List of questionnaire constructs and items.
IDDescriptionMeanMedianSD
Please rate the following statements:
GS.01I am satisfied with my shopping experience in this online supermarket.4.896.001.55
GS.02Overall, my expectations of shopping in this online supermarket have been met.4.865.001.26
GS.03I would buy food from a real online supermarket similar to this VOS.4.935.001.46
Please rate the understandability of the product information provided in the store. Product information provided in the store was generally…
IQ.01… unambiguous.5.506.000.92
IQ.02… easy to read.5.646.001.25
IQ.03… comprehensible.5.716.001.05
IQ.04… in general, understandable for me.5.866.000.89
With regard to reliability, the product information was…
IQ.05… trustworthy.5.686.001.02
IQ.06… accurate.5.716.000.85
IQ.07… credible.5.686.000.86
IQ.08… in general, reliable for making my purchase decision.5.866.000.71
With regard to usefulness, the product information was…
IQ.09… informative for my purchase decision.4.865.001.35
IQ.10… valuable for making my purchase decision.5.186.001.25
IQ.11… in general, useful for making my purchase decision. 5.045.001.35
Please rate the usability of the online store:
SQ.01Responsiveness (e.g., the online shop reacts quickly to queries).6.006.001.25
SQ.02Performance (e.g., loading times of text and graphics)6.046.001.20
SQ.03Technological modernness in general5.366.001.51
Please rate the user-friendliness of the online store with regard to whether…
SQ.04… its layout is simple.5.716.001.54
SQ.05… it is easy to use 5.966.001.11
SQ.06… it is well organized (e.g., functions are where you would expect them)5.366.001.70
SQ.07… it is possible to see as many products as possible at a glance5.046.001.69
SQ.08… it is possible to compare different products easily4.435.001.20
SQ.09… multiple product images and display formats are available (e.g., zoomed images)4.615.001.51
SQ.10… its design is clear5.616.001.10
SQ.11… it is user-friendly in general5.076.001.63
Navigation: The navigation on the site has made it possible…
SQ.12… to easily go back and forth between pages.5.506.001.37
SQ.13… to locate the information I need with just a few clicks.5.356.001.04
SQ.14… to locate the products I prefer as quickly as possible.5.076.001.61
SQ.15… to edit my shopping cart as quickly and easily as possible (e.g., to add products).5.796.001.32
SQ.16… to easily navigate in general.5.686.001.19
Please tell us to what extent you agree with the following statements:
RL.01The design of the website has given me the feeling of using a real online store.5.326.001.59
RL.02Product selections and the price of my total shopping cart corresponds to my regular shopping behavior.5.616.000.92
RL.03The decisions I have made reflect exactly how I would behave on a regular shopping trip.4.935.001.65
RL.04The information which I gathered while shopping reflects my behavior on a regular shopping trip.5.296.001.27
Notes: Items have been translated from German. All items have been measured on a 7-point Likert scale (1 = “I do not agree at all” and 7 = “I completely agree”).

References

  1. Hertwich, E. Assessing the Environmental Impacts of Consumption and Production: Priority Products and Materials; UNEP/Earthprint: Hertfordshire, UK, 2010. [Google Scholar]
  2. Willett, W.; Rockström, J.; Loken, B.; Springmann, M.; Lang, T.; Vermeulen, S.; Garnett, T.; Tilman, D.; DeClerck, F.; Wood, A.; et al. Food in the Anthropocene: The EAT–Lancet Commission on healthy diets from sustainable food systems. Lancet 2019, 393, 447–492. [Google Scholar] [CrossRef]
  3. Hoek, A.; Pearson, D.; James, S.; Lawrence, M.; Friel, S. Healthy and environmentally sustainable food choices: Consumer responses to point-of-purchase actions. Food Qual. Prefer. 2017, 58, 94–106. [Google Scholar] [CrossRef]
  4. Guthrie, J.F.; Mancino, L.; Lin, C.-T.J. Nudging Consumers toward Better Food Choices: Policy Approaches to Changing Food Consumption Behaviors. Psychol. Mark. 2015, 32, 501–511. [Google Scholar] [CrossRef]
  5. Reisch, L.; Eberle, U.; Lorek, S. Sustainable food consumption: An overview of contemporary issues and policies. Sustain. Sci. Pr. Policy 2013, 9, 7–25. [Google Scholar] [CrossRef]
  6. Pitts, S.B.J.; Ng, S.W.; Blitstein, J.L.; Gustafson, A.; Niculescu, M. Online grocery shopping: Promise and pitfalls for healthier food and beverage purchases. Public Health Nutr. 2018, 21, 3360–3376. [Google Scholar] [CrossRef]
  7. Anesbury, Z.; Nenycz-Thiel, M.; Dawes, J.; Kennedy, R. How do shoppers behave online? An observational study of online grocery shopping. J. Consum. Behav. 2016, 15, 261–270. [Google Scholar] [CrossRef]
  8. Hartmann-Boyce, J.; Bianchi, F.; Piernas, C.; Riches, S.P.; Frie, K.; Nourse, R.; Jebb, S.A. Grocery store interventions to change food purchasing behaviors: A systematic review of randomized controlled trials. Am. J. Clin. Nutr. 2018, 107, 1004–1016. [Google Scholar] [CrossRef]
  9. Münscher, R.; Vetter, M.; Scheuerle, T. A Review and Taxonomy of Choice Architecture Techniques. J. Behav. Decis. Mak. 2015, 29, 511–524. [Google Scholar] [CrossRef]
  10. Hollands, G.J.; Shemilt, I.; Marteau, T.M.; Jebb, S.A.; Kelly, M.P.; Nakamura, R.; Suhrcke, M.; Ogilvie, D. Altering micro-environments to change population health behaviour: Towards an evidence base for choice architecture interventions. BMC Public Health 2013, 13. [Google Scholar] [CrossRef]
  11. Hummel, D.; Maedche, A. How effective is nudging? A quantitative review on the effect sizes and limits of empirical nudging studies. J. Behav. Exp. Econ. 2019, 80, 47–58. [Google Scholar] [CrossRef]
  12. Martín, J.C.; Pagliara, F.; Román, C. The Research Topics on E-Grocery: Trends and Existing Gaps. Sustainability 2019, 11, 321. [Google Scholar] [CrossRef] [Green Version]
  13. Van Herpen, E.; Broek, E.V.D.; van Trijp, H.C.; Yu, T. Can a virtual supermarket bring realism into the lab? Comparing shopping behavior using virtual and pictorial store representations to behavior in a physical store. Appetite 2016, 107, 196–207. [Google Scholar] [CrossRef] [PubMed]
  14. Van Herpen, E.; Bosmans, A. Arranging the assortment to arouse choice: Effects of goal-relevant assortment organization on food choice and variety perceptions. Food Qual. Prefer. 2018, 64, 192–204. [Google Scholar] [CrossRef]
  15. Huyghe, E.; Verstraeten, J.; Geuens, M.; Van Kerckhove, A. Clicks as a Healthy Alternative to Bricks: How Online Grocery Shopping Reduces Vice Purchases. J. Mark. Res. 2017, 54, 61–74. [Google Scholar] [CrossRef]
  16. Santos, B.D.L.; Hortaçsu, A.; Wildenbeest, M.R. Testing Models of Consumer Search Using Data on Web Browsing and Purchasing Behavior. Am. Econ. Rev. 2012, 102, 2955–2980. [Google Scholar] [CrossRef] [Green Version]
  17. Ogonowski, A.; Montandon, A.; Botha, E.; Reyneke, M. Should new online stores invest in social presence elements? The effect of social presence on initial trust formation. J. Retail. Consum. Serv. 2014, 21, 482–491. [Google Scholar] [CrossRef]
  18. Goldfarb, A.; McDevitt, R.C.; Samila, S.; Silverman, B.S. The Effect of Social Interaction on Economic Transactions: Evidence from Changes in Two Retail Formats. Manag. Sci. 2015, 61, 2963–2981. [Google Scholar] [CrossRef] [Green Version]
  19. Schneider, C.; Weinmann, M.; Brocke, J.V. Digital nudging. Commun. ACM 2018, 61, 67–73. [Google Scholar] [CrossRef]
  20. Bryła, P. Organic food online shopping in Poland. Br. Food J. 2018, 120, 1015–1027. [Google Scholar] [CrossRef]
  21. OECD. Behavioural Insights for Environmentally Relevant Policies: Review of Experiences from OECD Countries and Beyond; OECD Publishing: Paris, France, 2016. [Google Scholar]
  22. OECD. Behavioural Insights and Public Policy: Lessons from Around the World; OECD Publishing: Paris, France, 2017. [Google Scholar]
  23. OECD. Tackling Environmental Problems with the Help of Behavioural Insights; OECD Publishing: Paris, France, 2017; ISBN 9789264273887. [Google Scholar]
  24. Epstein, L.H.; Finkelstein, E.A.; Raynor, H.A.; Nederkoorn, C.; Fletcher, K.D.; Jankowiak, N.; Paluch, R.A. Experimental analysis of the effect of taxes and subsides on calories purchased in an on-line supermarket. Appetite 2015, 95, 245–251. [Google Scholar] [CrossRef] [PubMed]
  25. Forwood, S.E.; Ahern, A.L.; Marteau, T.M.; Jebb, S.A. Offering within-category food swaps to reduce energy density of food purchases: A study using an experimental online supermarket. Int. J. Behav. Nutr. Phys. Act. 2015, 12, 1–10. [Google Scholar] [CrossRef] [Green Version]
  26. Demarque, C.; Charalambides, L.; Hilton, D.J.; Waroquier, L. Nudging sustainable consumption: The use of descriptive norms to promote a minority behavior in a realistic online shopping environment. J. Environ. Psychol. 2015, 43, 166–174. [Google Scholar] [CrossRef]
  27. Kuiter, S.; Lembcke, T.-B.; Engelbrecht, N. VEGS GitHub Repository. Available online: https://github.com/Kuiter/vegs-repo (accessed on 6 January 2021).
  28. Google Inc. Angular Material. Available online: https://material.angular.io/ (accessed on 13 October 2020).
  29. Van Ittersum, K.; Pennings, J.M.; Wansink, B. Trying Harder and Doing Worse: How Grocery Shoppers Track In-Store Spending. J. Market. 2010, 74, 90–104. [Google Scholar] [CrossRef] [Green Version]
  30. Liberato, S.C.; Bailie, R.; Brimblecombe, J. Nutrition interventions at point-of-sale to encourage healthier food purchasing: A systematic review. BMC Public Health 2014, 14, 1–14. [Google Scholar] [CrossRef] [PubMed] [Green Version]
  31. Cameron, A.J.; Charlton, E.; Ngan, W.W.; Sacks, G. A Systematic Review of the Effectiveness of Supermarket-Based Interventions Involving Product, Promotion, or Place on the Healthiness of Consumer Purchases. Curr. Nutr. Rep. 2016, 5, 129–138. [Google Scholar] [CrossRef]
  32. Bianchi, F.; Garnett, E.; Dorsel, C.; Aveyard, P.; Jebb, S.A. Restructuring physical micro-environments to reduce the demand for meat: A systematic review and qualitative comparative analysis. Lancet Planet. Health 2018, 2, e384–e397. [Google Scholar] [CrossRef]
  33. Cadario, R.; Chandon, P. Which Healthy Eating Nudges Work Best? A Meta-Analysis of Field Experiments. SSRN Electron. J. 2017, 39, 459–665. [Google Scholar] [CrossRef]
  34. Thow, A.M.; Downs, S.; Jan, S. A systematic review of the effectiveness of food taxes and subsidies to improve diets: Understanding the recent evidence. Nutr. Rev. 2014, 72, 551–565. [Google Scholar] [CrossRef]
  35. An, R. Effectiveness of subsidies in promoting healthy food purchases and consumption: A review of field experiments. Public Health Nutr. 2012, 16, 1215–1228. [Google Scholar] [CrossRef]
  36. Chetty, R.; Looney, A.; Kroft, K. Salience and Taxation: Theory and Evidence. Am. Econ. Rev. 2009, 99, 1145–1177. [Google Scholar] [CrossRef] [Green Version]
  37. Loh, K.K.; Kanai, R. How Has the Internet Reshaped Human Cognition? Neuroscience 2016, 22, 506–520. [Google Scholar] [CrossRef] [PubMed]
  38. Mangen, A.; Walgermo, B.R.; Brønnick, K. Reading linear texts on paper versus computer screen: Effects on reading comprehension. Int. J. Educ. Res. 2013, 58, 61–68. [Google Scholar] [CrossRef]
  39. Liu, Z. Reading behavior in the digital environment. J. Doc. 2005, 61, 700–712. [Google Scholar] [CrossRef] [Green Version]
  40. Scheibehenne, B.; Miesler, L.; Todd, P.M. Fast and frugal food choices: Uncovering individual decision heuristics. Appetite 2007, 49, 578–589. [Google Scholar] [CrossRef] [Green Version]
  41. Bonnet, C.; Bouamra-Mechemache, Z.; Réquillart, V.; Treich, N. Viewpoint: Regulating meat consumption to improve health, the environment and animal welfare. Food Policy 2020, 97. [Google Scholar] [CrossRef]
  42. Bucher, T.; Collins, C.; Rollo, M.E.; McCaffrey, T.A.; De Vlieger, N.; Van Der Bend, D.; Truby, H.; Perez-Cueto, F.J.A. Nudging consumers towards healthier choices: A systematic review of positional influences on food choice. Br. J. Nutr. 2016, 115, 2252–2263. [Google Scholar] [CrossRef] [PubMed]
  43. Keller, C.; Markert, F.; Bucher, T. Nudging product choices: The effect of position change on snack bar choice. Food Qual. Prefer. 2015, 41, 41–43. [Google Scholar] [CrossRef]
  44. Kummer, S.; Milestad, R. The Diversity of Organic Box Schemes in Europe—An Exploratory Study in Four Countries. Sustainability 2020, 12, 2734. [Google Scholar] [CrossRef] [Green Version]
  45. Cheung, T.; Junghans, A.; Dijksterhuis, G.; Kroese, F.; Johansson, P.; Hall, L.; De Ridder, D. Consumers’ choice-blindness to ingredient information. Appetite 2016, 106, 2–12. [Google Scholar] [CrossRef] [Green Version]
  46. Benn, Y.; Webb, T.L.; Chang, B.P.; Reidy, J. What information do consumers consider, and how do they look for it, when shopping for groceries online? Appetite 2015, 89, 265–273. [Google Scholar] [CrossRef] [Green Version]
  47. Schwarz, N. Metacognitive Experiences in Consumer Judgment and Decision Making. J. Consum. Psychol. 2004, 14, 332–348. [Google Scholar] [CrossRef] [Green Version]
  48. Shah, A.K.; Oppenheimer, D.M. Easy does it: The role of fluency in cue weighting. PsycEXTRA Dataset 2007, 2, 371–379. [Google Scholar] [CrossRef] [Green Version]
  49. Weinrich, R.; Spiller, A. Developing food labelling strategies: Multi-level labelling. J. Clean. Prod. 2016, 137, 1138–1148. [Google Scholar] [CrossRef]
  50. Newman, C.L.; Howlett, E.; Burton, S. Effects of Objective and Evaluative Front-of-Package Cues on Food Evaluation and Choice: The Moderating Influence of Comparative and Noncomparative Processing Contexts. J. Consum. Res. 2015, 42, 749–766. [Google Scholar] [CrossRef]
  51. Campos, S.; Doxey, J.; Hammond, D. Nutrition labels on pre-packaged foods: A systematic review. Public Health Nutr. 2011, 14, 1496–1506. [Google Scholar] [CrossRef] [PubMed] [Green Version]
  52. Grunert, K.G.; Hieke, S.; Wills, J. Sustainability labels on food products: Consumer motivation, understanding and use. Food Policy 2014, 44, 177–189. [Google Scholar] [CrossRef] [Green Version]
  53. Van Kleef, E.; Dagevos, H. The Growing Role of Front-of-Pack Nutrition Profile Labeling: A Consumer Perspective on Key Issues and Controversies. Crit. Rev. Food Sci. Nutr. 2014, 55, 291–303. [Google Scholar] [CrossRef]
  54. Sanjari, S.S.; Jahn, S.; Boztug, Y. Dual-process theory and consumer response to front-of-package nutrition label formats. Nutr. Rev. 2017, 75, 871–882. [Google Scholar] [CrossRef] [Green Version]
  55. Onwezen, M.C.; van der Weele, C.N. When indifference is ambivalence: Strategic ignorance about meat consumption. Food Qual. Pref. 2016, 52, 96–105. [Google Scholar] [CrossRef]
  56. Etilé, F.; Teyssier, S. Signaling Corporate Social Responsibility: Third-Party Certification versus Brands. Scand. J. Econ. 2016, 118, 397–432. [Google Scholar] [CrossRef]
  57. Küst, P. The Impact of the Organic Label Halo Effect on Consumers’ Quality Perceptions, Value-in-Use and Well-Being. 241-264 Seiten. Jun. Manag. Sci. 2019. [Google Scholar] [CrossRef]
  58. Häubl, G.; Trifts, V. Consumer Decision Making in Online Shopping Environments: The Effects of Interactive Decision Aids. Mark. Sci. 2000, 19, 4–21. [Google Scholar] [CrossRef] [Green Version]
  59. Van Ittersum, K.; Wansink, B.; Pennings, J.M.; Sheehan, D. Smart Shopping Carts: How Real-Time Feedback Influences Spending. J. Market. 2013, 77, 21–36. [Google Scholar] [CrossRef] [Green Version]
  60. Lembcke, T.-B.; Engelbrecht, N.; Willnat, M.; Lichtenberg, S. Behavioral Design in Online Supermarkets: How Virtual Shopping Cart Functions Impact Sustainable Consumption. In Proceedings of the Americas Conference on Information Systems (AMCIS), Salt Lake City, Utah, USA, 10 August 2020; AIS Electronic Library: New York, NY, USA, 2020; pp. 1–10. [Google Scholar]
  61. Chintagunta, P.K.; Chu, J.; Cebollada, J. Quantifying Transaction Costs in Online/Off-line Grocery Channel Choice. Mark. Sci. 2012, 31, 96–114. [Google Scholar] [CrossRef] [Green Version]
  62. Hansen, P.G. The Definition of Nudge and Libertarian Paternalism: Does the Hand Fit the Glove? Eur. J. Risk Regul. 2016, 7, 155–174. [Google Scholar] [CrossRef] [Green Version]
  63. Barton, A.; Grüne-Yanoff, T. From Libertarian Paternalism to Nudging—and Beyond. Rev. Philos. Psychol. 2015, 6, 341–359. [Google Scholar] [CrossRef]
  64. Eyles, H.; McLean, R.; Neal, B.; Jiang, Y.; Doughty, R.N.; McLean, R.; Ni Mhurchu, C. A salt-reduction smartphone app supports lower-salt food purchases for people with cardiovascular disease: Findings from the SaltSwitch randomised controlled trial. Eur. J. Prev. Cardiol. 2017, 24, 1435–1444. [Google Scholar] [CrossRef] [PubMed]
  65. Riches, S.P.; Aveyard, P.; Piernas, C.; Rayner, M.; Jebb, S.A. Optimising swaps to reduce the salt content of food purchases in a virtual online supermarket: A randomised controlled trial. Appetite 2019, 133, 378–386. [Google Scholar] [CrossRef]
  66. Koutoukidis, D.A.; Jebb, S.A.; Ordóñez-Mena, J.M.; Noreik, M.; Tsiountsioura, M.; Kennedy, S.; Payne-Riches, S.; Aveyard, P.; Piernas, C. Prominent positioning and food swaps are effective interventions to reduce the saturated fat content of the shopping basket in an experimental online supermarket: A randomized controlled trial. Int. J. Behav. Nutr. Phys. Act. 2019, 16. [Google Scholar] [CrossRef] [Green Version]
  67. Hui, S.K.; Bradlow, E.T.; Fader, P.S. Testing Behavioral Hypotheses Using an Integrated Model of Grocery Store Shopping Path and Purchase Behavior. J. Consum. Res. 2009, 36, 478–493. [Google Scholar] [CrossRef] [Green Version]
  68. Sheehan, D.; van Ittersum, K. In-Store Spending Dynamics: How Budgets Invert Relative-Spending Patterns. J. Consum. Res. 2018, 45, 49–67. [Google Scholar] [CrossRef]
  69. Hui, S.K.; Huang, Y.; Suher, J.; Inman, J.J. Deconstructing the “First Moment of Truth”: Understanding Unplanned Consideration and Purchase Conversion Using In-Store Video Tracking. J. Mark. Res. 2013, 50, 445–462. [Google Scholar] [CrossRef] [Green Version]
  70. Sorensen, H.; Bogomolova, S.; Anderson, K.; Trinh, G.; Sharp, A.; Kennedy, R.; Page, B.; Wright, M. Fundamental patterns of in-store shopper behavior. J. Retail. Consum. Serv. 2017, 37, 182–194. [Google Scholar] [CrossRef]
  71. Yang, S.; Lynn, M. More Evidence Challenging the Robustness and Usefulness of the Attraction Effect. J. Mark. Res. 2014, 51, 508–513. [Google Scholar] [CrossRef] [Green Version]
  72. Janiszewski, C.; Cunha, J.M. The Influence of Price Discount Framing on the Evaluation of a Product Bundle. J. Consum. Res. 2004, 30, 534–546. [Google Scholar] [CrossRef]
  73. BÖLW. Zahlen, Daten, Fakten: Die Bio-Branche. Available online: https://www.umweltbundesamt.de/daten/private-haushalte-konsum/konsum-produkte/gruene-produkte-marktzahlen/marktdaten-bereich-ernaehrung#biolebensmittel (accessed on 6 January 2021).
  74. Dickson, P.R.; Sawyer, A.G. The price knowledge and search of supermarket shoppers. J. Market. 1990, 54, 42–53. [Google Scholar] [CrossRef]
  75. Cohen, D.A.; Babey, S.H. Contextual Influences on Eating Behaviors: Heuristic Processing and Dietary Choices. Obes. Rev. 2012, 13, 766–779. [Google Scholar] [CrossRef] [Green Version]
  76. Lembcke, T.-B.; Engelbrecht, N.; Brendel, A.B.; Kolbe, L. To Nudge or not to Nudge: Ethical Considerations of Digital Nudging Based on Its Behavioral Economics Roots. In Proceedings of the 27th European Conference on Information Systems (ECIS), Stockholm & Uppsala, Sweden, 8–14 June 2019; AIS Electronic Library: New York, NY, USA, 2019. [Google Scholar]
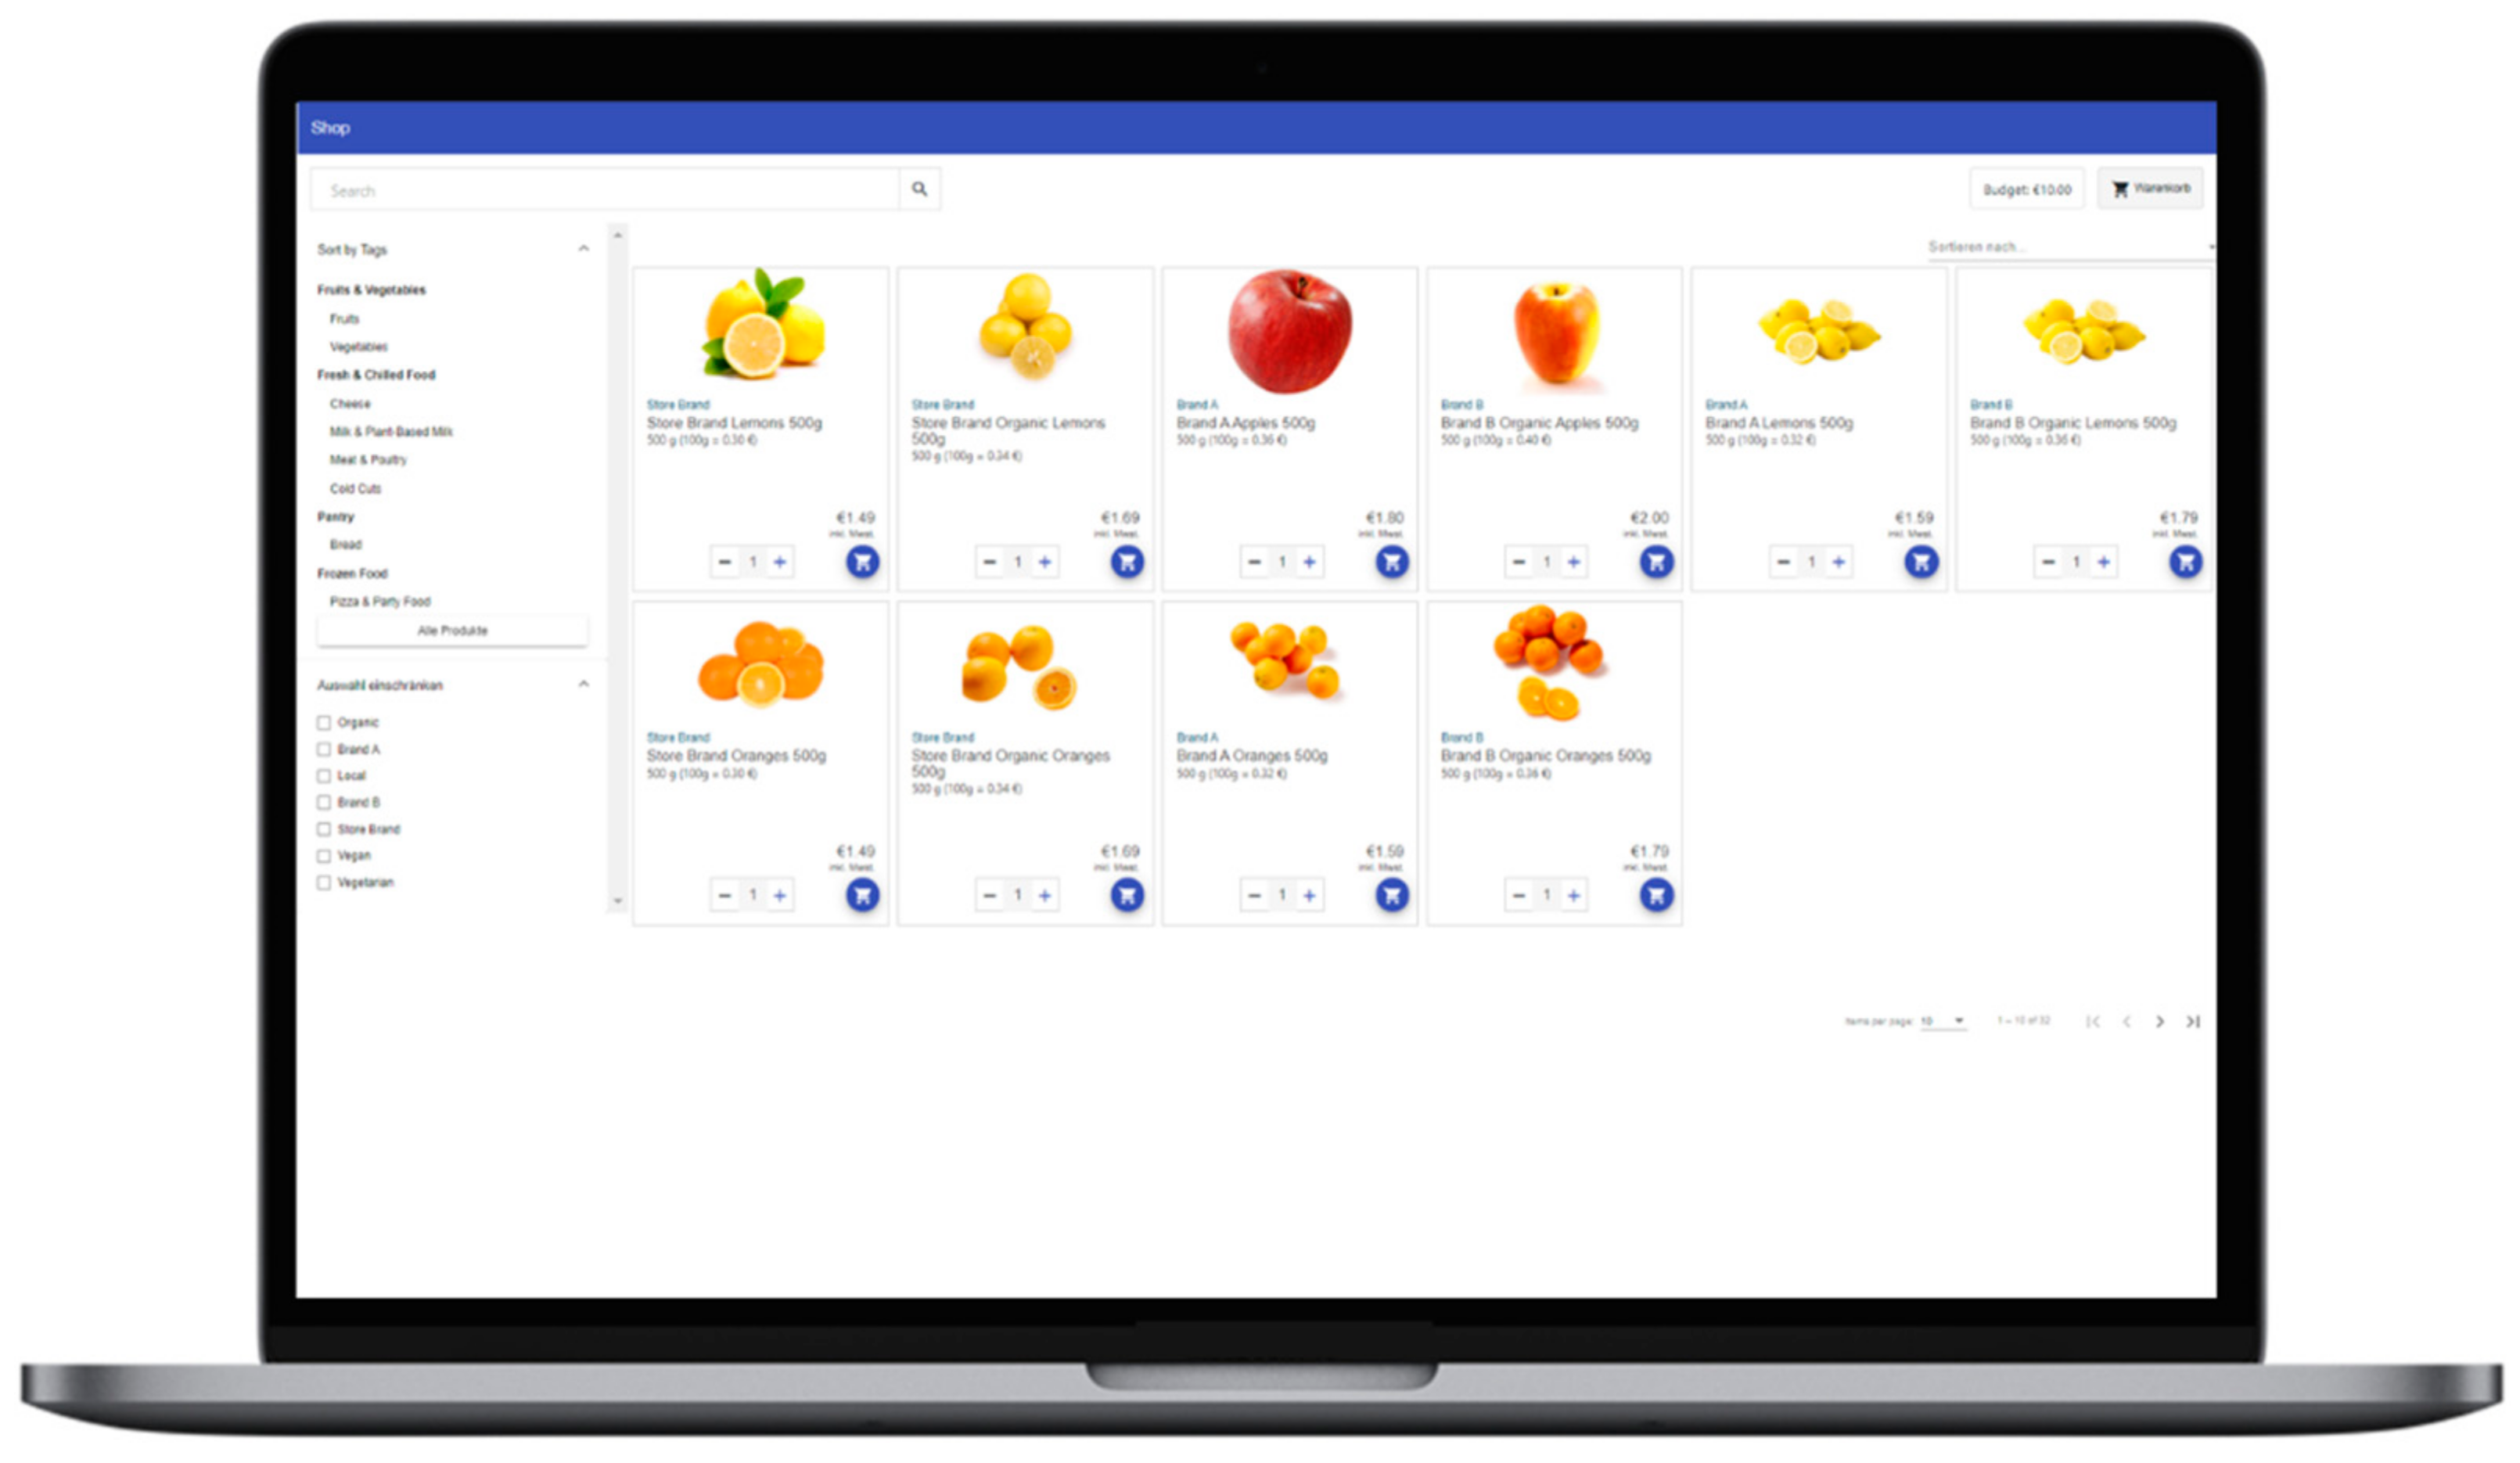
Figure 1. Screenshot of the shop view.
Sustainability 13 04375 g001
Figure 2. Screenshot of the visual administration interface.
Sustainability 13 04375 g002
Figure 3. Shop view—(A) tax display in food details component and (B) tax information dialog, for showing the description of the additional tax.
Sustainability 13 04375 g003
Figure 4. Filter definition via the data model.
Sustainability 13 04375 g004
Figure 5. Shop view—(A) base tag filter and (B) base attribute filter.
Sustainability 13 04375 g005
Figure 6. Shop view—(A) exemplary score display (left) and food labeling scheme (right) in the food-card component and (B) score display in the food-details component.
Sustainability 13 04375 g006
Figure 7. Shop view—overview about different types of virtual shopping carts (VSCs) available in the application’s base version. (A) Icon Only, (B) Icon Plus, and (C) Pop-Up.
Sustainability 13 04375 g007
Figure 8. Shop view—example of a swap dialog.
Sustainability 13 04375 g008
Table 1. List of selected questionnaire constructs and items.
VariableDescriptionMeanMedianSD
A. General Satisfaction Score (GS)To measure general satisfaction, we asked users (GS.01) about their satisfaction with their shopping experience, (GS.02) if their expectations of shopping in VOS have been met, and (GS.03) if they would buy from a real shop similar to VOS.4.925.661.15
B. Information Quality Score (IQ)Information Quality comprises three second-order constructs: understandability, reliability, and usefulness.5.525.590.71
B.1. Understandability Score (USS)To measure understandability, we asked subjects to rate whether or not product information was (IQ.01) unambiguous, (IQ.02) easy to read, (IQ.03) comprehensible, and (IQ.04) generally understandable.5.685.750.91
B.2. Reliability Score
(RS)
To measure reliability, we asked subjects to rate whether or not product information was (IQ.05) trustworthy, (IQ.06) accurate, (IQ.07) credible, and (IQ.08) reliable for making a purchase decision.5.735.750.69
B.3. Usefulness Score
(UFS)
To measure usefulness, we asked subjects to rate whether or not product information was (IQ.09) informative for the purchase decision, (IQ.10) valuable for making a purchase decision, and (IQ.11) useful for making a purchase decision.5.025.331.22
C. System quality
Score (SQ)
System Quality comprises three second-order constructs: usability, user-friendliness, and navigation.5.435.810.98
C.1. Usability Score
(USA)
To measure usability, we asked subjects to evaluate VOS’s (SQ.01) responsiveness (e.g., quick reactions to queries), (SQ.02) performance (e.g., loading times of graphics), and (SQ.03) technological modernness.5.806.001.02
C.2. User-friendliness
Score (UFS)
To measure user-friendliness, we asked subjects to rate whether or not (SQ.04) the store’s layout is simple, (SQ.05) it is easy to use, (SQ.06) it is well organized, (SQ.07) it is possible to see as many products as possible at a glance, (SQ.08) it is possible to easily compare different products, (SQ.09) multiple product images and display formats are available (e.g., zoomed images), (SQ.10) its design is straightforward, and (SQ.11) it is user-friendly in general.5.225.631.09
C.3. Navigation Score
(NS)
To evaluate the site’s navigation, we asked subjects to rate whether or not (SQ.12) it has made it possible to (SQ.12) easily go back and forth between pages, (SQ.13) locate the information they need with just a few clicks, (SQ.14) locate the products they prefer as quickly as possible, (SQ.15) edit their shopping cart as quickly and easily as possible (e.g., to add products), and (SQ.16) easily navigate.5.566.001.21
D. Realism Level
Score (RL)
To measure the realism level of our online shopping simulation, we asked subjects whether or not (RL.01) VOS has given them the feeling of using a real online store, (RL.02) their purchases correspond to their regular shopping behavior, (RL.03) their decisions reflect their regular in-store behavior (e.g., product comparisons), and (RL.04) their gathered information while shopping reflects their behavior on a regular shopping trip.5.285.500.94
Notes. Each score was calculated as an unweighted sum index from the items underlying the respective construct.
Table 2. Purchase data.
VariableDescriptionMin.MaxMeanMedianSD
Total Spending (in €)The sum of all items purchased.20.66371.5546.8733.0363.69
Total Spending on
Organic Items (in €)
The sum of all organic items purchased.0.0033.139.276.878.34
Relative Spending on Organic ItemsThe share of spending for organic items in relation to total purchases.0.000.770.270.190.22
Basket SizeThe total number of all items purchased.12.00234.0027.1718.0040.47
Number of Unique ItemsThe sum of all unique items purchased.0.000.610.220.180.17
Share of Organic
Items
The share of organic items in total purchases.1.0015.006.726.003.61
Number of Store
Brands
The sum of items from store brands purchased.0.010.750.340.350.18
Number of Organic Items by a Store BrandThe share of items from store brands in total purchases.0.0011.003.103.002.76
Share of Store Brands
on Organic Items
The sum of purchased organic items offered by store brands.0.001.000.740.850.31
Table 3. In-store behavior variables.
VariableDescriptionMin.MaxMeanMedianSD
Shopping Duration (min:sec)The duration between when a subject had successfully logged onto our virtual online supermarket website and subjects’ last visit to the VSC full-screen site *01:22501:1637:0506:19109:14
First Orientation
Time (min:sec)
Time taken between the start of the shopping task and adding the first item to the cart.00:5900:0402:3800:5000:44
Product Adds
(to cart)
Number of unique items added to VSC.12.0029.0014.3813.004.35
Product Removes (from cart)Number of unique items removed from the VSC.0.003.000.550.000.87
Product amount changes (in cart)Number of amount changes in the VSC during shopping.0.0013.001.000.002.74
Total Cart AdjustmentsSum of all adjustments (PA, PR, and PC) to the VSC. 12.0035.0015.9314.006.12
Detailed product viewsSum of all product pages a consumer has visited during shopping.0.0016.002.932.003.85
Cart-to-Detail
Ratio
Ratio of the number of items added to the VSC to the number of product-detail views.0.001.140.220.140.28
Add-to-Purchase
Ratio
Ratio of the number of items bought to the number of items added to VSC.0.801.000.961.000.53
Total user
interactions
Number of all user interactions that link a subject to another (sub)page of the VSC or changes the view of the currently seen (sub)page.3.00460.0083.0047.00105.28
Interactions-to-
Purchase Ratio
Number of user interaction in relation to the basket size.0.2323.215.713.626.09
Notes. * We had to use the subjects’ last visit to the VSC full-screen site as a proxy for completing the purchase since we did not record when the final selected shopping cart was confirmed. However, this shortcoming can be easily fixed for future studies.
Publisher’s Note: MDPI stays neutral with regard to jurisdictional claims in published maps and institutional affiliations.