Abstract
Globalization has brought not only advantages but also risks into the supply chains. One lesser studied risk is the effect of consumer behavior in crises. The recent COVID-19 pandemic has shown that the most efficient and optimized supply chains are susceptible to consumer panic buying. There is a severe need to understand the multitude of scenarios that could manifest after a catastrophe due to the change in consumer behavior so that businesses can develop a mitigation plan. The authors have developed an agent-based model that can simulate the various outcomes of a crisis using a consumer panic buying model and a supply chain model. The model quantitatively evaluates the panic purchase intention of a consumer while assessing the impact of panic buying on the supply chain. This paper introduces the implementation of the model, focusing on output analysis of the various situational settings in disaster aftermath. Preliminary study has revealed that implementing quota policy or rationing uniformly is very effective while controlling media reports or panic buying consumers can reduce consumer demand significantly.
1. Introduction
Increasing globalization has a multitude of companies taking advantage of global sourcing through procuring inexpensive raw materials or lower labor costs from developing countries, or with technical expertise from advanced nations to increase its profitability. The supply chain, being the lifeline of most retail businesses, benefits from the many dynamics of globalization. The supply chain network of the global FMCG (Fast Moving Consumer Goods) is well woven from one corner of the world to another and monitored real-time with the help of advanced technology. The complex and long supply chains are inevitably subject to disruptions. The increasing risks have had the companies rethinking the management of the extensive supply chains in response to the various internal or external risks, such as inaccurate forecasts, transportation issues, political changes, economic instability, or natural disasters [1,2,3]. The recent COVID-19 pandemic exposed structural flaws that have indicated a requirement for organizations to reassess their risk management approaches. Lockdowns, transportation disruptions, and panic buying led to shortages of products in almost every sector, from medical and essential commodities to automotive and electronic components. While movement restrictions have caused production or distribution problems, panic buying has been a major cause for the severe shortage. The inability of supply chains to cope with the situation during the pandemic has explicitly put forward a lack of expertise and research to mitigate the risk of panic buying during emergency situations or disasters.
Human behavior is impacted when surrounded by a sense of fear or anxiety, especially during disasters or extreme situations. This follows an urge to act on the situation to take control [4,5,6]. Performing this action provides a sense of certainty over the situation [7]. Hence, in the case of a consumer, this ‘fear of unknown’ stimulates the precautionary action of stockpiling as protection against having no stock, which is often termed as ‘panic buying’. Panic buying can be seen regularly before or after natural disasters such as hurricanes and earthquakes, which are mostly regional occurrences limited to the affected areas or countries. However, the recent COVID-19 pandemic has shown that this behavior can be seen in all uncertain situations and has established sufficient proof of panic purchase behavior among consumers [8]. People were hoarding available goods irrespective of necessity. Certain goods such as masks, sanitizers, and toilet paper were flying off the shelves, which resulted in stores implementing sales restrictions in most parts of the world. Panic buying of a product leads to a sudden increase in demand, which creates mayhem along the supply chains of the retail industries, as they mostly work on just-in-time techniques [9]. This disruption progresses to initiate further panic buying, which converts into a vicious circle. Essential commodities, such as food or water are typically at higher risk and might lead to chaotic situations, increasing the number of vulnerable people. Such situations highlight the importance to control the panic among the public along with the presence of a resilient supply chain to be able to provide essentials to the consumers.
Disasters directly affect the infrastructure and operation of supply chains, and this has been discussed by the researchers at large, but these studies have ignored a major cause of supply chain disruption, which is the change in consumer behavior in uncertain situations. This has led to major supply chain failures in challenging circumstances of large-scale disasters. Hence, it is important to study and anticipate consumer behavior in crises. Several researchers studied consumer behavior in disasters. However, the study on panic buying by sociologists or psychologists is still meagre. Yuen et al. [6], had recently presented a comprehensive review of the existing literature present on panic buying, highlighting the lack of research in this area. As mentioned, the supply chain can be disrupted at large due to the sudden change in consumers purchase behavior. The impact on the supply chain due to consumer panic buying is an even lesser-discussed issue. Shou et al. [3] studied consumer panic buying and quota policy under supply disruptions related to supply reliability and the cost of ignoring consumer behavior. Yoon et al. [10] studied sourcing strategies for consumer stockpiling in supply disruptions. However, these studies have not included disasters or emergency situations, which have a significant impact on both the consumer and supply chain stakeholder. The lack of a predictive consumer model or studies of supply chain disruption due to consumer behavior was clear from the past literature [6]. To bridge the gap between supply chain risk studies and consumer behavior in disaster situations, we aimed to build a model that can study consumer panic buying and its impact on the supply chain and that can support in predicting and mitigating the various consequences of large-scale panic buying. Dulam et al. [11] developed a model to analyze both the consumer panic buying of bottled water and the response of the supply chain in the disaster aftermath using an agent-based model. The consumer model has been enhanced for assessing the panic purchase intention of a consumer in an uncertain situation based on the factors that play a significant role during crises [12].
The combined simulation model can help to understand the possible aftereffects of disaster scenarios, such as expected panic buying, the possible supply chain disruption due to it, and the outcomes of the intended mitigation measures used to control the situation, which could help industries be prepared for potential disruptions. For example, stores can foresee the possible demand given the behaviors of consumers in their area and manage their inventory accordingly. The supply chain can test mitigation measures they intend to apply and anticipate consumer reactions. The government can have a thorough view of the chaos that can unfold after a large-scale disaster. The current paper exhibits the application of the model to elevate the importance and benefits of such tools.
The rest of the manuscript is divided into four sections; next section discusses the past literature on this issue. The third section deals with the methodology used for model development. The fourth section shows the outcome of possible disaster scenarios. The fifth section reports the discussion. The last section provides the conclusions of this study.
2. Literature Review
This section discusses some of the available literature regarding consumer panic buying, followed by studies on supply chain impact due to disasters and finally on consumer panic buying and supply disturbances.
2.1. Consumer Panic Buying
The study of consumer behavior is a very popular field, as it forms the basis for the future of any business. The behavior of consumers has been evolving with changing lifestyles, and trends and patterns have been constantly studied by sociologists and psychologists. Consumer stockpiling was initially seen when product promotions or price fluctuations are prevalent. Consumers tend to stockpile when there is an uncertainty in the number of deal opportunities or regular prices. However, consumer panic buying in a large-scale disaster or panic situations is a lesser studied subject, which needs more focus in the wake of an increasing number of disasters. A few of the limited works on consumer behavior in crises is mentioned below. Strahle and Bonfield [5] tried to understand collective consumer actions with a model of individual decision-making in panic situations using eight structural factors, listed from previous literature. Liren et al. [13] advised that government involvement can control panic purchase based on an evolution mechanism and development tendency of panic purchase. Kurihara and Maruyama [14] found that unpreparedness for disaster and excessive media coverage had caused stockpiling of essential goods from an analysis of a survey conducted after the Great East Japan Earthquake. A study by Cavallo et al. [15] reported that disasters can impact product availability directly using online data collected from retailers. Forbes [16] found that consumers purchase increased levels of utilitarian products necessary for survival from a study of scanner data of purchases after the Christchurch earthquake. Lindsay and Hyunju [17] found that high utilitarian and hedonic shopping can be associated with a high level of fear. Recently panic buying has caught the researcher’s attention due to its widespread presence during the pandemic. Yuen et al. [6], identified the causes of panic buying to be (1) an individual’s perception of threat or scarcity, (2) fear of unknown, (3) coping behavior, and (4) social psychological factors based on a literature review of the existing academic papers on panic buying. Loxton et al. [8] compared the spending patterns of consumers during the COVID-19 pandemic and identified similarities with previous crises and shock events. Keane and Neal [18] and Prentice et al. [19] highlighted the influence of government policies on consumer panic buying using an econometric model based on Google search data and on semantic analysis, secondary data, and big data analytics, respectively. It can be observed from the above works that the study on panic buying behavior is still in its earlier stages, requiring research that can lead to forecasting the consumer behavior in times of disaster.
2.2. Supply Chain Management
Today’s global supply chains are extremely complex, and a minor deviation of an element exposes the entire chain to disturbances, which impact both the performance and its long-term sustainability. As the supply chain’s performance is vital to any business, supply chain disturbances could have a significant effect. Bernstein [20] wrote, “the demand for risk management has risen along with the growing number of risks.” Additionally, Christopher and Peck [21] said, “in today’s uncertain and turbulent markets, supply chain vulnerability has become an issue of significance for many companies and appropriate research on resilient supply chains are yet to be conducted”. There is immense literature in the field of supply chain risk management, which studies the causes, effects, and mitigation of the typical risks in an event of a disaster. Katsaliaki et al. [22] provided a comprehensive review of possible risks, supply chain disruptions, modelling approaches, and resilience strategies, highlighting the impact, importance, and necessity of supply chain risk management. These works are paving way for better-equipped, resilient supply chains. Mensah and Merkuryev [23] prioritized the risks and proposed appropriate strategies and tools for understanding supply chain resilience in order to avoid those risks. Highlighting environmental risks such as natural disasters, several researchers have worked to study the effect on supply chains. Ivanov and Wendler [24] studied the existing quantitative methods and identified issues in emergency logistic management in disaster situations. Inoue and Todo [25] built a model to calculate the indirect damage along with its propagation during the 2011 triple disaster by simulating nationwide supply chains. Giannakis and Louis [26] modelled the supply chain risks for manufacturing industries using an agent-based approach. A few researchers in recent years have studied supply disturbances under stockpiling conditions. Yoon et al. [10] mentioned that stronger panic buying behavior is seen when consumers hold an experience of similar problems while studying a retailer’s single and multiple sourcing strategies for consumer stockpiling initiated by supply disruptions. Zheng et al. [27] studied optimal inventory ordering policy for the retailer by taking into consideration consumers social learning behavior. Tsao and Raj [28] studied product segmentation and found that substitution and customer segmentation will increase profits by categorizing retailers in a panic-induced supply disruption scenario. Hobbs [29] suggested that the just-in-time supply chain model may be vulnerable to demand and supply shocks, as seen in the early months of the COVID-19 pandemic. The author raised several questions regarding the timing of the implementation of limits on purchasing, and the consumer’s trust in the government and food system to manage the crisis.
The above discussions show that studies about consumer panic buying and supply chain disturbances are present, albeit the former in its early stages. However, the impact on supply chain due to consumer panic buying was not explored to date. This strengthens the previously discussed lack of research on the concerned topic. Furthermore, the necessity for predictive models was also highlighted in the above works. The current study addresses exactly this issue by proposing a novel means to approach the problem.
3. Methodology
This section explains the model in brief, as the article’s focus is the implementation of the simulation tool. The objective involves the study of consumer behavior and its impact on the supply chain. Hence, the model chiefly comprises a supply chain model and a consumer model. The supply chain involves the stakeholders and their actions to complete the functions of the supply chain. The consumer model involves the process leading to the purchase of essential commodities in disaster aftermath.
The model is influenced by the consequences of the Great East Japan Earthquake, which had a severe impact on the infrastructure, the economy, and even the people. The nuclear accident intensified the crisis due to the radiation leak. One major consequence of the disaster was panic buying, which was prevalent in a wide range of sectors, such as the food and beverage industry and the auto component sector [10,30]. Fuel, bottled water, bread, and instant meals were among the top sellers [14]. Due to the radiation leak, the Tokyo water department had warned that infants must not consume tap water due to increased radioactive iodine levels. This notice instigated people to panic-buy bottled water in unprecedented quantities. There were several media reports and articles about the stockout of food and drinking water in stores, especially in the national capital. Analysis of such situations helps us identify potential problems associated with panic buying. Hence, we used the consequences of the triple disaster as a reference for identifying the key parameters of the model.
3.1. Supply Chain Model
The supply chain is an integration of a multitude of elements, such as people, organizations, activities, resources, and information, required for the manufacturing, distribution, and sale of a product. The model implements the key functions of the supply chain members required for sustaining their businesses. A simple supply chain with four tiers was considered with five stakeholders involved in the production and supply of bottled water as supply chain agents (SCAs), which are manufacturers (M), distributors (D), individual retailers (R), chain heads (CH), and their chain retailers (R). The product moves down the hierarchy, changing hands from the sellers into their buyers in the above-mentioned order.
The model was built with a supply chain design of continuous replenishment; the sellers provide the product to their buyers daily or at regular intervals depending on their lead time. In an interval, the SCAs prepare for sale and, when a consumer places an order, make the sale depending on the availability of stock. After all the consumers complete their purchase action, the SCAs conduct an inventory check and place orders to their sellers. The above actions of inventory management are based on the conventional economic order quantity model for variable consumer demand [31]. The supply chain model is designed such that the stakeholders strive to satisfy their customer demand. However, there might be some intervals where the demand is more than the usually expected quantity, which appears as a disturbance in the supply chain. Supply chain disturbance is defined in the current work as a minor imbalance in supply and demand for an interval or two, which is normalized immediately. However, when the disturbance is continuously persistent for several intervals, it converts into a supply chain disruption.
3.2. Consumer Model
The consumer model deals mainly with the decision-making of the consumer depending on the circumstances. Consumer decision-making is the study of how individuals make decisions on how they spend their available resources, such as time, money, and effort, on the consumption of products, which is influenced by the consumer’s emotional, mental, and behavioral states. The influencing factors have been categorized as personal, social, individual, psychological, and situational. The model is built using a six-step decision-making process viz., need recognition, information search and processing, factor valuation, decision, purchase, and purchase evaluation. The household agent undertakes the above-mentioned process to make the purchase decision based on its available resources and information.
The consumer agent is a ‘household’, which includes its members. The main consumer model involves the decision-making process. Some sub-models are required to support the agent action, explained as follows. The product consumption model (here, water) calculates the average and per interval consumption of the household depending on the weight of each member [32,33]. The store selection model helps the consumer to select a store in its vicinity based on its preferences. The purchase quantity model calculates the required quantity based on available inventory and consumption habits. The satisfaction model evaluates consumer satisfaction based on product availability for the interval and outcome of the purchase action.
The decision-making process is phase-dependent; the household’s decision-making criteria are different in the pre-and post-disaster phases. Pre-disaster decision-making is based on the available inventory and the consumption of the household. However, the post-disaster scenario unveils a multitude of psychological and situational factors evoked as a consequence of the disaster. Hence, post-disaster decision-making was developed based on a logistic transformation model, using a multiple regression analysis of a questionnaire survey. A questionnaire survey was conducted to comprehend the factors influencing the decision-making of the purchase of essential commodities, specifically bottled water, during a crisis. The questionnaire is designed such that the questions output the respondent’s opinions on the influencing factors that are identified from past literature and articles published during the 2011 triple disaster [14,34,35].
Based on the survey outputs, the regression model is built based on significant personal factors (explanatory variables): household size, children, past purchase difficulty, past purchase behavior, risk, and anxious temperaments and effect of situational factors (response variables): sales restrictions employed by the retail stores, media reports, rumors about shortages, and neighbor’s panic purchase behavior, as listed in Table 1.

Table 1.
List of explanatory and response variables for the regression analysis.
The regression equations obtained from the regression analysis give the model parameters (), which along with the situational factors give the response variable (), and in turn, the purchase intention () can be obtained, shown in Equations (1) and (2), respectively.
Here, is the purchase intention or probability of stockpiling;
is the response variable;
i is the situational vector element for the ith situational factor;
is the linear model parameters for the ith situational response variable;
ε is a constant.
Figure 1 shows the process of decision-making in the post-disaster phase. The model parameters for each consumer agent are calculated, based on the regression equations obtained from the questionnaire survey, during the generation and initialization of the agents.
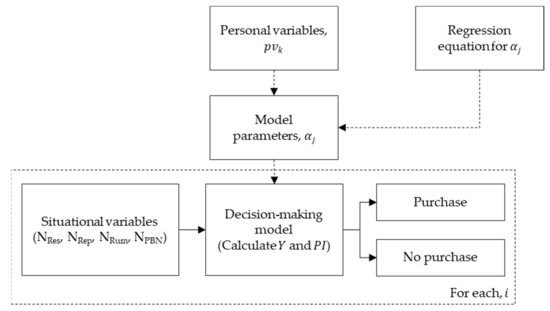
Figure 1.
The framework of the post-disaster decision-making model.
The process in the dashed box is conducted for every interval. Once the disaster occurs, the situational variables are calculated in every interval based on the circumstances of the consumer agent. The dynamic situational factors and the pre-calculated model parameters are inputted into the decision-making model to arrive at the purchase decision as explained earlier.
3.3. Simulation Design
The simulation tool, shown in Figure 2, is designed using an agent-based approach. The agent-based methodology allows one to capture the complexity of the system and the heterogeneity of human behavior. The randomly generated personal consumer attributes and the dynamic situational factors are inputted into the model to obtain the panic behavior of the consumers along with how the supply chain performance (SCP) has been impacted. The model involves all the actions required by the consumer agents and supply chain agents to satisfy their respective objectives. The output evaluates the changes in consumer behavior due to the disaster. The factors inducing panic buying can be identified along with the increase in product demand. The impact on the supply chain is measured by the product availability or stockout condition of the SCAs. The combined consumer panic buying and supply chain model can be used to test several mitigation scenarios and understand their outcomes. This tool will help test mitigation measures and learn their effectiveness, the situational factors that would increase or decrease panic buying, how to manage the inventory to increase availability, etc. The most commonly used strategy to curb panic buying is limiting sales per person. Hence, sales restrictions and rationing have been used as control measures in the current work.
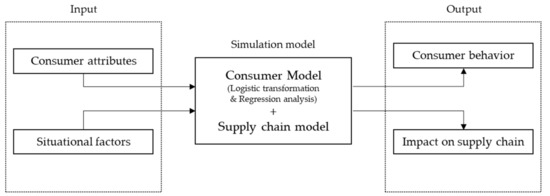
Figure 2.
An overview of the simulation tool.
The simulation runs through three time phases. After the initialization of agents, the pre-disaster phase is initialized. The SCAs maximize their utility, while the consumers purchase according to their consumption and purchase habits. The post-disaster phase is triggered at the onset of the disaster. Consumer behavior changes depending on the changing circumstances. Consumers stop the consumption of tap water in fear of possible contamination. The strategy phase is initialized when a mitigation measure is employed to control the panic buying. A more detailed explanation and development of the model can be found in earlier works [11,12].
4. Results and Analysis
The simulation is set in an environment with a virtual grid of 100 × 100 size. The generation of the consumer agents and SCAs is random and are uniformly distributed, as shown in Figure 3. The location of the consumer agents and the SCAs for the simulations is also shown. The scope of the simulation is very small, considering its initial stages. Currently, for trial purposes, only 2000 households have been considered with a population of 4208. The household count and the age distribution of the population are set according to the Japan demographic data [36]. The personal attributes of the consumer agent are generated randomly but distributed according to the questionnaire survey. In the supply chain model, there are four retail stores, two individual retail stores, and two chain stores, as it is required to have at least two stores for every 1000 households in accordance with the store density of Tokyo [37]. There is one chain head for the two chain stores, one distributor, and one manufacturer to produce the product. The agents along with their attributes and properties are initialized before the time is initiated. The simulation is run for a time period of 60 intervals, where the disaster occurs in the 30th interval and the strategy is initiated in the 31st interval when employed. The initial parameters of the agents are initialized in such a way that the warm-up period of the simulation is reduced to around five intervals. For example, the initial average sales are initialized for the retailers based on the number of consumers in their vicinity. The higher level SCA’s initial average sales are cumulative of the buyer agent’s average sales. However, these values are recalculated at regular intervals based on actual sales. With the help of these initial settings, the warm-up period and the run time have been considerably reduced. The stochasticity of the consumer and supply chain agents makes it a difficult task to identify the changes due to the implementation of the different scenarios. In order to concentrate on the impact, one set of consumers is used for the production of the results. The simulation is coded using Java language on the Eclipse development environment, while the data analysis for the consumer model was conducted using JMP pro statistical software.
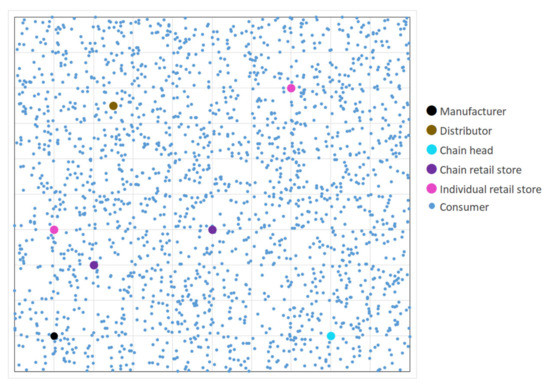
Figure 3.
Agent spatial distribution in the environment.
We conducted simulations for different scenarios by varying several key parameters of the model, such as the initialization of the strategy or varying the situational elements. The following four disaster and mitigation scenarios have been considered as the setting for the simulations: Case 1: a normal scenario without any disaster; Case 2: disaster occurs, but no strategy is implemented; Case 3: disaster occurs, and sales restrictions are implemented; Case 4: disaster occurs, and rationing is implemented. The difference between the two strategies is that in the sales restrictions case, the consumers can make multiple purchases by visiting several stores until their requirement is met, while the consumer’s purchase is limited to one purchase per interval in the rationing case.
4.1. Validation
The verification and validation of agent-based models is a difficult task. A possible method is to compare the simulation outputs with the factual records. However, access to such data is difficult. The performance of the supply chain model, as explained in Section 4.3, shows a similar effect to the bullwhip effect in a normal scenario. The consumer demand is variable, so the small variation in demand results in the amplified response along the hierarchy of the supply chain. This phenomenon can be seen in Figure 4, which validates the model. The consumer decision-making model in a disaster scenario is also verified by running the simulation where there are no changes in consumer behavior due to panic. In the current model, disaster impact on consumer agent is the discontinuation of tap water consumption, an increase in purchase quantity, and the influence of situational factors. Therefore, the consumers continue consumption of tap water, the panic buying factor is 1, and the situational elements of reports and rumors do not exist, as demand has not increased. With the above setting, the SCP is evaluated, as shown in Figure 5, for the disaster case without any strategy. The performance is similar to that of a normal case, and the stark difference from the disaster case can be seen (refer Section 4.3). The above aspects demonstrate that the model is consistent with the conceptual model.
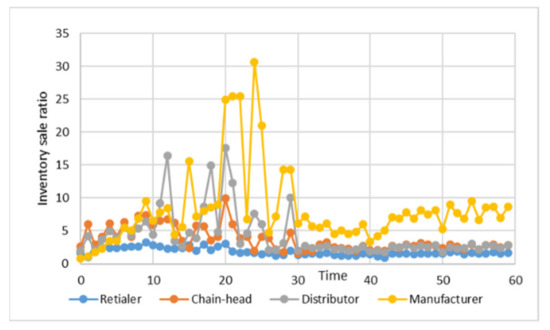
Figure 4.
Supply chain performance of the four supply chain tiers in the normal scenario.
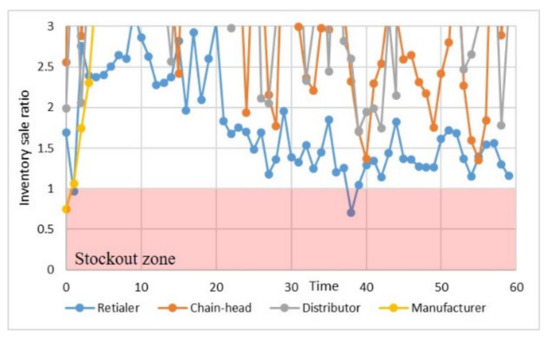
Figure 5.
Supply chain performance in the disaster scenario and no panic buying.
4.2. Effect of Strategy on Consumer Satisfaction
The impact of the disaster or the strategy on the consumers is measured with the number of satisfied consumers. The satisfaction () of consumers is calculated based on the product sufficiency and outcome of the purchase action with equal weightage to both factors. The consumers are divided into five categories based on their satisfaction: full satisfaction (), high satisfaction (), medium satisfaction (), low satisfaction (), and zero satisfaction (). Fully satisfied consumers are those who have sufficient inventory for the interval or who have made a full purchase; hence, the satisfaction is the maximum level, i.e., 1. The highly satisfied consumers are those who have sufficient inventory for the interval but have purchased less than the required quantity. Medium level satisfaction consumers are those who have sufficient inventory for the interval but could not purchase the product at all. The low satisfaction consumers do not have an inventory sufficient for the interval, but could make an insufficient purchase; hence, the product available with the consumer might or might not be sufficient for the interval. Finally, the zero satisfaction consumers neither have sufficient inventory nor could make any purchase. Hence, the consumer has to survive the interval without access to the product.
Figure 6 shows the number of consumers in each satisfaction category for each interval. It can be seen that 100% of consumers have been satisfied in the normal case. While, in the disaster without a strategy case, the number of fully satisfied consumers has reduced, and the consumers with zero satisfaction have increased in the intervals after the disaster, peaking around the 40th interval, with almost 50% of the consumers with zero satisfaction. The implementation of the restrictions can be seen to reduce both the number of zero satisfaction consumers and the number of intervals with the presence of such consumers. While there are still around 10 intervals, where some consumers have to cope without the product, it can be seen that the number of zero satisfaction consumers has reduced drastically in the last case, indicating that rationing can be helpful in increasing the reach of the product, necessary for the survival of the people.
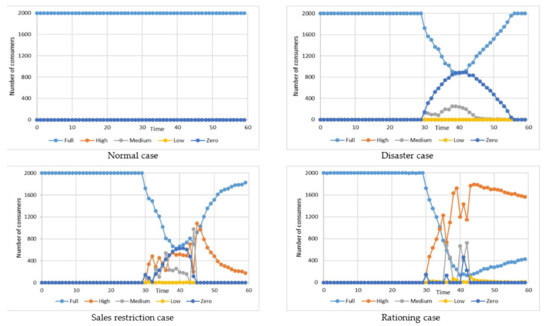
Figure 6.
Consumer satisfaction in the four scenarios.
4.3. Effect on Supply Chain Performance
Supply chain performance (SCP) is one of the key outcomes of the current research. Supply chain performance can be evaluated using several factors such as efficiency, delivery time, and reliability. However, as the focus is on supply chain disruption in disaster times, we have used the base elements of inventory and sale.
4.3.1. Inventory-Sale Ratio
The Inventory-Sale ratio, , is a ratio of inventory to sale, where the sale is the sum of the sale and the lost sale (after stockout), as shown in Equation (3). A lost sale is the sale opportunity lost by the SCA due to the unavailability of the inventory. Hence, the lost sale appears in the equation only if a stockout occurs.
Here, is the inventory sale ratio in interval i;
is the current inventory of the supply chain agent in interval i;
is the sales in interval i;
is the lost sales in interval i.
The inventory–sale ratio is a tier-level cumulative value of all the SCAs in the tier. Figure 4 shows the of each tier along the time. This ratio indicates the efficiency of the SCA in managing its inventory. Hence, if > 1, the white region in Figure 7, the on-hand inventory is greater than the demand, placing the SCA in a safe condition, and if < 1, the red region, the SCA has insufficient inventory and moves into the stockout zone, which is seen as a disturbance. An inventory–sale ratio graph looks as shown in Figure 4, but to focus on the stockout zone, the inventory–sale ratio axis is shown from 0 to 3 in the above graphs.
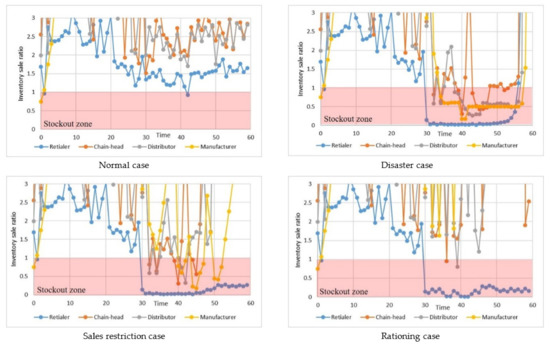
Figure 7.
Supply chain performance in the four scenarios.
Figure 7 shows the impact on SCP in different scenarios. It can be seen that the retail tier has moved into the stockout zone in the normal phase, indicating the presence of lost sales in some of the retail store agents. An unexpected increase in demand for a retail store has caused this disturbance, as there was no cumulative stockout. Hence, it can be regarded as a minor disturbance. However, once the disaster is triggered in the 30th interval, it can be seen in the disaster case that the demand is so high that all the SCAs are in the stockout zone for consistently more than 10 intervals, indicating a crash in the supply chain. The sales restrictions have helped in averting the supply chain crash but could not avoid the disturbances, while the rationing case was effective in avoiding the disruption and maintaining the SCP. When the strategies are in place, the consumer demand is not satisfied; hence, the of the retail stores continues to be very low as demand is far greater than the inventory.
4.3.2. Stockoutness
A parameter, named stockoutness, is introduced to understand the difference in the performance of the supply chain in various cases. Stockoutness indicates the stockout condition of the agent or the depth of the SCA in the stockout zone. This parameter is a cumulative inventory–sale ratio in the stockout zone as shown in Equation (4).
The stockoutness of the supply chain in the four cases is shown in Table 2. This is depicted in Figure 8. It can be observed that the strategies have allowed the stockoutness of the supply chain to reduce, while rationing brings the stockoutness to almost zero. As explained earlier, the stockoutness of the retail tier would continue to be on the higher end, as the sale is restricted. Stockoutness would be used to compare the SCP in the rest of the results.
Table 2.
Stockoutness values of the supply chain tiers in the four scenarios.
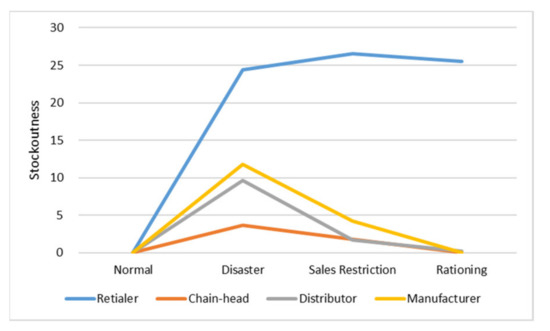
Figure 8.
Stockoutness of the supply chain tiers in the four scenarios.
4.4. Effect of Time Variation of the Strategy Initialization
In the simulation runs of the above results, the strategy is implemented in the consecutive interval of the disaster. However, in reality, such a fast reaction might not be possible. Hence, the effect on SCP is studied by varying the interval in which the strategy is initialized. The occurrence of disasters such as typhoons and hurricanes can be known beforehand, and mitigation measures can be taken earlier. Hence, to realize the effect of varying the start of the strategy, five cases were considered with the strategy initialized in different intervals with respect to the disaster interval: three intervals before disaster occurs (D − 3), one interval before disaster occurs (D − 1), one interval after disaster occurs (D + 1), five intervals after disaster occurs (D + 5), and ten intervals after disaster (D + 10).
Figure 9 and Figure 10 show the performance of the supply chain given sales restrictions and rationing for a few of the above-mentioned cases. It can be observed that the supply chain disruption can be averted if the sales restrictions are employed as early as possible, while the supply chain recovers immediately with rationing.
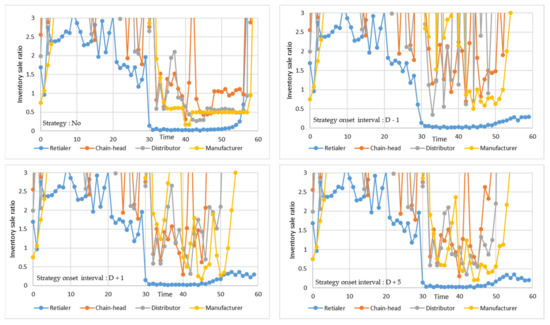
Figure 9.
Effect on SCP due to the time variation of initialization of sales restrictions.
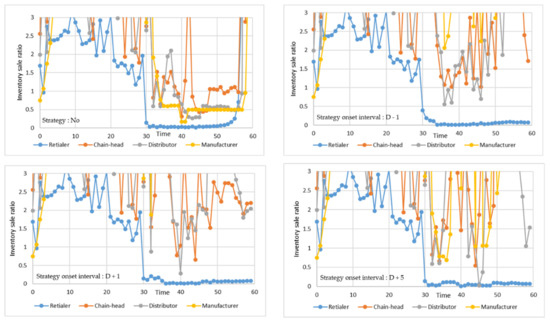
Figure 10.
Effect on SCP due to the time variation of initialization of rationing.
The stockoutness, for the five cases and the case without any strategy, was calculated and is shown in Table 3 for the sales restrictions case. Figure 11 shows that stockoutness increases as initialization of the strategy is delayed. This indicates that the early employment of sales restrictions by stores could avoid a possible supply chain disruption. The SCP is improved immediately with the help of rationing at any point in time, as can be seen in Table 4 and Figure 12; the effectiveness of rationing is evident, as stockoutness is greatly reduced in all cases when compared with the case without any strategy (disaster case in Figure 7).
Table 3.
Stockoutness of the supply chain tiers when initialization of sales restrictions is varied.
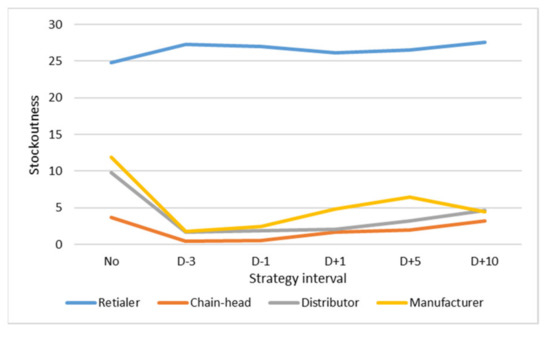
Figure 11.
Stockoutness of the supply chain tiers when initialization of sales restrictions is varied.
Table 4.
Stockoutness of the supply chain tiers when initialization of rationing is varied.
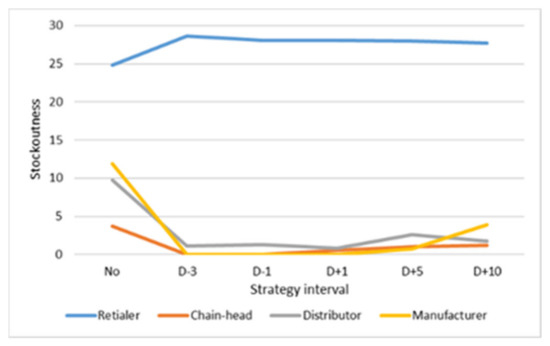
Figure 12.
Stockoutness of the supply chain tiers when initialization of rationing is varied.
4.5. Effect of Variation of Stores with Strategy
Effect on the system when the number of stores employing a strategy varies can also be studied using this tool. In the results presented thus far, all the retail stores employ the strategy, while in reality that might not be the situation. There will be some stores that place sales restrictions, while some stores do not employ any strategy. Five cases were considered: 0%, 25%, 50%, 75%, and 100% of the stores employ a strategy. The effect on the supply chain along with the effect on consumer satisfaction is presented here.
Figure 13 and Figure 14 show the SCP and the consumer satisfaction for the 25%, 50%, and 75% cases considered with sales restrictions and rationing, respectively. 0% (Disaster) and 100% (Strategy) cases can be found in Section 3.2 and Section 3.3. It can be seen that, in both the strategy cases, the difference or improvement of SCP by increasing the number of stores with the strategy is not evident. However, uniform (100%) enforcement of the strategy is very effective.
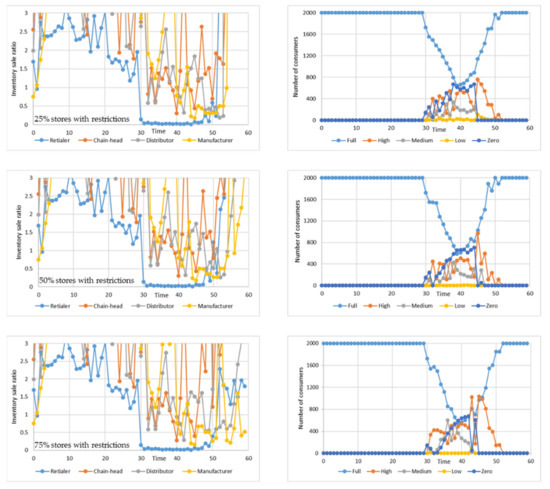
Figure 13.
Effect on SCP and consumer satisfaction due to the variation of number of stores with sales restrictions.
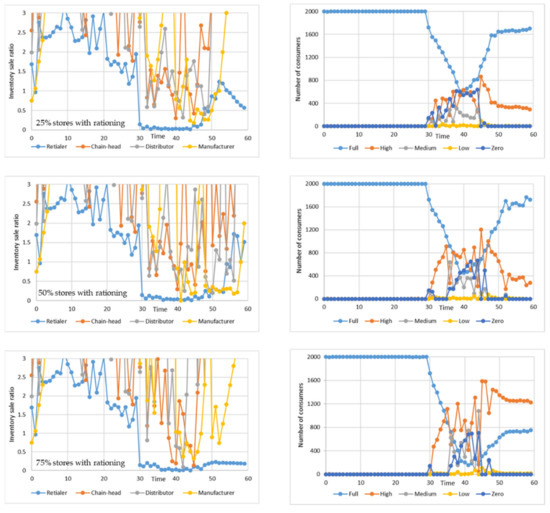
Figure 14.
Effect on SCP and consumer satisfaction due to the variation of number of stores with rationing.
Figure 15 and Figure 16 show the stockoutness of the supply chain tiers, whose values are given in Table 5 and Table 6. It can be observed that the effects of increasing the number of stores employing the strategies are not apparent; moreover, it creates an imbalance among the retail stores. This is because stores that do not employ a strategy continue with regular sales and the consumers can purchase their desired quantity by visiting the stores without sales restrictions. The stores without restrictions always stockout immediately. Hence, the expected improvement by increasing the number of stores with a strategy cannot be observed.
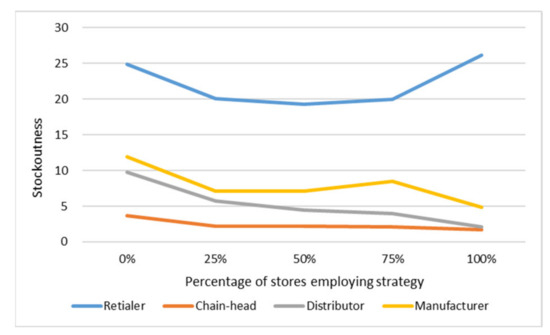
Figure 15.
Stockoutness of the supply chain tiers when number of stores with sales restrictions is varied.
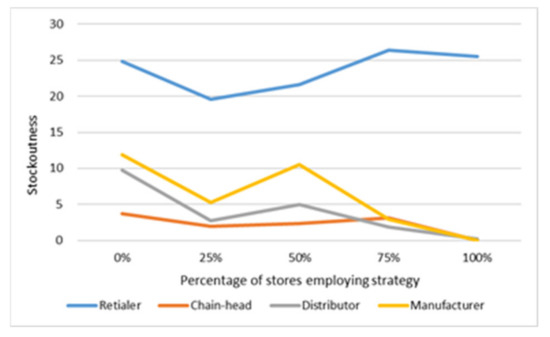
Figure 16.
Stockoutness of the supply chain tiers when number of stores with rationing is varied.
Table 5.
Stockoutness of the supply chain tiers when number of stores with sales restrictions is varied.
Table 6.
Stockoutness of the supply chain tiers when number of stores with rationing is varied.
4.6. Effect of Variation in the Amount of Reports and Rumors
The effect when the situational elements of reports and rumors are decreased was also examined. The amount of reports and rumors is varied to generate various distributions, ranging over {0,1}, {0,0.75}, {0,0.5}, {0,0.25}, and {0,0}, while the pattern is uniform, as shown in Figure 17. These runs were conducted in the case of disaster and no strategy alone, to understand the impact of controlling the amount of reports and rumors alone.
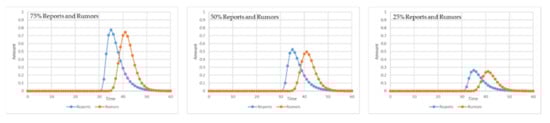
Figure 17.
Variation in the amount of reports and rumors.
The effect of varying the amount of reports and rumors on the SCP is shown in Figure 18 using the stockoutness, whose values are given in Table 7. It can be seen that there is not much effect on the SCP, especially after the range falls below 0.5.
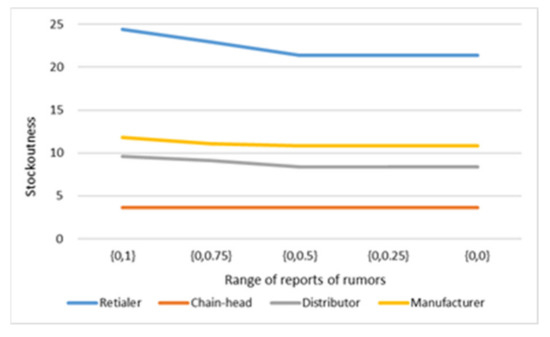
Figure 18.
Stockoutness of the supply chain tiers when the amount of reports and rumors is varied.
Table 7.
Stockoutness of the supply chain tiers when the amount of reports and rumors is varied.
Figure 19 shows the variation in the cumulative demand of the community with varying amounts of reports and rumors. It can be seen that there is a significant decrease in demand when the amount of reports and rumors is reduced to 0.75 and 0.5. However, a further decrease in the situational elements has no impact, as this demand is from consumers who have stopped tap water consumption. Hence, even the absence of the reports and rumors has resulted in increased demand.
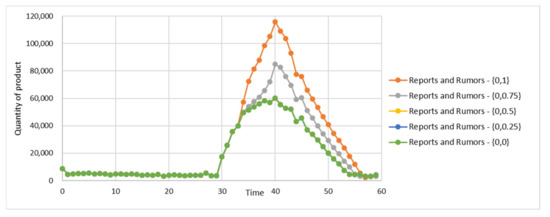
Figure 19.
Effect on cumulative demand due to the variation in the amount of reports and rumors (cumulative demand for cases with reports and rumors—{0,0.5}, {0,0.25}, and {0,0} overlap, as the demand is similar).
Figure 20 shows the effect on the satisfaction of the consumers by varying the amounts of reports and rumors. Similar to the effect on cumulative demand, decreasing the amount of reports and rumors from 1 to 0.5 helps in reducing the peak of the zero satisfaction consumer curve from around 1000 in the disaster case to around 700. However, a further decrease in the amount of reports and rumors has no effect due to the presence of the demand of consumers who have converted to bottled water following the disaster.
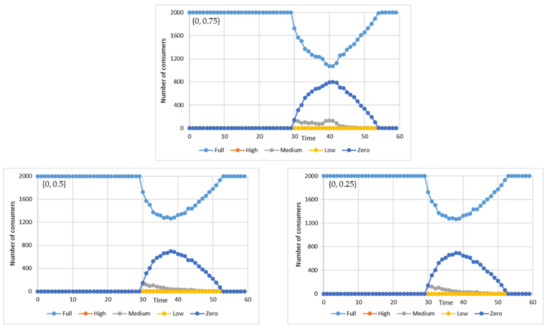
Figure 20.
Effect on consumer satisfaction due to the variation in the amount of reports and rumors.
4.7. Effect of Variation in the Number of Panic Buyers
The presence of panic buyers increases product demand, disrupts the supply chain, negatively affects consumer satisfaction, and influences their neighbors to panic-purchase. Hence, it is important to investigate the impact of the presence of panic buyers on the system. In the current context, a consumer is a panic buyer if s/he stockpiles, i.e., if the panic buying factor () is greater than 1.5. With this understanding, the survey showed that 29.6% of the respondents were panic buyers. We considered several cases by reducing the number of panic buying consumers from 29.6% to 0%, as shown in Table 8. The last case was set such that is 1 for all the households. Hence, no consumer stockpiles or increases their purchase quantity. The distribution of the panic buying factor for consumer agents is also shown. The simulations for these cases are considered with the case of disaster and no strategy.
Table 8.
Distribution of the panic buying factor of consumer agents with a varying number of panic buyers.
The effect of varying the number of panic buyers on SCP is shown through the stockoutness in Figure 21, with the values in Table 9. The impact on the supply chain with the reduction of panic buyers is not as significant; however, there is a slight decrease in stockoutness as the number of panic buyers decreases. This is because the change in the conditions due to the reduction of panic buyers is not significant to alter the SCP.
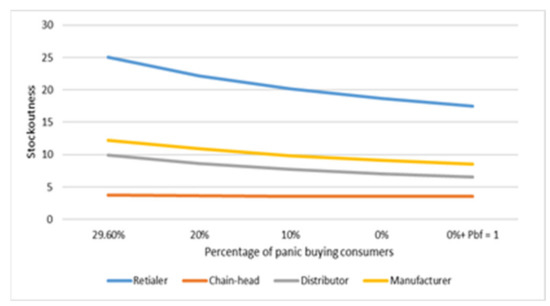
Figure 21.
Stockoutness of supply chain tiers when the number of panic buyers is varied.
Table 9.
Stockoutness of supply chain tiers when the number of panic buyers is varied.
Figure 22 shows the effect on cumulative demand. It can be observed that there is a gradual decrease in demand as the number of panic buyers is reduced. In the case with 0% panic buyers and = 1 for all consumer agents, the cumulative demand is still high. This demand is due to consumers who have stopped tap water consumption and due to the presence of consumers who make a purchase at every interval because of the situational factors of reports and rumors.
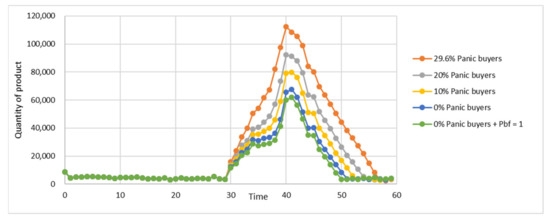
Figure 22.
Effect on cumulative demand due to the variation in the number of panic buyers.
The effect on consumer satisfaction is shown in Figure 23. Similar to the cumulative demand, there is a gradual decrease in the number of zero satisfaction consumers and a gradual increase in full satisfaction consumers with an even reduction of panic buyers.
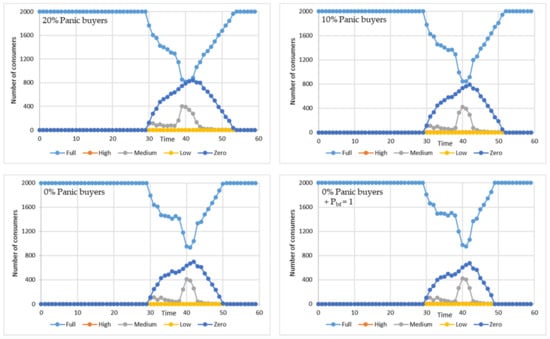
Figure 23.
Effect on consumer satisfaction due to the variation in the number of panic buyers.
5. Discussion
The purpose of this research is to understand how consumer behavior is affected due to disasters and mitigation measures and how these changes, in turn, affect the supply chain process targeting the demand risk [22]. It can be seen from the output of the above results that the model can be used to test any desired scenario to perceive possible outcomes.
The above results demonstrate an impact on the supply chain along with the effectiveness of the strategies considered. As reported in several past works, the consumer behavior undergoes radical changes after a disaster leading to increased demand of the product [4,6]. This change in consumer behavior has a negative effect on the supply chain, leading to disruption. The strategy of restricting sales implemented by retail stores is beneficial in controlling the supply chain disruption. The rationing system effectively avoids a crash of the supply chain and allows more consumers to procure the product. The model can also be used to study the time at which mitigation measures should be implemented, as it can be seen that a delay in the implementation of strategies can cause a delay in recovery. Therefore, looking at the performance of strategies, an early implementation of the measures would produce favorable outcomes. It would also help the community to recover faster from negative disaster consequences. However, this model can be used to develop and test other strategies that could contain the damage caused due to unforeseen occurrences.
This model helps us to understand the outcome with varying degrees of situational elements. The strategies when employed by only a portion of stores create imbalance and reduce the effectiveness of the strategy. However, a scenario where many stores employ the strategy could be a step forward in controlling the panic situation. Regarding media reports, it was seen that restricting them by 50% led to a significant decrease in demand, which headed to increased availability of the product. Hence, if authorities can contain information broadcasts about panic buying and shortages, it could facilitate in reducing panic among consumers considerably. Along with media, people are highly influenced by the actions of others. The decrease in the number of panic buyers resulted in a proportional decrease in the demand, and in turn, the number of zero satisfaction consumers decreased.
The increased demand and unavailability of the product immediately after disaster is in accordance with previous reports during past disasters [14,17]. The findings of this work on the strategies were found to be consistent with previous belief regarding the efficiency of the quota policy [3,10] in bringing the situation to control and it would reassure the stakeholders for the continuation of this strategy in crises. However, the outputs highlight rationing, as it could be appealing for supply chain managers and researchers to work on better implementation methods of this strategy. The impact of media, contrary to the popular belief of being a major influencer [8], was found to have 50% impact in this case.
The above observations are based on the settings used for the simulation. Hence, increasing the scope or settings could possibly result in a different outcome according to the inputted setup. Nevertheless, this analysis puts forward the usage and application of the model in multiple scenarios. The current work could benefit supply chain risk managers, as this tool allows us to understand consumer behavior and predict the demand for panic buying scenarios for any product. A survey can be conducted in a community to study their behavior in case of a disaster. When inputted with the actual data of the consumers in the community, this simulation tool will provide with the future demand and help the stores and supply chain managers to develop the BCPs for future disasters. In addition, the managers can identify the weak links, distribution issues. The stores can understand the reaction of the consumers and manage their activities by maintaining their image, service and quality. The optimal timing of implementing the mitigation measure can also be identified. These managers can test other mitigation measures to avoid supply chain disruption. This work can accommodate regular SC risks such as demand risks, supply risks, behavioral risks as mentioned by Katsalaki et al. [22] by using the modeling approach for quantitative analysis. The higher level SCAs can prepare resilient measures to satisfy their customer’s order or test the effectiveness of quota policy on the lower SCAs. The retail chains would particularly benefit from this tool, as they can acquire sufficient knowledge of the consumer behavior of their retail stores and develop quantitative plans to reduce impact in case of panic buying. As mentioned earlier, it could be of great help to policymakers in analyzing the consequences of large-scale disasters, to develop strategies such that the basic necessities are available to a maximum number of people. The information and broadcasting department can regulate media articles in order to reduce panic buying. The consumer model can be utilized by studies dealing with influence of government policies such as Liren et al. [13], Keane [18] and Prentice et al. [19] and to understand the consumer reaction to the policies. Furthermore, the consumer model for panic situations could be of interest to researchers, as it could be used for identifying reasons which instigated stockpiling, mentioned by Yuen et al. [6]. This can help several researchers to focus the study on the prime influencers. It is known from past literature that panic buying is a herd mentality. This model could allow us to investigate the diffusion of panic buying in the community. On the other hand, academicians can study the prominence of non-panic buyers in lending their hand to decrease mass panic buying and provide essential insights for a resilient society. Researchers can use the model to simulate panic buying among consumers, especially as a COVID-19 case study, and to strengthen the efficiency of supply chain process.
6. Conclusions
Consumer behavioral changes in uncertain situations, such as large-scale disasters, have a severe impact on supply chain management. We developed a multi-agent model of consumer panic buying and the supply chain that can be used to study the outcomes of several scenarios and to obtain an optimal approach to tackle the possible problems in the disaster aftermath. The model can analyze behavioral changes and identify reasons for the changes. The trial simulations show that strategies are beneficial in avoiding supply chain disruptions, with rationing being a more effective measure. An earlier implementation of quota policy lowers the impact on the supply chain while rationing can be implemented depending on the criticality of the situation. A 50% reduction of reports can reduce the demand significantly. Reduction of panic buyers has the potential to increase product availability. The tool could be useful in helping industries understand consumer behavioral changes and guiding them in developing optimal measures for a resilient supply chain. The model could also be beneficial for governments seeking to make necessary efforts to control chaotic post-disaster situations, where providing essentials to the citizens is one of its prime tasks. There is an increasing need for more work on panic buying to understand it better and improve situations in times of increasing disasters.
There is a vast scope of future work given the comprehensiveness of the model. The inter-agent communication in the current model is limited, which has to be improved for more realistic outcomes. Another limitation is that supply chain stakeholders do not take any action, apart from the implementation of strategies, when the disaster occurs, which is in contrast to reality. This has to be improved using methods such as emergency safety stock. The consumer characteristics are assumed to be static in the current model, but such characteristics are dynamic in nature, especially the psychological elements, and change depending on the situational factors, circumstances, and the environment.
Author Contributions
The current work was conceptualized and conducted at the Cognitive Systems Engineering Laboratory, The University of Tokyo, with critical inputs from all the authors. Conceptualization, R.D.; methodology, R.D. and K.F.; validation, R.D. and K.F.; simulation and analysis, R.D.; data curation, R.D.; writing—original draft preparation, R.D.; writing—review and editing, K.F. and R.D.; supervision, K.F and T.K. All authors have read and agreed to the published version of the manuscript.
Funding
This research received no external funding.
Institutional Review Board Statement
The study was conducted according to the guidelines of the Declaration of Helsinki, and approved by the Institutional Review Board (or Ethics Committee) of University of Tokyo (Approval No.: KE20-4 on 7 May 2020).
Informed Consent Statement
Not applicable.
Data Availability Statement
Not applicable.
Conflicts of Interest
The authors declare no conflict of interest.
References
- Fang, Y.; Shou, B. Managing supply uncertainty under supply chain cournot competition. Eur. J. Oper. Res. 2015, 243, 156–176. [Google Scholar] [CrossRef]
- Kumar, M.; Basu, P.; Avittathur, B. Pricing and sourcing strategies for competing retailers in supply chains under disruption risk. Eur. J. Oper. Res. 2018, 265, 533–543. [Google Scholar] [CrossRef]
- Shou, B.; Xiong, H.; Shen, X. Consumer Panic Buying and Quota Policy under Supply Disruptions. Working Paper; City University of Hong Kong: Hong Kong, China, 2016. [Google Scholar]
- Ballantine, P.W. Changes in retail shopping behaviour in the aftermath of an earthquake. Int. Rev. Retail Distrib. Consum. Res. 2013, 1, 28–42. [Google Scholar] [CrossRef]
- Strahle, W.M.; Bonfield, E.H. Understanding consumer panic: A sociological perspective. Adv. Consum. Res. 1989, 16, 567–573. [Google Scholar]
- Yuen, K.F.; Wang, X.; Ma, F.; Li, K.V. The psychological causes of panic buying following a health crisis. Int. J. Environ. Res. Public Health 2020, 14, 3513. [Google Scholar] [CrossRef] [PubMed]
- Wilkens, J.; The San Diego Union-Tribune. Why We Hoard: Fear at Root of Panic-Buying, Psychologists Say. Available online: https://www.sandiegouniontribune.com/news/health/story/2020-03-22/hoard-fear-panic-buying-psychology (accessed on 16 December 2020).
- Loxton, M.; Truskett, R.; Scarf, B.; Sindone, L.; Baldry, G.; Zhao, Y. Consumer behaviour during crises: Preliminary research on how coronavirus has manifested consumer panic buying, herd mentality, changing discretionary spending and the role of the media in influencing behaviour. J. Risk Financ. Manag. 2020, 13, 166. [Google Scholar] [CrossRef]
- Mussell, A.; Bilyea, T.; Hedley, D. Agrifood supply chains and covid19: Balancing resilience and vulnerability. Agri Food Econ. Syst. 2020, 1–6. Available online: http://www.agrifoodecon.ca/uploads/userfiles/files/agri-food%20supply%20chains%20and%20covid-19%20mar%2022-20(1).pdf (accessed on 16 December 2020).
- Yoon, J.; Narasimhan, R.; Kim, M. Retailers sourcing strategy under consumer stockpiling in anticipation of supply disruptions. Int. J. Prod. Res. 2018, 56, 3615–3635. [Google Scholar] [CrossRef]
- Dulam, R.; Furuta, K.; Kanno, T. Development of an agent-based model for the analysis of the effect consumer panic buying on supply chain disruption due to a disaster. J. Adv. Simul. Sci. Eng. 2020, 7, 102–116. [Google Scholar] [CrossRef]
- Dulam, R.; Furuta, K.; Kanno, T. Quantitative Decision-making Model for Consumer Panic Buying in Disaster Scenarios. In Proceedings of the 30th European Safety and Reliability Conference and 15th Probabilistic Safety Assessment and Management Conference, Venice, Italy, 1–5 November 2020. [Google Scholar]
- Liren, X.; Junmei, C.; Mingqin, Z. Research on Panic Purchase’s Behavior Mechanism. In Proceedings of the 9th International Conference on Innovation and Management, Eindhoven, The Netherlands, 14–16 November; 2012; pp. 1332–1335. [Google Scholar]
- Kurihara, A.S.; Maruyama, A. Luloff: Analysis of Consumer Behavior in the Tokyo Metropolitan Area after the Great East Japan Earthquake. J. Food Syst. Res. 2012, 18, 415–426. [Google Scholar] [CrossRef][Green Version]
- Cavallo, A.; Cavallo, E.; Rigobon, R. Prices and supply disruptions during natural disasters. Rev. Income Wealth 2014, 60, S449–S471. [Google Scholar] [CrossRef]
- Forbes, S. Post-disaster consumption: Analysis from the 2011 christchurch earthquake. Int. Rev. Retail Distrib. Consum. Res. 2017, 27, 28–42. [Google Scholar] [CrossRef]
- Lindsay, L.; Hyunju, S. Fear during natural disaster: Its impact on perceptions of shopping convenience and shopping behavior. Serv. Mark. Q. 2018, 39, 1–17. [Google Scholar]
- Keane, M.; Neal, T. Consumer Panic in the COVID-19 Pandemic. J. Econom. 2020, 220, 86–105. [Google Scholar] [CrossRef] [PubMed]
- Prentice, C.; Chen, J.; Stantic, B. Timed intervention in covid-19 and panic buying. J. Retail. Consum. Serv. 2020, 57, 102203. [Google Scholar] [CrossRef]
- Bernstein, P.L. Against the Gods: The Remarkable Story of Risk; John Wiley and Sons. INC: New York, NY, USA, 1996. [Google Scholar]
- Christopher, M.; Peck, H. Building the Resilient Supply Chain. Int. J. Logist. Manag. 2004, 15, 1–13. [Google Scholar] [CrossRef]
- Katsaliaki, K.; Galetsi, P.; Kumar, S. Supply chain disruptions and resilience: A major review and future research agenda. Ann. Oper. Res. 2021, 1–38. [Google Scholar] [CrossRef]
- Mensah, P.; Merkuryev, Y. Developing a Resilient Supply Chain. Procedia Soc. Behav. Sci. 2014, 110, 309–319. [Google Scholar] [CrossRef]
- Ivanov, D.; Wendler, E. Natural Disasters and Supply Chain Disruption Management. Handbook of Disaster Risk Reduction and Management; World Scientific: New York, NY, USA, 2017; Available online: https://www.worldscientific.com/doi/10.1142/9789813207950_0010 (accessed on 16 December 2020).
- Inoue, H.; Todo, Y. Firm-Level Simulation of Supply Chain Disruption Triggered by Actual and Predicted Earthquakes. SSRN Electron. J. 2017, 841–847. [Google Scholar] [CrossRef]
- Giannakis, M.; Louis, M. A multi-agent based framework for supply chain risk management. J. Purch. Supply Manag. 2011, 17, 23–31. [Google Scholar] [CrossRef]
- Zheng, R.; Shou, B.; Yang, J. Supply disruption management under consumer panic buying and social learning effects. Omega 2021, 101, 102238. [Google Scholar] [CrossRef]
- Tsao, Y.-C.; Raj, P.V.R.P. Product substitution with customer segmentation under panic buying behavior. Sci. Iran. 2019. [Google Scholar] [CrossRef]
- Hobbs, J.E. Food supply chains during the COVID-19 pandemic. Can. J. Agric. Econ. Can. D’agroeconomie 2020, 68, 171–176. [Google Scholar] [CrossRef]
- MacKenzie, C.A.; Barker, K.; Santos, J.R. Modeling a severe supply chain disruption and post-disaster decision making with application to the Japanese earthquake and tsunami. IIE Trans. 2014, 46, 1243–1260. [Google Scholar] [CrossRef]
- Russell, R.S.; Taylor, B.W. Operations Management, 7th ed.; John Wiley and Sons. INC: Hoboken, NJ, USA, 2011. [Google Scholar]
- Water Intake Calculator. Available online: https://goodcalculators.com/water-intake-calculator/ (accessed on 16 September 2020).
- Yano, K. Water Consumption Survey. 2007. Available online: https://unit.aist.go.jp/riss/crm/exposurefactors/documents/factor/food_intake/intake_water.pdf (accessed on 16 September 2020).
- Japan Today, Panic Buying Leaves Shelves Empty Following 2011 Earthquake. Available online: https://japantoday.com/category/national/panic-buying-leaves-shelves-empty-following-earthquake (accessed on 16 September 2020).
- Hori, M.; Iwamoto, K. The Run on Daily Foods and Goods After the 2011 Tohoku Earthquake. Jpn. Political Econ. 2014, 40, 69–113. [Google Scholar] [CrossRef]
- Statistics of Japan, (Official Statistics of the Japanese Government). Available online: https://www.e-stat.go.jp/stat-search/files?page=1&toukei=00450171&tstat=000001041744 (accessed on 16 September 2020).
- Ministry of Economy, Trade and Industry, Japan. Available online: https://www.meti.go.jp/statistics/tyo/syougyo/result-2/h26/index-gyodata.html (accessed on 20 September 2020).


Publisher’s Note: MDPI stays neutral with regard to jurisdictional claims in published maps and institutional affiliations. |
© 2021 by the authors. Licensee MDPI, Basel, Switzerland. This article is an open access article distributed under the terms and conditions of the Creative Commons Attribution (CC BY) license (https://creativecommons.org/licenses/by/4.0/).