Abstract
In this study, the life cycle assessment (LCA) principle was performed to estimate the environmental impact of three dairy farms that operate using different farming systems, namely, conventional (CON), organic (ORG), and high-quality (HQ) modes. In Italy, the typical style of high-quality (HQ) farming is commonly included in the conventional system but is more strictly regulated by the Decree of the Italian Ministry of Health N° 185/1991. Although the farms are not fully representative of each conduct, they showed intrinsic peculiarities, e.g., the cow-culling rate of each system. This rate requires a quantification as it may be related to loss of income. Allocation criteria were applied to attribute the quantities of pollutants to the co-products: wheat, involved in the congruence and number of cows culled, the latter being undesirable and therefore necessary to quantify. Analysis of variance (ANOVA) highlighted that the no-dairy products significantly mitigated (p < 0.05) some of the impacts’ categories. The allocation of culled cows decreased the impacts of the CON and particularly those of the ORG farms when the mass mode was adopted. HQ showed values similar to the results without allocation. Overall, the objective of identifying a “marker” of undesirable products, estimated by the culling rate, was partially achieved.
1. Introduction
The main greenhouse gas (GHG) emissions attributed by the International Panel of Climate Changes (IPCC) to the agricultural sector are methane (CH4) and nitrous oxide (N2O). Animal enterprises are responsible for the production of GHG in the form of CH4 from enteric fermentations (EF), N2O deriving from nitrogenous fertilizers, and CH4 and N2O emitted from manure managed under intensive farming conditions or direct manure deposition on pastures in more extensive systems [1]. Despite global warming potential (GWP) being the most significant contributor affecting GHG emissions, other impact categories are implied by the life cycle assessment (LCA) criteria, e.g., eutrophication, acidification, land use, or land occupation. In Europe, within the animal production sector, dairy milk production shows the highest environmental impact in terms of GHG emissions (28–30%), along with beef (28–29%) and pork production (25–29%) [2]. The primary product of the dairy farms is milk, whose yield has rapidly expanded during the last decades, particularly in developing countries. Besides yield, health and biological functioning of dairy cattle are often prioritized, recognized as remarkable physiological and metabolic adaptations in dairy cows, essential for good reproductive and productive performances [3,4]. Alexandratos and Bruinsma [5] suggested that milk consumption is expected to double by 2050 compared to 2000, probably due to the projected population growth. A widespread bibliography shows that the LCA methodology has been applied to a wide range of dairy products from cattle [6,7,8,9,10], dairy buffaloes [11,12], and dairy goats [13,14]. Other authors performed LCA on beef production [15,16], also considering milk as a co-product [17] in the framework of the allocation criterion. González-García et al. [18] evaluated the carbon footprint (CF) of milk provided by conventional grazing systems and emerging intensive practices, but no significant environmental differences were found. Numerous studies investigated the environmental performances of organic and conventional milk [19,20,21]. The organic food market has increased deeply in recent years and the success of organic foods is common to many countries in the world. Pirlo and Lolli [10] showed that this trend has been particularly favorable for the dairy sector, mainly due to the special attention of consumers to environmental sustainability and animal welfare. In the European Union, organic production is harmonized by the Commission Regulations (EC) N° 834/2007 and N° 889/2008 [22,23], which include several aspects intended to protect the environment. In organic farming, pesticides and synthetic fertilizers are banned, animal operations without land are not permitted, and there are strict constrains to stocking rate; there is also a limited use of drugs for animal husbandry. Particularly, the discipline of organic conduction imposes double suspension times for the sale of milk obtained from pharmacologically treated animals; thus, the cows that require frequent pharmacological treatments will be excluded from the system. Dairy systems—sensu lato—and organic systems—sensu stricto—are commonly affected by undesirable culling rates, which often result in lost income. The specific category of conventional production, called high-quality (HQ) milk, is regulated by the Decree of the Italian Ministry of Health N° 185/1991, which imposes rigorous breeder management, hygienic controls, and specific limits regarding the content of fat, protein, bacterial load, somatic cells, lactic acid, and non-denatured soluble serum proteins. This study compared three farms, belonging to three production systems (HQ, organic (ORG), and conventional (CON)). The choice concerned companies with shared and comparable characteristics, desirable for an LCA approach. The farms are located in southern Italy, in areas with very similar average annual temperatures, heights, and latitude. They are family-run business, i.e., all the farm operations are conducted without salaried workers, and the three companies share the same management of water resources, as drinking water only is adopted.
2. Materials and Methods
The LCA methodology, in compliance with the principles established by ISO standards [24,25] and the carbon footprint guidelines defined by Fédération Internationale du Lait-International Dairy Federation [26], was performed in this study.
The principles and framework for the LCA include four distinct phases: (1) definition of the goal and scope (including functional unit, and limits of the system); (2) the life cycle inventory (LCI) analysis (including the input and output data collection for all processes); (3) the life cycle impact assessment (LCIA); and (4) the life cycle interpretation.
2.1. Goal and Scope Definition
The goal of this study was to compare the environmental effects of milk production obtained from three farms with the following production systems: high-quality (HQ), organic (ORG), and conventional (CON). Global warming potential (GWP, kg CO2-eq), terrestrial acidification (TA, kg SO2-eq), freshwater eutrophication (FE, kg P-eq), marine eutrophication (ME, kg N-eq), agricultural land occupation (ALO, m2y), water depletion (WD, m3), metal depletion (MD, kg Fe-eq), and fossil depletion (FD, kg oil-eq) were included as impact categories. Moreover, the allocation was also evaluated. This approach, widely adopted for by-products (e.g., sold calves, wheat, straw), was used to assess the “weight” of the culled cows, not considered as by-products but, rather, products to avoid. In this way, pioneeringly, the present manuscript intends to show that these animals could be accounted for as a source of pollutants, contrary to the common role they play in the allocation, through which the environmental impacts are mitigated.
2.2. System Boundary Definition
The system boundaries considered in the study are shown in Figure 1, from cradle to farm gate. All operations pertaining to forage production and animal feeding were considered. The analysis took into account the indirect consumptions and emissions derived from the production of chemical fertilizers, seeds, and pesticides; production, transport, and processing of purchased feeds; fossil fuel extraction; and maintenance of agricultural equipment and machines. Any on-farm activities (i.e., feed production, electricity and energy use, manure, and animal management) as primary data, and the corresponding emissions, were considered. Synthetic fertilizers and pesticides were absent both in HQ and ORG companies but employed in the CON farm. The arable land of the three companies was not irrigated. The transport of off-farm feeds was also included in the assessment. According to the organic guidelines, the “ORG” farm was partially pasture-based.
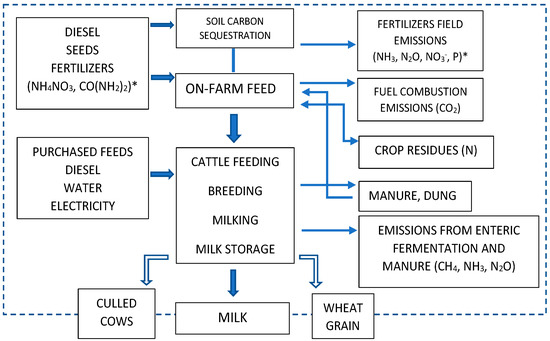
Figure 1.
System boundaries of the three farms (* conventional (CON) farm only).
2.3. Functional Unit
The functional unit (FU) chosen was 1 kg of fat- and protein-corrected milk (FPCM), in accordance with the indications given by the Food and Agriculture Organization [27] and other studies [9].
2.4. Allocation Criteria
The dairy system is a multifunctional process [10], as it can produce crop or meat from calves [28] in addition to milk. In this work, three different criteria were adopted: no allocation, economic allocation, and mass allocation.
2.5. Inventory Analysis
The HQ, ORG, and CON farms (sized 14, 90, and 103 ha, respectively) are family-owned with specialized dairy cattle kept in confinement and located in southern Italy (Campania and Apulia). The primary data were obtained from the 3 farms whereas the distinguished productive systems coincided with each company. Sexed semen is mainly adopted for heifers in the three companies. The females are kept as replacers in the amount described by owners and the male calves are sold at the 15th day of life; thus, the inputs and outputs provided by males were not considered. In the three companies, the straw is reused as a by-product of wheat grain (Triticum durum Desf.), sold as food. In the HQ farm, almost all straw must be purchased. In this company, both alfalfa and meadow hay are cultivated, with 3 cuts in the year, whereas the ORG and CON companies can rely on a single cut of meadow hay.
2.5.1. The Companies
The high-quality (HQ) farm is in Campania, Salerno Province (40°38′ N; 15°14′ E), 210 m above sea level. The average annual temperature is 15.3 °C, with average rainfall of 1190 mm/year, estimated between 1996 and 2012 [29]. All the animals kept are Holstein Friesian breed. Raw milk is sold as high-quality milk, an Italian label regulated by the legislation already described. This milk is mainly addressed to fresh pasteurized consumption. The average yield of alfalfa and meadow hay is, respectively, 10 and 15 t ha−1 year−1; moreover, the wheat’s arable land has an average yield of 3.6 and 2.8 t ha−1 year−1 for straw and grain, respectively.
The productive values of hay, more significantly compared to the yields described below, are justified by the soil’s fertility, finding the HQ farm in the middle Sele Valley. The higher rainfall improved the hay’s yield. At the other hand, both companies of Apulia are located on a karst plateau, called “Le Murge”.
The organic (ORG) farm, located in Apulia, Taranto Province (40°38′ N; 16°56′ E), is at 235 m above sea level, with an average annual temperature of 15.1 °C and average rainfall of 628 mm/year, estimated between 1996 and 2012 [29]. The company adheres to the organic disciplinary currently in force in Italy and two breeds are reared, Brown Swiss and Italian Simmental, respectively, in a 6:4 proportion. The cropland (more than 50% of the farm) is dedicated to meadow, with a mean yield of 6 t ha−1 year−1 for the harvested hay, and to wheat. Cereal cultivation is also linked to organic disciplinary, with average yield of 1.5 and 3 t ha−1 year−1 for straw and grain respectively. The remaining area of the farm is pasture-based.
The conventional (CON) company is the biggest one, settled in Bari Province (40°48′ N; 17°08′ E), Apulia, 420 m above sea level and with an average annual temperature of around 15.5 °C and average rainfall of 628 mm/year, estimated between 1996 and 2012 [29]. Two breeds are reared, Brown Swiss (~90%) and a few Holstein Friesian cows. The milk is sold without labelling constraints; thus, it can be conveniently processed (e.g., cheese, butter, yogurt, and cream). The arable area of this farm is divided between meadow, with an average hay yield of 6 t ha−1 year−1, and wheat, with similar production of straw and grain (3 t ha−1 year−1). The characteristics of the three farms are reported in Table 1.

Table 1.
Main characteristics of the different dairy farms.
2.5.2. Input Data
Inventory data covering livestock production, crop cultivations, straw for litter, inputs for purchased feeds, electricity, diesel consumption, fertilizers (where adopted), farm extension (arable ha/year and pasture ha/year), and shed and milking parlor (assuming a productive life of 50 years for these buildings, as suggested by Ecoinvent3 allocation default database) were elaborated as the primary data.
The on-farm feed was assumed to be transported for 1 km with a tractor (Transport, tractor and trailer, agricultural (GLO), processing, Alloc, Def, S) whereas the bought feed, carried by truck, was computed based on the distance from the farm, as suggested by Bragaglio et al. [15]. According to Nguyen et al. [30], soy meal used in EU is produced in Argentina and a 12,000 km travel with transoceanic ship (Transport, freight, sea, transoceanic ship (GLO), market for, Alloc, Def, S) was assessed. Moreover, transport by truck, from the Italian harbor to farm gate, was added to this computation. In Italy, sunflower meal feed, in most cases, is also imported [31]; thus, a 2700 km travel distance by truck from Ukraine was assessed. Similarly, we assumed the distances for the other national fodders (assumed to be transported by the same lorry, i.e., freight lorry > 32 metric ton, EURO5, (RER)). Diesel consumption, related to on-farm operations, was obtained by direct interviews, and for the fuel provision we considered transport with a freight lorry of 3.5–7.5 metric ton, EURO5 (RER) truck. Interviews also provided data related to electricity consumption. For water consumption, there are two different sources of information:
- (1)
- The water used for the purchased products (e.g., the soy irrigated in South America) is counted in a specific category, available in the SimaPro database.
- (2)
- The on-farm water consumption was assessed with specific scientific literature [32,33]; water ingestion of cattle was distinguished for category (lactating cows, dry cows, heifers, and calves). Water requirements for milking operations, such as washing of cows, the milking parlor, and milk-line and milk tank, were obtained from interviews with farmers. As declared and confirmed by other studies [34], in these activities only drinking water was considered. The LCA community has started to incorporate the water footprint (WF) into LCA [35]; it was identified as blue water in the water footprint criterion; however, the impact category chosen in the present study was the water depletion (WD).
Obviously, water is a necessary input useful to the cultivation of forage, as it is used for the production of purchased feeds, fodder, and concentrates. In Table 2, the formulation and composition of the diets fed in the three farms are showed, respectively, for cows (lactating and dry) and heifers. In particular, the autochthonous pasture characteristics are those indicated by Manuelian et al. [36], whereas the grass intake was calculated as suggested by NRC [32] guidelines. Calves were fed as follows. In the HQ farm, purchased whey powder (~1500 kg/year) was provided, in addition to increasing the amount of fodder. In the ORG farm, the dam’s milk, with free access to pasture and to hay, was provided to the mother.
Table 2.
Composition of the diets.
Powder milk (~350 kg/year) with a weaning concentrate (~6500 kg/year) were provided in the CON farm. These data, obtained with interviews to farmers, have been loaded into the software and refer to females, the inputs for males being excluded. The milk performances are shown in Table 3.
Table 3.
Dairy performances and milk components.
2.6. Emissions
Total emissions were estimated for each farm, including fuel combustion, electricity consumption, enteric emissions, crop residues emissions, manure management, and emissions due to chemical fertilization (CON farm) or deposition of urine and feces during grazing (ORG farm). The Intergovernmental Panel on Climate Change [37,38,39] methodology was adopted, considering the relationship between gross energy intake and emissions.
2.6.1. Livestock Enteric Emissions
Considering the availability of data about gross energy (GE) intake per head, distinguished in different rations for each livestock category, the Tier 2 method was chosen, approaching the methane emissions. Equation (10.21) (provided by Volume 4, Chapter 10, which is useful to assess the livestock emissions) below was adopted:
where:
EF = [GE * (Ym/100)*x/55.56]
EF = emission factor, kg, CH4 head−1 x−1;
GE = gross energy intake, MJ head−1 provided by different ingredients, expressed as dry matter;
Ym = methane conversion factor, per cent of gross energy in feed converted to methane. Ym in dairy cows is assumed 6.5 ± 1.0%, in this study chosen as 5.5, considering the high dairy yield;
x = is the mean period, expressed in days, assumed for each livestock category, 60, 305, and 365 days, respectively, for dry cows, lactating cows, and heifers. The enteric emissions of calves are not considered;
55.65 = is the energy content of methane (MJ/kg CH4).
The data about GE supplied by different feed sources (e.g., hay, straw, and soybean meal) were provided by INRAE [40]. The different percentages of feed were also considered for the assessment of the GE.
2.6.2. Methane Emissions from Manure Management
Considering the manure and its management characteristics, the Tier 2 method was adopted for these emissions, using the Equation (10.23) as follows:
where:
EF = (VST*x)*[ B0(T)*0.67 kg/m3*Σ s,k *MCFS,k/100*MS(T,S,k)]
EFT = annual CH4 emission factor for livestock category T, kg CH4 animal−1 days−1;
VST = daily volatile solid excreted for livestock category T, kg dry matter animal−1 days−1;
x = basis for calculating annual vs. production, days year−1;
B0(T) = maximum methane producing capacity for manure produced by livestock category T, m3 CH4 kg−1 of vs. excreted. IPCC guidelines suggest a default value of 0.24 for dairy cattle in Western Europe;
0.67 = conversion factor of m3 CH4 to kilograms CH4;
MCF(S,k) = methane conversion factors for each manure management system S by climate region k, %. IPCC guidelines suggest default values of 1.5% and 4.0%, respectively, for pasture and solid storage in dairy cattle with an annual average temperature between 15 and 25 °C;
MS(T,S,k) = fraction of livestock category T’s manure handled using manure management system S in climate region k, dimensionless. Default values of 36.8% and 20.0% are suggested by the IPCC, respectively, for solid storage and pasture for dairy cattle in Western Europe.
According to the Tier 2 method, the VS content of the manure and urine is estimated with the following Equation (10.24):
where:
VS = [GE*(1-DE%/100) + (UE*GE)]*(1-ASH/18.45)
VS = volatile solid excretion per day on a dry-organic matter basis, kg vs. day−1;
GE = gross energy intake, MJ day−1;
DE% = digestibility of the feed in percent. The different amount of feed was also considered for the assessment of the DE. Similar to gross energy, the data provided by INRAE were adopted for digestibility [40];
(UE*GE) = urinary energy expressed as fraction of GE. Typically, 0.04 GE can be considered urinary energy excretion by most ruminants and this value was adopted in the current study;
ASH = the ash content of manure calculated as a fraction of the dry matter feed intake, suggested as 0.08 for cattle, also assumed in this study. A very similar value was calculated considering the three diets in the three farms (0.078 ± 0.008);
18.45 = conversion factor for dietary GE per kg of dry matter (MJ kg−1).
2.6.3. N2O Emissions from Manure Management
Despite the IPCC providing equations useful to assess the intake and excretion of nitrogen (N), in this research, the amount of N was adopted from previous estimations [41]. The authors investigated lactating and dry cows, heifers, and calves with biological, biometric, and productive characteristics comparable with the livestock of our farms. The cited IPCC criteria were excluded considering the high uncertainty in these estimates (±50%), as suggested by the judgement of IPCC expert group [42].
The N excretion rate obtained in the literature above [41] assumed the following productive performances for lactating cows: 31.4 kg FPCM milk yield day−1 head−1; 3.62 ± 0.67 milk fat % (mean ± SD), and 2.99 ± 0.34 crude protein % (mean ± SD); the other data regarding the chemical composition of the diets together with the ones of our research are reported in Table 4.
Table 4.
Dry matter intake (DMI) and crude protein (CP) composition of the diets administered to the different groups (lactating cows, dry cows, and heifers) of the three farms (HQ, ORG, and CON) in comparison with the data reported in the literature [41].
An equation useful to assess the N excretion, adopted by Nennich et al. (2005) [41], is the following:
where:
NE = (DMI*Dietary CP%*84.1) + BW*0.196
NE = the nitrogen excreted day−1 amount;
DMI = is the dry matter intake day−1;
Dietary CP% = is the percentage of crude protein ingested day−1;
BW = is the body weight of the animal.
In this research, we took the values obtained with this equation as 0.491, 0.228, 0.117, and 0.063 kg/day, respectively, for a lactating cow, dry cow, heifer, and calf.
A check was done and assuming an average weight of 650 kg for the lactating cows, the amount of N excreted was 0.483 kg/day for HQ.
Direct N2O Emissions
The Tier 1 method is chosen for direct emissions, adopting Equation (10.25) below:
where:
N2OD(mm) = [ΣS[ΣT(NT*NexT*MST,S)]*EF3S]*44/28
N2OD(mm) = direct N2O emissions from manure management in the country, kg N2O year−1, assuming for each livestock category, 60, 305, and 365 days, respectively, for dry cows, lactating cows, heifers, and female calves;
N(T) = number of heads in each livestock category on the farm;
Nex(T) = annual average N excretion per head of livestock category, on the farm, previously assumed with the equation before;
MS(T,S) = fraction of total annual nitrogen excretion for each livestock category T that is managed in the manure management system S in the country, dimensionless; i.e., 0.37 and 0.20, respectively, for solid storage (straw litter) and pasture. These default values are provided by Table 10A-4 [37];
EF3(S) = emission factor for direct N2O emissions from the manure management system S in the country, kg N2O-N/kg N in the manure management system S; i.e., 0.005 and 0.01, respectively, for solid storage (straw litter) and pasture. These default values are provided by Table 10.21 [37] for solid storage and Table 11.3 [38] for pasture;
S = manure management system;
T = category of livestock;
44/28 = conversion of (N2O-N)mm emissions to N2Omm emissions.
Indirect N2O Emissions
Specific equations are useful to estimate nitrogen losses; subsequently, these data will be assessed for the indirect emissions due to volatilization and leaching. Particularly, the Tier 1 method is applied to estimate the volatilization losses, whereas the leaching losses are estimated using the Tier 2 method [37].
The following equations (10.26 and 10.28) are adopted to assess N due to volatilization and leaching, respectively:
where:
NVOLATILIZATION-MMS = [ΣS[ΣT(NT*NexT*MST,S)*(FracGASMS/100)T,S]
NLEACHING-MMS = [ΣS[ΣT(NT*NexT*MST,S)*(FracLEACHMS/100)T,S]
Nvolatilization-MMS = amount of manure nitrogen that is lost due to volatilization of NH3 and NOx, kg N year−1;
Nleaching-MMS = amount of manure nitrogen that leached from manure management systems, kg N year−1;
N(T) = number of heads per livestock category on the farm;
Nex(T) = annual average N excretion per head of livestock category, in the farm;
MS(T,S) = fraction of total annual nitrogen excretion for each livestock category T that is managed in manure management system S in the country (Western Europe), dimensionless; i.e., 0.37 and 0.20, respectively, for solid storage (straw litter) and pasture. These default values are provided by Table 10A-4 of Volume 4, Chapter 10 [37], emissions from livestock and manure management;
FracGasMS = percent of managed manure nitrogen for each livestock category T that volatilizes as NH3 and NOx in the manure management system S, %; i.e., 20% and 10%, respectively, for solid storage (straw litter) and pasture. The first value is chosen from the range suggested [37] in Table 10.22 (10–40%), whereas the second is provided [38] for grazing dairy cattle in Table 11.3 of Volume 4, Chapter 11 (5–50%), N2O emissions from managed soils and CO2 emissions from lime and urea application;
FracLeachMS = percent of managed manure nitrogen losses for each livestock category T due to runoff and leaching during solid and liquid storage of manure. The percentage provided by Table 10.23 [37] of FracLeachMS was adopted for solid storage (30%), whereas for grazing cattle was chosen the percentage (15%), provided by Table 11.3 (10–80%) in the IPCC [38] guidelines.
For the farms without pasture, lower values than the default were chosen, considering the good agricultural practices described. Very low values were adopted for the organic company, which is partially pasture-based, because the animals are exclusively kept in the grazing area, within the range of the default emissions, and they use organic fertilizers, as per the IPCC. On the contrary, in this study, the manure and urine deposited by the cattle must be considered.
The emissions of N2O due to volatilization and leaching of manure were assessed with the following equations (10.27 and 10.29), whereas N losses were previously calculated.
where:
N2OG(MM) = (NVOLATILIZATION-MMS*EF4)*(44/28)
N2OG(MM) = indirect N2O emissions due to volatilization of N from manure management in the farm, kg N2O year−1;
EF4 = emission factor for N2O emissions from atmospheric deposition of nitrogen on soils and water surfaces, kg N2O-N (kg NH3-N + NOx-N volatilized)−1. The default value is 0.01 kg N2O-N (kg NH3-N + NOx-N volatilized)−1. Given in Chapter 11, Table 11.3 [38]:
where:
N2OL(MM) = (NLEACHING-MMS*EF5)*(44/28)
N2OL(MM) = indirect emissions due to leaching and runoff from manure management in the farm, kg N2O year−1;
EF5 = emission factor for N2O emissions from nitrogen leaching and runoff, kg N2O-N/kg N leached and runoff. Default value of 0.0075 kg N2O-N (kg N leaching/runoff)−1, given in Chapter 11, Table 11.3 [38].
2.6.4. Ammonia
Ammonia emissions were calculated with N values assessed and specific emission factor, i.e., 17/14 [43].
2.6.5. Emissions from Crop and Soil Residues
N2O and CO2 emissions from soils and crop residues are included in each crop input selected in the SimaPro database, although several categories were modified and accordingly loaded. For example, the carbon sequestration potential of permanent pastures was estimated between 0.01 and 0.3 Gt C year−1 [44]; thus, carbon sequestration was estimated according to Dollé et al. [45] and Pirlo and Lolli [10]. The CO2 emissions from livestock were not estimated because the annual net CO2 emissions are assumed to be zero as the CO2 photosynthesized by plants is returned to the atmosphere as respired CO2 [36].
2.6.6. Emissions Electricity and Diesel Fuel
The CO2 emitted during energy consumption, either directly from the combustion of fossil fuels or indirectly from electricity use, was estimated considering the amount of diesel fuel and the kWh of electricity consumed for farm operations. The amounts of purchased fuel were summed up to estimate the fuel used for general agricultural practices and animal feeding. As suggested by ENAMA [46], a standard value of 0.85 kg per liter as diesel density, and a 3.13 eq. emission factor to estimate CO2 release from the combustion of 1 kg of diesel were adopted. As for the electricity mix, we used the Italian emission factor (0.47 eq.) adopted in other studies [11].
2.7. Impact Assessment
The software SimaPro 8.01 PhD, Pré Consultants 2015 was employed to estimate the environmental impacts. The ReCiPe Midpoint (H) method was adopted, considering the 100-year perspective for the environmental mechanism of the midpoint impact category for climate change/global warming potential (CC/GWP) and terrestrial acidification (TA). The other impact categories chosen, i.e., freshwater eutrophication (FE), marine eutrophication (ME), agricultural land occupation (ALO), water depletion (WD), metal depletion (MD), and fossil depletion (FD), are not affected by the time horizon perspective. As suggested by other researchers [9], the ReCiPe was developed from the chain management by life cycle assessment (CML) and eco-indicator methods, and has been applied recently in different LCA studies focused on agro-food industries [34]. In accordance with the LCA approach, the results will be presented in the form of characterization (impact equivalents) and normalization, dimensionless.
According to the CO2-equivalent factors defined by the IPCC [37], the atmospheric emission of greenhouse gases (GHGs) are so defined: CO2 = 1; CH4 = 25; and N2O = 298. Only for this impact’s category was assumed as control the EPD 2013, also provided by Simapro 8.03. This method is largely adopted in Italy by the dairy industry to spread the milk’s carbon footprint. Other characterization factors used in the LCA for TA are 1.88, 0.7, and 1.0 SO2-eq for NH3, NOx, and SO2, respectively. FE and ME were distinguished, using, respectively, the P-equivalent and N-equivalent factors. As suggested in other studies [47,48], the characterization factors are 0.91, 0.036, and 0.013 P-eq for PO4, NH3, and NOx, respectively, whereas there are 2.85, 1.21, and 3.28 N-eq for PO4, NH3, and NO2, respectively. The characterization factors for ALO, WD, MD, and FD are described in the goal and scope definition.
3. Results and Discussion
3.1. Results without Allocation
The cradle-to-farm gate pollutant categories of the three farms/systems highlighted a lower average milk (fat- and protein-corrected milk, FPCM) yield in ORG (organic) than HQ (high quality) and CON (control) farms (Table 3), as corroborated by extensive literature [21,49]. This result can be attributed to the higher cattle performances obtained in intensive farming, irreconcilable with the organic discipline, which is a pasture-based system with a strict legislation on the use of veterinary medicines.
Global warming potential (GWP): This category, largely investigated by LCA practitioners, showed lower values in the ORG farm than the CON and HQ farms (Table 5a). The GWP related to the HQ was newly estimated in this study and a bibliographic comparison with similar categories is difficult as the HQ farms is a typical Italian production system. Other authors [50] compared mixed, grass-based, and mountainous systems, distinguished by organic and conventional methods; these researchers illustrated that organic milk has a similar or slightly lower impact than conventional milk when considering climate change. Flaten et al. [51] also found a higher amount of CO2 equivalents in conventional dairy farms compared with organic companies; however, these authors selected the energy and the protein outputs as a functional unit (FU). Sneath et al. [52], focusing their research on the manure store, reported CH4 emissions equal to 8.8 and 7.4 g C kg−1 of milk produced by the conventional farm and the organic farm, respectively. The authors highlighted that the difference in emissions between the two farms cannot be considered significant due to the large uncertainty in the emission measurements. Finally, for the GWP category, Baldini et al. [53] reported results ranging from 1.11 to 1.69 kg CO2-eq kg−1 FPCM that were aligned with values reported here and in other studies [19,54,55]. In dairy systems, this impact category is mainly affected by the methane emissions and feed production. Methane sources are enteric fermentation and manure or slurry. In the case of feed, on-farm or purchased, the pollutants can be agrochemicals, crop residues, and transport-related emissions. The three farms showed a similar percentage, 40% from both methane emissions and feed, as recognized in the literature [55], whereas the highest value of N2O emissions from manure management was found in the CON farm (5%). This percentage is probably due to the different management or to the significant concentrate-based supplementation of calves, absent in the other farms. Finally, although the companies have shown similar values, it can be argued that the HQ farm has been penalized by its relatively low milk yields.
Table 5.
(a) Cradle-to-farm gate life cycle impact categories, related to three dairy farms in Italy, distinguished for productive criterion (characterization). (b) Cradle-to-farm gate life cycle impact categories, related to three dairy farms in Italy, distinguished for productive criterion (normalization, dimensionless).
Terrestrial acidification (TA): Our results showed the lowest impact of TA in the ORG farm, despite no differences associated with 1 kg of FPCM produced in conventional or organic farms were observed by other authors [10,49]. The HQ farm displayed a TA level almost equal to the values reported by Noya et al. [34]. These authors, in environmental conditions comparable to ours, found 27.8 g SO2-eq, which is similar to the amount of the CON farm. Mu et al. [28] investigated 55 specialized milk production systems (Belgium, France, Germany, Ireland, Luxembourg, and Netherlands) and the mean of the TA related to 1 kg FPCM was 22.5 g SO2-eq. Herzog et al. [56] found a similar value (22.9 g). Sneath et al. [52] also investigated this category using SO2 equivalents and reported results ranging from 15.1 to 27.2 kg SO2-eq kg−1 FPCM; others [19], adopting a different FU (1 kg energy-corrected milk, ECM), found a large range of values (7.44–25.64 SO2-eq kg−1). Overall, data on the acidification impacts cited in other studies, between 6.5 and 15.6 g SO2-eq kg−1 FPCM, were lower than the present study [55,57,58]. Other studies, although focused on beef production [59], confirmed that extensive systems generally show lower TA values than intensive ones. Both production systems were grassland based; however, the first one required a larger grazing area. The authors found 2.8 and 3.8 g SO2-eq LWG−1 (LWG = live weight gain) for the extensive and improved system, respectively. In dairy cattle, the main contributors to terrestrial acidification are emissions of ammonia from manure management and manure application for the cultivation of raw feed materials [10]. Other authors [60] showed as the largest source of emissions to air and water from cattle production systems is the production of concentrate. These researchers found higher acidification for intensive systems due to the purchased feed and the higher NH3 emissions from manure (housing and manure storage). Our results are in agreement with the previous literature, showing a lower amount of SO2-eq in the ORG farm compared to the other companies. Moreover, the ORG farm showed a smaller contribution of manure emissions (16%) than HQ and CON (47 and 40%, respectively).
Freshwater eutrophication and marine eutrophication (FE and ME): In freshwater ecosystems, phosphorus is the limiting nutrient, therefore only phosphorus (P) emissions are considered and the impacts are expressed in terms of mg P eq. This impact category is affected by the conduction system but probably even more by the environmental conditions, such as temperature, relative humidity, or rainfall. Analogously, such a consideration could also concern ME.
In dairy systems located in the Po Valley (Italy), comparable impacts of about (150–260 mg P eq) or an average of 124 mg P eq were found [54,61]. Another research [62] investigating three representing intensive combined milk and meat production in Norwegian farms, adopting as the FU the kg of ECM, showing results similar to those reported in our study (>200 and <280 mg P). Interestingly, the highest impact was shown by the company with the widest pasture area. The eutrophication potential is often studied in LCA without distinction between freshwater and marine water, although freshwater impacts seem to be related to those of marine water eutrophication (ME). This category is often investigated adopting other characterization factors, i.e., NO3 or PO4 equivalents [10,28].
Several authors [10,19,49,57] investigated GWP, TA, and eutrophication potential (EP), adopting as the FU 1 kg−1 FPCM or energy-corrected milk (ECM), whereas none of them investigated EP distinguishing freshwater or marine eutrophication potential. In Norway, three farms representative of combined meat and milk production of the southwest (SW), central southeast (CSE), and central (C) areas have been modelled [63], adopting as the FU 1 kg ECM, resulting in, respectively, 10.0, 9.3, and 12.1 g N eq., mainly attributed to forage production; the companies were partially pasture-based. Mu et al. [28] estimated values between 1.7 and 19.4 g N eq. kg−1 FPCM (8.1 ± 4.0), considering on-farm processes (manure management, and milk and feed production) and off-farm processes (fertilizer and feed production) in agreement with our work, but they did not consider pesticides and water usage due to a lack of data. In four companies, ME values of 9.4–17.2 g N eq mainly caused by nitrate leaching and depending on the surplus of N per functional unit were found [54]. The authors suggested that on-farm marine eutrophication was higher on three farms than the other one for two reasons: the nitrogen fixed by lucerne, which causes an increase in the input of nitrogen on the farm, and the lower milk yield obtained in these farm [54].
The low values found in this work was probably due to an absence or poor amount of fertilizers (used in the CON farm only). On the other hand, the legume’s component of pasture-based farm may fix the nitrogen that, combined with a low milk yield, can likely explain the highest impact of the ORG farm, as showed in the normalization (Figure 2).
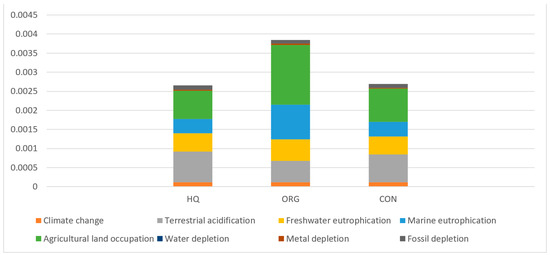
Figure 2.
The contribution per impact category, according to normalization, dimensionless, across the three farms (high-quality, organic, and conventional).
In this study, both eutrophication potential categories showed higher values in the ORG company. These categories are probably affected by the lower yield of milk, and the low grass production in the pasture.
Agricultural land occupation (ALO): Agricultural land occupation is defined as the area of land needed to produce the FU chosen; i.e., 1 kg FPCM. This includes grassland and cropland, as well as on-farm land use and land required to produce the imported feed. When land occupation is not directly available from a study, but sufficient data are available about the total land use and total milk production, land occupation (LO) is derived from the provided equation [64]:
m2/kg FPCM = total grassland or cropland requirement (Ha)*10,000 (m2)/kg FPCM
In LCA, agricultural land occupation (ALO), urban land occupation (ULO), and natural land transformation (NLT) are midpoint categories related to the environmental issue land use (LU), according to the ReCiPe method, whereas Impact 2002+ method attributes only to land occupation (characterized by m2 arable land-eq year−1) the impacts related to the damage category ecosystem quality. Organic farming mostly relies on grazing activity; thus, the ALO category is affected by grassland. Knudsen et al. [50] reported that land use for organic milk production was approximately 50% higher compared to conventional and mountainous systems, whereas it was only 12% higher in the grassland-based system, due to a combination of milk yield, grass yield, and feed intake, all higher than organic milk production systems. Gerssen-Gondelach et al. [64] showed that mixed and industrial systems are generally characterized by a lower land occupation than pasture-based systems. This was also confirmed by Pelletier et al. [65] for beef production in the USA as land occupation was 91.2 m2 kgCW−1 for mixed and 74.5 m2 kgCW−1 for industrial productions compared to 114.7 m2 kgCW−1 (CW: carcass weight equivalent) for a pasture-based system.
In European dairy productions, it was found [66] that land occupation was 1.5–2.4 m2 kg FPCM−1 for pasture-based and 1.2–1.7 kg FPCM−1 for mixed production. However, according to more recent studies [54], it was intuitively showed that the farms with extensive grassland production showed the highest land occupation. Our results highlighted a similar trend, with some caveats: the HQ farm showed the lowest values as this category was mainly affected by the ration for heifer and lactating cows (22 and 44%, respectively). Particularly, the dehulled and roasted transoceanic soybean had a significant role. The percentage of arable area was lower than 20%, this company being the smallest. Analogously, in the CON farm, the feeding of heifers and lactating cows highlighted the same ratio (1:2), although with lower percentages (16 and 33%), whereas the biggest farm extension (109 ha) affected the ALO at 39%. The feeding of dry cows contributed in both cases with very low percentages; the role of infrastructure and energy sources covered the remaining amount, 5.8% and 13%, respectively, for CON and HQ.
Despite the ORG farm being characterized by a smaller size (90 Ha) compared to the CON, its agricultural area gave the same percentage contribution. Farm extension is the main contributor of ALO in this company and the higher impacts (7 m2/year) could be justified by low yields. The normalization highlighted this peculiarity, the ALO being the critical category that makes the ORG farm less virtuous (Figure 2).
The pasture-based feed contribution attributed to the grass a share of at least 60%, both for lactating cows and heifers, the more representative herd’s animals. Such a representative share, together with a low yield, certainly needs a large agricultural area, exacerbating the normalized impact of the ORG company.
Water depletion (WD): Several studies provide data about water footprint (WF), distinguishing green water, blue water, and grey water. Arable lands are not irrigated and the interviews reported as tap water was adopted for animal requirements (drinking and washing). The facilities were also cleaned with tap water only. Results reported values comparable with the WD estimated by other researchers [34,67], equal to 0.52 m3 and 0.3 m3, respectively. Zucali et al. [68], focusing on 17 dairy goat farms, also found similar results (0.39 ± 0.15 m3) without specifying the distinguished contributors.
On the other hand, Bragaglio et al. [15], although investigating WD in beef, did not find a significant effect of production system (extensive vs. intensive).
There is a larger literature on the water footprint (WF) compared to the WD; however, the most representative subcategory of WF is the green water. In a global assessment of WF [69], the authors compared three dairy farming systems (grazing, mixed, and industrial) in several countries including the Netherlands (NL) and the United States of America (USA). In the NL, lower impacts than USA were found but both the pasture-based systems showed the highest values of WF, with 0.65 m3 * kg milk−1 and 1.25 m3 * kg milk−1, respectively. In our research were found amounts more similar to the Dutch ones and the CON farm showed the lowest values of WD. In the WD category also, the trend seems to be explained by higher yields, whereas the weighty HQ farm’s water consumption is probably related to the milking operations (cleaning and sanitation). Again, the milking parlor of HQ has more cubicles and a larger area than CON, whereas in the ORG farm the parlor is absent.
Metal depletion (MD): Metal depletion showed the highest and the lowest values in the ORG and CON farms, respectively. According to our best knowledge, there are no studies that have investigated FE equivalents on dairy productions. Abín et al. [70] included MD as a pollutant category when applying the LCA methodology to laying hens, showing that a great contribution was represented by packaging material, excluded by our system boundaries. Focusing on no processed FU (1 kg live weight) of beef production, a previous study [59] reported a very low amount of g Fe-eq in the extensive system compared to intensive system, respectively, 0.52 g and 53.6 g. Although these authors did not work on milk, the high variability reported for this parameter denotes that the MD category may not be system-affected.
Other researchers [71] chosen as the functional unit (FU) 1 ton of broiler’s feed and their study showed values within 18.5–24.3 kg Fe-eq, a range comparable to our results; i.e., 16.5, 21.1, and 26.9 g Fe-eq * kg FPCM−1, respectively, for the CON, HQ, and ORG company.
This research showed that, for the MD category, the main impact contributions from the components of the FU was the production of energy-rich and protein-rich ingredients (at least 90%). Similarly, we found that the energy sources, the facilities (diesel, electricity, shed, and milking parlor), and the feed gave the highest contribution. Nevertheless, differences among the farms were observed. In the HQ farm, the infrastructures and the energy sources contributed with the highest percentage (almost 60% represented by Shed, (GLO), market for; Milking parlor, (GLO), market for; Electricity, medium voltage, IT, market for; Diesel, (ROW), market for and Transports, i.e., Tractor, 4-wheel, agricultural, (ROW), market for; Lorry > 32 metric ton, EURO5, (RER), market for and Freight, sea, transoceanic ship, (GLO)), whereas in the CON and ORG farms this contribute dropped until 30% and 17% respectively. In the ORG company, the feed gave a very high contribution, particularly with purchased concentrates (20% Maize grain, feed, organic, (GLO), market for; 9% Soybean, organic, (GLO), market for).
The results highlighted that this category was probably affected, more by yields than by conduction.
Fossil depletion (FD). This impact category is strictly related to the amount of fuel and electricity consumption; thus, the data obtained from the interviews were highly important. In the ORG farm the lowest amount of oil equivalents appears to be related to the minimum tillage, commonly accepted by the organic farmers. The purchased feeds, such as protein sources (e.g., organic soybean or organic fava bean) or energy sources (organic maize grain), mainly provided to lactating cows, affected on the highest oil-eq amount (more than 50%) in the ORG farm, which, conversely, was characterized by the lowest contributor to electricity. On the contrary, in the HQ farm, the energy sources (28% of Diesel at refinery/L and 12% of Electricity, medium voltage, {IT}, market for) gave a significant contribute to FD, which showed the highest impact (167.1 g oil-eq). The CON farm, showed intermediate values of oil equivalents and, similarly to the ORG one, the purchased concentrates (e.g., sunflower seed meal, from crushing, at plant/UA), mainly represented in the lactating cow ration, which contributed to 48% of the total amount. Roer et al. [63], adopting as the FU 1 kg ECM, reported values ranging from 89.3 to 111 g oil-eq in the Norwegian farms previously described. Differently, Noya et al. (2018) and Verduna et al. (2020) [34,67] choosing as the FU 1 kg FPCM, showed low impacts for FD (41.5 and 55 g oil-eq, respectively). Knudsen et al. [50] estimated as impact category mineral, fossil and renewable resource depletion (mg Sb/kg FPCM) and showed that the organic production of milk from the grassland-based and mountainous systems contributed much less to this impact category than the organic milk from the mixed system. The mixed conventional system was also characterized by a higher resource depletion due to fossil energy-use related to imported feed, transport, and the production of home-grown feed.
3.2. Statistical Analysis of the Farms
The multivariate analysis, conducted through the study of the main components (PCA), after standardization of values, provided by the pca function of the “FactoMineR” R package and R core team [72,73], placed the three production systems in three areas of the graph, distant from each other (Figure 3). This indicates that the studied descriptors have a discriminating effect on the three production types as the position in the graph of the farms is well defined on three different quadrants.
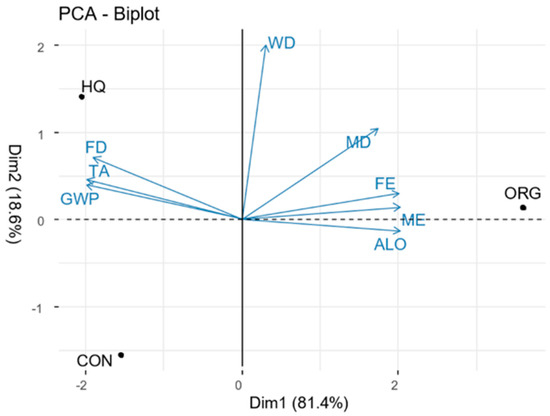
Figure 3.
Multivariate analysis (PCA) of the production systems. LCA descriptors with milk components.
In particular, the ORG farm is characterized by having the highest values of ME, ALO, FE, and MD, being placed on the right side of the biplot. The HQ farm is found on the opposite side, characterized by having the highest values of FD, TA, and GWP. These descriptors, obtained using the fviz_contrib function of the “FactoMineR” package, are the ones that carry the most weight on the first component of the PCA analysis (Figure 4a).
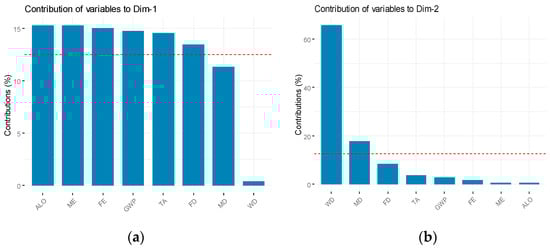
Figure 4.
(a) Loading on Component 1. (b) Loading on Component 2.
In the lower part of the biplot is placed the CON farm, characterized by the lowest levels of WD. This CON farm is displayed in a position close to the HQ farm relative to the first component, thus indicating that it has high values of FD, TA, and GWP and low values of ME, ALO, FE, and MD. With respect to the second component, the main descriptor that has its effect on the distribution of points is WD (Figure 4b).
The CON typology showed a more profitable system in terms of protein and lipid content, while the somatic cell count mostly affect the ORG system. Moreover, the investigation of the milk parameters throughout one year of production (data refer to 2019) showed a significant effect on somatic cell count, both between the farms and along the season (Figure 5). The ANOVA analysis, developed with the anova function of the “stats” R package, confirmed different levels (p < 0.001) of somatic cell counts in the milk produced by the three farms, with the lowest level shown by the HQ farm, in agreement with the Italian regulation in force. A temporal effect was especially highlighted in the ORG farm, indicating worsening health conditions of the husbandry over time.
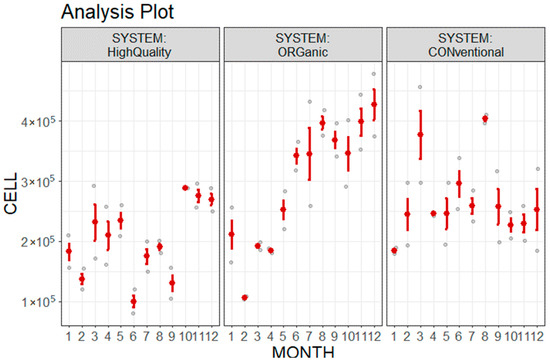
Figure 5.
Plot analysis of somatic cell count in the milk of the three farms throughout one year of production (Months 1–12).
3.3. Results with Allocation
Allocation is a widespread criterion, largely adopted in LCA, that was applied to determine the weight of the co-products, avoiding the expansion of system boundaries. In many dairy systems of southern Italy, the required straw is often produced on farm and, particularly in the three farms of this study, the straw is a typical co-product of wheat (Triticum durum Desf.), sold as human food. Culled cows are generally involved in the allocation criterion [8,61], but in this case, they are considered as products to avoid. Thus, a high rate of culled cows denotes an inadequate management whereas a low percentage will be considered useful to remove pollutants. In the allocation procedure, economic and mass methods were used and allocation factor (AF) was determined by the equation [72] below, usually adopted:
where:
AF(eco,mass) = (Veco,mass*P)milk/Σ(Veco,mass*P)milk,wheat grain, live weight cattle
AF is allocation factor;
Veco is economic value (€/kg); Vmass is mass amount (kg);
P is the total production on-farm (kg/year), milk as FPCM, wheat as harvested grain without straw; live-weight cattle as culled cows only.
No allocation, economic allocation, and mass allocation were applied to the environmental impact as showed in Table 6.
Table 6.
Results of the impact categories, in according with characterization approach, without allocation in comparison to those obtained with economic and mass allocations for the three farms (HQ, ORG, and CON). Economic and mass allocation were both corrected considering as undesirable the amount of culled cows. All the allocation criteria considered wheat grain also.
After the application of the Tukey test (p < 0.05), developed with the LTukey function of the “laercio” R package [73], the values significantly different from the relative unallocated data were highlighted on the series of data relating to each impact category. In the HQ farm, the allocation showed statistically different values than the unallocated value for the GWP category in all kinds of allocation, and for the FE and MD only by the MAGWCC allocation. In FD, the values have decreased according to all allocations, except for the EAGNCC one. In the ORG farm, GWP, TA, FE, MD, and FD resulted the categories that highlighted a statistically significant reduction in the impact value due to the allocation, for all the allocation modes. The ME and ALO categories showed decreased values only in the MAGWCC mode.
Finally, in the CON farm, statistically significant differences resulted from the GWP, TA, FE, and MD categories with decreased values according to all allocation criteria. In the FD, similarly to HQ farm, the allocation modes, except EAGNCC, reduced the oil equivalents.
The economic values of the milk and wheat grain were obtained from interviews to the owners and were applied to evaluate the economic allocation.
The income provided by the culled cows was assessed with the value provided by ISMEA [74,75] (average price at September 2020: 0.48€/kg for Holstein Friesian and 0.55€/kg for Brown Swiss and Italian Simmenthal, as indicated in the Commodity Exchange of Perugia) whereas the farmers declared the number of heads and the live weight estimated, distinguished for breeds. These incomes were also applied to evaluate the economic allocations of culled cows.
Analogously, the amounts (expressed in tons) of milk, wheat grain harvested on the farm, and live weight of culled cows were adopted to assess the mass allocation.
Economic values and amounts of the commodities are reported in Table 7, their percentage ratio distinguished in economic and mass values are also reported.
Table 7.
Mass amounts and economic incomes derived from milk, wheat grain, and culled cows. Income and mass percentages.
The live weight of cows is estimated as 650 kg for the HQ farm (Holstein Friesian only), 700 kg for ORG farm (60% Italian Simmenthal and 40% Brown Swiss), and 650 kg for CON farm (90% Brown Swiss).
4. Conclusions
In this research, a new perspective of the allocation is proposed. The allocation is commonly adopted to subtract pollutants from the FU (1 kg of FPCM, in this case), redistributing them to the co-products.
It was chosen to involve the wheat grain in the allocations criteria, as it is considered a co-product, in agreement with other authors [26]. Adopting this criterion, the inputs related to the crop (seeds, land, diesel, and fertilizers if adopted) were loaded into the software without lightening them in considering straw, which is always reused (in HQ, ORG, and CON) as feed or litter. In the three farms, all the grain is sold as food and all the straw reused.
Although a next goal will be to obtain more samples (companies), especially in terms of profitability, being mainly involved “family farms”, the assessment of economic and mass values of the FU and co-products could not be “equalized”, both for managerial choices and for intrinsic characteristics of the production system. The cow-culling rate is considered a strategical issue of the study and its percentage is representative of each system (HQ, ORG, and CON), with the highest value in the ORG farm.
As a result of the interviews, the HQ farm showed the lowest cow-culling rate, highlighted by the economic allocation. This was certainly emphasized by two elements: the low price of the Holstein Friesian cows and the lowest live weight compared to the Italian Simmental cattle. However, according to our knowledge, in the HQ mode, the choice of the genetic type is not binding, it is rather a careful management of the herd, as indicated by the low cell somatic count (Figure 5). Moreover, the lowest wheat yield in the HQ farm, although with a substantial weight in the allocation, should be considered as physiological for a dairy company oriented to high quality milk production.
The herd of the ORG farm is representative of the system as the Brown Swiss cattle ensures good yields whereas the Italian Simmental is suitable for grazing. The latter breed is also valid for beef production, a potential additional income for the company. Finally, the environmental and productive framework of the CON farm suggests that the genetic type adopted is fully representative of the system, the milk being suitable for processing.
The results obtained in this work were significantly affected by the allocation criterion, which was useful to assess the undesirable cow-culling rate. The economic mode has characterized the farms, without emphasizing the differences between the organic and the conventional companies. Conversely, the mass allocation highlighted a significant contribution (p < 0.05) in the organic farming for all the impact categories (except the water depletion), due to a more binding husbandry, respectful to the product specification.
This study is proposed as a model to follow, especially when in the future having wider and more representative samples, based on equally accurate primary data as adopted in this research.
Author Contributions
Conceptualization, R.R. and A.B.; methodology, A.B. and F.T.; software, A.B., E.R. and R.R.; validation, R.R. and G.G.; formal analysis, F.T. and E.R.; investigation, R.R.; resources, A.B. and R.R.; data curation, R.R.; writing—original draft preparation, R.R., A.B., F.T., E.R. and G.G.; writing—review and editing, F.T., E.R. and A.B.; visualization, G.G.; supervision, F.T. and R.R.; project administration, F.T. and A.B.; funding acquisition, A.B. All authors have read and agreed to the published version of the manuscript.
Funding
Andrea Bragaglio research activity is granted by European Union and Italian Ministry of Education, University and Research in the program PON 2014–2020 Research and Innovation”, framework Attraction and International Mobility-1839894, Activity 1. The project was approved by the Italian Ministry of Education, University and Research.
Institutional Review Board Statement
Not applicable
Informed Consent Statement
Not applicable
Data Availability Statement
(a) ISTAT: Istituto Nazionale di Statistica. https://www.istat.it/it/archivio/202875 (accessed on 11 January 2021). (b) FAOSTAT, 2020. www.fao.org/faostat/en/#data (accessed on 11 January 2021). (c) INRAE, www.inrae.fr. https://mediatheque.inrae.fr/ (accessed on 11 January 2021). (d) ENAMA, 2005. Handbook of fuel consumption for agricultural subsidized use (Prontuario dei consumi di carburante per l’impiego agevolato in agricoltura). Available from: http://www.enama.it/php/pageflip.php_pdf_enama_int_prontuario.pdf&dir/it/pdf/monografie (accessed on 11 January 2021). (e) http://www.ismeamercati.it/flex/cm/pages/ServeBLOB.php/L/IT/IDPagina/3011#MenuV (accessed on 21 September 2020).
Acknowledgments
The Authors are grateful to Gerarda D’Angelo, Francesca Mastrangelo, Giovanna Calzaretti and Francesco Giannico for their technical support.
Conflicts of Interest
The authors declare no conflict of interest.
References
- O’Mara, F.P. The significance of livestock as a contributor to global greenhouse gas emissions today and in the near future. Anim. Feed Sci. Technol. 2011, 166–167, 7–15. [Google Scholar] [CrossRef]
- Weiss, F.; Leip, A. Greenhouse gas emissions from EU livestock sector: A life cycle assessment carried out with the CAPRI model. Agric. Ecosyst. Environ. 2012, 149, 124–134. [Google Scholar] [CrossRef]
- Arfuso, F.; Fazio, F.; Levanti, M.; Rizzo, M.; Di Pietro, S.; Giudice, E.; Piccione, G. Lipid and lipoprotein profile changes in dairy cows in response to late pregnancy and the early postpartum period. Arch. Anim. Breed. 2016, 59, 429–434. [Google Scholar] [CrossRef]
- Fiore, E.; Arfuso, F.; Gianesella, M.; Vecchio, D.; Morgante, M.; Mazzotta, E.; Badon, T.; Rossi, P.; Bedin, S.; Piccione, G. Metabolic and hormonal adaptation in Bubalus bubalis around calving and early lactation. PLoS ONE 2018, 13, e0193803. [Google Scholar] [CrossRef] [PubMed]
- Alexandratos, N.; Bruinsma, J. World Agriculture: Towards 2030/2050: The 2012 Revision; ESA Working Paper No. 12-03; Food and Agricultural Organization (FAO): Rome, Italy, 2012. [Google Scholar]
- Daneshi, A.; Esmaili-Sari, A.; Daneshi, M.; Baumann, H. Greenhouse gas emissions of packaged fluid milk production in Teheran. J. Clean. Prod. 2014, 80, 150–158. [Google Scholar] [CrossRef]
- De Léis, C.M.; Cherubini, E.; Ruviaro, C.F.; da Silva, V.P.; Lampert, V.N.; Spies, A.; Soares, S.R. Carbon footprint of milk production in Brazil: A comparative case study. Int. J. Life Cycle Assess. 2015, 20, 46–60. [Google Scholar] [CrossRef]
- Vasilaki, V.; Katsou, V.; Ponsá, S.; Colón, J. Water and carbon footprint of selected dairy products: A case study in Catalonia. J. Clean. Prod. 2016, 139, 504–516. [Google Scholar] [CrossRef]
- Baldini, C.; Gardoni, D.; Guarino, M. A critical review of the recent evolution of Life Cycle Assessment applied to milk production. J. Clean. Prod. 2017, 140, 421–435. [Google Scholar] [CrossRef]
- Pirlo, G.; Lolli, S. Environmental impact of milk production from samples of organic and conventional farms in Lombardy (Italy). J. Clean. Prod. 2019, 211, 962–971. [Google Scholar] [CrossRef]
- Sabia, E.; Napolitano, F.; Claps, S.; De Rosa, G.; Braghieri, A.; Pacelli, C. Dairy buffalo life cycle assessment as affected by heifer rearing system. J. Clean. Prod. 2018, 192, 647–655. [Google Scholar] [CrossRef]
- Berlese, M.; Corazzin, M.; Bovolenta, S. Environmental sustainability assessment of buffalo mozzarella cheese production chain: A scenario analysis. J. Clean. Prod. 2019, 238, 117922. [Google Scholar] [CrossRef]
- Pardo, G.; Martin-Garcia, I.; Arco, A.; Yañez-Ruiz, D.R.; Moral, R.; Del Prado, A. Greenhouse-gas mitigation potential of agro-industrial by-products in the diet of dairy goats in Spain: A life-cycle perspective. Anim. Prod. Sci. 2016, 56, 646–654. [Google Scholar] [CrossRef]
- Gutiérrez-Peña, R.; Mena, Y.; Batalla, I.; Mancilla-Leytón, J.M. Carbon footprint of dairy goat production systems: A comparison of three contrasting grazing levels in the Sierra de Grazalema Natural Park (Southern Spain). J. Environ. Manag. 2019, 232, 993–998. [Google Scholar] [CrossRef]
- Bragaglio, A.; Napolitano, F.; Pacelli, C.; Pirlo, G.; Sabia, E.; Serrapica, F.; Serrapica, M.; Braghieri, A. Environmental impacts of Italian beef production: A comparison between different systems. J. Clean. Prod. 2018, 172, 4033–4043. [Google Scholar] [CrossRef]
- Rotz, A.C.; Asem-Hiablie, S.; Place, S.; Thoma, G. Environmental footprints of beef cattle production in the United States. Agric. Syst. 2019, 169, 1–13. [Google Scholar] [CrossRef]
- Bragaglio, A.; Braghieri, A.; Pacelli, C.; Napolitano, F. Environmental impacts of beef as corrected for the provision of ecosystem services. Sustainability 2020, 12, 3828. [Google Scholar] [CrossRef]
- González-García, S.; Castanheira, E.G.; Dias, A.C.; Arroja, L. Using a Life Cycle Assessment methodology to assess UHT milk production in Portugal. Sci. Total Environ. 2013, 442, 225–234. [Google Scholar] [CrossRef]
- Guerci, M.; Knudsen, M.T.; Bava, L.; Zucali, M.; Schönbach, P.; Kristenesen, T. Parameters affecting the environmental impact of a range of dairy farming systems in Denmark, Germany and Italy. J. Clean. Prod. 2013, 54, 138–141. [Google Scholar] [CrossRef]
- Meier, M.S.; Stoessel, F.; Jungbluth, N.; Juraske, R.; Schader, C.; Stolze, M. Environmental impacts of organic and conventional agricultural products-are differences captured by life cycle assessment? J. Environ. Manag. 2015, 149, 193–208. [Google Scholar] [CrossRef] [PubMed]
- Pirlo, G.; Lolli, S.; Cogrossi, S.; Bani, P.; Pecetti, L.; Di Renzo, B.; Severini, S. Obstacles and solutions for the organic milk production in Italy. In Innovative Research for Organic 3.0 e Volume 2: Proceedings of the Scientific Trackt at the Organic World Congress 2017 November 9–11 in Dehli, India, Vol. 2; Thünen Rep. 54; Rahamann, G., Andres, C., Yadav, A.K., Ardakani, R., Babalad, H.B., Devakumar, N., Goel, S.L., Olowe, V., Ravisankar, N., Saini, J.P., et al., Eds.; Johann Henrich von Thünen-Institut: Braunschweig, Germany, 2017; p. 323. [Google Scholar] [CrossRef]
- Council Regulation (EC) No 834/2007 of 28 June 2007 on Organic Production and Labelling of Organic Products and Repealing Regulations (EEC) No 2092/91.
- Commission Regulation (EC) No 889/2008 of 5 September 2008 Laying Down Detailed Rules for the Implementation of Council Regulation No 834/2007 on Organic Production and Labelling of Organic Products with Regard to Organic Production, Labelling and Control.
- ISO 14040. Environmental Management—Life Cycle Assessment—Principles and Framework; International Organization for Standardization ISO Central Secretariat Chemin de Blandonnet, 8CP 401—1214 Vernier; Geneva, Switzerland, 2006. [Google Scholar]
- ISO 14044. Environmental Management—Life Cycle Assessment—Requirements and Guidelines; International Organization for Standardization ISO Central Secretariat Chemin de Blandonnet, 8CP 401—1214 Vernier: Geneva, Switzerland, 2016. [Google Scholar]
- FIL-IDF. A Common Carbon Footprint Approach for Dairy. International Dairy Federation. The IDF Guide to Standard Lifecycle Assessment Methodology for the Dairy Sector; FIL-IDF: Brussels, Belgium, 2010; pp. 1–46. [Google Scholar]
- FAO. Greenhouse Gas Emissions from the Dairy Sector. A Life Cycle Assessment; Food and Agriculture Organization of the United Nations: Rome, Italy, 2010. [Google Scholar]
- Mu, W.; Van Middelaar, C.E.; Bloemhof, J.M.; Engel, B.; De Boer, I.J.M. Benchmarking the environmental performance of specialized milk production systems: Selection of a set of indicators. Ecol. Indic. 2017, 72, 91–98. [Google Scholar] [CrossRef]
- ISTAT, Istituto Nazionale di Statistica. Available online: https://www.istat.it/it/archivio/202875 (accessed on 14 January 2021).
- Nguyen, T.L.T.; Hermansen, J.E.; Mogensen, L. Environmental consequences of different beef production systems in the EU. J. Clean. Prod. 2010, 18, 756–766. [Google Scholar] [CrossRef]
- FAOSTAT. 2020. Available online: www.faofaostat/en/#data (accessed on 14 January 2021).
- NRC National Research Council. Nutrient Requirements of Dairy Cattle, 7th rev. ed.; Proceedings of the National Academy of Sciences of the United States of America: Washington, DC, USA, 2001. [Google Scholar]
- Enne, G.; Greppi, G.; Serrantoni, M. The role of water in animal breeding. Ital. J. Agron. 2006, 3, 519–527. [Google Scholar]
- Noya, I.; González-García, S.; Berzosa, J.; Baucells, F.; Feijoo, G.; Moreira, M.T. Environmental and water sustainability of milk production in Northeast Spain. Sci. Total Environ. 2018, 616–617, 1317–1329. [Google Scholar] [CrossRef]
- Boulay, A.M.; Hoekstra, A.Y.; Vionnet, S. Complementarities of water-focused life cycle assessment and water footprint assessment. Environ. Sci. Technol. 2013, 47, 11926–11927. [Google Scholar] [CrossRef]
- Manuelian, C.L.; Maggiolino, A.; De Marchi, M.; Claps, S.; Esposito, L.; Rufrano, D.; Casalino, E.; Tateo, A.; Neglia, G.; De Palo, P. Comparison of Mineral, Metabolic, and Oxidative Profile of Saanen Goat during Lactation with Different Mediterranean Breed Clusters under the Same Environmental Conditions. Animals 2020, 10, 432. [Google Scholar] [CrossRef] [PubMed]
- IPCC. Intergovernmental Panel on Climate Change guidelines for national greenhouse gas inventories. In Agriculture for Other Land Use; Chapter 10: Emissions from Livestock and Manure Management; 2006; Volume 4, pp. 1–87. Available online: http://www.ipccnggip.iges.or.jp/public/2006gl/pdf/4_Volume4/V4_10_Ch10_Livestock.pdf (accessed on 10 October 2020).
- IPCC. Intergovernmental Panel on Climate Change Guidelines for National Greenhouse Gas Inventories. In Agriculture, Forestry and Other Land Use; Chapter 11: N2O emissions from managed soils, and CO2 emissions from lime and urea application; 2006; Volume 4, pp. 1–54. Available online: http://www.ipccnggip.iges.or.jp/public/2006gl/pdf/4_Volume4/V4_11_Ch11_N2O&CO2.pdf (accessed on 21 October 2020).
- IPCC. Intergovernmental Panel on Climate Change, 2013. In Climate Change 2013: The Physical Science Basis. Contribution of Working Group I to the Fifth Assessment Report of the Intergovernmental Panel on Climate Change; Stoker, T.F., Qin, D., Plattner, G.-K., Tignor, M., Allen, S.K., Boshung, J., Nauels, A., Xia, Y., Bex, V., Midgley, P.M., Eds.; Cambridge University Press: Cambridge, UK; New York, NY, USA, 2013; p. 1535. [Google Scholar]
- INRAE. Available online: https://mediatheque.inrae.fr/ (accessed on 14 January 2021).
- Nennich, T.D.; Harrison, J.H.; Van Wieringen, L.M.; Meyer, D.; Heinrichs, A.J.; Weiss, W.P.; St-Pierre, N.R.; Kincaid, R.L.; Davidson, D.L.; Block, E. Prediction of Manure and Nutrient Excretion from Dairy Cattle. J. Dairy Sci. 2005, 88, 3721–3733. [Google Scholar] [CrossRef]
- Rotz, C.A. Management to reduce nitrogen losses in animal production. J. Anim. Sci. 2004, 82, 119–137. [Google Scholar]
- Addison, P.F.E.; De Bie, K.; Rumpff, L. Setting conservation management thresholds using a novel participatory modeling approach. Conserv. Biol. 2015, 29, 1411–1422. [Google Scholar] [CrossRef]
- Braghieri, A.; Pacelli, C.; Bragaglio, A.; Sabia, E.; Pacelli, C. The hidden costs of livestock environmental sustainability: The case of Podolian cattle. In The Sustainability of Agro-Food and Natural Resource Systems in the Mediterranean Basin; Vastola, A., Ed.; Springer: Cham, Switzerland, 2015. [Google Scholar]
- Dollé, J.B.; Moreau, S.; Brocas, C.; Gac, A.; Raynal, J.; Duclos, A. Élevage de ruminants et changement climatique. Institute de l’Élevage 2015, 32, 1–11. [Google Scholar]
- ENAMA. Handbook of Fuel Consumption for Agricultural Subsidized Use (Prontuario dei Consumi di Carburante per L’impiego Agevolato in Agricoltura). 2005. Available online: http://www.enama.it/php/pageflip.php_pdf_enama_int_prontuario.pdf&dir/it/pdf/monografie (accessed on 14 January 2021).
- Seppälä, J.; Knuuttila, S.; Silvo, K. Eutrophication of aquatic ecosystems a new method for calculating the potential contributions of nitrogen and phosphorus. Int. J. Life Cycle Assess. 2004, 2, 90–100. [Google Scholar] [CrossRef]
- Silvenius, F.; Grönroos, J.; Kankainen, M.; Kurppa, S.; Mäkinen, T.; Vielma, J. Impact of feed raw material to climate and eutrophication impacts of Finnish rainbow trout farming and comparisons on climate impact and eutrophication between farmed and wild fish. J. Clean. Prod. 2017, 164, 1467–1473. [Google Scholar] [CrossRef]
- Salvador, S.; Corazzin, M.; Piasentier, E.; Bovolenta, S. Environmental assessment of small-scale dairy farms with multifunctionality in mountain areas. J. Clean. Prod. 2016, 124, 94–102. [Google Scholar] [CrossRef]
- Knudsen, T.M.; Dorca-Preda, T.; Njakou Djomo, S.; Peña, N.; Padel, S.; Smith, L.G.; Zollitsch, W.; Hörtenhuber, S.; Hermansen, J.H. The importance of including soil carbon changes, ecotoxicity and biodiversity impacts in environmental life cycle assessments of organic and conventional milk in Western Europe. J. Clean. Prod. 2019, 215, 433–443. [Google Scholar] [CrossRef]
- Flaten, O.; Koesling, M.; Hansen, S.; Veidal, A. Links between profitability, nitrogen surplus, greenhouse gas emissions, and energy intensity on organic and conventional dairy farms. Agroecol. Sustain. Food Syst. 2019, 43, 957–983. [Google Scholar] [CrossRef]
- Sneath, R.W.; Beline, F.; Hilhorst, M.A.; Peu, P. Monitoring GHG from manure stores on organic and conventional dairy farms. Agric. Ecosyst. Environ. 2006, 112, 122–128. [Google Scholar] [CrossRef]
- Baldini, C.; Bava, L.; Zucali, M.; Guarino, M. Milk production Life Cycle Assessment: A comparison between estimated and measured emission inventory for manure handling. Sci. Total Environ. 2018, 625, 209–219. [Google Scholar] [CrossRef]
- Battini, F.; Agostini, A.; Tabaglio, V.; Amaducci, S. Environmental impacts of different dairy farming systems in the Po Valley. J. Clean. Prod. 2016, 112, 91–102. [Google Scholar] [CrossRef]
- Bacenetti, J.; Bava, L.; Zucali, M.; Lovarelli, D.; Sandrucci, A.; Tamburini, A.; Fiala, M. Anaerobic digestion and milking frequency as mitigation strategies of the environmental burden in the milk production system. Sci. Total Environ. 2016, 539, 450–459. [Google Scholar] [CrossRef]
- Herzog, A.; Hörtenhuber, S.; Winckler, C.; Kral, I.; Zollitsch, W. Welfare intervention and environmental impacts of milk production e cradle-to-farm-gate effects of implementing rubber mats in Austrian dairy farms. J. Clean. Prod. 2020, 277, 123953. [Google Scholar] [CrossRef]
- Nguyen, T.T.H.; Yan Doreau, M.; Corson, M.S.; Eugène, M.; Delaby, L.; Chesneau, G. Effect of dairy production system, breed and co-product handling methods on environmental impacts at farm level. J. Environ. Manag. 2013, 120, 127–137. [Google Scholar] [CrossRef]
- Meul, M.; Van Middelaar, C.E.; De Boer, I.J.M.; Van Passel, S.; Fremaut, D.; Haesaert, G. Potential of Life Cycle Assessment to support environmental decision making at commercial dairy farms. Agric. Syst. 2014, 131, 105–115. [Google Scholar] [CrossRef]
- Dick, M.; Da Silva, M.A.; Dewes, H. Life cycle assessment of beef cattle production in two typical grassland systems of southern Brazil. J. Clean. Prod. 2015, 96, 426–434. [Google Scholar] [CrossRef]
- Ogino, A.; Sommart, K.; Subepang, S.; Mitsumori, M.; Hayashi, K.; Yamashita, T.; Tanaka, Y. Environmental impacts of extensive and intensive beef production systems in Thailand evaluated by life cycle assessment. J. Clean. Prod. 2016, 112, 22–31. [Google Scholar] [CrossRef]
- Battini, F.; Agostini, A.; Boulamanti, A.K.; Giuntoli, J.; Amaducci, S. Mitigating the environmental impacts of milk production via anaerobic digestion of manure: Case study of a dairy farm in the Po Valley. Sci. Total Environ. 2014, 481, 196–208. [Google Scholar] [CrossRef] [PubMed]
- Bakken, A.K.; Daugstad, K.; Johansen, A.; Roer Hjelkrem, A.G.; Fystro, G.; Hammer Strømman, A.; Korsaeth, A. Environmental impacts along intensity gradients in Norwegian dairy production as evaluated by life cycle assessments. Agric. Syst. 2017, 158, 50–60. [Google Scholar] [CrossRef]
- Roer, A.G.; Johansen, A.; Bakken, A.K.; Daugstad, K.; Fystro, G.; Hammer Strømman, A. Environmental impacts of combined milk and meat production in Norway according to a life cycle assessment with expanded system boundaries. Livest. Sci. 2013, 155, 384–396. [Google Scholar] [CrossRef]
- Gerssen-Gondelach, S.J.; Lauwerijssen, R.B.G.; Havlík, P.; Herrero, M.; Valin, H.; Faaij, A.P.C.; Wicke, B. Intensification pathways for beef and dairy cattle production systems: Impacts on GHG emissions, land occupation and land use change. Agric. Ecosyst. Environ. 2017, 240, 135–147. [Google Scholar] [CrossRef]
- Pelletier, N.; Pirog, R.; Rasmussen, R. Comparative life cycle environmental impacts of three beef production strategies in the Upper Midwestern United States. Agric. Syst. 2010, 103, 380–389. [Google Scholar] [CrossRef]
- Hörtenhuber, S.; Lindenthal, T.; Amon, B.; Markut, T.; Kirner, L.; Zollitsch, W. Greenhouse gas emissions from selected Austrian dairy production systems—model calculations considering the effects of land use change. Renew. Agric. Food Syst. 2010, 25, 316–330. [Google Scholar] [CrossRef]
- Verduna, T.; Blanc, S.; Merlino, V.M.; Cornale, P.; Battaglini, L.M. Sustainability of Four Dairy Farming Scenarios in an Alpine Environment: The Case Study of Toma di Lanzo Cheese. Front. Vet. Sci. 2020. [Google Scholar] [CrossRef]
- Zucali, M.; Lovarelli, D.; Celozzi, S.; Bacenetti, J.; Sandrucci, A.; Bava, L. Management options to reduce the environmental impact of dairy goat milk production. Livest. Sci. 2020, 231, 103888. [Google Scholar] [CrossRef]
- Mekonnen, M.M.; Hoekstra, A.Y. A Global Assessment of the Water Footprint of Farm Animal Products. Ecosystems 2012, 15, 401–415. [Google Scholar] [CrossRef]
- Abín, R.; Laca, A.; Laca, A.; Díaz, M. Environmental assesment of intensive egg production: A Spanish case study. J. Clean. Prod. 2018, 179, 160–168. [Google Scholar] [CrossRef]
- Tongpool, R.; Phanichavalit, N.; Yuvaniyama, C.; Mungcharoen, T. Improvement of the environmental performance of broiler feeds: A study via life cycle assessment. J. Clean. Prod. 2012, 13, 16–24. [Google Scholar] [CrossRef]
- R Core Team. R: A Language and Environment for Statistical Computing; R Foundation for Statistical Computing: Wien, Austria, 2019; Available online: https://www.R-project.org/ (accessed on 15 January 2021).
- Laercio Junio da Silva. laercio: Duncan Test, Tukey Test and Scott-Knott Test. R Package Version 1.0-1. 2010. Available online: https://CRAN.R-project.org/package=laercio (accessed on 14 January 2021).
- Le, S.; Josse, J.; Husson, F. FactoMineR: An R Package for Multivariate Analysis. J. Stat. Softw. 2008, 25, 1–18. [Google Scholar] [CrossRef]
- Mahath, C.S.; Mophin Kani, K.; Dubey, B. Gate-to-gate environmental impacts of dairy processing products in Thiruvananthapuram, India. Resour. Conserv. Recycl. 2019, 141, 40–53. [Google Scholar] [CrossRef]


Publisher’s Note: MDPI stays neutral with regard to jurisdictional claims in published maps and institutional affiliations. |
© 2021 by the authors. Licensee MDPI, Basel, Switzerland. This article is an open access article distributed under the terms and conditions of the Creative Commons Attribution (CC BY) license (https://creativecommons.org/licenses/by/4.0/).