Article

Using Composition to Assess and Enhance Visual Values in Landscapes

by
Magdalena Gyurkovich
and
Marta Pieczara
*
Faculty of Architecture, Poznań University of Technology, 61-131 Poznań, Poland
*
Author to whom correspondence should be addressed.
Sustainability 2021, 13(8), 4185; https://doi.org/10.3390/su13084185
Submission received: 8 March 2021 / Revised: 2 April 2021 / Accepted: 3 April 2021 / Published: 9 April 2021

Abstract

:
(1) The research presented in this paper aims to study the value attributed to a landscape composition’s visual elements and their overall influence on how they are perceived. The historical and contemporary visual approaches to a landscape constitute its background, for example, geographical, aesthetic, iconographic, phenomenological. (2) The visual assessment method elaborated by the Polish school of landscape architecture is used in the first part of this study. It is built of three steps with corresponding tools: landscape inventory, composition analysis, and evaluation. Moreover, an expert survey is used to complete the study. The work’s novelty is completing the visual approach with an expert inquiry, which aims to solve the subjectivity issue, an inherent visual evaluation controversy. The study area comprises urban and suburban locations from the agglomeration of Poznań, Poland. (3) The research results indicate the significant contribution of three visual elements to the positive assessment of landscape values: greenery, built heritage, and water. The importance of the composition is also demonstrated. (4) The main research findings show that visual evaluation tools should be implemented as part of sustainable spatial planning. Their implementation permits identifying the essential positive value in the existing landscape and creating guidelines for its preservation or enhancement. The article’s significance is the effect of proposing real and possible guidelines to improve the spatial planning policy, making landscape management more sustainable.

1. Introduction

This work aims to examine the role of the selected types of visual elements in a landscape’s composition as perceived by humans. The research applies visual assessment methods to identify the landscape elements that can be claimed to create its essential positive values. The scope of the study remains limited to the area of the Poznań agglomeration. However, it covers different types of the cultural landscape, both urban and suburban. While the assumed research results may indicate the need for new landscape protection strategies, their essential background includes discussing the landscape’s definition in its complexity and presenting both historically and contemporarily applied analytical methods and approaches towards landscapes.
The term “landscape” can have different meanings depending on the field of study. For a geomorphologist, for example, the landscape represents the Earth’s surface and is considered as the result of the formational physical processes. Meanwhile, a landscape ecologist would consider a landscape in the light of interactions that once took place or now take place within it. The focus on the interaction is equally felt behind the definition of the landscape provided by the European Landscape Convention (ELC), which considers a landscape as “an area, as perceived by people, whose character is the result of the action and interaction of natural and/or human factors” [1] (art. 1). This definition combines three significant aspects of the landscape: its geographical origins, anthropogenic modifications, and human perception.
While the natural processes involved in landscape formation are the subject of geographical research with a long-established tradition “evolving from naturalists such as Alexander von Humboldt and Darwin” [2] (p. 2), the recognition of human participation in shaping the landscape came subsequently [2,3]. This was a starting point of the holistic approach to the landscape. By combining research approaches and methods typical for the natural (physical) and social (human) sciences, landscape studies have become an interdisciplinary field that contributes to overcoming the disciplinary division between the two scientific branches [4,5]. The multidisciplinary nature of landscape studies and the need to analyze landscapes as part of a holistic approach has already been noticed by von Humboldt, who is credited with defining landscape as “the total character of a region of the Earth” [6] (p. 27). By using the word “total”, this definition describes the landscape “as a holistic entity perceived by humans and having a distinct character or identity” [7] (p. 188). As can be deduced from the cited explanation, the holistic approach to the landscape incorporates human aspects in terms of the anthropogenic influence on its shaping process and perception. Besides the fact that landscape as a concept includes the material reality resulting from “a continuous dynamic interaction between natural processes and human activity” [7] (p. 188), it also refers to “the immaterial existential values and symbols of which the landscape is the signifier” [7] (p. 188). The mutual relationships between the social culture and the landscape can thus be represented as processes occurring between two endpoints—the first being land molding by human labor and the other being the landscape’s symbolic expression of a culture. In other words, the landscape is shaped by society members so as to materialize the values of their immaterial culture, and, in a feedback loop, its final appearance “shapes the citizens’ attitudes and behavior” [8] (p. 11).
Every cultural landscape shaped by human labor is characterized by a set of culture-related attributes, some of which are perceived visually—for example, aesthetic, expressive, symbolic—or aimed at identification [8]. The importance of cultural features in the interpretation of landscapes was demonstrated by Kobayashi [9], who emphasized that the communication of meanings within the landscape is subject to cultural limitations. The effectiveness of linguistic expression in conveying understandable messages depends on the clarity of a landscape’s structure, with a high formality acting in its favor [9] (p. 180). Hence, the landscape is implied as a structured semiotic system, built of elements that play the role of signifiers. The relevance of semiotic theory in the study of visual design representations, and specifically in landscape design, was demonstrated by Raaphorst et al. [10]. Among the basic semiotic systems, the visual one seems to be most suitable for the image-based analysis of the landscape.
The importance of a landscape’s visual aspect has been approached from different perspectives. Cosgrove highlighted the importance of visual perception in both forming and understanding landscapes by stating that “the landscape idea represents the way of seeing” [11] (p. 1). This statement also means that the perception of a single landscape can change depending on the viewer’s background. “Semiotics and iconography teach us that there are as many meanings as there are stakeholders” [10] (p. 130). Iconography’s approach to landscape treats its representations as “consistent images of its meaning or meanings” [12] (p. 1), making an image equal to the reality it represents. Iconographic research perceives landscape as an image or symbol, being at the same time based on the study of the symbolic imaginary [12].
By defining the role of symbols as objects representing, or denoting, something else [13,14], the image-based approach to landscape refers to the semiotics. Derived from linguistics, the theory of semiotics views language as “a system of signs where there is nothing essential except the union of meaning and the acoustic image” [15] (p. 32). Like the verbal semiotic system, the visual one also implies the unambiguous connection of a signifier (a sign) with its denotation (a meaning). At the same time, the differences in comprehension depend on the stakeholder’s background [10,16]. As applied to landscape studies, the image-based approach thus aims to “identify the symbolic meanings and messages contained in the landscape” [14] (p. 212). Hence, the landscape is considered an organized system of symbolically represented values that are perceived visually. “Landscape carries meaning as well as minerals and agricultural wherewithal” [14] (p. 245). Using a linguistic metaphor, a signifier within a landscape can be presented as a visual element (e.g., tower), whereas the signified, or its meaning, refers to the relevant idea (e.g., the source of power).
The decoding process of a landscape image can link one sign with additional secondary meanings, just like one architectural object can communicate different secondary functions [17]. Backed with the semiotic theory of logic developed by American philosopher Charles Sanders Pierce, the triadic understanding of semiosis is a key to decode sign-systems other than language, including visual ones [10,16]. According to the triadic model, each sign has an equivalent referent [10], or non-coded message [16]. In addition, it can connote diverse coded messages, or connotations [16], which are interpretations of the sign [10]. Taking for example a tower in a landscape, its denoted meaning (the referent) would be a source of dominative power (the rule), while the connoted interpretation can be a king’s castle, a sacral building, or a bank headquarters. What decides the appearance of different interpretations is the context. Decoded meanings tend to depend on the viewer’s background and experience, as well as on his knowledge [10,16]. Going further with the words of Muir, “viewers will tend to evaluate landscapes according to their perceived merits, which will include aesthetic and ecological considerations as well as others, like cultural characteristics” [14] (p. 182).
The iconography of landscape, backed up with the theory of semiotics, forms the aesthetic approach to the landscape. It aims to explain what features of a landscape make people like it and the reasons behind this. In the words of Appleton, “what is it that we like about landscape, and why do we like it?” [13] (p. xv) and [14] (p. 244).
The perception of the landscape, which gains core importance in the aesthetic approach, relies considerably on its characteristic visual features. The definition of landscape in the Oxford Dictionary indicates this, describing this interdisciplinary concept as “all the visible features of an area of land, often considered in terms of their aesthetic appeal”. However, the importance of visually perceived landscape characteristics is not limited to the aesthetic approach and is also used in different analysis scales. For example, the renowned patch-corridor-matrix model [18] also applies a visual assessment method, to an extent, to analyze the land mosaic.
Landscape analysis methods based on distinguishing visual and non-visual elements form the basis of several significant contributions to the theory of landscape perception. First of all, the phenomenological approach must be mentioned. The concept of a phenomenon at its core is usually defined as something observable, manifesting itself. The idea of the phenomenon was derived from ancient Greek philosophy and was later re-defined by Immanuel Kant [19]. Kant placed it in opposition to the noumenon concept, which he described as representing the essence of things—such as, for example, truths and values, which cannot be observed and therefore are recognizable uniquely through reason. Revived in modern times by Kant, the concept of this phenomenon formed the beginning of the philosophical movement of phenomenology, which is described by Edmund Husserl [20] as focused on consciousness structures. The phenomenology trend continued in Martin Heidegger’s [21] concept of Fourfold (das Geviert), which inspired further distinguishing and classifying phenomena that can be identified in a landscape.
The philosophical movement of phenomenology inspired an analytical method for studying landscape that was developed and applied by Christian Norberg-Schulz, a Norwegian architect, theorist, and historian. According to Norberg-Schulz, phenomena are tangible things that build the world surrounding us [22]. They are interconnected in a complex and sometimes even contradictory way. They can be classified according to their nature (i.e., natural or artificial), location (i.e., Earth or sky), or adoption (i.e., inside or outside) [22]. The phenomenological approach decomposes the landscape into elements, or entities, that have specific meanings and connotations in the range of landscape studies [23].
The phenomenological approach towards landscape has numerous distinguished contemporary successors. Breaking the landscape down into diverse visual and non-visual elements is their common denominator. The components identified are subsequently examined in terms of their impact on the overall perception of a landscape. Such an approach has been adopted, among others, by Górka, who distinguished creative and passive images of the landscape [24]. Particularly important for architectural and urban studies, the landscape’s creative image is built prevailingly from visual elements, including forms and patterns [24]. Such an explicit image of the landscape finds its counterpart in imaginary values that refer to the collective consciousness. The social awareness of “the values attaching to landscapes and the issues raised by their protection, management and planning” [1] (art. 6 B) is at present considered crucial. This fact emphasizes the significance of landscape studies and visually oriented research, contributing to increased knowledge about the landscape. It is vital to shape citizens’ expectations regarding a landscape’s quality and improve their sustainable development responsibility [24]. Human perception is hence considered an indispensable factor of landscape integration in terms of sustainable development [25]. Particularly, a balance between landscape protection, enhancement, and sustainability issues needs to consider its perception by humans as well as the values they attach to it [25]. As shown by the work of Serraino and Lucchi [25], sustainable development must use an interdisciplinary approach to landscape, integrating multiple diverse aspects: technical (e.g., energy efficiency), ecological (e.g., preventing pollution, conforming with Green Deal policy), cultural (e.g., heritage protection) and humanistic (e.g., perception of the values).
The recognition of a landscape’s visual value as one of the necessary conditions for any appropriate sustainable development strategy [1,24,26] contributes to the appreciation of visual landscape research as particularly important. Contemporarily applied visual methods include the Landscape Physiognomy Assessment (LPA) and Landscape Visual Capacity Assessment (LVCA) [26]. The latter approach, modeled over the landscape capacity assessment analysis carried out across the UK as part of preparing a local plan [27], defines a landscape’s visual capacity as its resilience to changes resulting from the absorption of new investments [26]. Applied as a part of the integrated landscape management strategy, the method contributes to recognizing visual values in landscape and minimizing visual hazards due to the appearance of new investments (e.g., residential settlements).
Despite the difficulty of avoiding natural subjectivity [10,16], the visual assessment of landscape quality has entered both discussion and practice in landscape-related studies. Its usefulness for land management policies has been proven theoretically [28,29,30] and through practical examples of using visual analysis to design a landscape protection strategy [28] (pp. 117–118, 136). Largely inspired by the development of perception studies, the idea of using landscape evaluation for planning purposes profoundly influenced the approach adopted towards landscape by British geographers in the 1970s [30] (p. 46). This approach, which considered the preservation of the visual qualities in the landscape as an integral part of any consistent planning strategy, was originally short-lived [30]. More recently, its essential elements have received new attention in the form of contemporarily applied methods of landscape assessment—for example, Landscape Character Assessment (LCA) [27], Landscape Physiognomy Assessment (LPA), and Landscape Visual Capacity Assessment (LVCA) [26].
The approach to landscape adopted in this research is one of many possible ways to assess the landscape. Other active approaches derive from different landscape conceptualizations that are adopted in different disciplines, for example, geography, ecology, landscape ecology, history, historical ecology, archaeology, environmental psychology, or landscape architecture [31]. The actively used visual landscape assessment approaches mainly derive from landscape conceptualization in its physical aspect. The approach presented in this article refers to the existing visual assessment method that uses human sight to define its physical elements. However, it combines this approach with the semantic view, which is derived from iconography and aesthetics, aiming to assess their value as perceived by humans. The approach also uses selected elements of the Delphi technique, which are applied to a quantitative study of research results in order to check their compliance (see also Section 2: Materials and Methods).
As remarked by Daniel [32] the contemporary environmental management practice mainly uses an expert approach to landscape, while contemporary research is dominated by the perception-based approach. The two approaches differ in terms of landscape conceptualizations and “the relative importance of the landscape and human viewer components” [32] (p. 267). While landscape perception studies draw from the Gestalt holistic approach, considering landscape images through the prism of its conceptualizations, the environmental approach develops towards rigorous scientific studies. They aim to collect relevant data and apply analytical tools to build models with which to explain specific relationships between the condition of the environment and the viewer’s impression. Both approaches seem incomplete if separated, hence this study will combine two stages: a visual study of landscape composition and a survey used as the basis of quantitative research. Recently, a need to create a more integrated approach to landscape has been identified [33].
From the point of view of architectural studies, which belong to visually oriented disciplines, both aesthetic and phenomenological approaches constitute the essential background of any research analyzing a landscape’s composition and humans’ perception of it. Treating the landscape as a structured system that can convey semantic messages irrevocably refers to visual elements’ significance. If specific types of such elements could be assigned a positive or negative value, the questions of what we like about a landscape and why this is so could be answered. This is precisely the goal of the research presented in this paper, which uses visual assessment methods to test such a possibility for a few exemplary locations from the Poznań agglomeration. The study’s expected results can form a starting point for a new landscape management strategy, integrating landscape visual quality with the traditional geographical view.

2. Materials and Methods

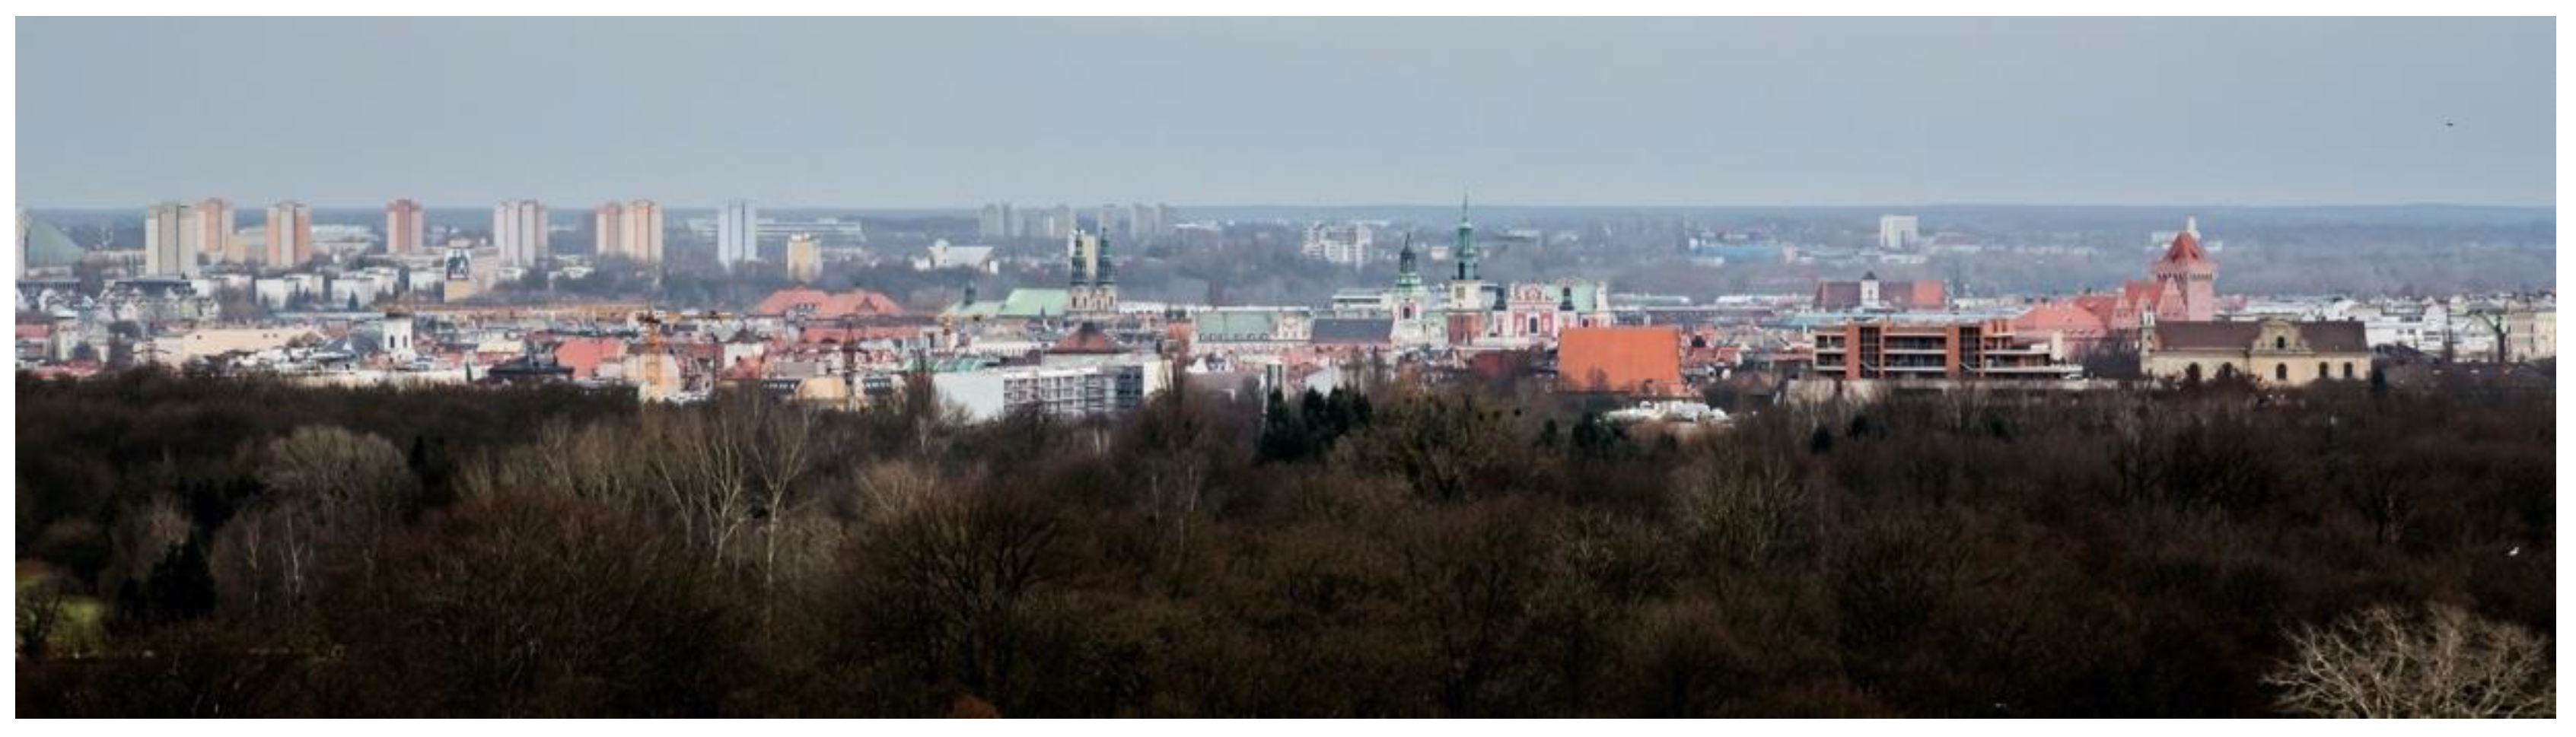
The study area is the agglomeration of Poznań, which forms a major urban area and is a capital of the Greater Poland region. Instead of providing a map of the study area in this section, which would not be fully legible, most viewpoints discussed in this article will be provided with their geographical coordinates, whenever it was possible to accurately retrace. This information allows the reader to locate them in any GPS or GIS system.
The research is organized in two stages. The first stage is empirical and uses the composition analysis method, which is consequently applied across the Polish school of landscape architecture for both study and design purposes. The method derives from the analytical procedure formulated by Bogdanowski [34,
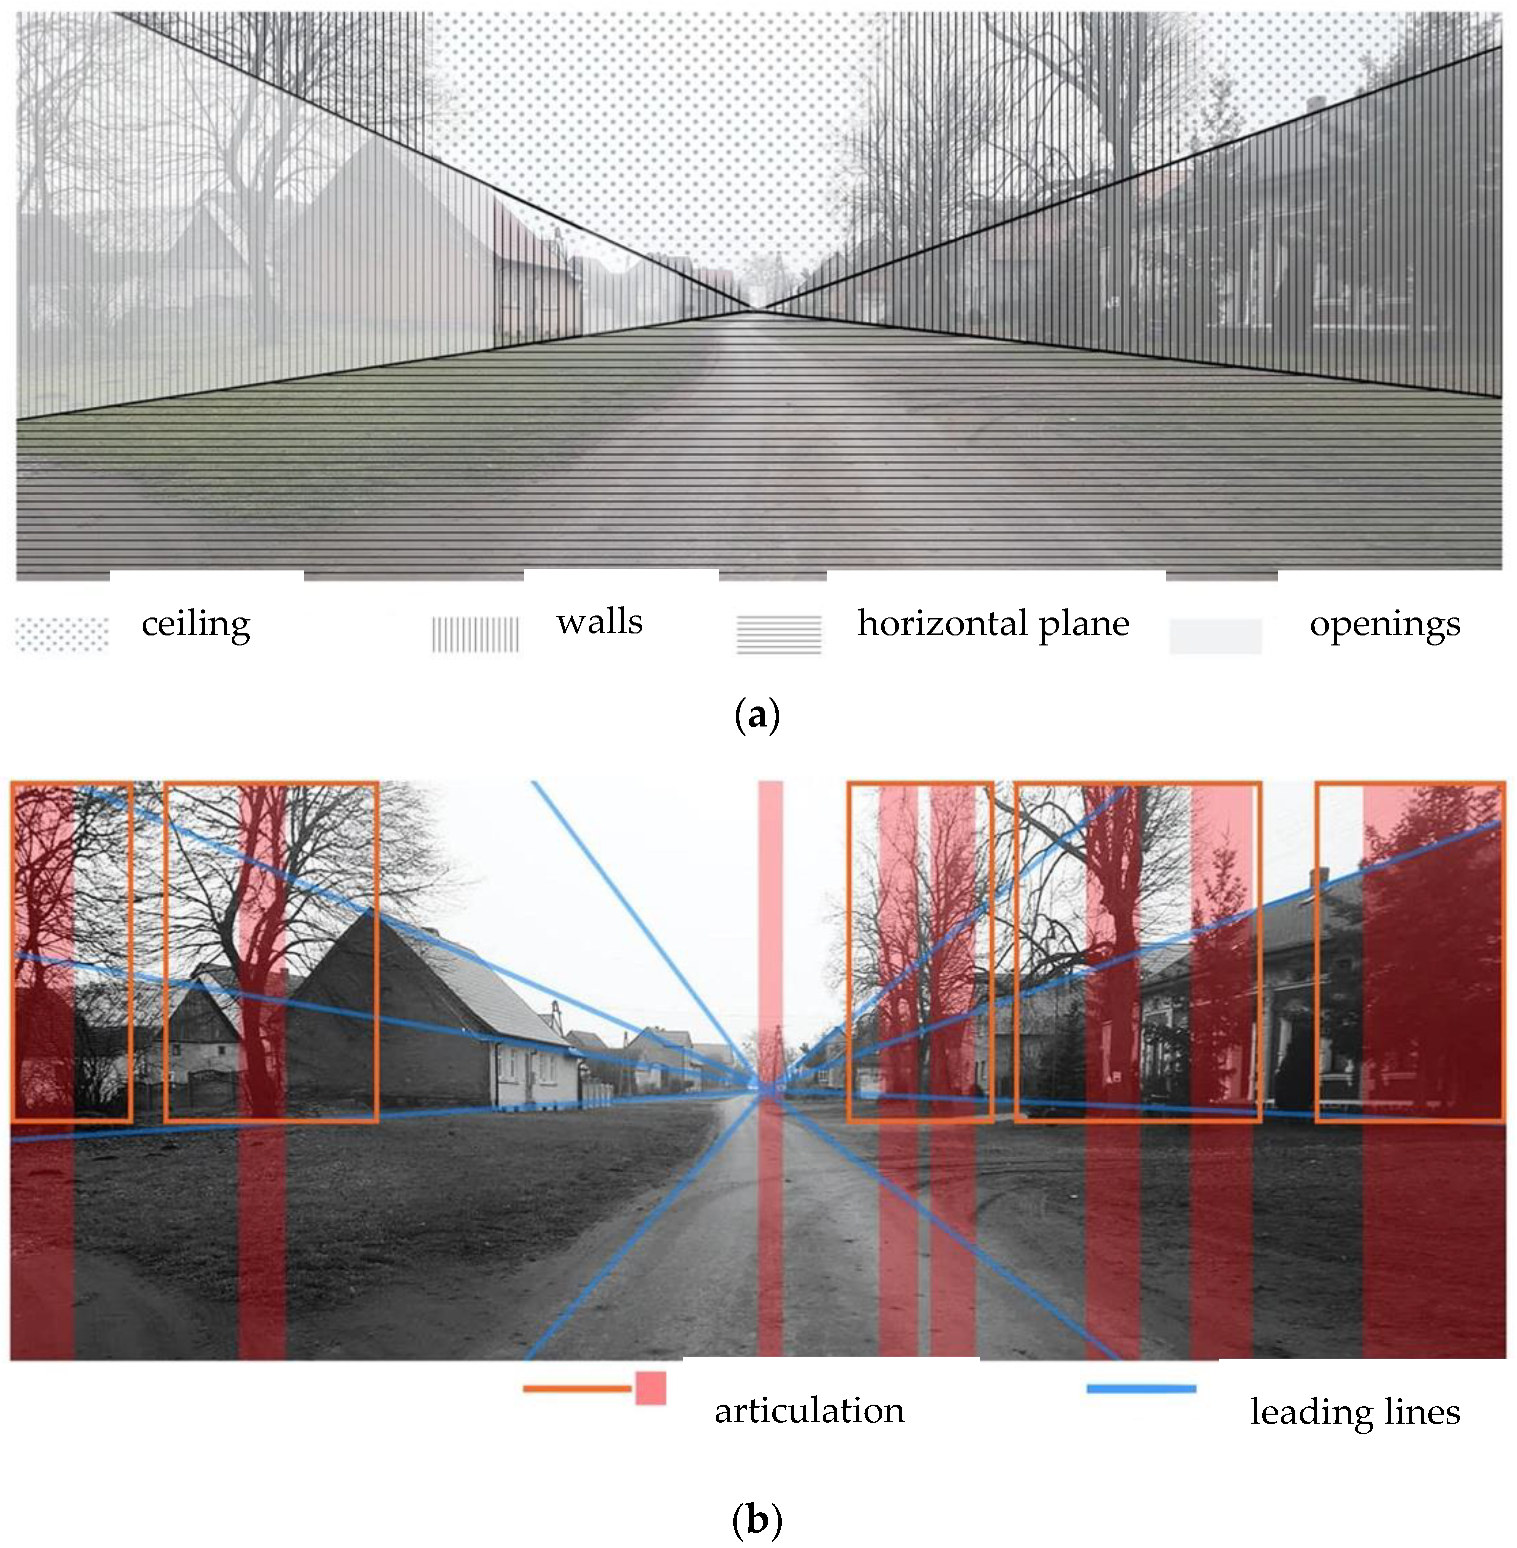
35] and aims at understanding the landscape as the human perceives it. The basic assumption of the method is that when trying to orientate in an outdoor space, the same means are used as in an interior one. Namely, a human intuitively finds reference points such as walls and free-standing objects. According to Bogdanowski, each landscape interior can be analyzed within four categories: horizontal plane, walls, vaults (ceilings), and free-standing objects [34,35]. At the same time, their mutual relations determine the perception of the whole.
Most importantly, the horizontal plane’s proportions define whether an interior is wide, elongated, or circular. Secondly, the proportions of the openings as compared to the surface of the walls define it as a concrete interior (clearly perceived with less than 30% of openings), an objective one (with openings covering between 30 and 60% of wall surfaces), or subjective one (with walls perceived subjectively due to their porosity above 60%). Moreover, a landscape’s interior can be open or closed in the sense of its termination. Then, the number and layout of free-standing objects define it as simple or complex (Figure 1a). Secondly, vertical articulation and lines leading the viewer’s sight are analyzed, defining the landscape’s rhythm. The composition analysis permits listing all visual elements observed in the landscape and, more importantly, assess the role they play in the whole image (e.g., creating rhythm and symmetry, dividing long intervals, disturbing harmony) (Figure 1b).
As a result, the elements and principles of the composition, which are visual, become the foundation for the systematic analysis of any type of landscape [34,35,36,37,38,39,
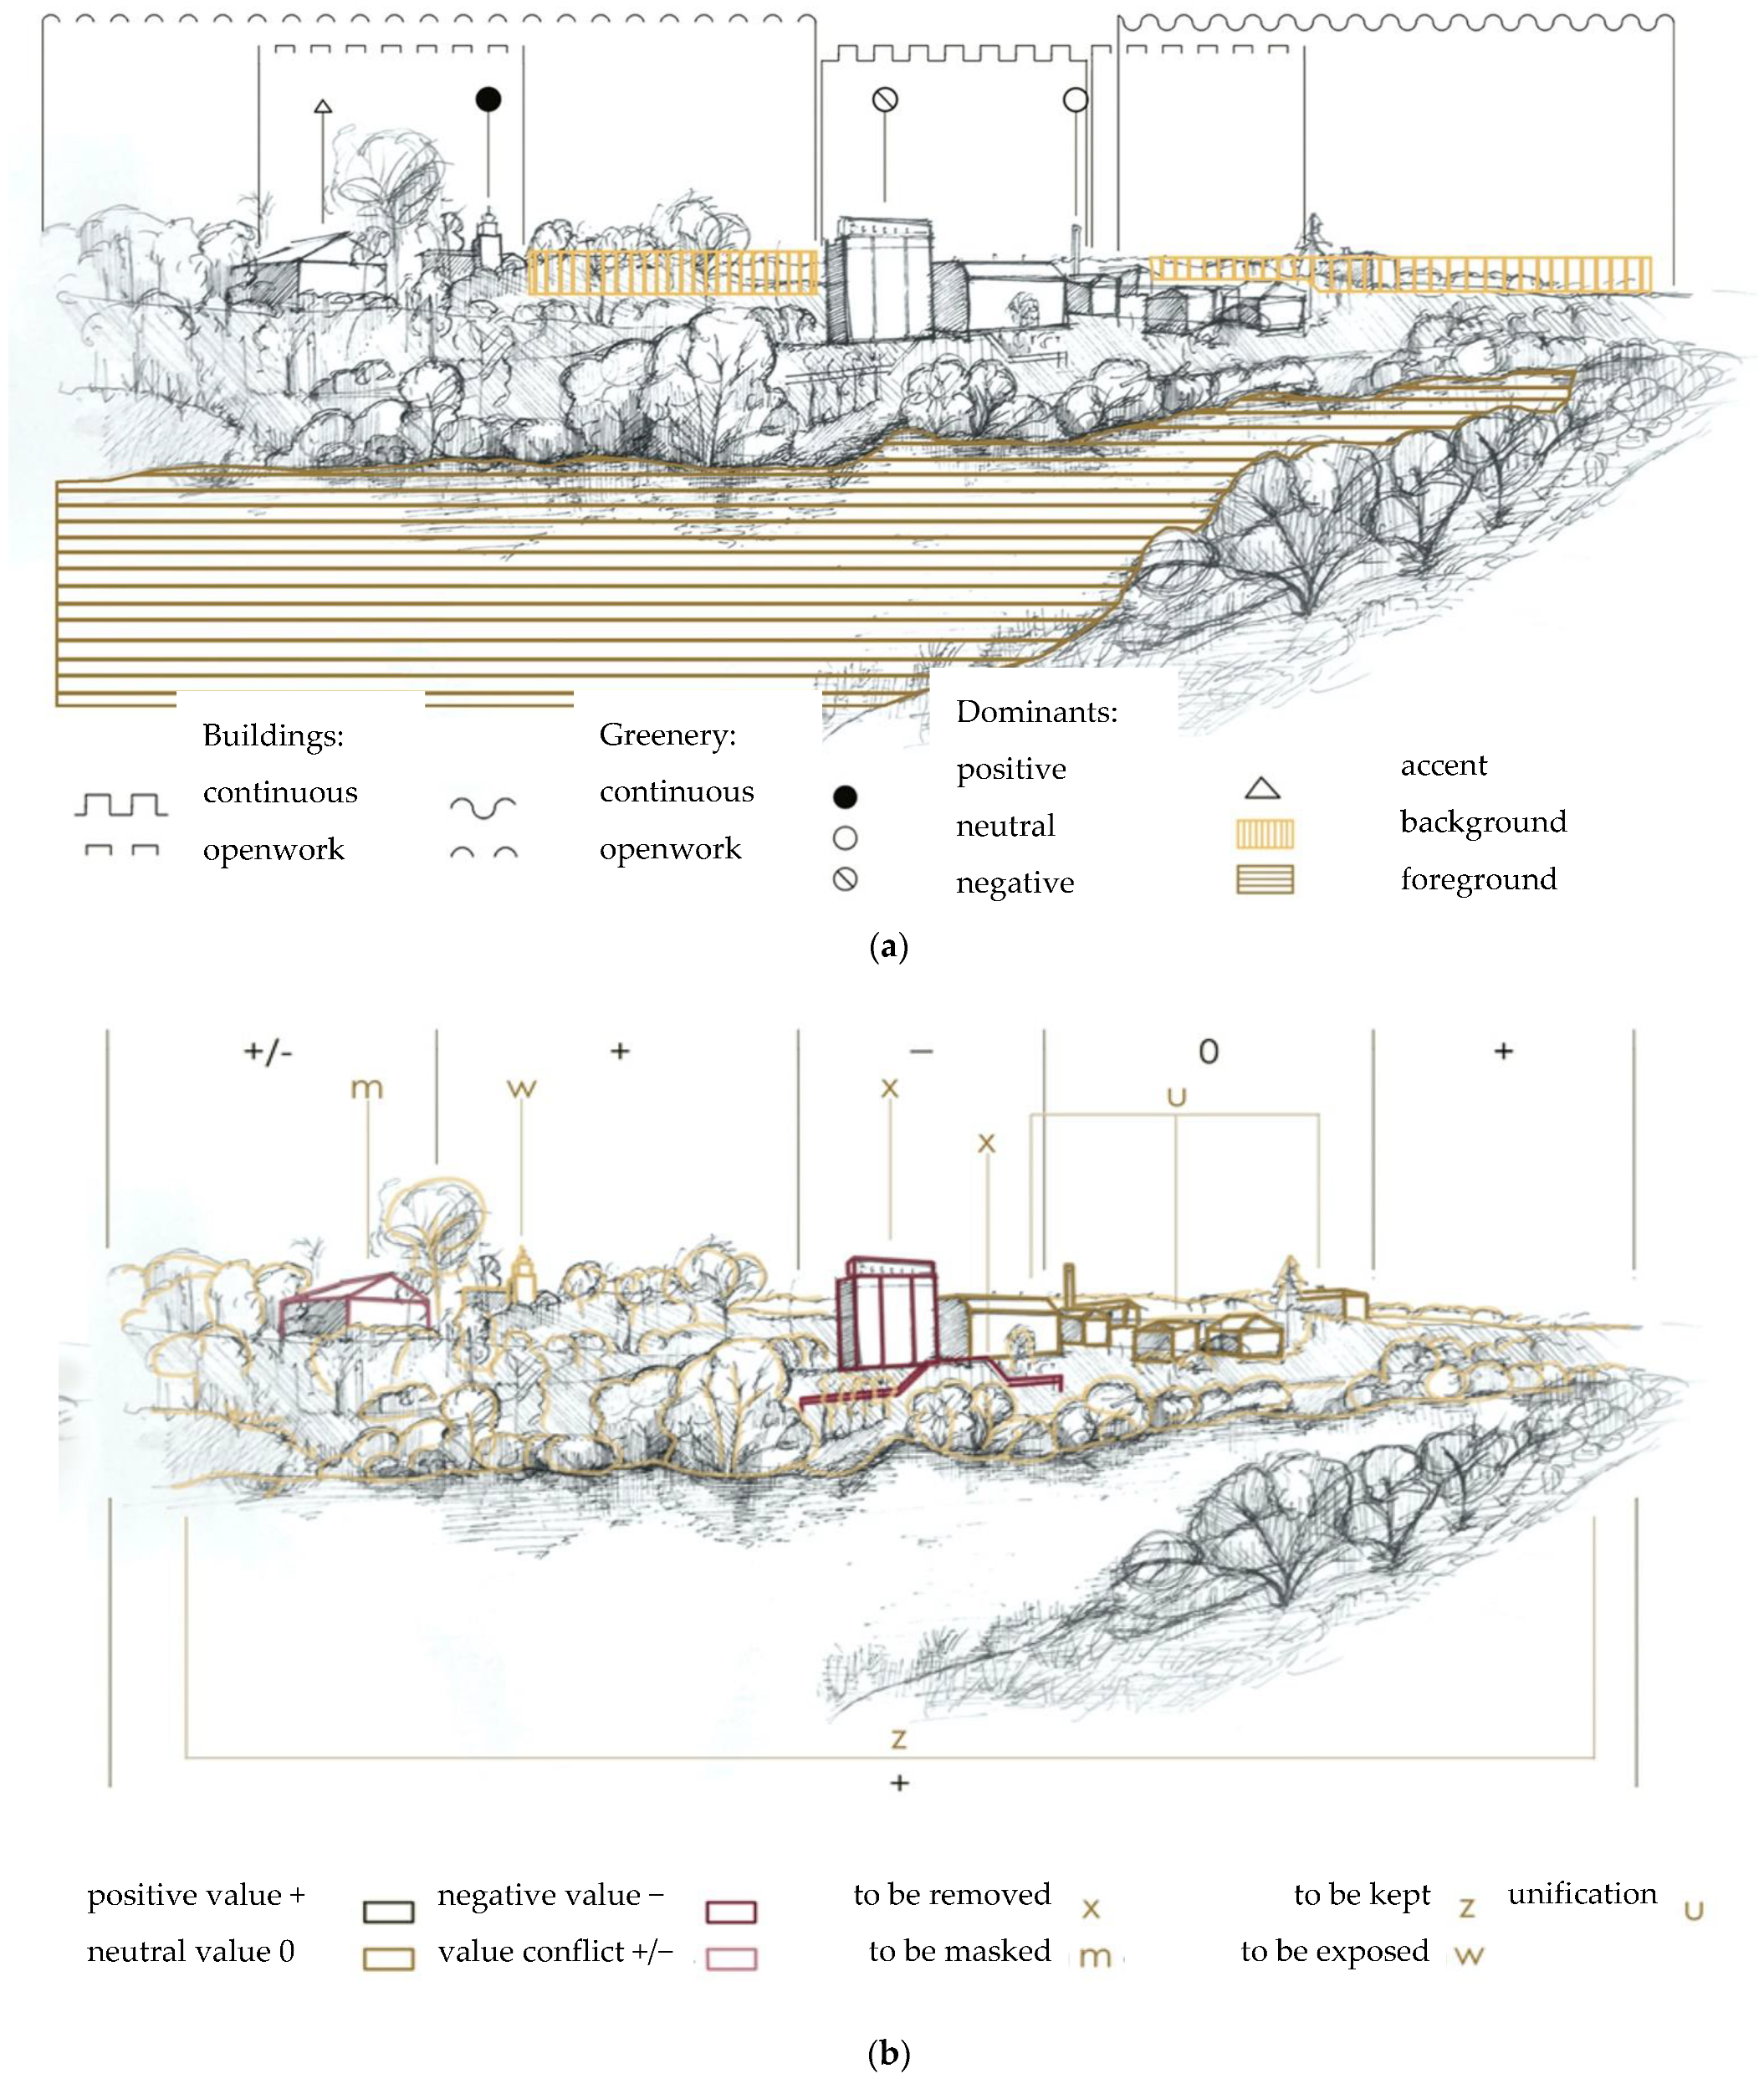
40]. For open spaces, an equivalent procedure can be performed based on a panoramic view, which can be equally broken down into a set of elements whose interrelationships determine the meaning of a given object and its role in the overall image [34,37,40,41]. The essential elements of a panorama are dominant (strong spatial form), subdominant, accent (a form that distinguishes itself), main content, frames, background (uniform plane), and foreground (horizontal plane) [34] (Figure 2a).
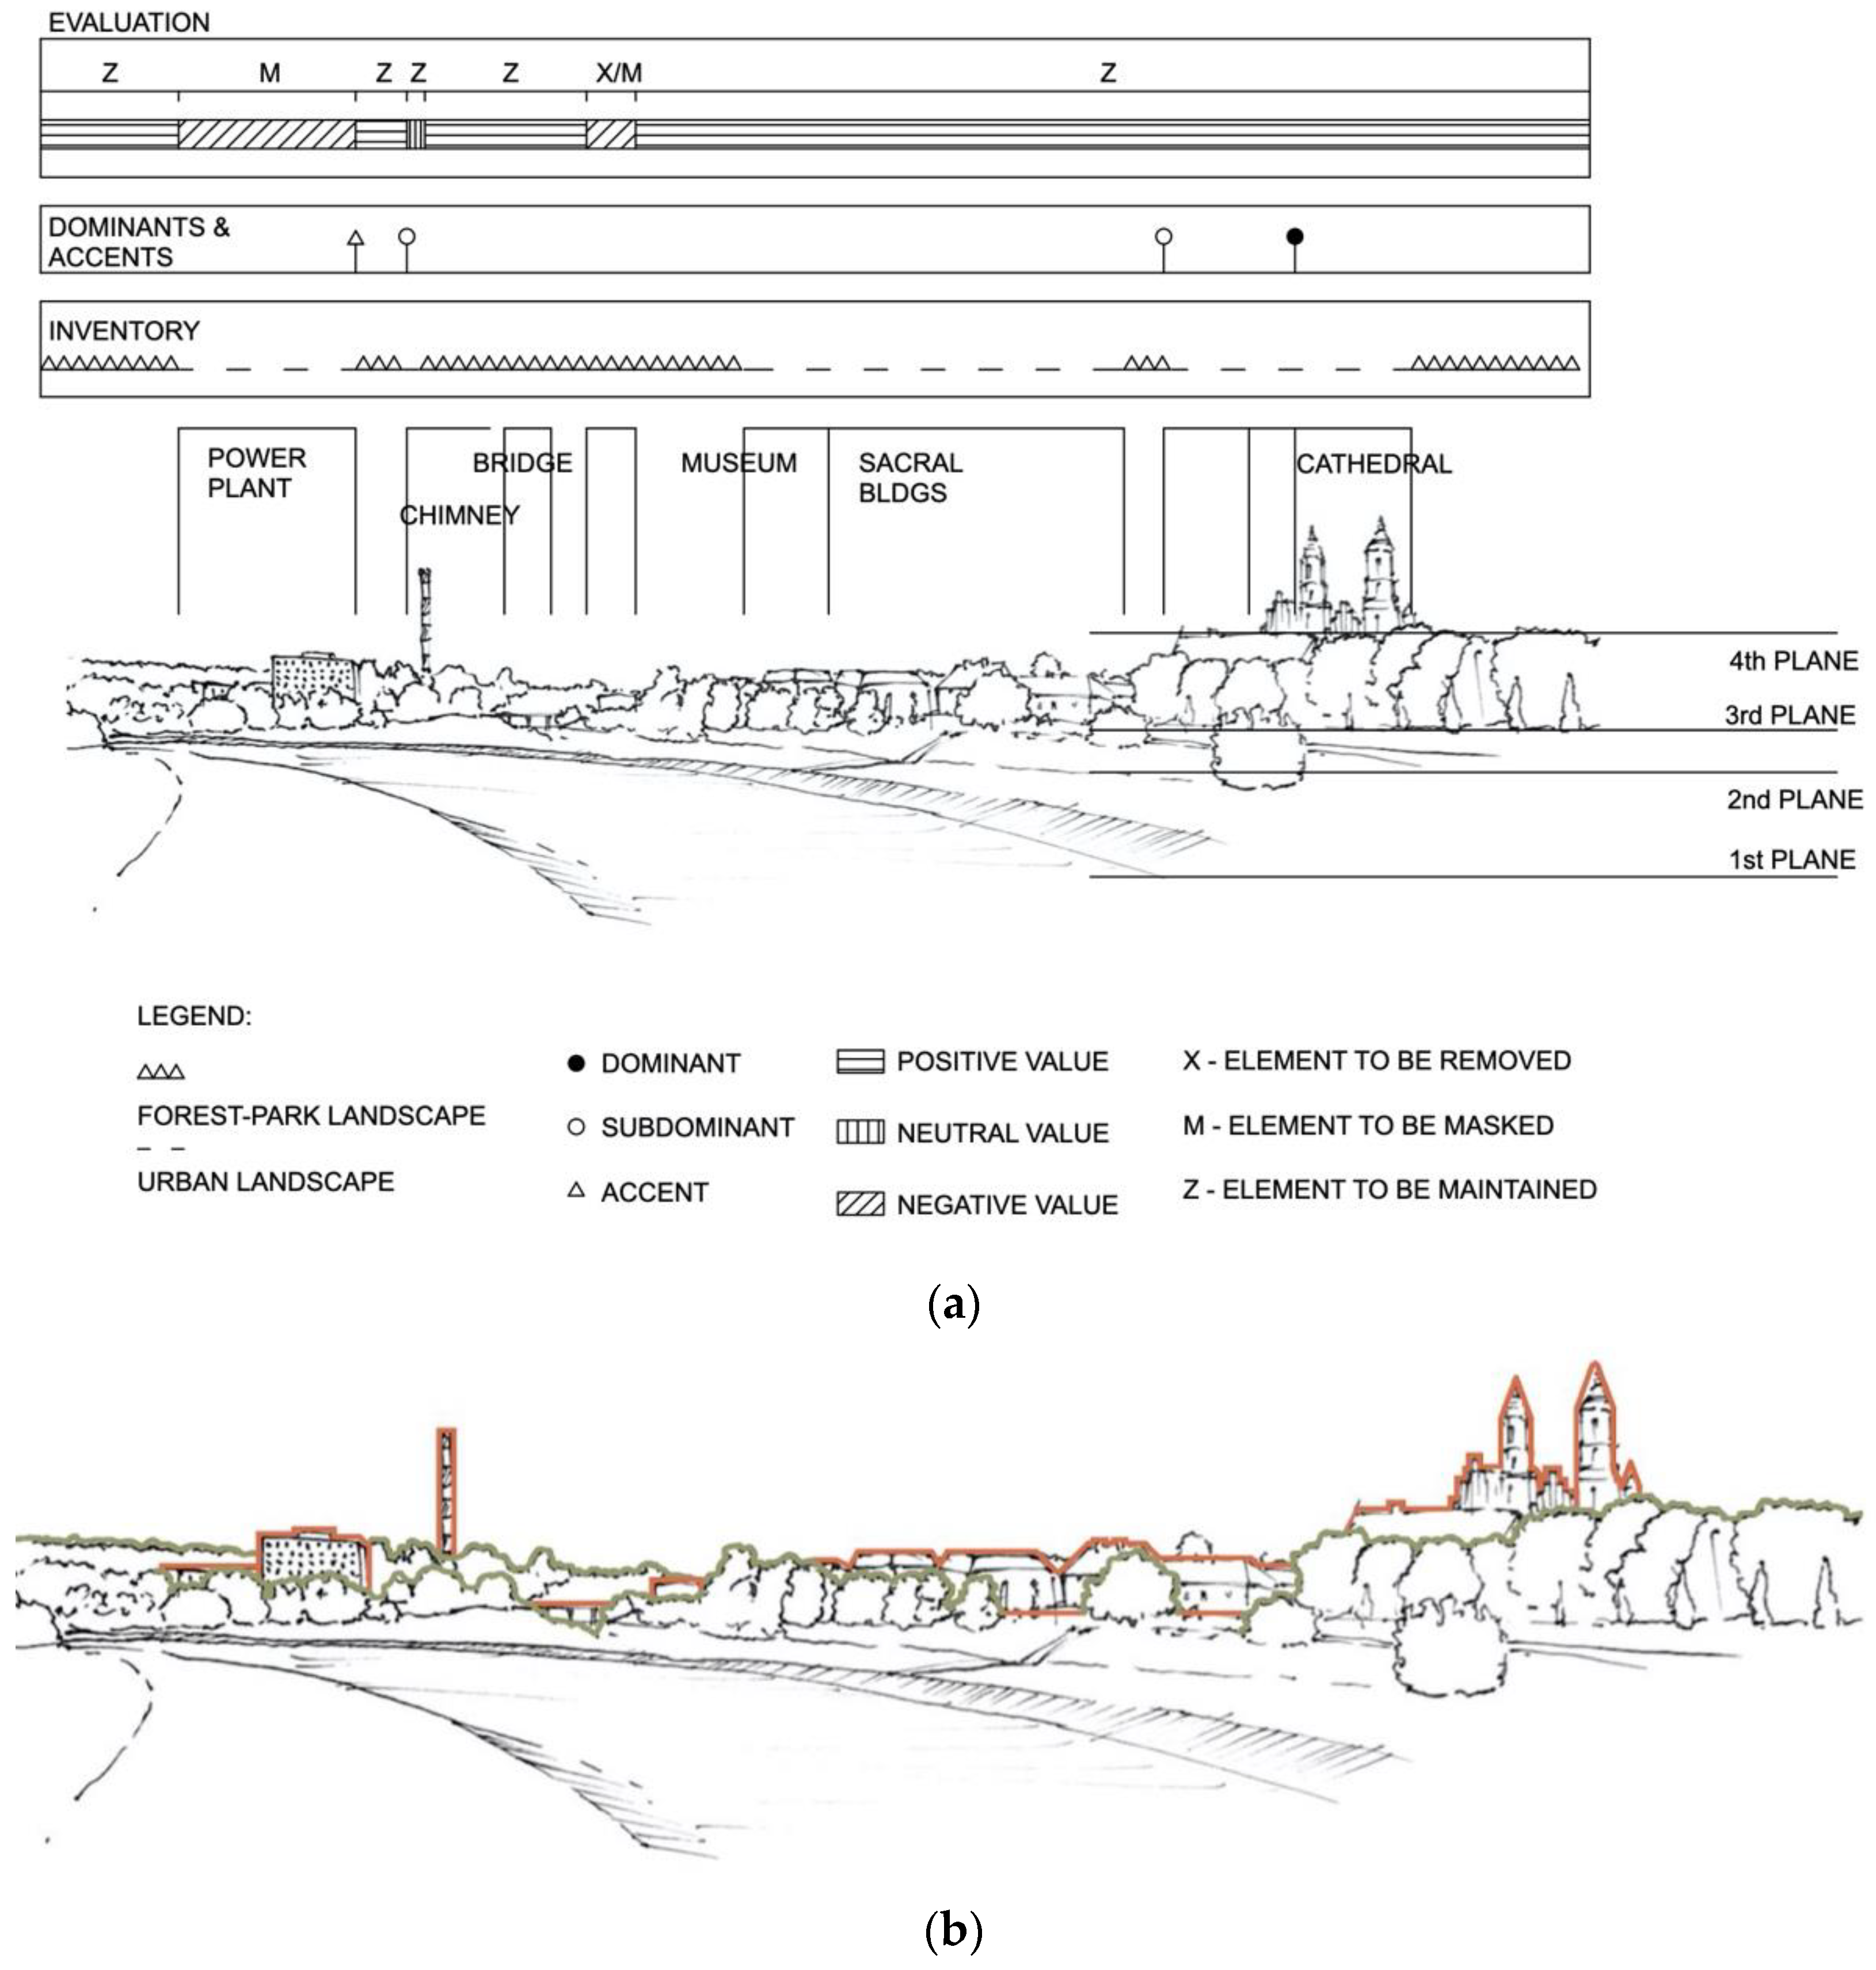
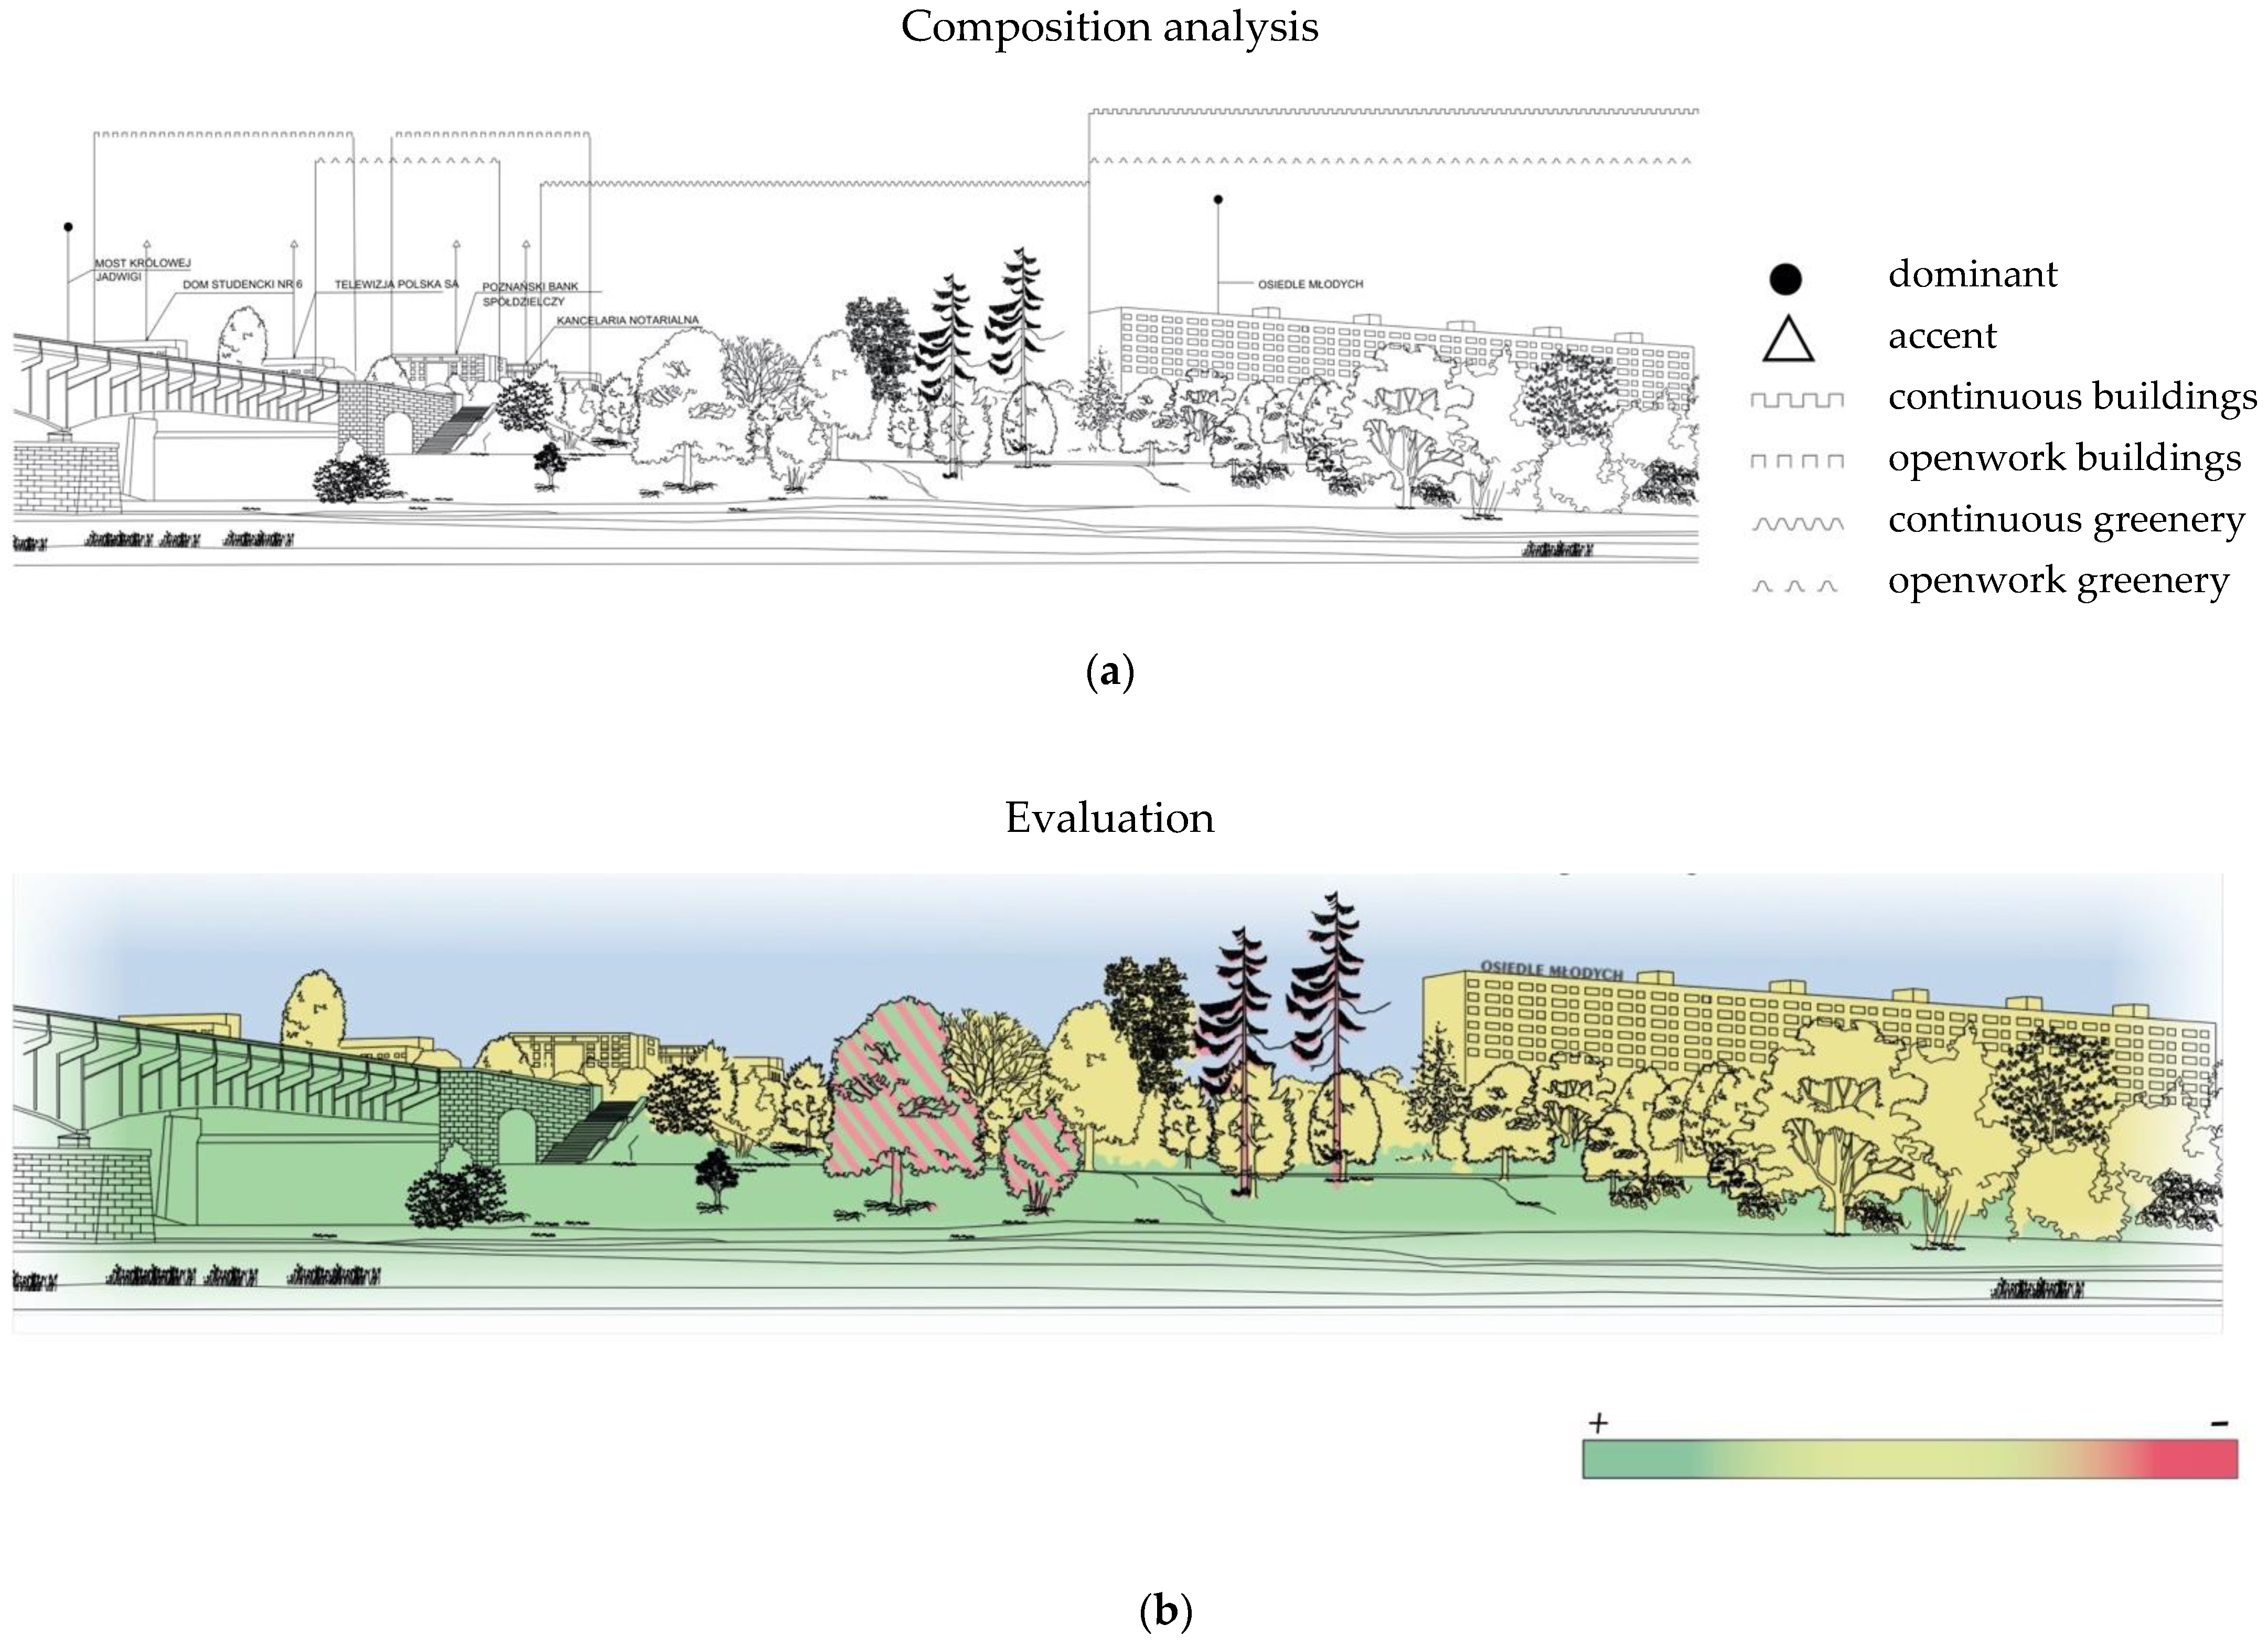
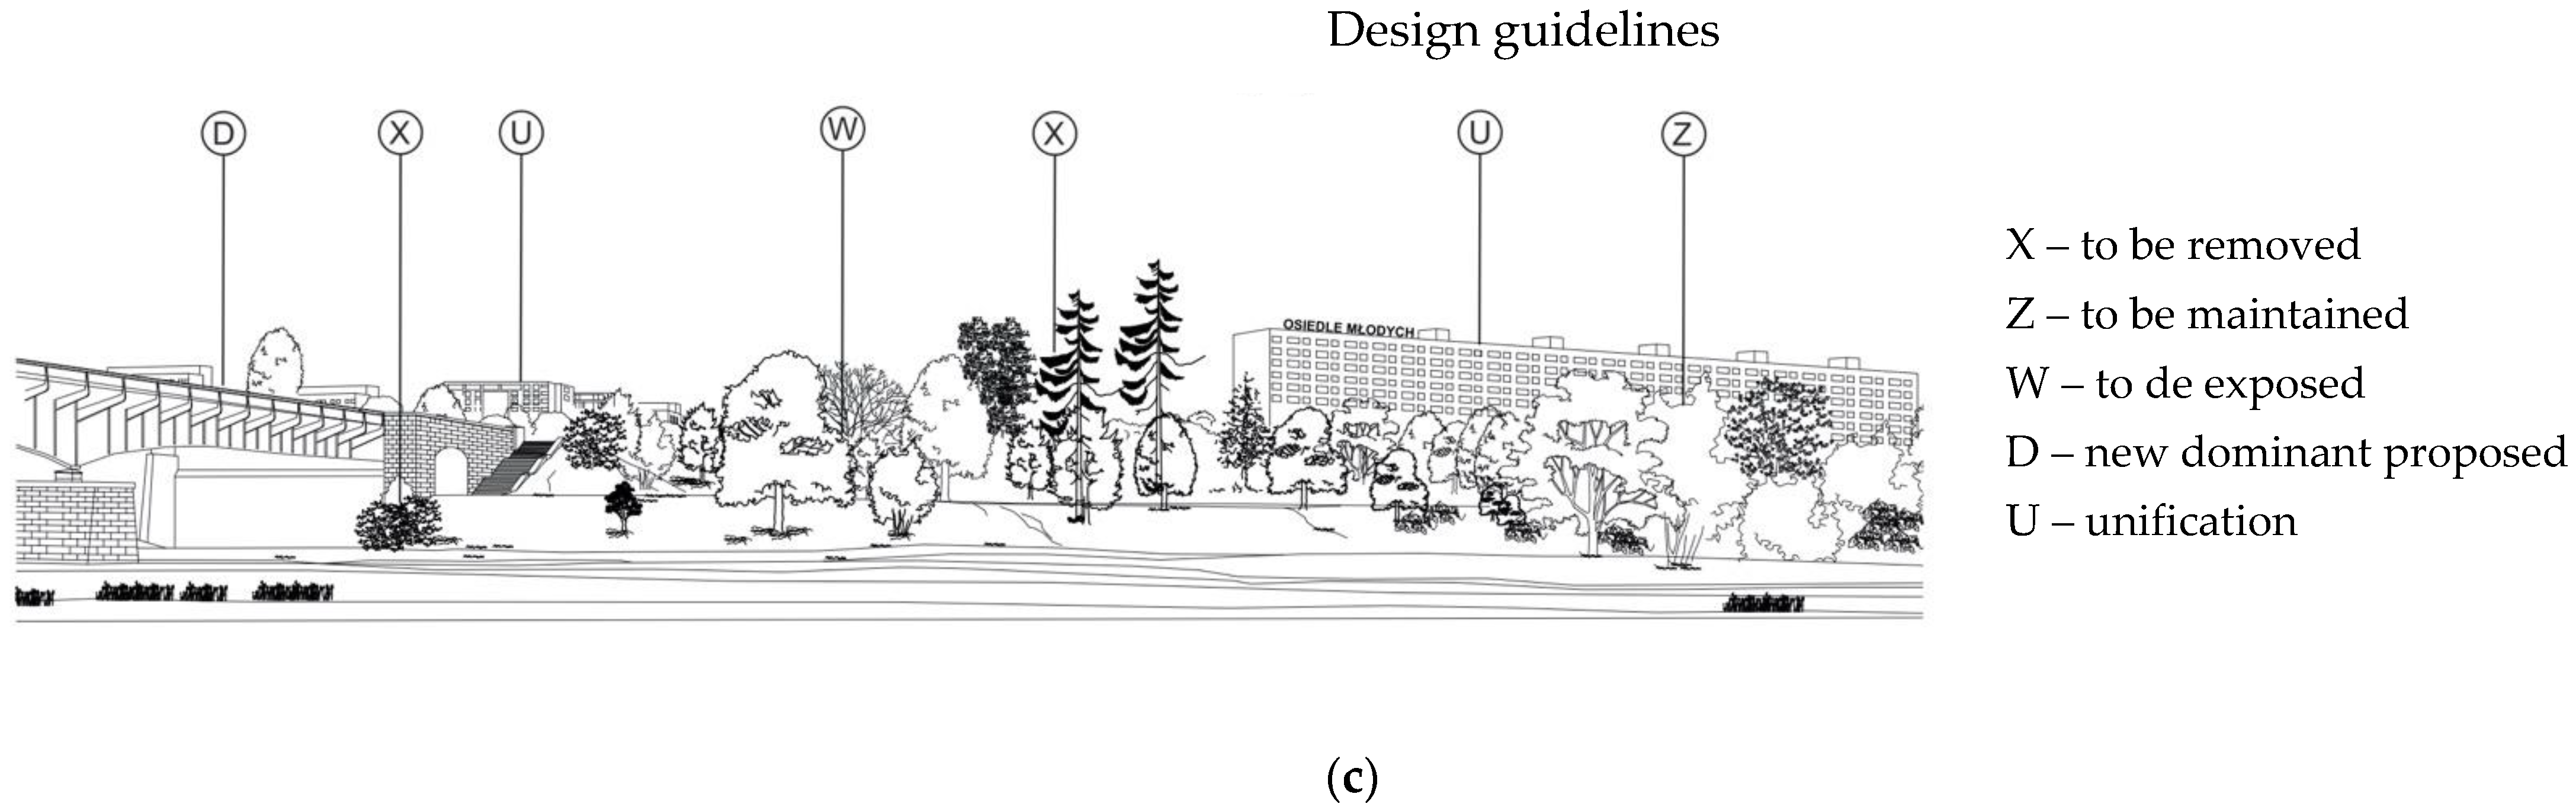
A systematic inventory of panoramas and interiors is a fundamental step in identifying the main visual elements. Subsequently, the evaluation step attributes specific qualities, positive or negative, to the elements identified, as perceived by the observer (Figure 2b, top line). The evaluation of a landscape finally serves as a starting point for developing a policy to protect or improve its visual quality. It contains guidelines for modifications, which may consist of (1) removing or masking selected elements (e.g., using greenery), (2) preserving or protecting the existing state of the landscape, and even highlighting its selected features (e.g., unifying its background), (3) adding a new dominant feature to integrate the composition, or (4) standardizing (unifying) the main content (e.g., by using greenery or a color code) [23] (Figure 2b).
The material used in the first stage of this research consists of similar complete panorama analysis examples performed by architecture students at the PUT (Poznań University of Technology) for selected cultural landscapes located within the range of the Poznań agglomeration, in both urban and suburban areas. The first stage of the research aims to identify the visual elements that are the most recurrent and significant in the context of the study area. This part of the research will be described in Section 3.1.
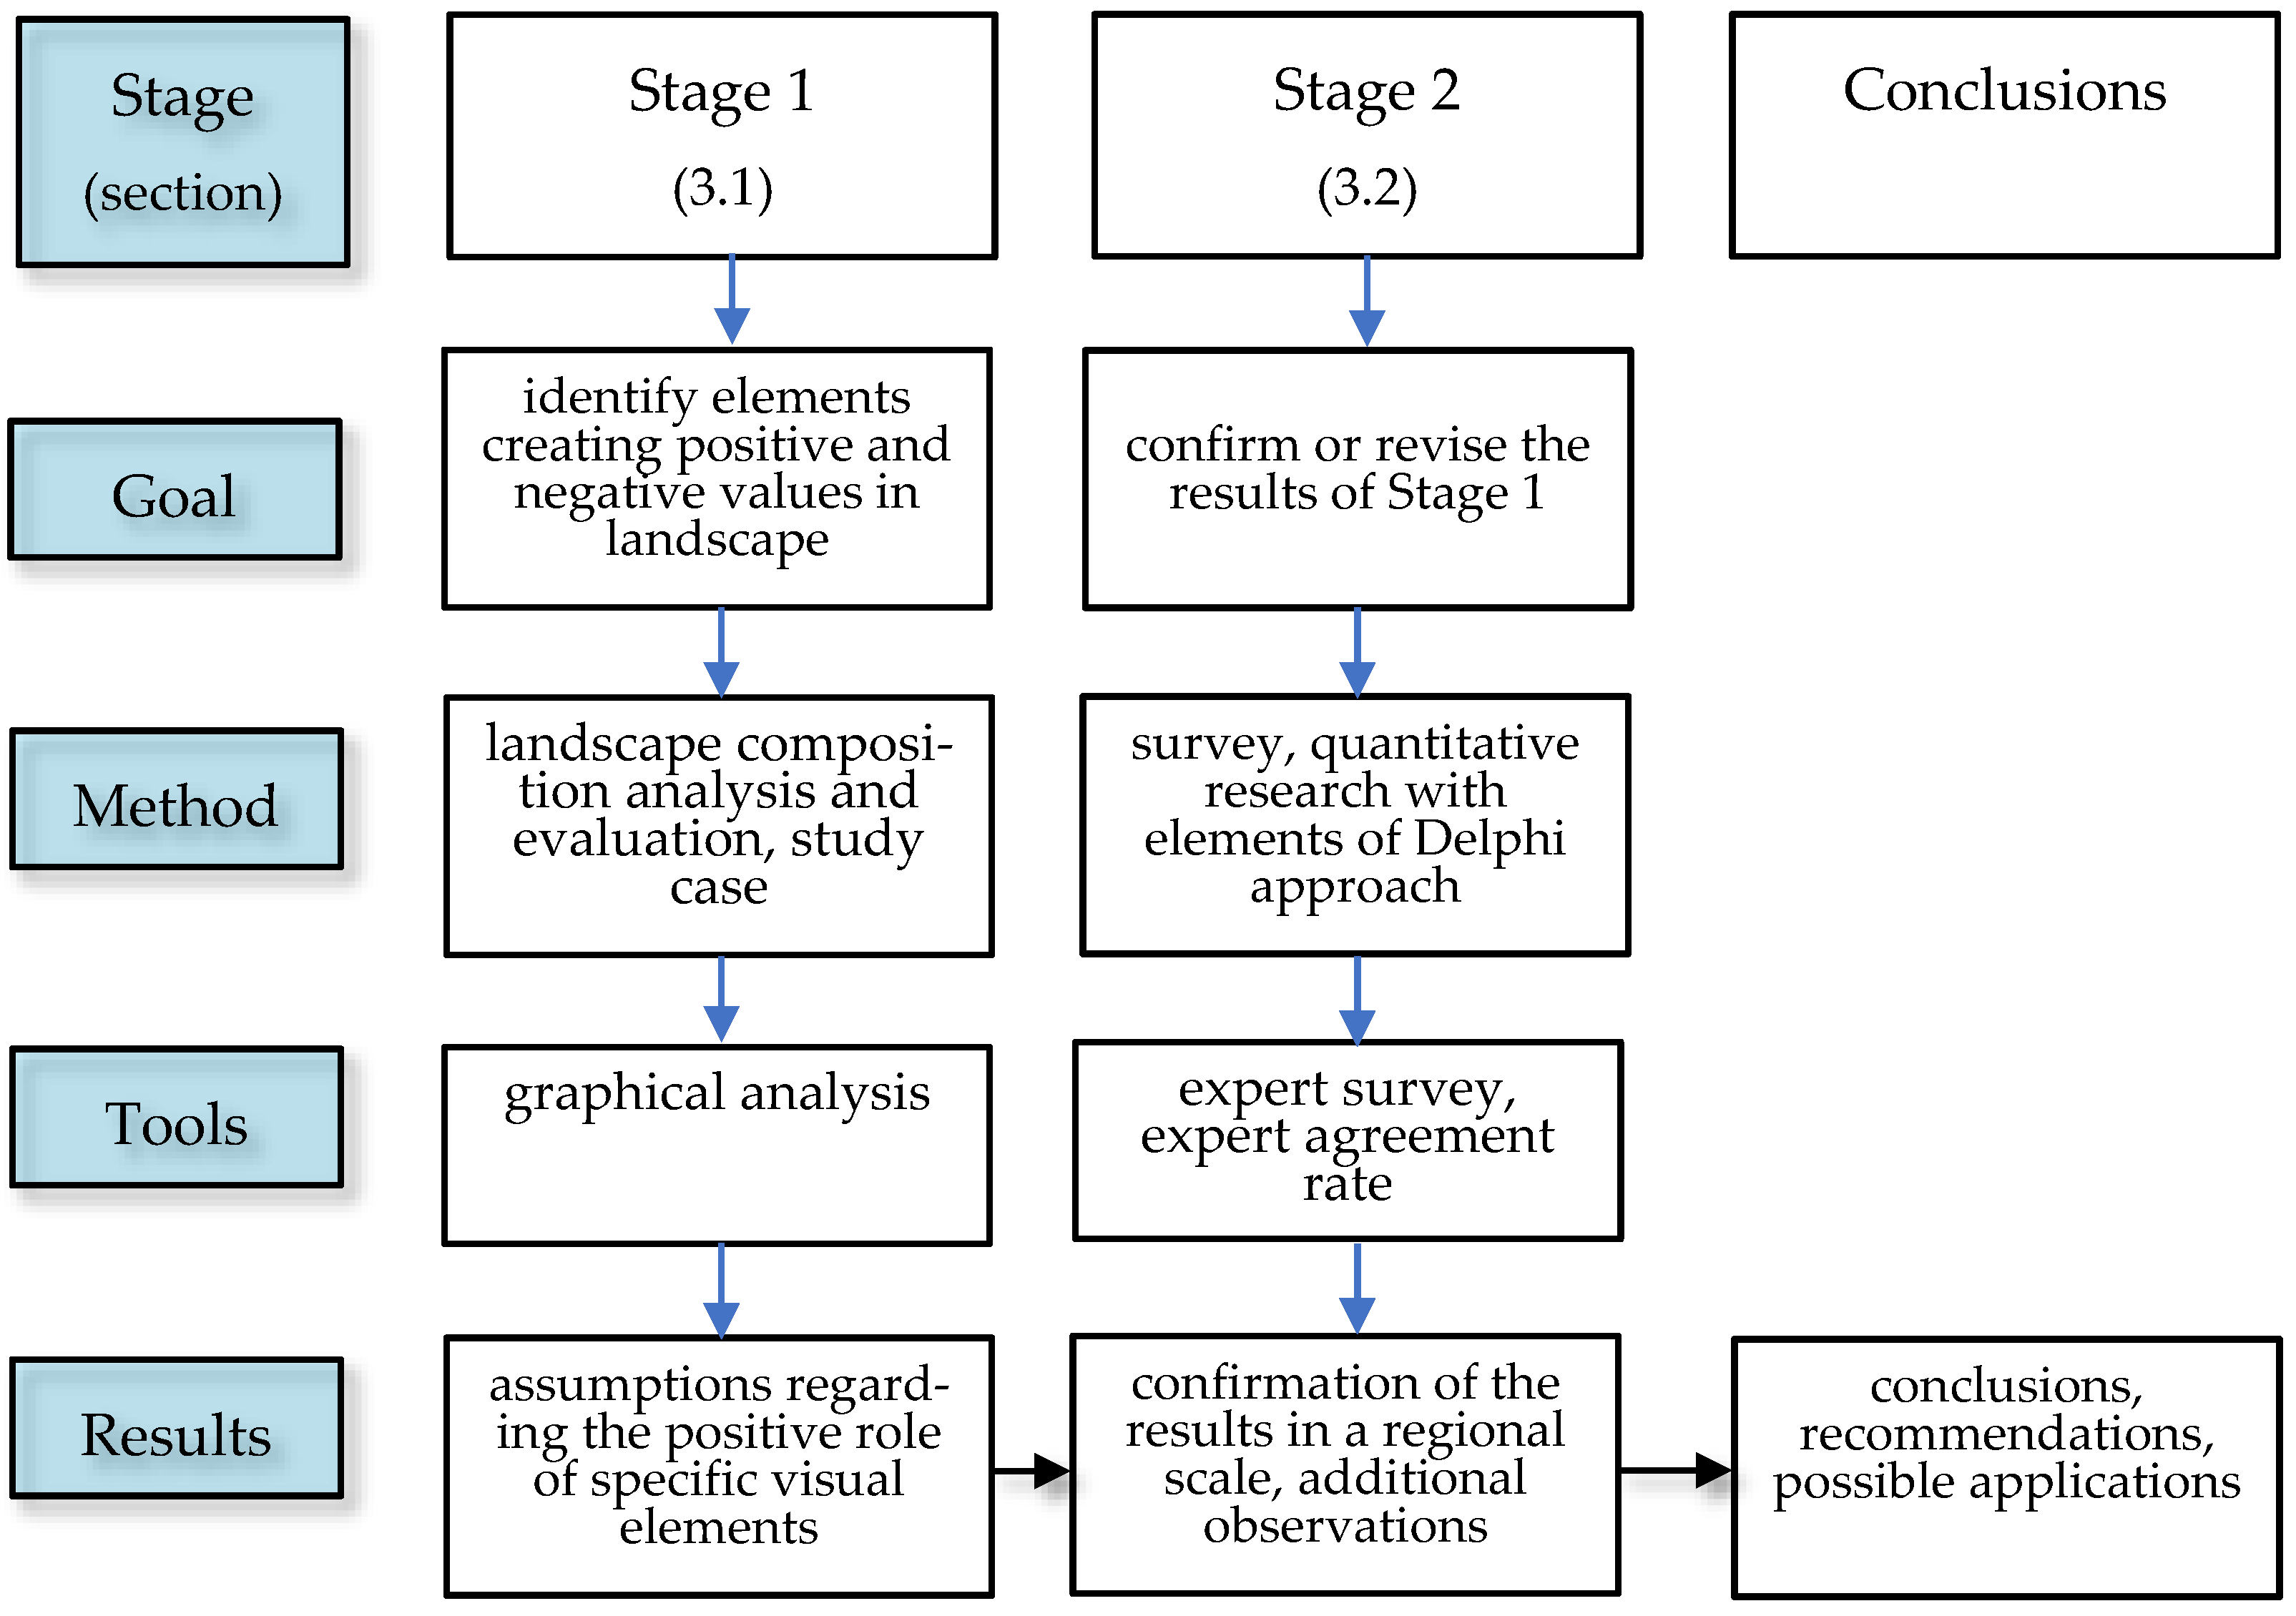
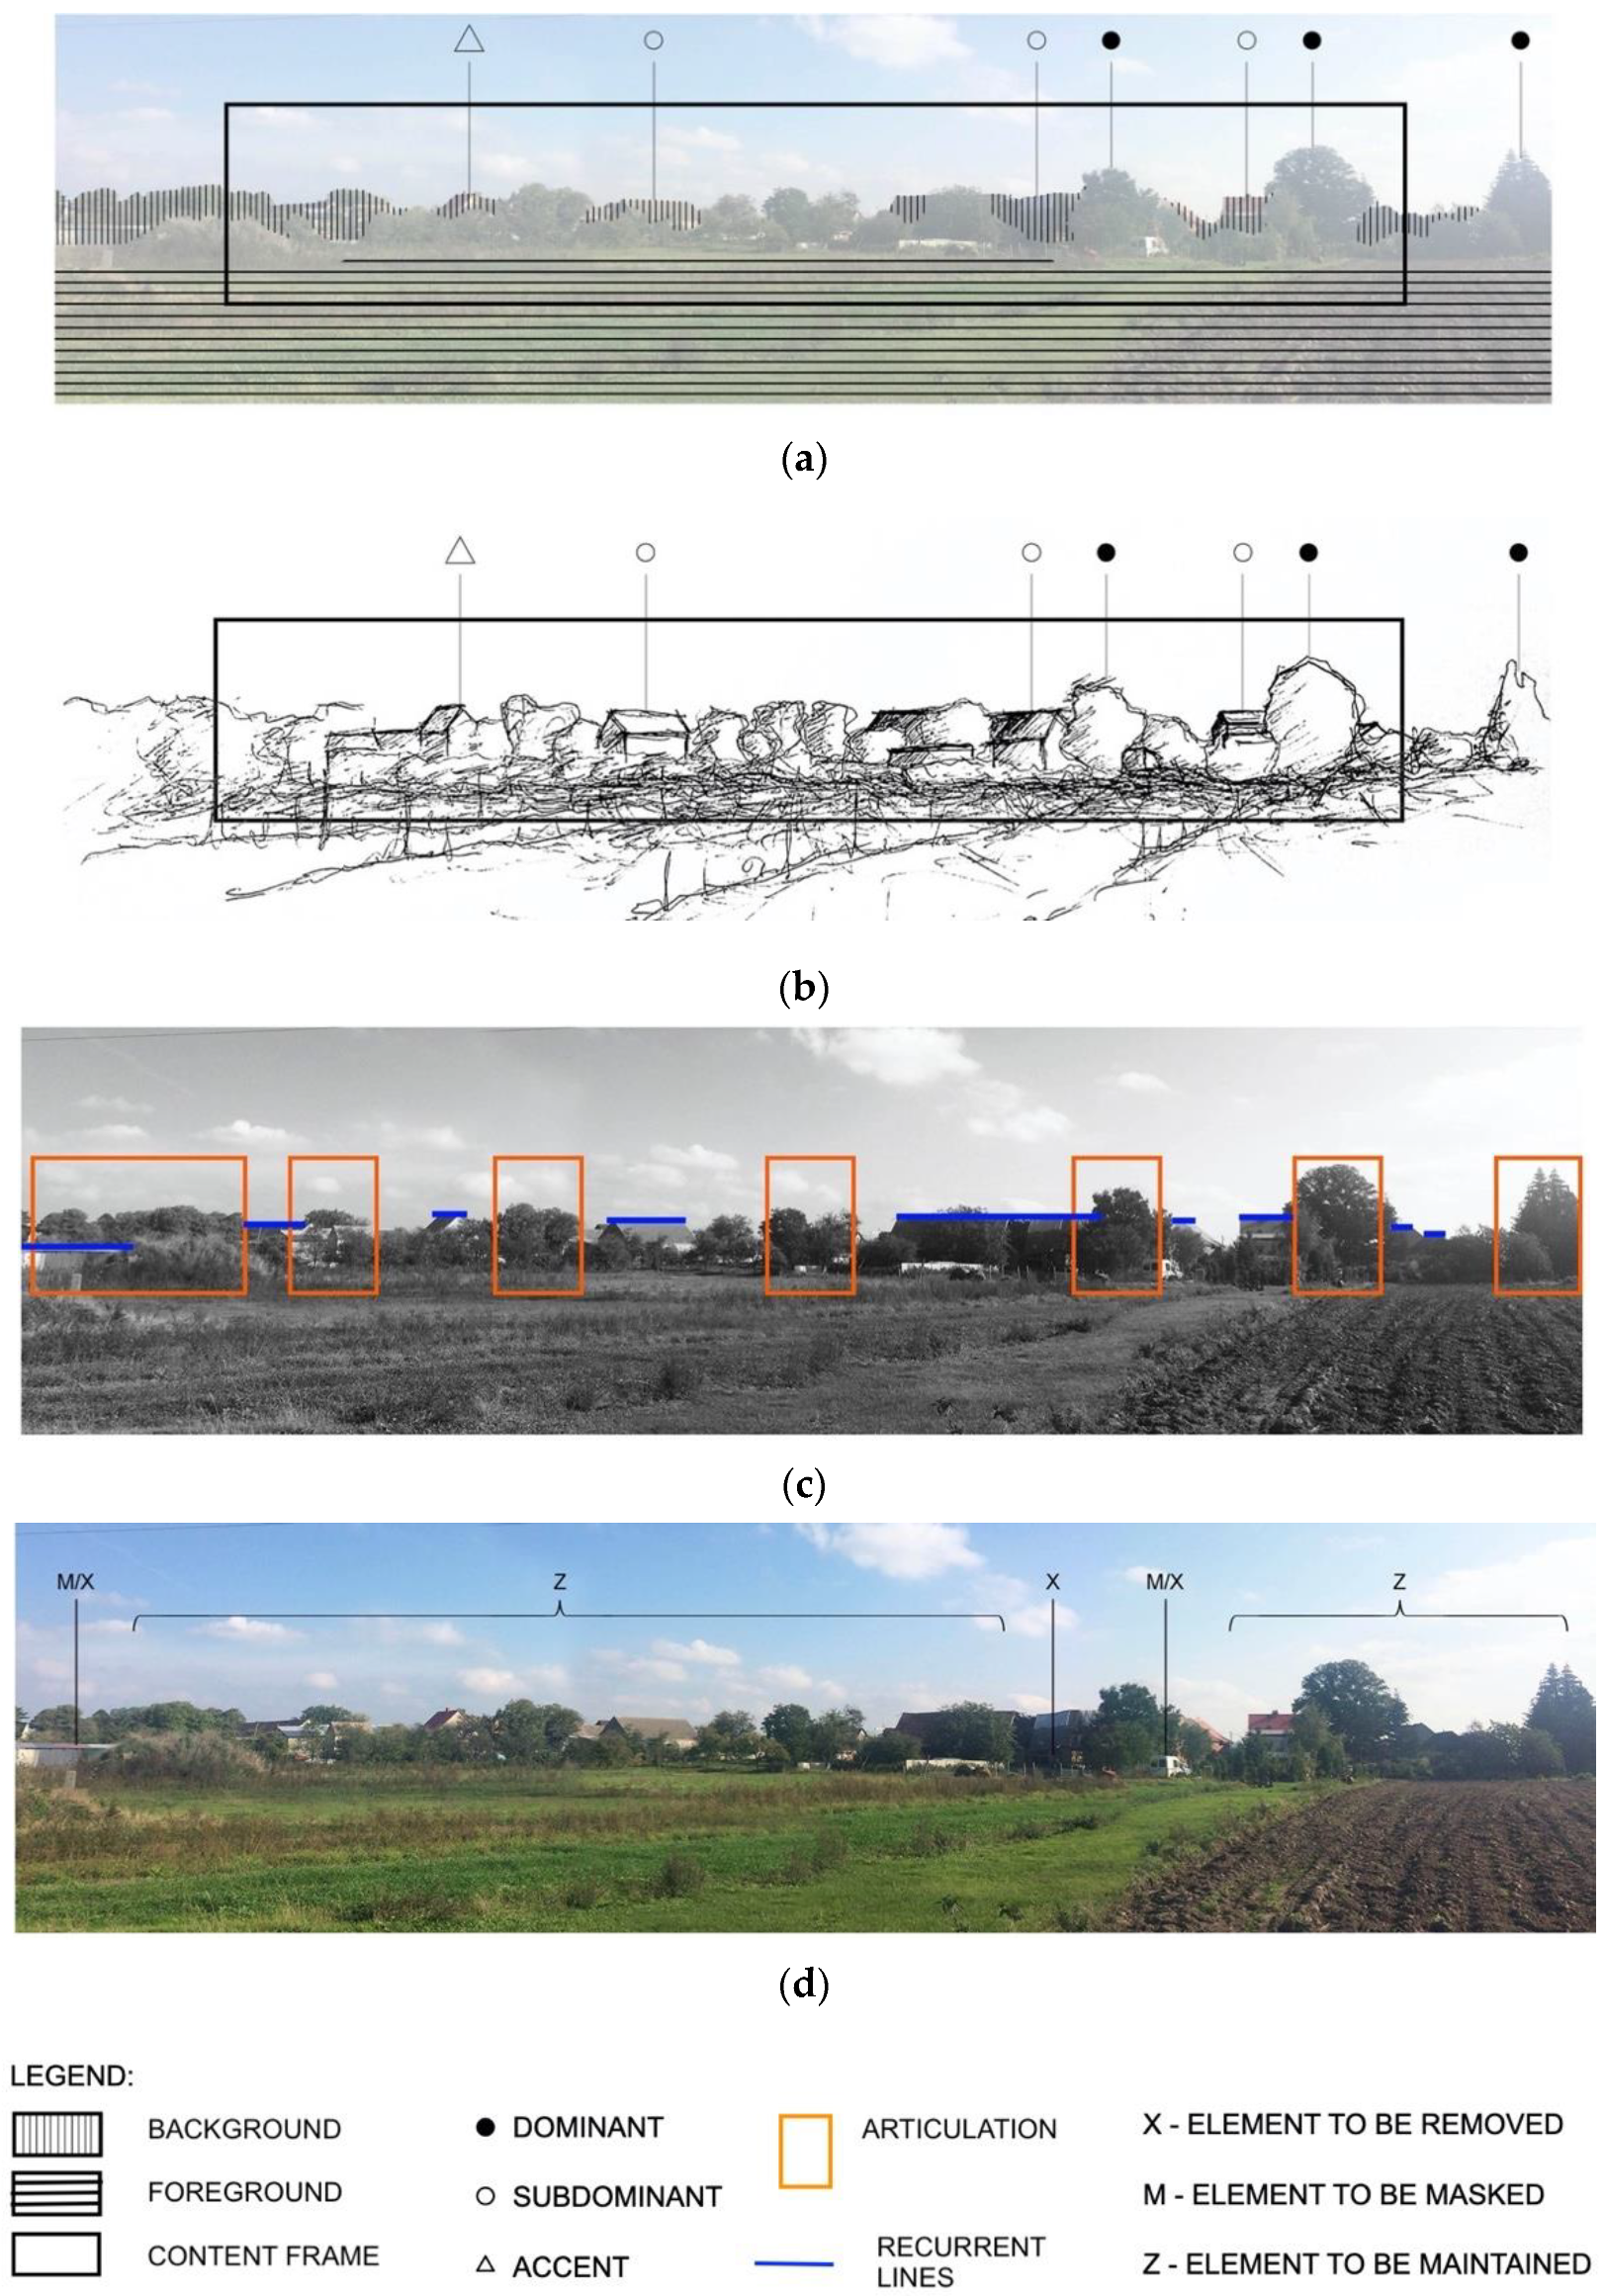
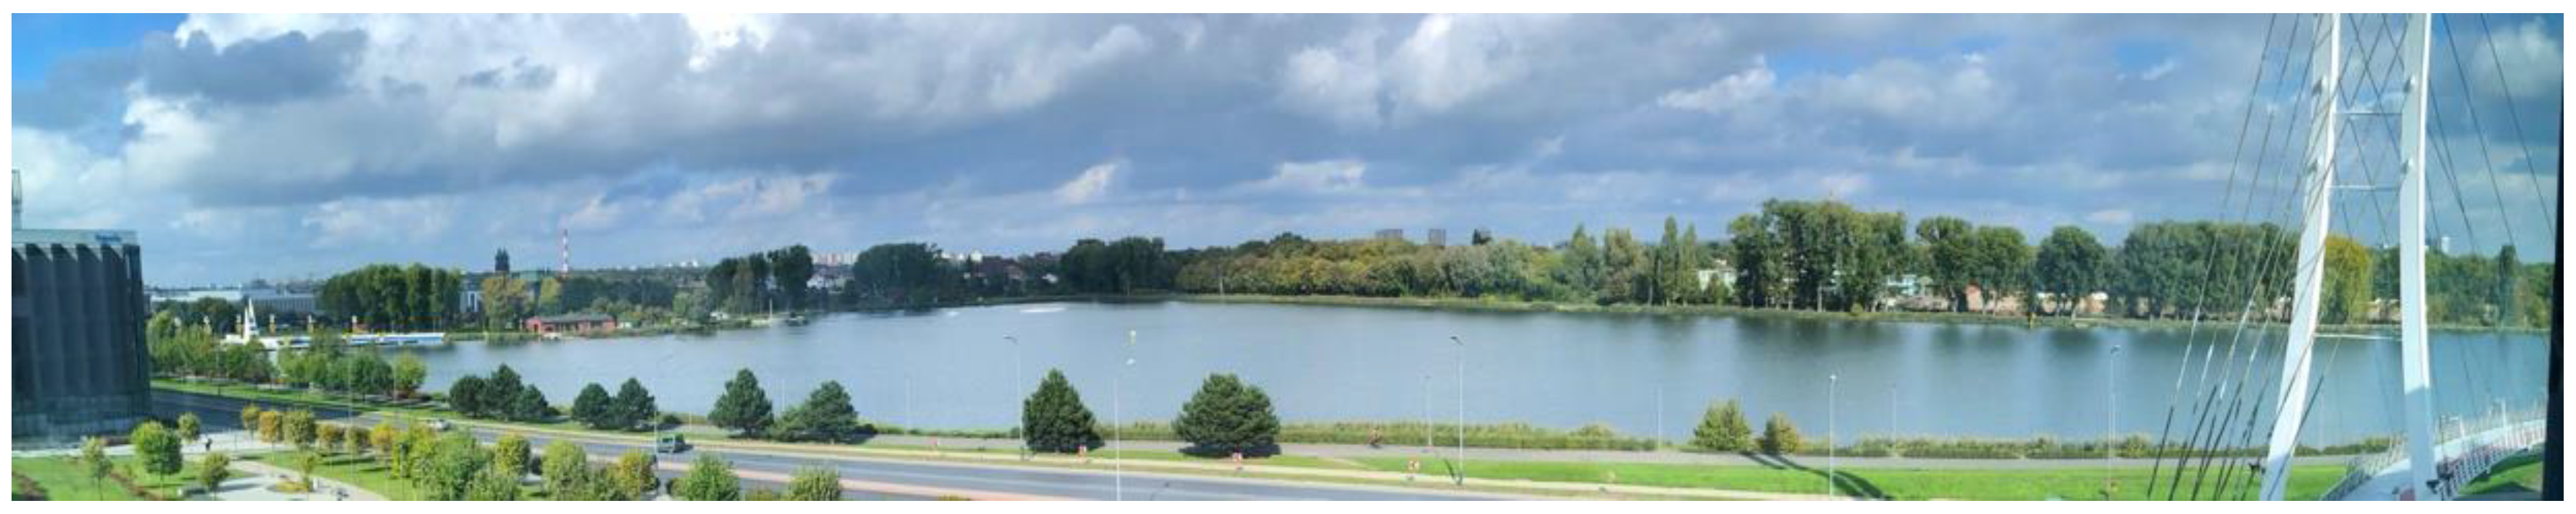
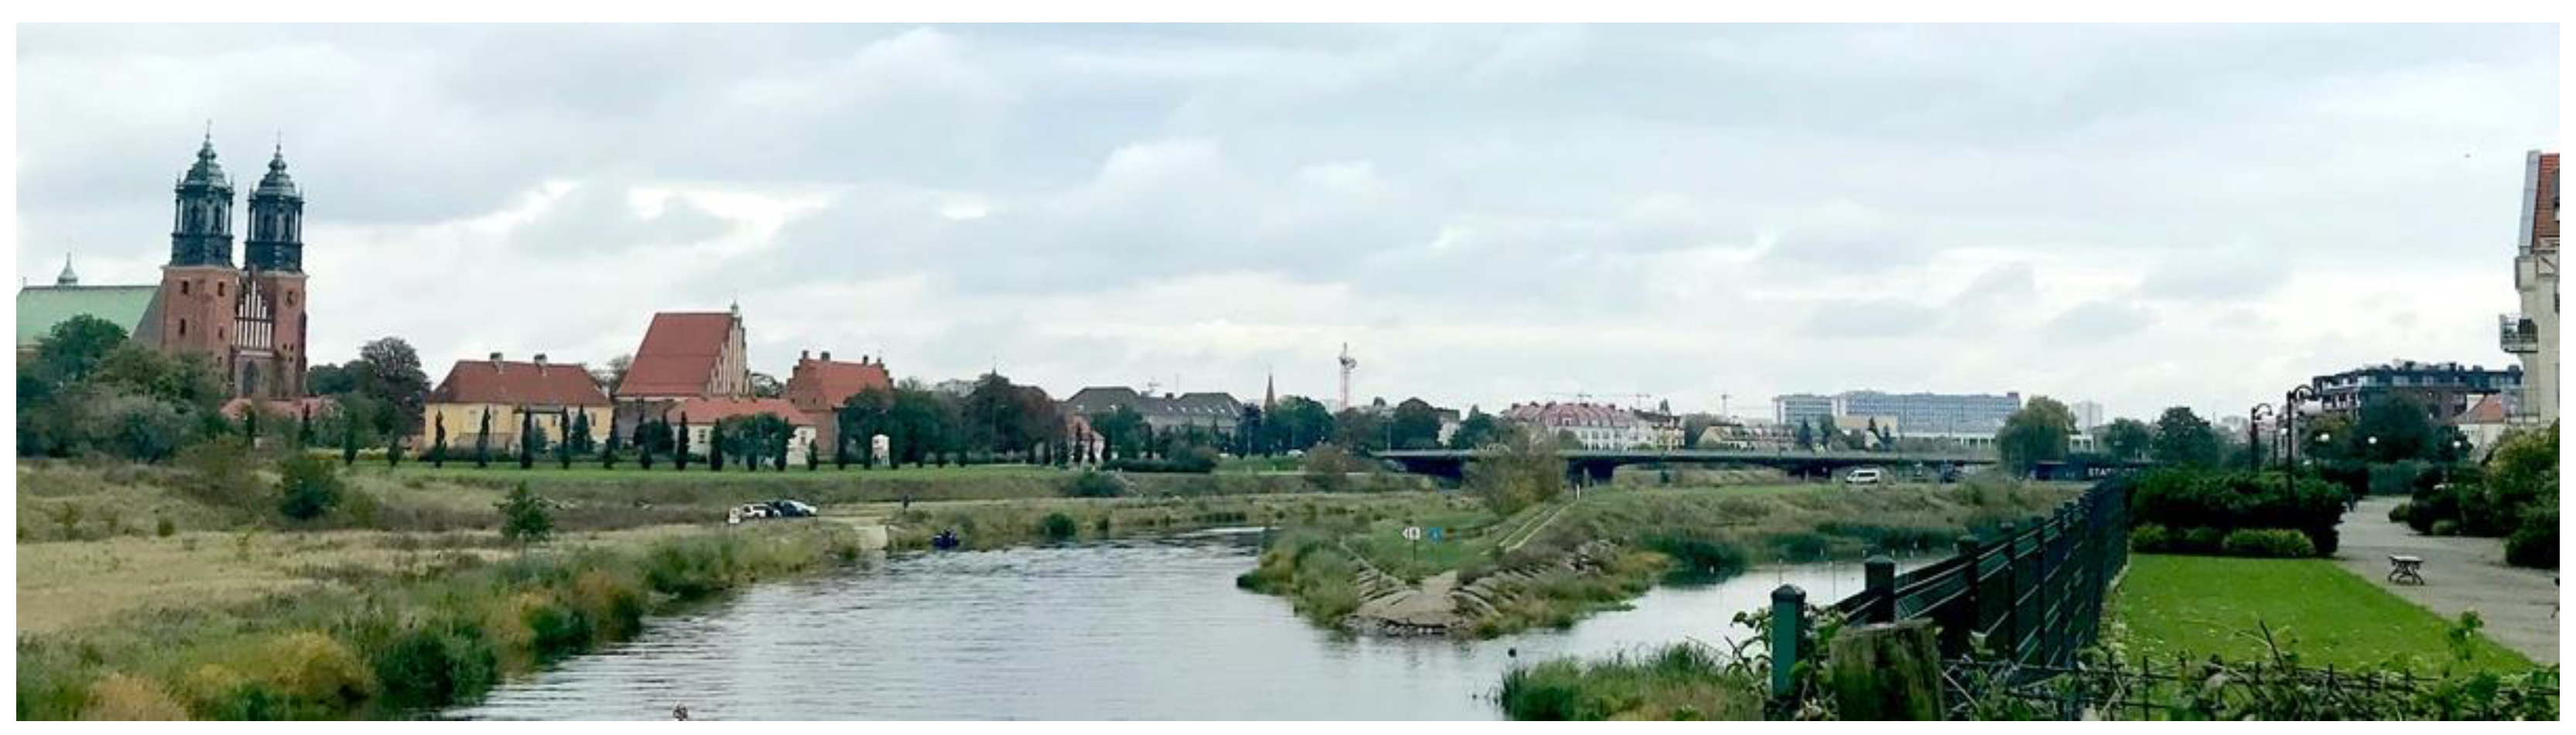
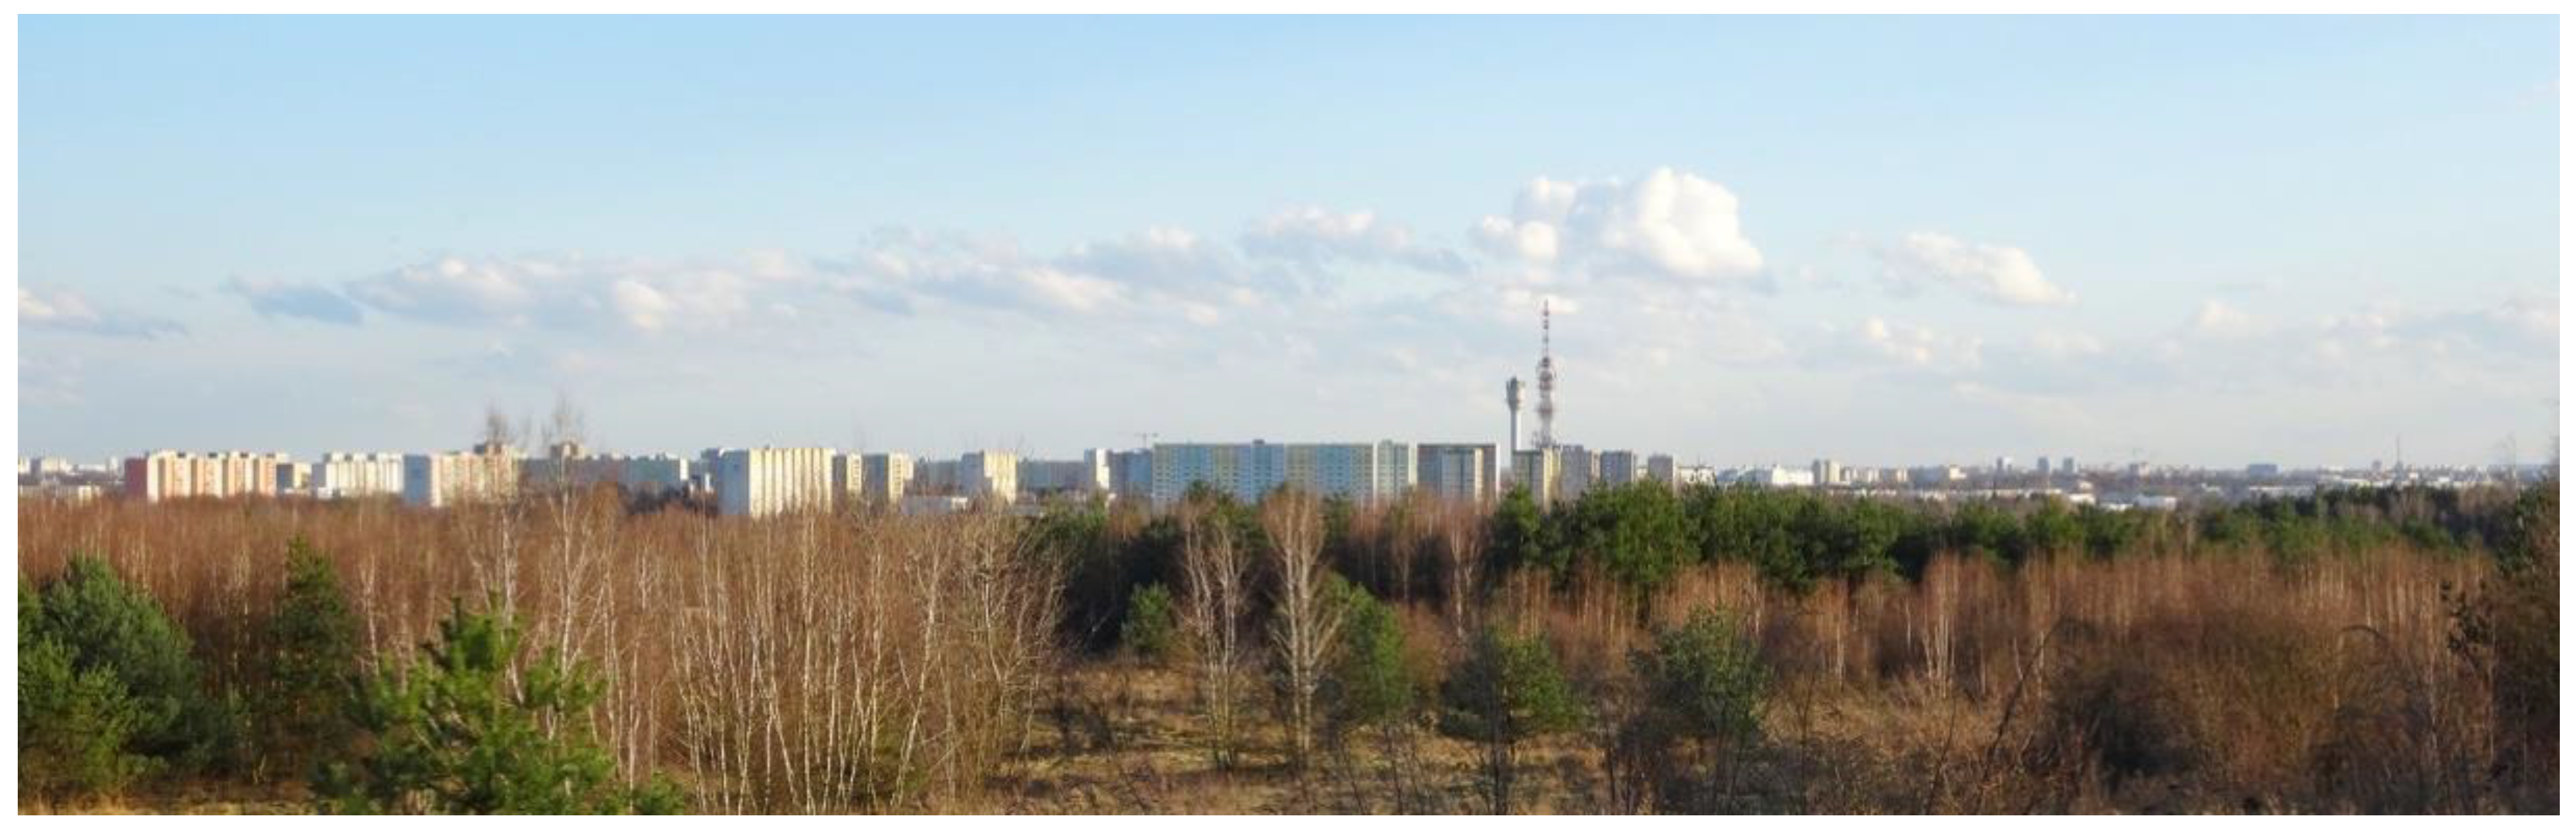
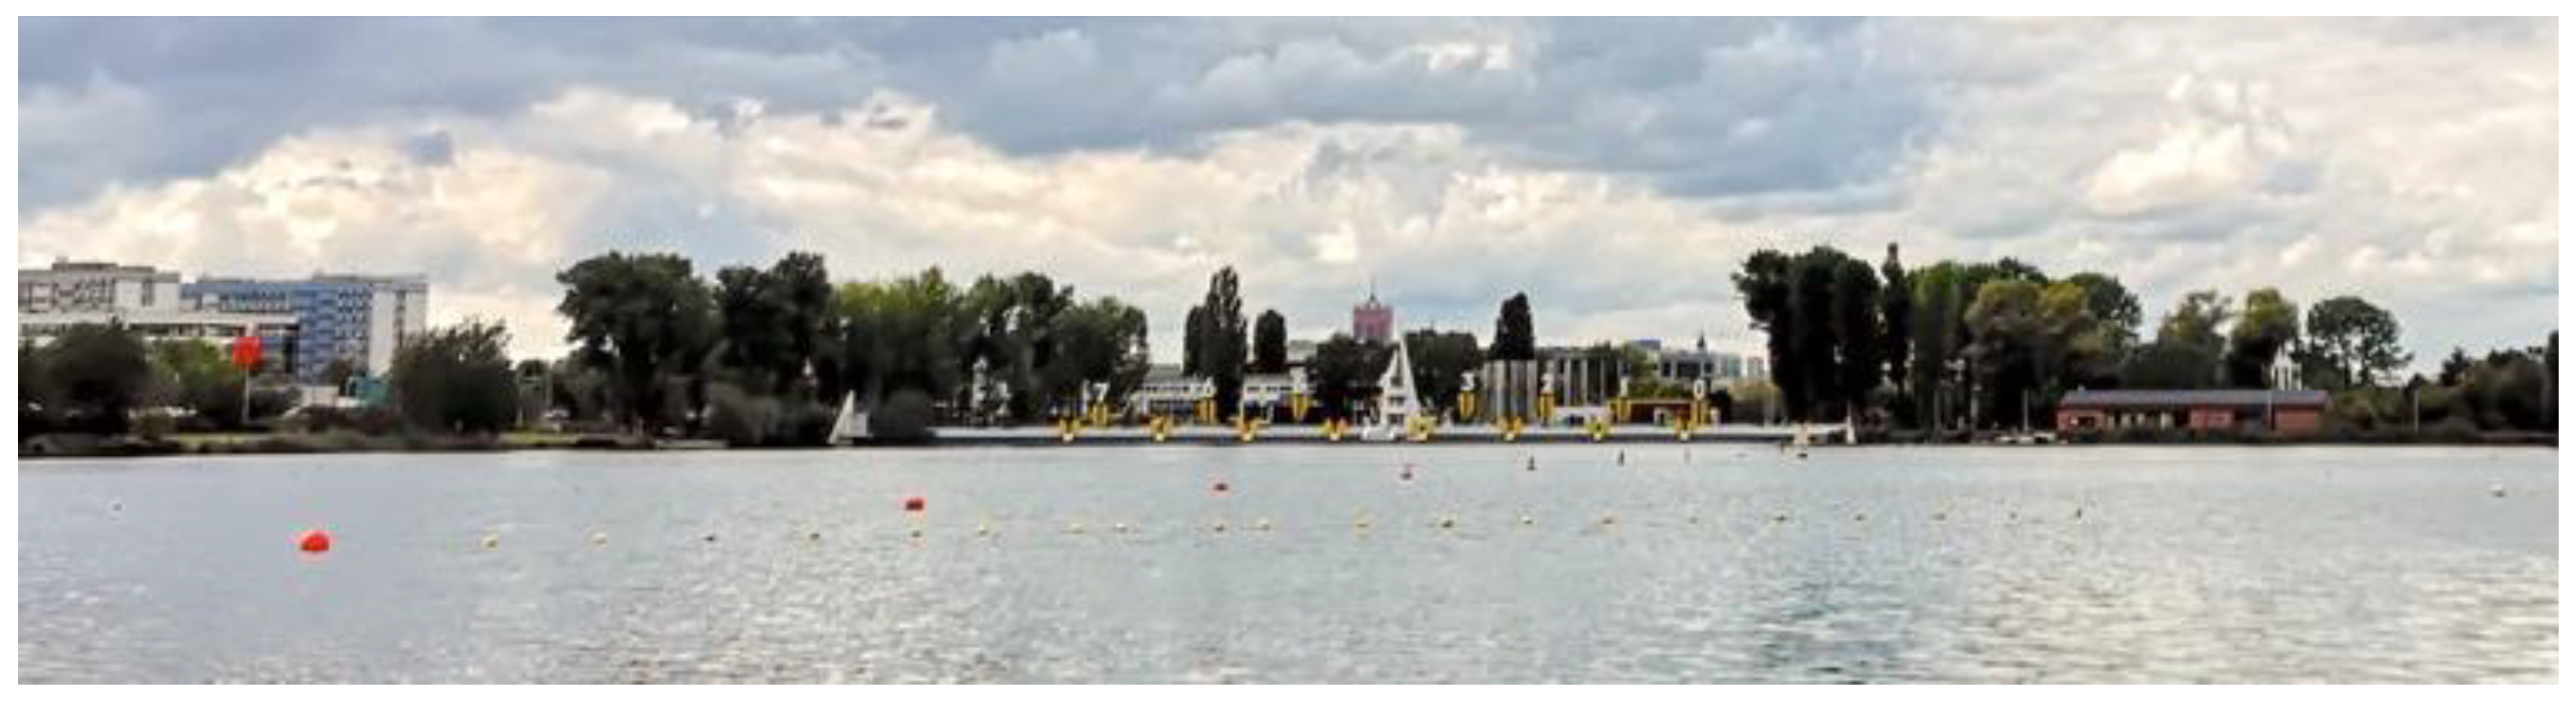
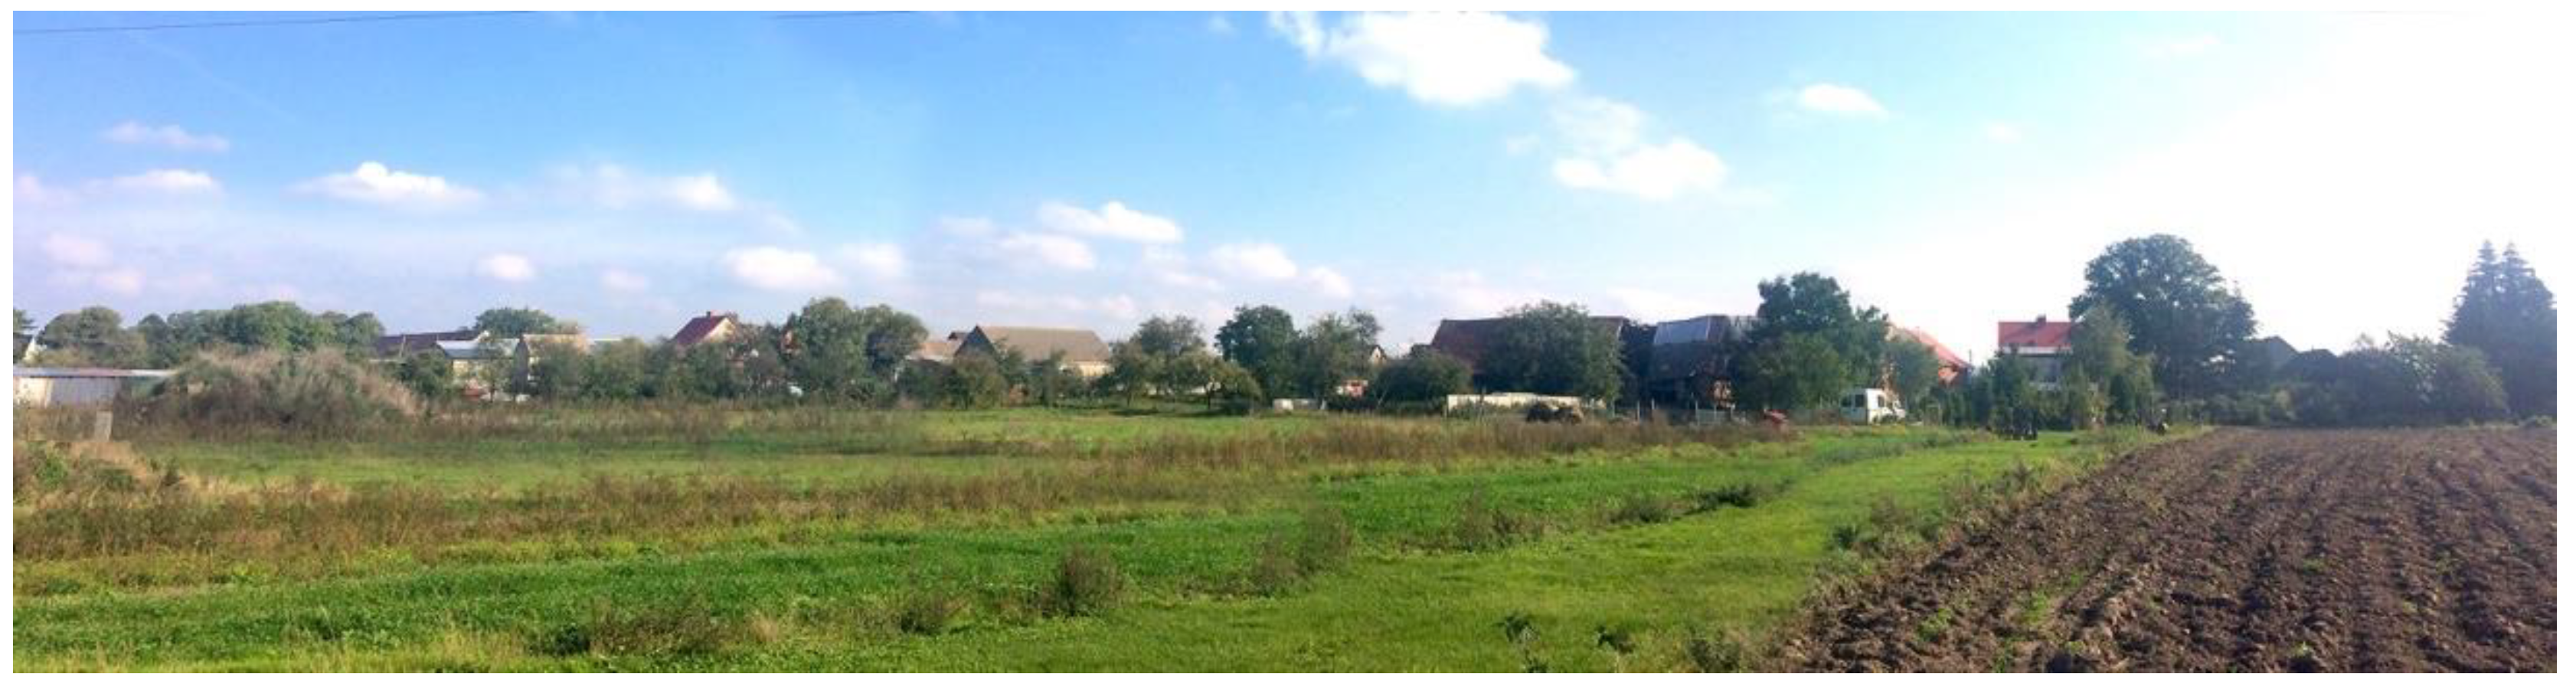
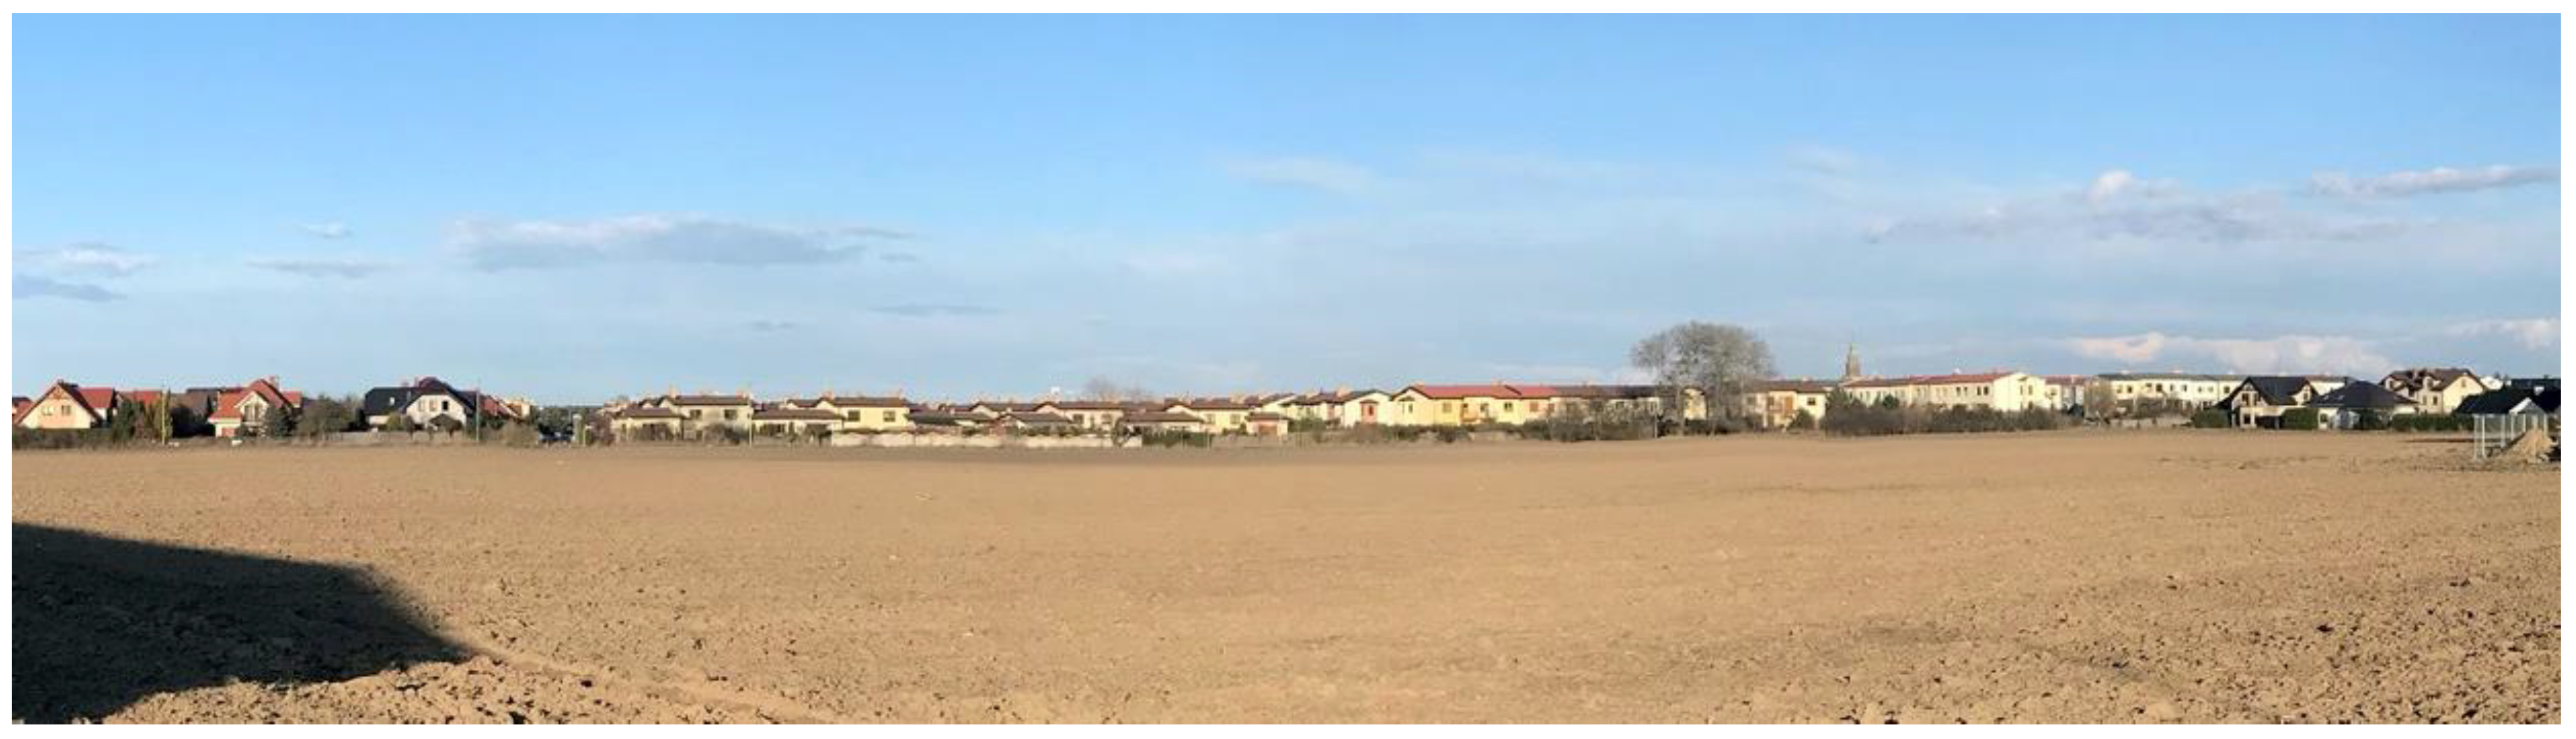
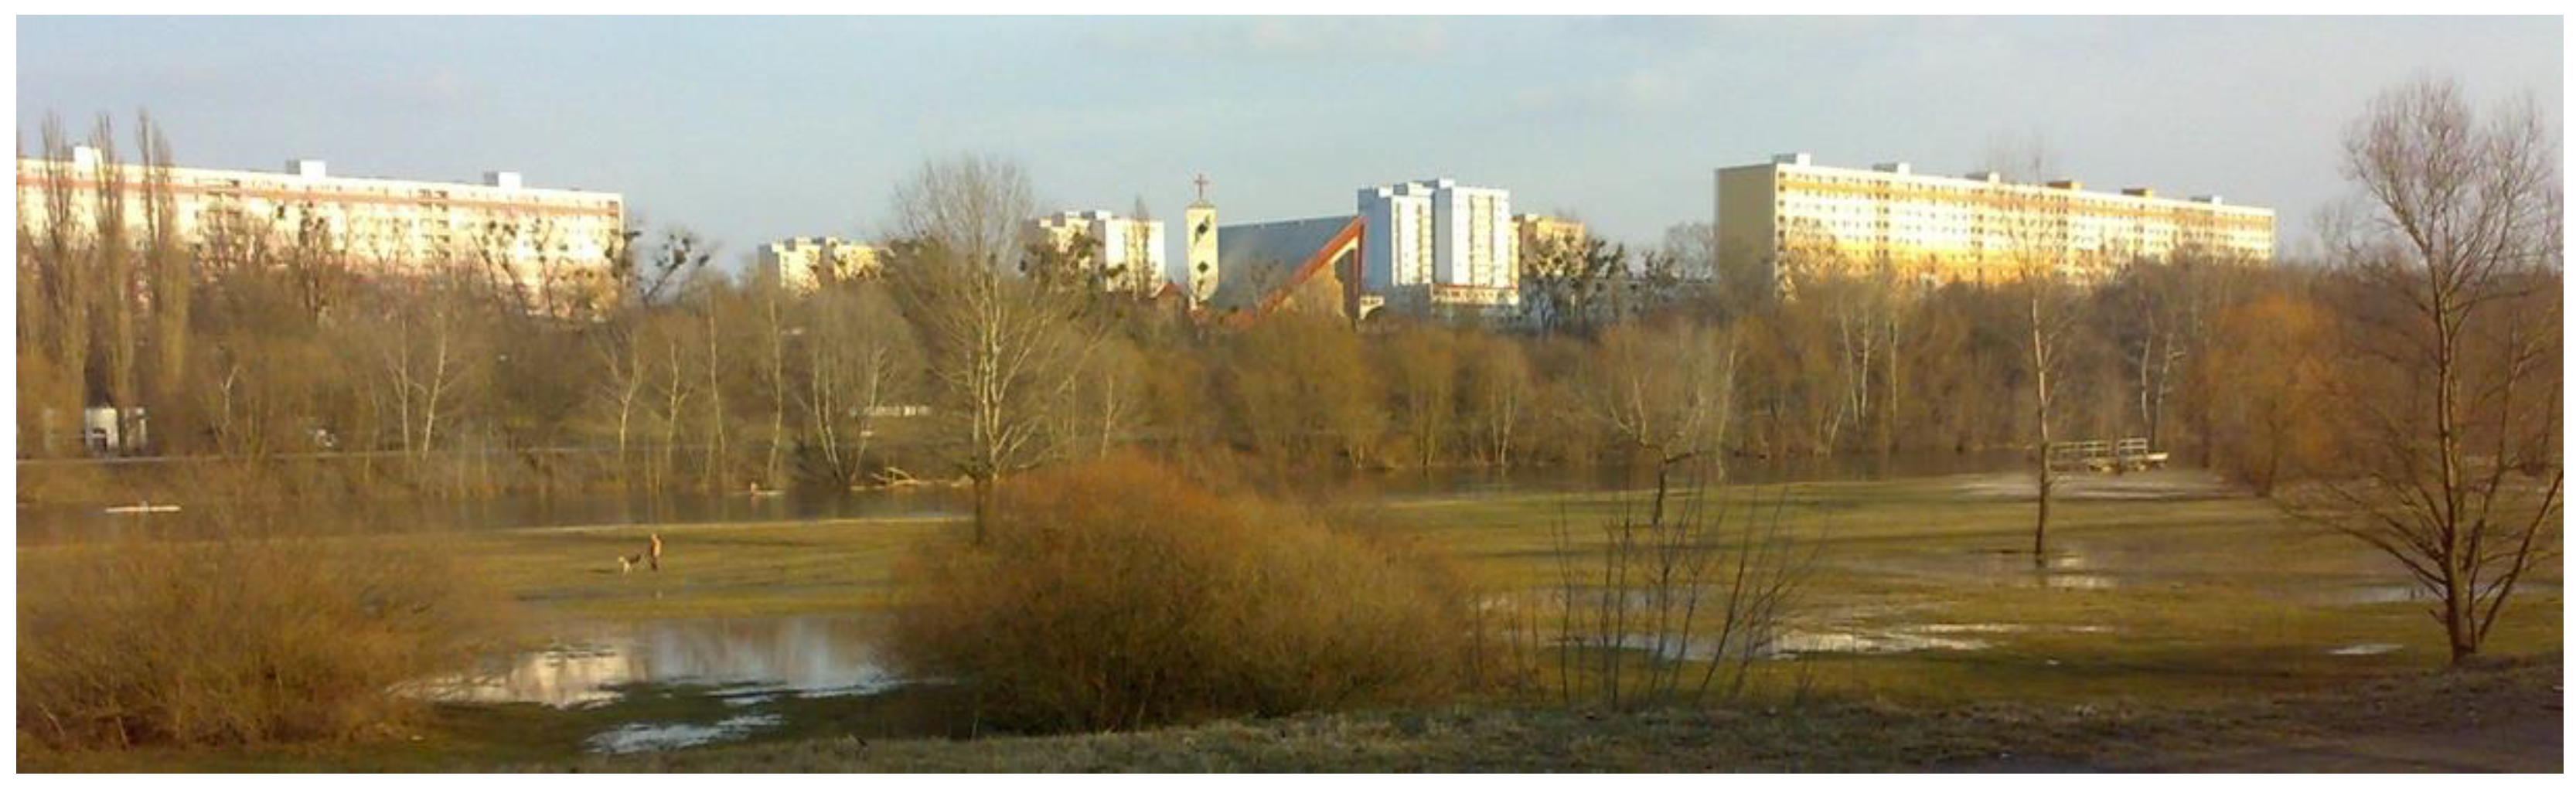
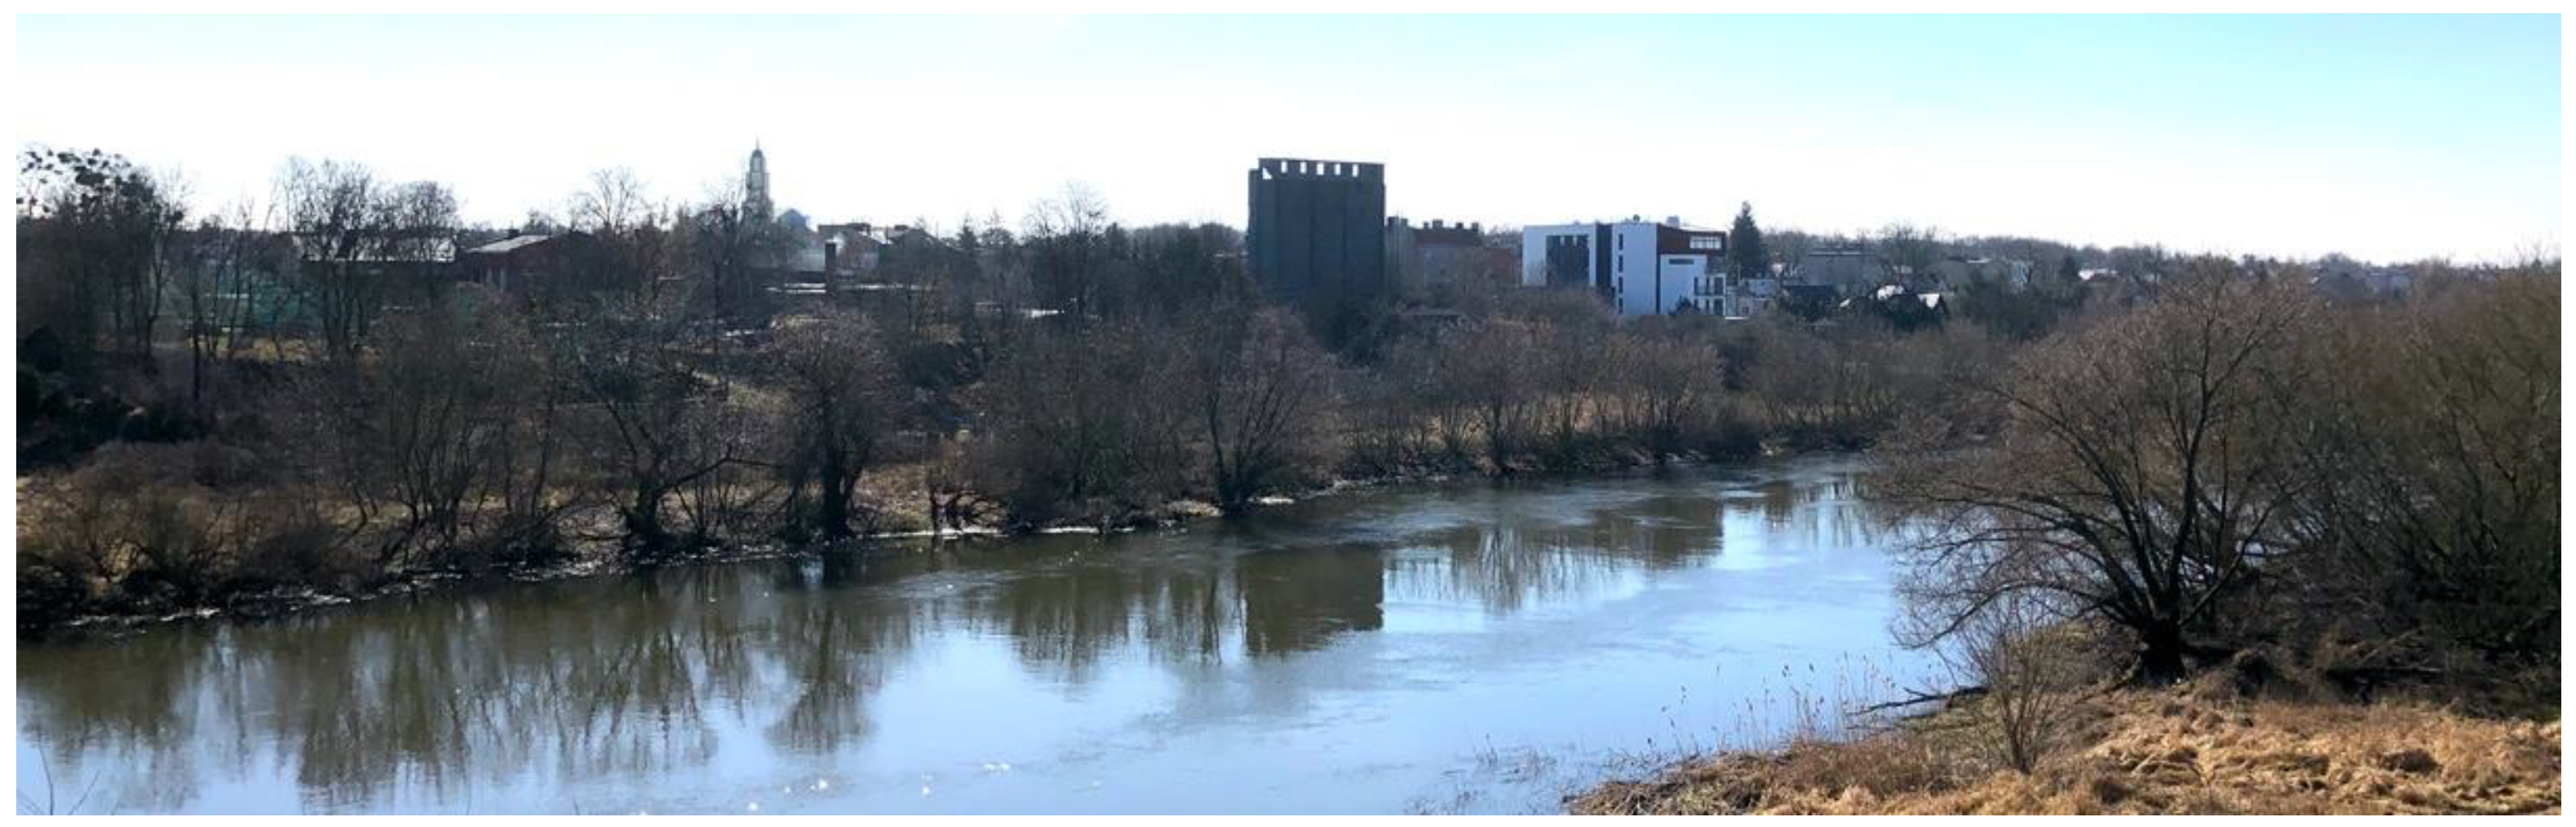
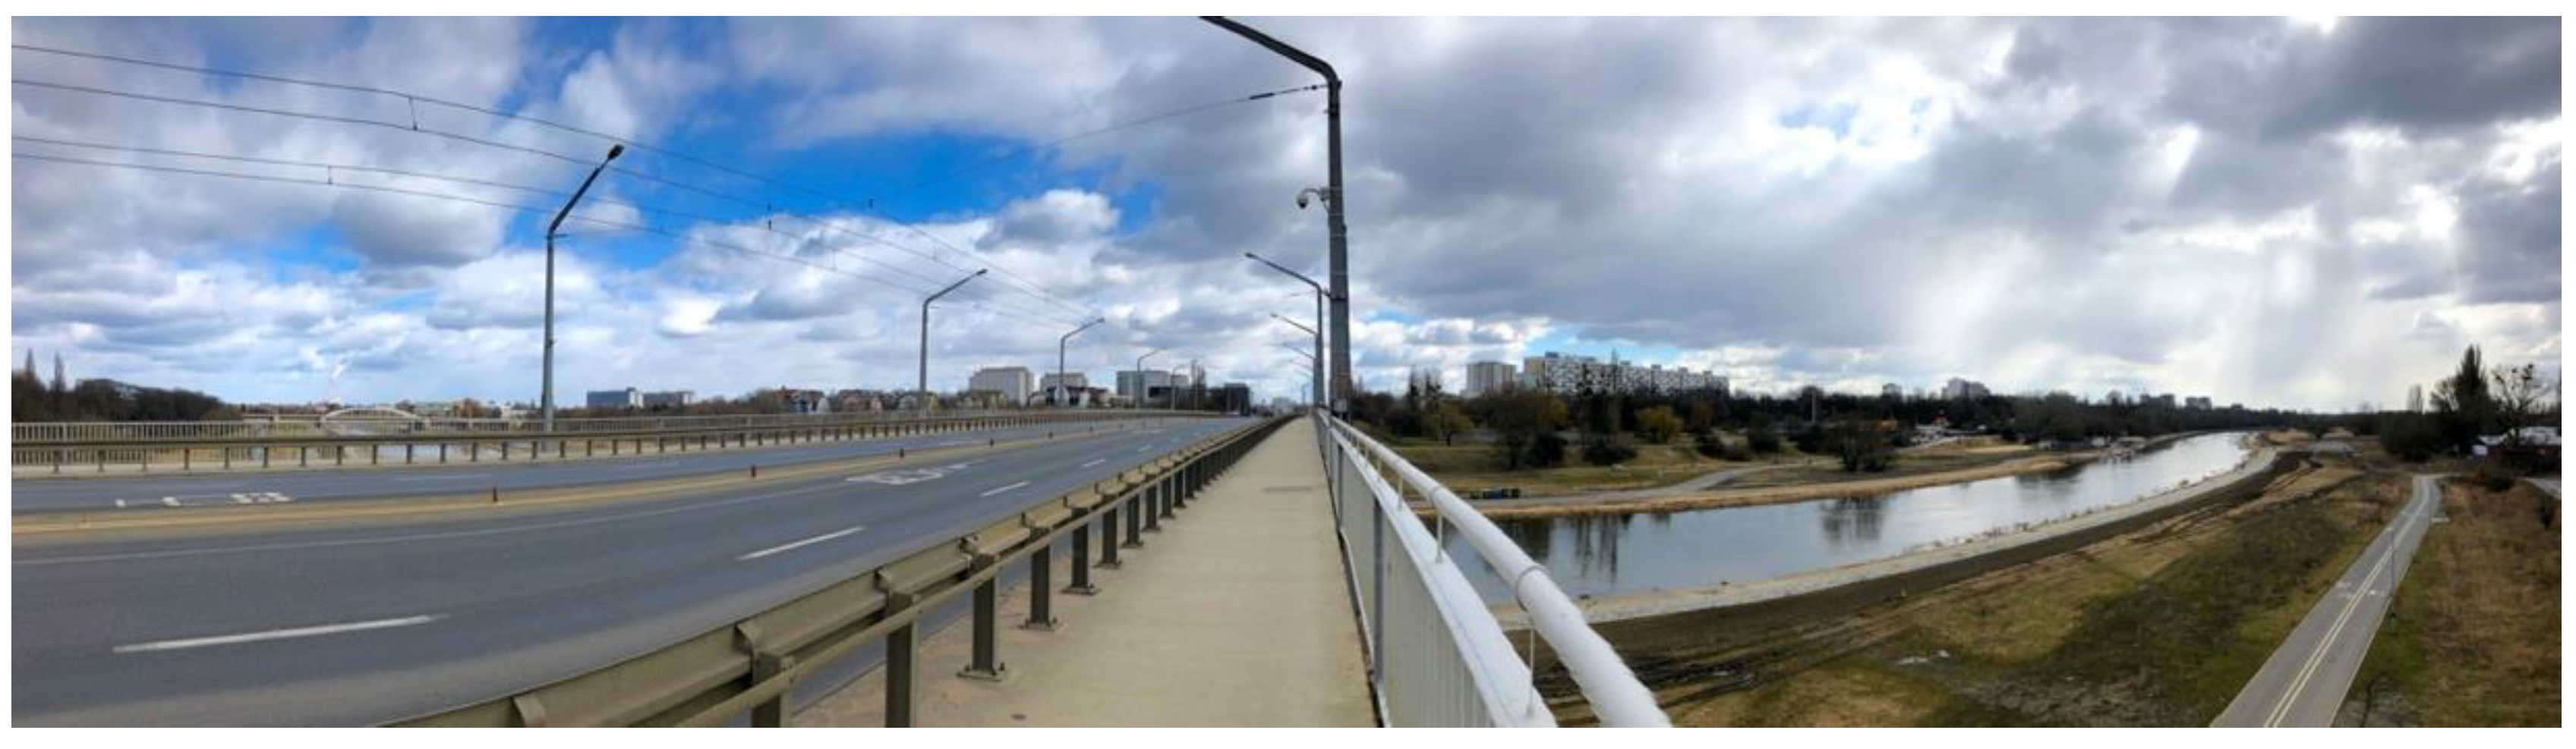
The second stage of the research will try to confirm the results brought forth by the composition analysis study on a broader scale. It consists of an inquiry undertaken among architecture students after their fifth semester who had completed courses on urban composition, greenery design, and landscape architecture, making them competent experts in assessing a landscape’s visual value. The inquiry respondents (33 persons) were provided with 20 images representing selected examples of cultural landscape panoramas from the study area, including urban and suburban locations. The panoramas are contained in 
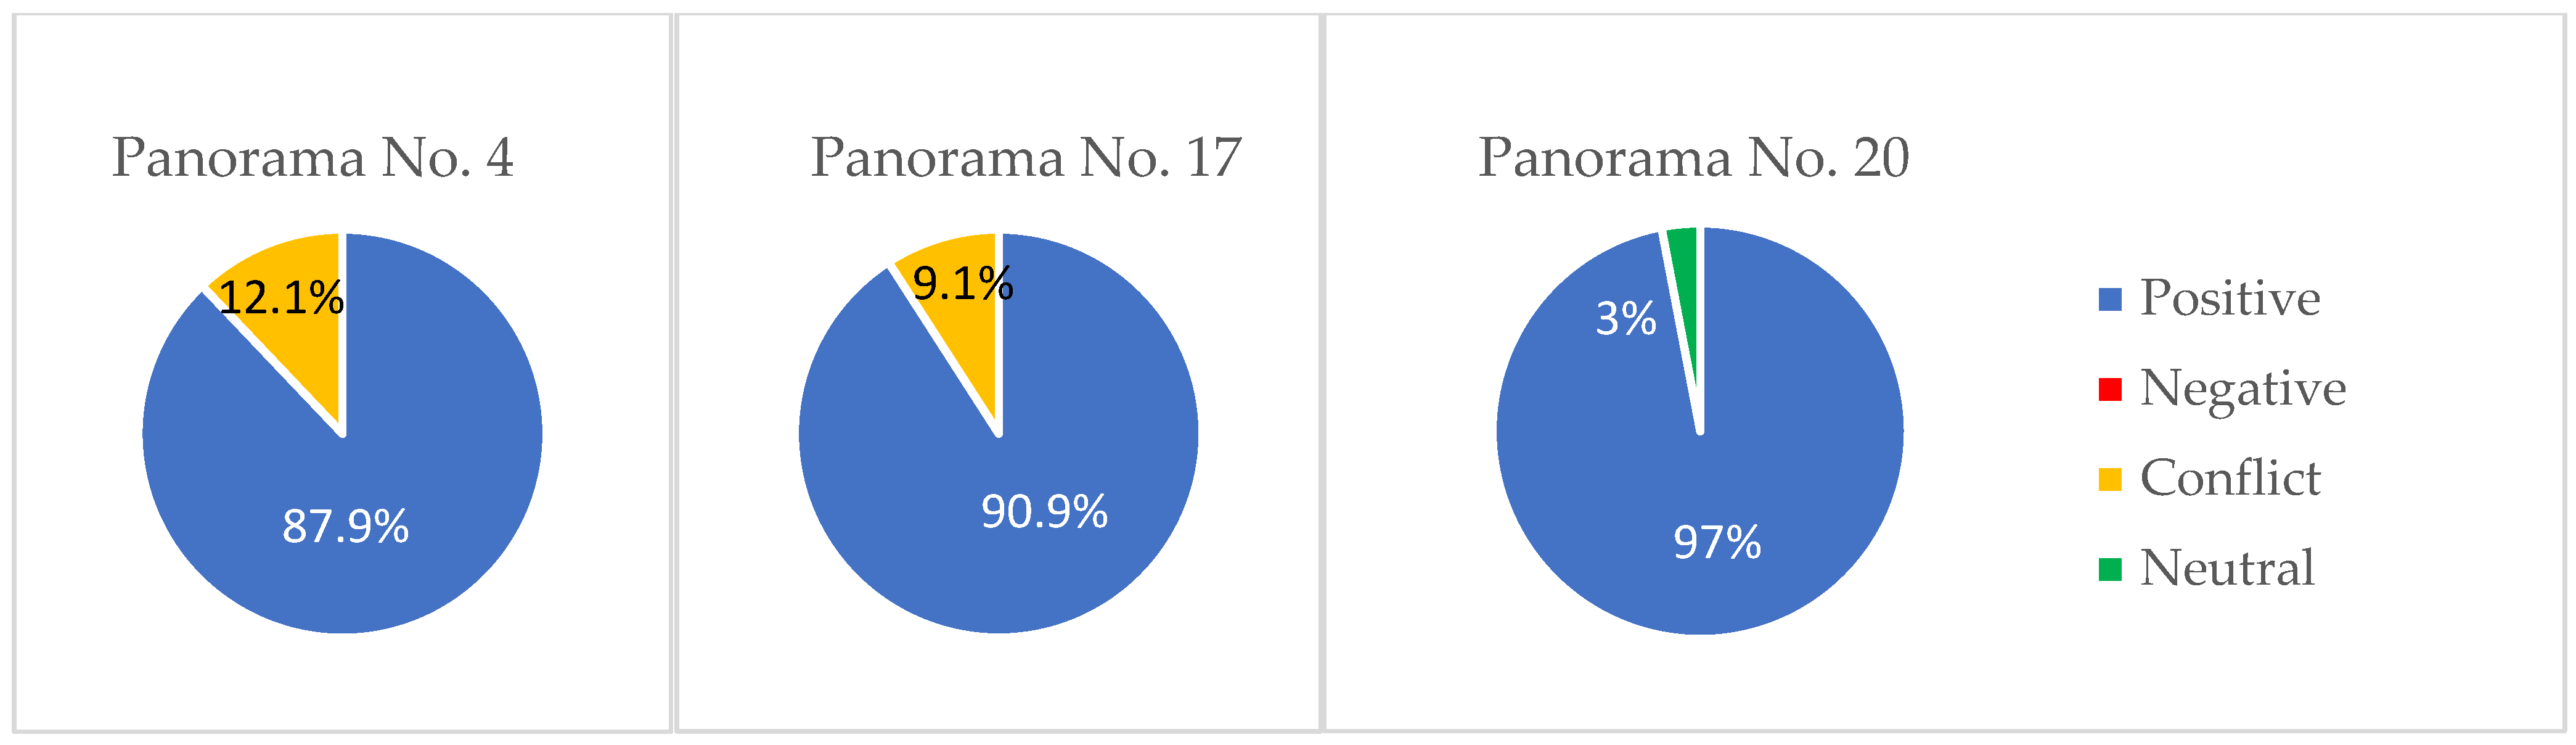
Section 3.2.1, along with the presentation of survey results. The respondents were shown the images and asked three questions. In the first question, they were required to define whether the image they see contains primarily positive or negative values, a conflicting combination of the two, or neither positive nor negative values. In the second question, the respondents were asked to name the visually positive elements they could see, if such existed, and in the third question, they were asked to point out negative elements in the same way. What is important, in this stage of research the survey respondents were asked to provide their first impressions, without performing an analysis procedure. This feature makes the survey imitate the usual landscape perception, as it takes place in everyday conditions. In this way, the survey seeks to verify the results of the first research stage in a more realistic and ordinary aspect (Figure 3).
The second stage of the research is to ascertain the positive or negative value that the landscapes’ visual elements represent. Therefore, our work on the survey results is a quantitative study, combining aspects of the Delphi approach to identify respondents’ agreement on specific aspects [42,43].
The Delphi technique belongs to the group of heuristic methods and is commonly used for forecasting, but also for policymaking and reporting guidelines. It relies on a panel of experts and usually strives to achieve their agreement on a specific issue, which is the focus of the study [42]. In this research, two principal elements of this approach will be used: relying on a group of experts and checking their agreement rate regarding the perception of landscape values. The survey is limited to only one round, which is a major difference compared to normal applications of the Delphi technique. The reason is that, as shown in the introduction, landscape perception naturally differs depending on the viewer’s personal background. Full agreement would not be possible to achieve. Hence, the goal of using selected elements of the Delphi approach is to study the realistic agreement rate among experts, without striving to achieve their complete consent.

3. Results

The presentation of the results is divided into two sections, following the above-described division of the research into two organizational stages. The first part discusses the significance of landscape composition, citing examples of a panorama-based analytical procedure to examine the landscape’s visual aspect structure. The second part discusses the results of the inquiry regarding the values attributed by the respondents to specific visual elements of the landscape.

3.1. Landscape Composition Analysis

With regard to the landscape, the composition analysis procedure treats it as a visual semiotic system. It hence aims to examine its structure, focusing on the mutual relationships between its different visual elements. These relations can be perceived in both static [34,35] and dynamic [39] ways. In this study, the first approach is adopted, focusing on the landscape’s structure as it can be perceived through an image, usually a hand drawing.
The landscape analysis procedure examples used for this part of the study came from multiple locations within the agglomeration of Poznań. They were realized by the architecture students of the PUT within the framework of Architectural Design in the landscape studio. Figure 4 presents an example of the landscape analysis performed for a typical urban panorama in the center of Poznań.
The analysis procedure started with the inventory of the selected panorama. Students were encouraged to draw the chosen panorama by hand rather than use photographs to deepen their understanding of the landscape’s structure. While drawing the panorama, they were asked to identify the types of landscape they observe (e.g., urban, park, forest, rural) and inventory its actual contents (e.g., specific buildings) (Figure 4a, inventory line). The panorama inventory was not limited to the view itself. It was supplemented by an analysis of the surroundings based on the plan, which helped to break the view down into first, second, and subsequent planes (Figure 4a, right side).
In the second step, the students proceeded to analyze the landscape composition. The composition’s main elements (i.e., dominants, subdominants, accents, foreground, and background plans) were usually distinguished in the first step (Figure 4a, middle line). In the example shown above, the cathedral was identified as a main positive dominant of the composition. A modern utility building was identified as an accent. Then, other characteristic features were recorded, including the definition of the soft (e.g., vegetation) and rigid (e.g., buildings) content (Figure 4b). Other examples also analyzed the articulation and rhythm or involved the creation of a color chart. Less common landscape features, such as the mirror effect produced by the presence of surface water, were also noted at the composition analysis stage.
The phases of inventory and composition analysis prepared the ground for the next stage of the procedure: landscape evaluation. This stage aimed to recognize the primary values by assessing the landscape’s visual quality and indicating vital problematic or conflict areas. This knowledge subsequently allowed determining actions to either protect or improve the landscape, as noted in the presented study’s top line (Figure 4a). In this example, the right half of the panorama, containing mainly heritage landmarks and greenery, was indicated to be maintained in its present state. The same applies to a short section on the extreme left side of the panorama, which primarily consists of greenery. The two panorama sections marked with letters “M” and “X” contain elements indicated to be masked (power plant) or removed (old utility building). In this way, the analysis’s conclusions were translated into both design guidelines and land management policies.
Another example of panorama analysis from an urban location (Figure 5) shows that positive values are not necessarily attributed to a dominant. In this case, the dominant (a modernist block of flats) was considered neutral. Positive values were attributed to the foreground of the composition, which is formed by the waterfront and a landmark bridge. The improvement guidelines are a natural consequence of the evaluation stage, suggesting maintenance of the green waterfront and unification (or calming down) of the large residential unit. What is interesting, the possibility of improving the panorama with a new dominant is suggested (Figure 5c, letter “D”).
Urban locations prevailed among the panoramas selected for the study (12 out of 14 selected examples). As shown in the example of a complete analysis realized for an urban panorama (Figure 4), the most positive visual values are regularly attributed to historical landmarks. This situation is the most recurrent for urban environments. In such panoramas, the greenery’s role is usually secondary, forming the background or foreground in the landscape’s composition. The visual value attributed to the vegetation in such panoramas ranges from positive to negative, and its maintenance remains a critical factor in locating its exact weight on this scale. Next, the flat surface of water or a lawn is usually identified as a suitable foreground, enhancing the perception of other panorama elements, which are, therefore, attributed a positive or neutral value. Finally, the panorama elements being regularly attributed negative values include industrial buildings and infrastructure (e.g., heat and power plants, exhaust towers) and numerous modernist and international-style buildings.
Less frequently selected by the students (2 out of 14 examples chosen for this study), suburban locations deliver additional information on how specific elements of a landscape’s composition are given a positive, neutral, or negative value in the individual’s perception. Like urban sites, historical landmark buildings are associated with assigning these elements a positive value. In cases where such objects do not exist, a positive dominant role is usually played by greenery, primarily solitary or rhythmically aligned trees (Figure 6a,b). Particular importance was attributed to the articulation of large trees, which create a rhythm in the panorama (Figure 6c). On the other hand, negative values in suburban locations are frequently given to buildings with low aesthetic quality or poorly maintained buildings (Figure 6d). The students usually identified agricultural land or meadows as a neutral foreground for a composition.
As a result of applying the landscape composition analysis and evaluation procedure to selected panoramas from various Poznań agglomeration locations, it could be observed that positive visual values are consistently attributed to heritage landmark buildings and frequently also to greenery. Since the study case method does not generalize such observations made for the specific examples analyzed, the second part of this research will seek to confirm or revise these results. It will be based on a survey answered by a broader group of experts (see also Section 2: Materials and Methods).

3.2. Landscape Evaluation Survey

The landscape evaluation survey used as a part of this research aimed to study, in a broader way, the mechanism for assigning visual values (positive, neutral, or negative) to specific elements of a landscape. The inquiry results were expected to confirm the observations made in the first part of the research or provide new assumptions. This step was necessary in order to assess whether the mechanisms observed in the preceding part of the study represent general rules of attributing visual values to specific elements of landscape composition.
The landscape evaluation survey consisted of 20 sections. Each of them contained one panorama and three questions. The images were shot in different seasons. In the first question, the respondents expressed their general impression of the landscape they saw (see also Section 2: Materials and Methods). In the next two questions, they were asked to name the elements they considered the landscape’s most positive assets (question 2) and most negative ones (question 3). The respondents were allowed complete freedom to define these elements in their own words, so as not to influence the survey results.
The survey was completed by 33 persons considered competent experts based on having completed courses on urban composition, greenery design, and landscape architecture. During these courses, they acquired both the knowledge and skills necessary to analyze landscape composition, distinguish different elements, and evaluate their impact on landscape perception. The number of responses is sufficient to perform a quantitative study, which was the target form of research for this part.
The survey results’ presentation follows the Delphi approach’s essential feature that verifies the respondents’ agreement on specific questions. The first issue to be discussed is their agreement on the overall visual quality of the selected examples of panoramas.

3.2.1. Experts’ Agreement Rate

Of the 20 panoramas surveyed, a compliance rate of above 50% was obtained for images with a high blue-green content (Figure 7, Figure 8, Figure 9, Figure 10, Figure 11, Figure 12, Figure 13, Figure 14, Figure 15, Figure 16 and Figure 17). The green-blue content was not calculated in percentage of the image surface, because the images were shot with different cameras and at different resolutions. Moreover, they were shot at different times of the year. As a result, the greenery is not always green, and the water surface is not always blue. For these reasons, the content of the panorama images was defined in a visual manner.
More specifically, all 9 out of the 20 panoramas rated by more than 50% of respondents as dominated by positive values contained a large amount of greenery in their composition, most recurrently in the form of a foreground (lawn) or a background (trees). They often had a water surface as their foreground. At the same time, responses other than “positive” for those detailed panoramas were more balanced. Namely, prevailing different reactions in these cases are either “conflict situation of positive and negative values” (5 of 9 cases) or “neither positive nor negative (neutral)” (2/9 cases). Hardly ever were “negative” values (opposite value) selected, but sometimes a mix of all possible alternative responses was observed (2/9 cases).
An agreement rate of more than 75% for overall positive perception was achieved for a mere three panoramas out of 20. One came from the urban area of Poznań city (Figure 7) and two others from its suburban zones (Figure 8 and Figure 9). The first example represented the metropolitan type of recreational greenery landscape from Poznań (Figure 7). It was dominated by surface water and greenery (mainly large trees), to which the respondents also assigned the most significant positive values. The two other examples were suburban landscapes containing few elements (Figure 8 and Figure 9). They consisted of greenery; landmark buildings (a church in the first and a palace in the second panorama); and, uniquely in the second case, surface water. Those three panoramas did not obtain any “negative” grades in the survey (Figure 10).
An agreement level for positive evaluation ranging between 50% and 75% was achieved mostly for cityscape or suburban panoramas that combine visible historical landmarks with greenery and other attributes—for example, surface water and residential and office buildings (Figure 11, Figure 12, and Figure 14). An interesting exception is Panorama No. 8 (Figure 13), which consists of a green foreground and a continuous mass of residential units.
In the open question section, respondents frequently mentioned historic buildings, greenery, and water as the essential positive assets. On the other hand, a negative role was usually assigned to communication and utility infrastructure, abandoned greenery fragments, and modernist architecture.
The suburban scenes that achieved a similar agreement result usually consisted of agricultural land, houses, and vegetation (e.g., Figure 15, Figure 16 and Figure 17). The respondents most frequently pointed to the natural content (fields, trees) as their central positive values. On the downside, they mentioned a lack of maintenance of some greenery parts and low-quality structures (e.g., garages, sheds).
The highest agreement rate for negative evaluation was slightly above 50%, and it applied to only one panorama (Figure 18 and Figure 19). The concerned panorama mainly consisted of modernist residential units, forming multiple planes in the perspective. It also had a dominant feature in the form of an exhaust chimney. The historic landmark buildings enclosed within this panorama, indicated by most of the respondents as positive values, were deprived of their dominant role. This situation resulted in an overall negative assessment of the panorama.
A similar compliance rate of slightly above 50% was achieved for another panorama (one example), indicated as having a conflict situation of positive and negative values (Figure 19 and Figure 20). The concerned panorama contained greenery (park) in the front and modernist housing blocks in the background. Greenery was unanimously indicated by the respondents as its positive attribute, while different housing block features (e.g., scale, materials, colors) were mentioned as creating negative values.
Finally, the lowest rate of expert agreement was achieved for the remaining nine panoramas (Figure 21, Figure 22, Figure 23, Figure 24, Figure 25, Figure 26, Figure 27, Figure 28 and Figure 29). All those images represent urban views with multiple types of visual elements—for example, historic and modern buildings of different forms and functions, historical and contemporary landmarks, infrastructure, exhaust chimneys, and advertisements. Their composition was complicated, while various elements were built into multiple planes. All but two panoramas (Figure 21 and Figure 29) in this group had relatively little greenery.
Taking a more complicated case, for example, Panorama No. 19 achieved a low expert agreement rate. This situation requires an in-depth analysis of experts’ answers to the questions. They indicate greenery, groups of trees, and new buildings as positive assets. At the same time, the negative value is given to badly maintained greenery in the foreground (weeds and bushes) and modernist buildings in the background. These results demonstrate how the seemingly same visual elements (greenery vs. greenery, buildings vs. buildings) can be perceived in the opposite ways. For this reason, the geographical approach to landscape visual assessment cannot be fully effective if not completed with the iconographic view.
The distribution of the ratings in this group covered all possible responses, without the apparent domination of one category (Figure 30). The most frequently quoted downsides were visual chaos, too much architectural diversity, a lack of order, improper maintenance, and monotony. Even though the panoramas in this group had less greenery in their overall image, green elements (e.g., trees, groups of trees) were frequently indicated by the respondents to create positive visual values (8 out of 9 cases). Secondly, positive visual values were identified in the historic buildings (3 out of 9) and modern architectural dominants (2 out of 9 cases).
The assumptions that can be drawn from this part of the survey include the following:
  • The simplicity of the composition has a positive effect on landscape visual evaluation based on its image (panorama);
  • A lower number of elements create panoramas that are simpler to perceive, making the landscape informative content more legible;
  • Cameral panorama views give less ambiguity of assessment than bird-eye views, which comprise more visual elements in the range of sight;
  • Green elements are of crucial importance for creating positive visual values in the cultural landscape of the study area (Poznań agglomeration), even in the winter season;
  • Historic landmarks create essential positive values;
  • The type of element alone does not determine positive or negative perception. Its state of maintenance is of equal importance;
  • Visual chaos or monotony bring positive perception down, as well as improper maintenance;
  • Clarity of composition is decisive in terms of assessing landscape values.

3.2.2. Recurrent Positive Values

The survey, which was designated to analyze the relationships between specific visual elements and the viewers’ positive or negative impressions, contained two open questions. The respondents directly named the most positive and negative assets. This form of open question was intended to minimize the risk of influencing the results. On the other end, however, this made it more complicated to present the results because the respondents often used different words to describe one concept. Therefore, this section presents a selection of the visual elements that were most recurrently indicated, often under different synonymous terms, by the respondents as the landscape’s essential positive assets.
The most recurrent elements credited with positive values fit under the common term of greenery. The word “greenery” itself appeared 419 times in the answers about the panoramas’ positive assets. The word “trees” appeared separately five times in the answers that did not indicate the general term “greenery”. In percentage terms, 64% of the responses mentioned “greenery” or “trees” as essential positive values.
The second most recurrent group of visual elements recognized by the respondents as positive was the built heritage. The word “church” appeared 63 times in the answers, “cathedral” was indicated 26 times, “palace” appeared 6 times, and the word “historic” appeared 58 times concerning the buildings. These add up to 153 mentions altogether, representing 23% of all responses. The lower representation of this category of elements in the overall survey results does not mean that it was less significant. While greenery was present, to a different extent, in all the panoramas, cultural heritage was less frequently present. Built heritage legibly appeared in 12 out of 20 panoramas. The total of 153 mentions compared to the number of responses for the 12 panoramas represents 39%.
Another frequently mentioned element was water. The words “water” and “water surface” appeared 110 times in the results regarding positive values. The term “river” appeared 39 times, also in combination with the river name Warta. The word “lake” appeared 5 times, also combined with the lake name “Malta”. Altogether, water was mentioned 154 times under different names. This represents 23% of all responses. Similar to the built heritage, water did not appear in every panorama. It was only present in nine of them. The total of 154 mentions related to the number of answers for the nine panoramas represents 52% of responses. Thus, for the panoramas which included water, 52% of the respondents mentioned it as being a positive asset in the landscape.
The survey results also show some less frequent but nonetheless interesting relationships. For example, one cityscape panorama (Figure 22) showed a recognizable area from downtown Poznań, with Poznań International Fair buildings and the Bałtyk office building designed by “MVRDV” architects. The results for this particular panorama mentioned the Bałtyk office building as its key positive element 15 times (45% of responses for this specific image). The Poznań International Fair complex’s architecture was indicated as representing positive value 12 times in 36% of responses. This situation suggests that new buildings of modern architectural expression can become positive spatial landmarks.
In summary, the survey results confirm that greenery and cultural built heritage create essential positive value in the landscape of Poznań agglomeration. The third attribute that appeared to impact the landscape’s positive evaluation significantly was water (Table 1). Knowledge about the positive impact of the attributes mentioned above on the landscape evaluation can be used both for visual protection purposes and to formulate design guidelines. It is also helpful for forecasting the visual perception of a specific landscape example. However, it must be highlighted that the clarity of composition, the legibility of its structure, and the state of maintenance also have a decisive influence on evaluation.

3.2.3. Recurrent Negative Values

The most recurrent negative elements, on the other hand, comprise two groups of visual elements relative to buildings and infrastructure and one group of visual properties representing the condition of some elements or entire panorama (Table 2). The group of infrastructure elements assigned a negative influence on the perception mainly contained chimneys or exhaust towers (84 mentions), cranes (17 mentions), and railway (14 mentions). The latter case is worth attention, as railway tracks were present in one panorama (Figure 22) and they were indicated as being negative by 42% of respondents (14 out of 33). Among different building types, which altogether received 168 negative mentions (25%), housing blocks can be distinguished. They were mentioned 85 times, which represents 13% of all responses. The group of properties can be subdivided into two parts. The words referring to the state of an overwhelming multitude, like, for example, “chaos”, “disorder”, or “colors” (i.e., multiple colors), appear 48 times in the results. In percentage terms, this represents 7% of all responses. The opposite condition, referred to as “monotony” or “grey color”, gained 12 responses, nearly 2%. It can be therefore observed that, in the study area, visual chaos is four times more frequently mentioned as a reason for negative assessment than monotony (Table 2).

4. Discussion

The survey results confirmed the main assumptions adopted in the process of applying the composition analysis procedure to selected panoramas, helping to minimize the subjectivity inherent in landscape evaluation. According to semiotic theory, the perception of any message depends as much on its actual content as it does on the receiver’s background [10,15,16]. The same also applies to the meaning contained within landscape structures. Therefore, landscape perception is filtered through an observer’s aesthetic appreciation [28], which usually retains individual or cultural features. The sight itself, as a sense, is in reality not treated with the risks of subjectivity, but the interpretations of what is seen are. Hence, subjectivity is a natural feature of landscape assessment. It is also inherent in the empiricism linked to survey and drawing. In this research, it is minimized due to the application of two methodologically diverse research stages. The work’s novelty is the improvement of the visual assessment method and its regionalization. By completing the visual approach with an expert inquiry, the research tries to solve the subjectivity issue, which is an inherent visual evaluation controversy.
The methodology presented in this article refers to the existing visual assessment methods deriving from the geographical paradigm (e.g., LCA, LPA, LVCA) by the principles it adopts in using human sight to assess physical aspects of the environment. However, it combines it with the semantic approach typical for iconography and aesthetics, placing attention on the values that we humans attach to landscapes. While most geographical approaches to landscape assessment are interested in describing its physiognomy, mapping different landscape types (e.g., LCA), or assessing the impact of the proposed development on the existing landscape (LVCA), this research identifies types of elements that are recurrently assigned positive visual value. This knowledge is essential in order to delineate areas to which particular attention should be given. Poland’s existing planning tactics protect landscape fragments considered particularly valuable (e.g., centers of old towns, UNESCO heritage sites, natural monuments), building a city’s recognizable image and bringing measurable benefits (e.g., in touristic competition). On the contrary, the ordinary cultural landscapes of suburbs and small towns are generally not protected. Considering how vast the areas covered with this landscape typology are, it is necessary to implement criteria-based selection principles. The landscape value assessment method presented in this paper can solve this problem. Instead of covering the entire scope of administrative units with landscape evaluation analysis, study areas can be delineated around specific objects recognized as potential positive qualities. According to the research results presented in this paper, such items include historical landmark buildings, built heritage objects, ordered complexes of high greenery, and surface water.
Consistent with these research results, the multidisciplinary interest in the problematics related to the built heritage as a part of the landscape identifies the need for its conservation [25,44] and points it out as an essential element of spatial identity [45,46,47]. Recently, its potential to bring significant image benefits in a comparative evaluation of urban public spaces has been noticed, distinguishing the historical urban fabric of a city as a value that guarantees “a distinctive atmosphere that attracts both residents and visitors” [45] (p. 17). The study results also confirm a relationship between the positive visual value and both the organizing and informative roles of heritage landmarks in the cityscape [46,47]. Another observation confirmed by the research results is that sacral landmarks, which refer more specifically to the cultural context of the study area by “highlighting the identity and memory of a place” [47] (p. 21), tend to have a particular bearing on the positive visual assessment of the landscape.
The presented study results also confirm the crucial role of architectural dominants, both sacral and secular, in landscape assessment [46,47] and evaluation. Characterized mainly by its scale and height and the fact that it usually interferes with the city’s silhouette by surpassing its “skyline” [48], a dominant is frequently embodied by a strong form in terms of composition [49]. Such specific elements (strong forms) are significant for both the perception and identification of places. As proved by Gyurkovich and supported with the Gestalt theory, strong architectural forms that help to integrate or crystalize the sequences of spaces in how they are perceived, remembered, and recognized by the users [49] (p. 173) are not necessarily historical. This statement finds its reflection in the results obtained for a cityscape panorama comprising the Poznań International Fair and the “Bałtyk” office building, which were identified as positive values (
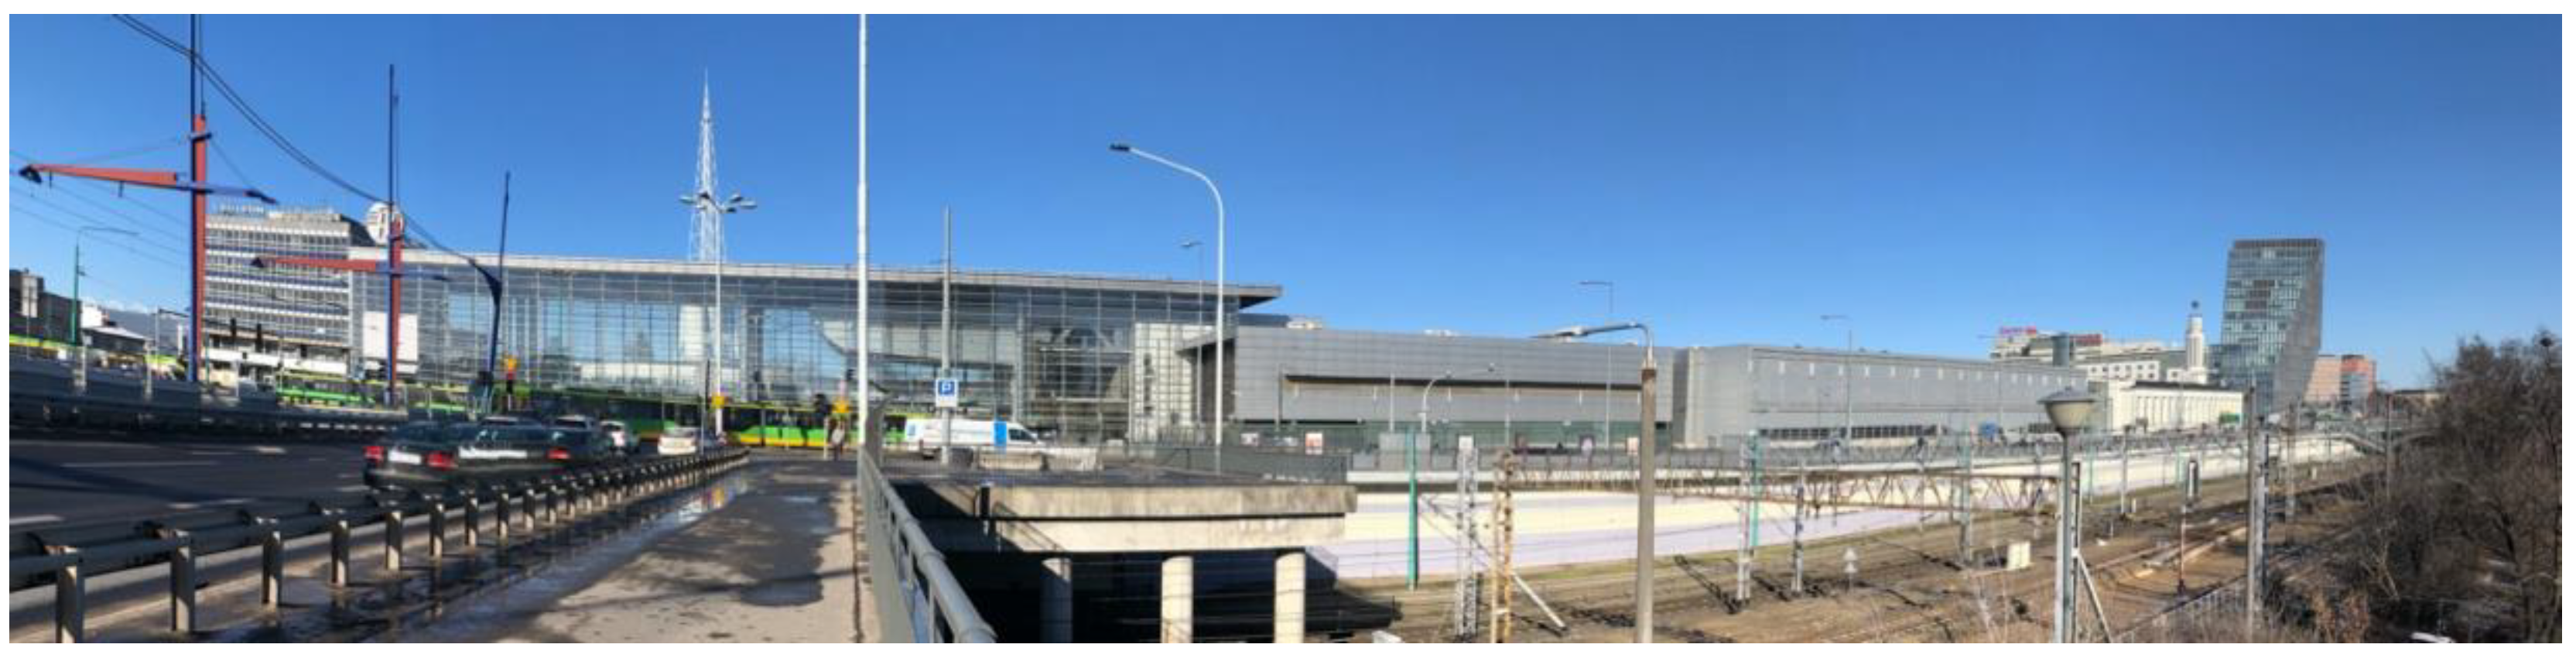
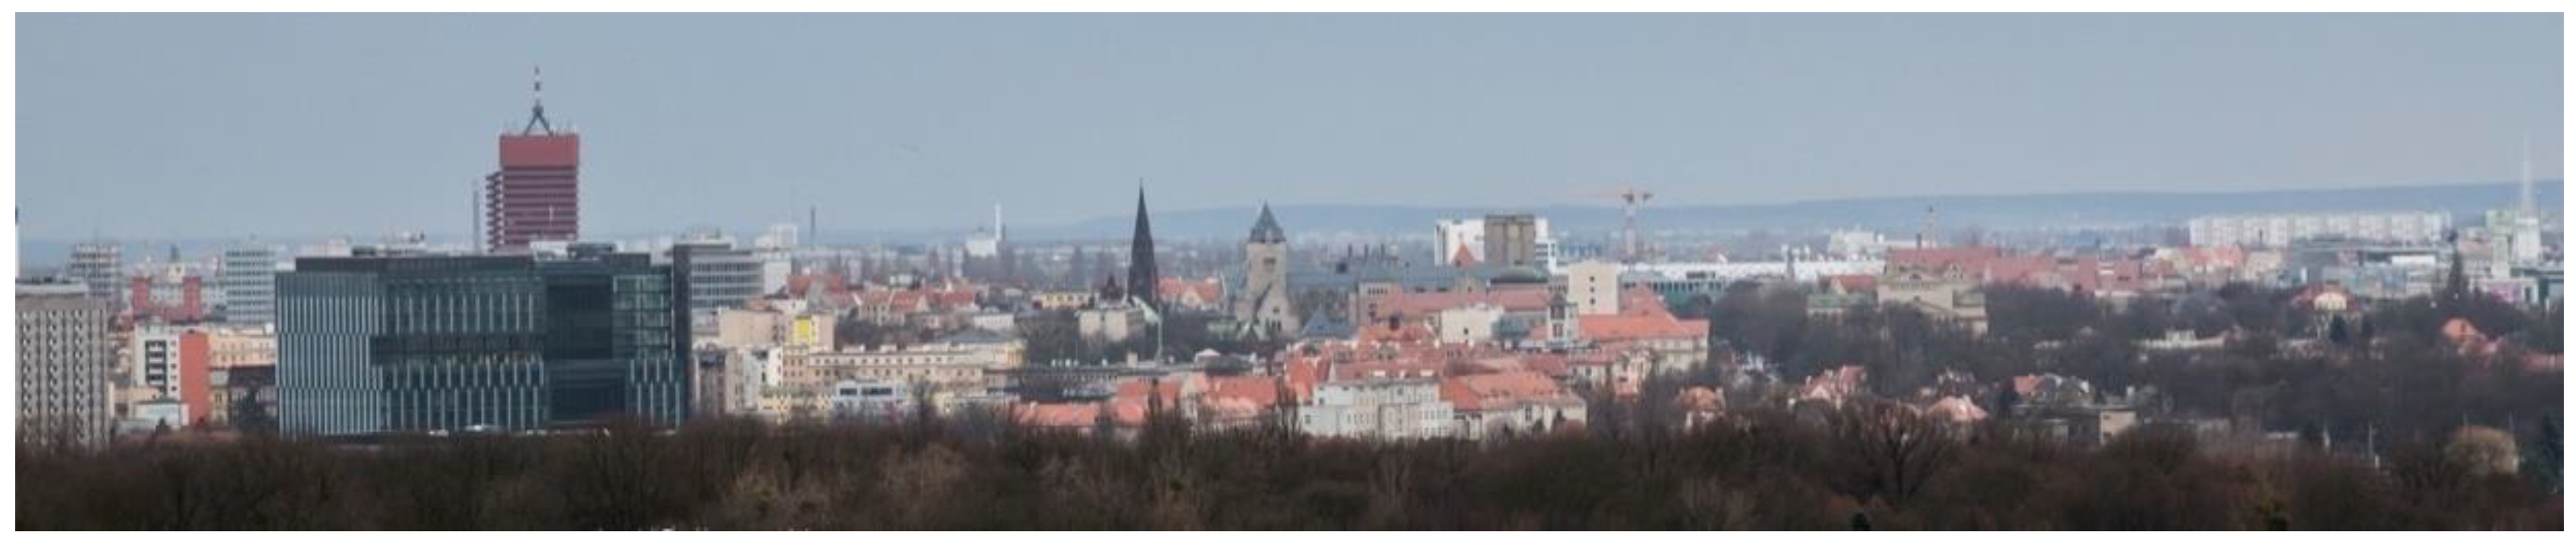
Figure 22). These observations indicate the necessity to broaden the scope of visual protection policies to comprise newer structures that are contemporarily becoming essential landmarks and will become cultural heritage for future generations.
The latter insight has bearing on what is presently considered the sustainable development approach. Currently, spatial development policies in the study region more frequently include guidelines regarding the visual protection of historical urban centers, as Graczyk strongly postulated [46]. However, the present policies tend to emphasize the “inside views” on the historical urban center, at the same time frequently forgetting about the “outside views”, which are equally significant in the perception of local identity [46] (pp. 183/184). “The places which are essential from the point of view of city identification have to be protected” [46] (p. 184). With this statement, Graczyk opens the discussion on what those places are in reality. This research, in particular the survey part, shows that such places include cultural heritage sites and valuable greenery complexes or units. Still, some contemporary architectural dominants are equally essential. A revision of the currently applied landscape management policies can hence be suggested to include modern landmarks.
In his assumptions made about the study area, which is also enclosed within the borders of the Poznań agglomeration, Graczyk stated that a “protective viewing zone for dominants should be created” [46] (p. 184). He also argued that architectural dominants’ substantial presence within the cityscape is a vital sign of sustainable landscape management. Therefore, it is necessary to protect the architectural dominants’ visibility also as part of sustainable development. However, contemporarily applied methods for designating visual protection zones tend to be reduced to studying “the visibility of objects in the field described by means of visibility diagrams and maps” [26] (p. 17) [46,50]. The research presented in this paper can add to the existing visual assessment studies by proposing a survey-based expert method to examine which specific local landscape type elements create essential positive values.
Another contribution that the presented research makes to the currently applied visual assessment methods is its regionalization scheme. As observers’ background and individually defined priorities affect how they perceive a landscape [10,28], visual assessment methods that are successful in one region may not bring awaited results in another one. This emphasizes the importance of a landscape evaluation survey carried out among local experts, which facilitates the identification of cultural priorities regarding the visual qualities in landscape specifically for a defined area of study. Inviting local experts as respondents is vital in order to avoid the deviations observed between residents’ and external experts’ responses regarding their value perceptions and preservation attitudes [51]. As observed by Yang, Qiu, and Fu, residents and professionals differ considerably in the effect of “value orientation, place attachment, and its relationship with landscape preservation” [51] (p. 11). The method presented in this paper aims to minimize this paradox by addressing the survey to local professionals. On the other hand, this consists of a limitation of the approach adopted. In the light of participatory planning, involving daily users in the evaluation of the environment they inhabit would increase the effectiveness of the process [52]. However, as shown by Yang, Qiu, and Fu, combining evaluations of experts together with daily users creates a considerable ambiguity in the results [51]. Therefore, the results of this study, delivered in the effect of using experts only, should constitute the starting point for the development of new tactics of involving local users in the planning practice. This responds to the recently identified need for developing new strategies and tactics for participatory planning in the contemporary public realm [53].
Another source of variation in responses regarding landscape character judgment can be linked to aesthetic preference [54]. As demonstrated by Wang, Zhao, and Liu, “landscape types have a significant influence on judgment consensus. We conclude that a clean environment with a high degree of vegetation normally implies high judgment consensus among observers” [54] (p. 216). This observation is also confirmed by the results of the presented study, in which the panoramas with a high vegetation content achieved a higher agreement rate among the survey respondents.
The problem of landscape evaluation objectivity, which reveals itself in all attempts to assess a landscape’s quality visually, inevitably lead the discussion towards Laurie’s definition in 1975 [28]. Namely, Laurie presented landscape evaluation as a process of assessing its visual quality by making comparisons between one or more landscapes [14,28,29]. The comparative approach is revealed in several studies sacrificed to landscape assessment. For example, an integrated comparative synthesis method was used by Graczyk [46] to assess the identifying role of architectural dominants in the context of small towns situated within the Poznań agglomeration. The idea of evaluating a landscape through a study of comparative relationships impacted the research presented in this article. Namely, making comparisons is enhanced by the number of panoramas included in the survey stage and their differentiation, despite representing one agglomeration area.
The comparative analysis was equally important in ascertaining that landscape evaluation is context-dependent. Similar to ecological ones, visual landscape indicators were demonstrated to be interpreted differently depending on the context [55]. In terms of landscape imageability, currently applied visual indicators include the presence of iconic elements or historic landmarks, particular viewpoints, and long views (panoramas), often with the significant presence of water bodies [55] (p. 941). The presence of surface water, reported as located at the intersection of ecological and visual indicators [55], was distinguished in the present survey as an element positively influencing landscape evaluation. This fact can be considered as proof that ecology is both perceived and appreciated as a part of landscape perception [55,56]. Because it has been suggested that knowledge and education enhance the appreciation of ecological aspects in landscape perception [55,57,58], it was also recommended that “further empirical studies, e.g., landscape preference studies should address the aesthetic appreciation linked to ecological function” [55] (p. 944). It was subsequently stated that “such empirical studies should test indicators across different landscape types and with different groups of observers” [55] (p. 944). The research presented in this paper answers this call by addressing the role of vital visual indicators within a delineated area of the Poznań agglomeration and is realized by a specified group of observers (architecture students). As previously suggested by existing studies [46,55], the presented research results confirm a correlation between the landscape’s visual attributes and the level of implementing sustainable development policies in terms of land management. For example, the exposition of historical landmarks and ordered greenery identified in the study as essential positive visual indicators of the landscape type under examination are both direct effects of a conscious and sustainable space management strategy. Tools enabling the ongoing control of spatial planning effects should constitute a substantial element of such an approach. Poland’s current spatial planning policy is not burdened with all the consequences of the decisions made. The failure of responsibility for the landscape’s visual quality does not act in its favor. It results in the lack of spatial cohesion, which is a major contemporary problem in the study area [59]. More importantly, the destruction of the landscape composition takes place systematically in the areas covered by active local plans, which demonstrates their low efficiency in the actual state.
The fact that the problem of landscape visual quality intersects with the concept of sustainability points to the importance of harmonious composition for the perception of a landscape’s ecological dimensions. The maintenance of specific relationships between visual elements of a landscape can be considered as a sign of sustainability. This emphasizes the importance of landscape visual analysis and survey study that is performed for a specific landscape type and regionally delineated, leading to the recognition of its most significant assets. This step is essential in identifying the composition elements and their place in the whole image. The informative content of particular elements, for example, dominants, cannot be recognized without analyzing their relationships with other scene components [37,46,48]. A visual balance must be achieved to maintain an appropriate level of relationships that define the landscape’s meaningful content. It can, therefore, be assumed that maintaining visual balance in the landscape should be part of any sustainable development strategy. Considering that the study results point to the built heritage and greenery as essential visual assets, such elements should gain more attention within this framework.
Elements of such a strategy resonate in the discussion on Poland’s contemporary housing environment that is currently underway. Gyurkovich recently observed that “elements of natural and cultural heritage that could aid in the correct shaping of the housing environment have only recently gained significance in Poland” [60] (p. 31). Further on, they demonstrate that these two groups of elements are fundamental in creating a public space with its own “spirit” or genius loci. The presented study brings this idea further to the agglomeration scale, aiming to distinguish types of landscape elements that create visually positive values at the entire public domain level. Including them in the local plans should be considered a role model in treating the landscape composition within any sustainable development strategy framework. Because sustainable development assumes integration of economic, environmental, and social aspects, solving problems requires various actions taken simultaneously in different fields [61]. Related mainly to the environmental part, the visual balance of a landscape may trigger reactions also on the social (e.g., wellbeing) and economic (e.g., tourist competition) levels.
Poland’s current spatial planning documents and tools still require improvement in order to guarantee sustainable development [62]. As recommended by Badach and Raszeja [63], the inclusion of selected landscape and greenspace indicators into the existing spatial planning instruments is necessary in order to develop a sustainable urban planning approach. This paper proposes including the visual evaluation tools it described and tested for the Poznań agglomeration area. Their implementation in the planning practice allows to (1) identify essential visual values characteristic of a specific landscape type (survey + landscape inventory and composition analysis) and (2) propose analytical tools to designate guidelines for their protection or enhancement (visual evaluation step).
The research results create precedence for elaborating a new landscape management strategy. It should follow the two points indicated above, creating two separate steps. In the first step, the landscape composition analysis method is applied to selected examples of the local landscape types in order to identify the most recurrent visual elements and their relations. This reproduces Section 3.1 of this research. In the effect, it helps to choose relevant panoramas that the survey should include. Then, the survey is set to confirm or revise the preliminary results. Reproducing Section 3.2, collecting and analyzing the survey results completes the first stage of the proposed landscape management policy. Once the first step is completed, the knowledge about the experts’ agreement rate and their responses to questions allow localizing places that need visual protection or enhancement.
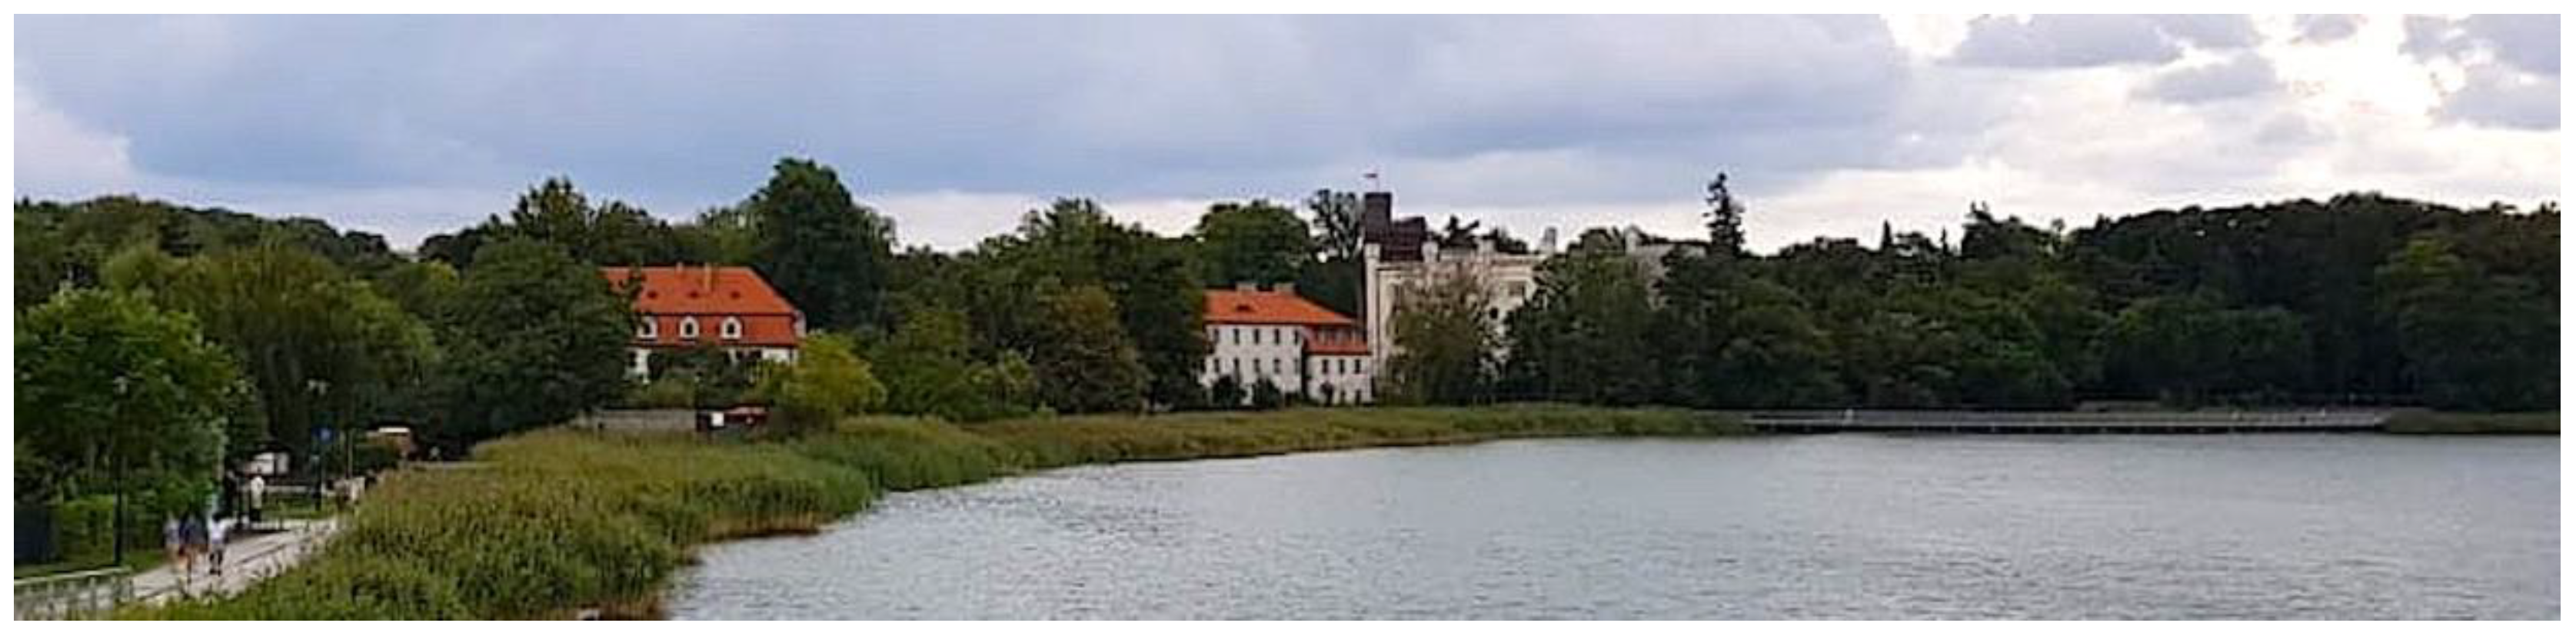
Taking the results of this study as an example, their direct application in the study area can be simulated. For instance, Panorama No. 20 (Figure 9) was evaluated positively in its existing state, which predestinates it directly for protection. Next, the results obtained for Panorama No. 17 (
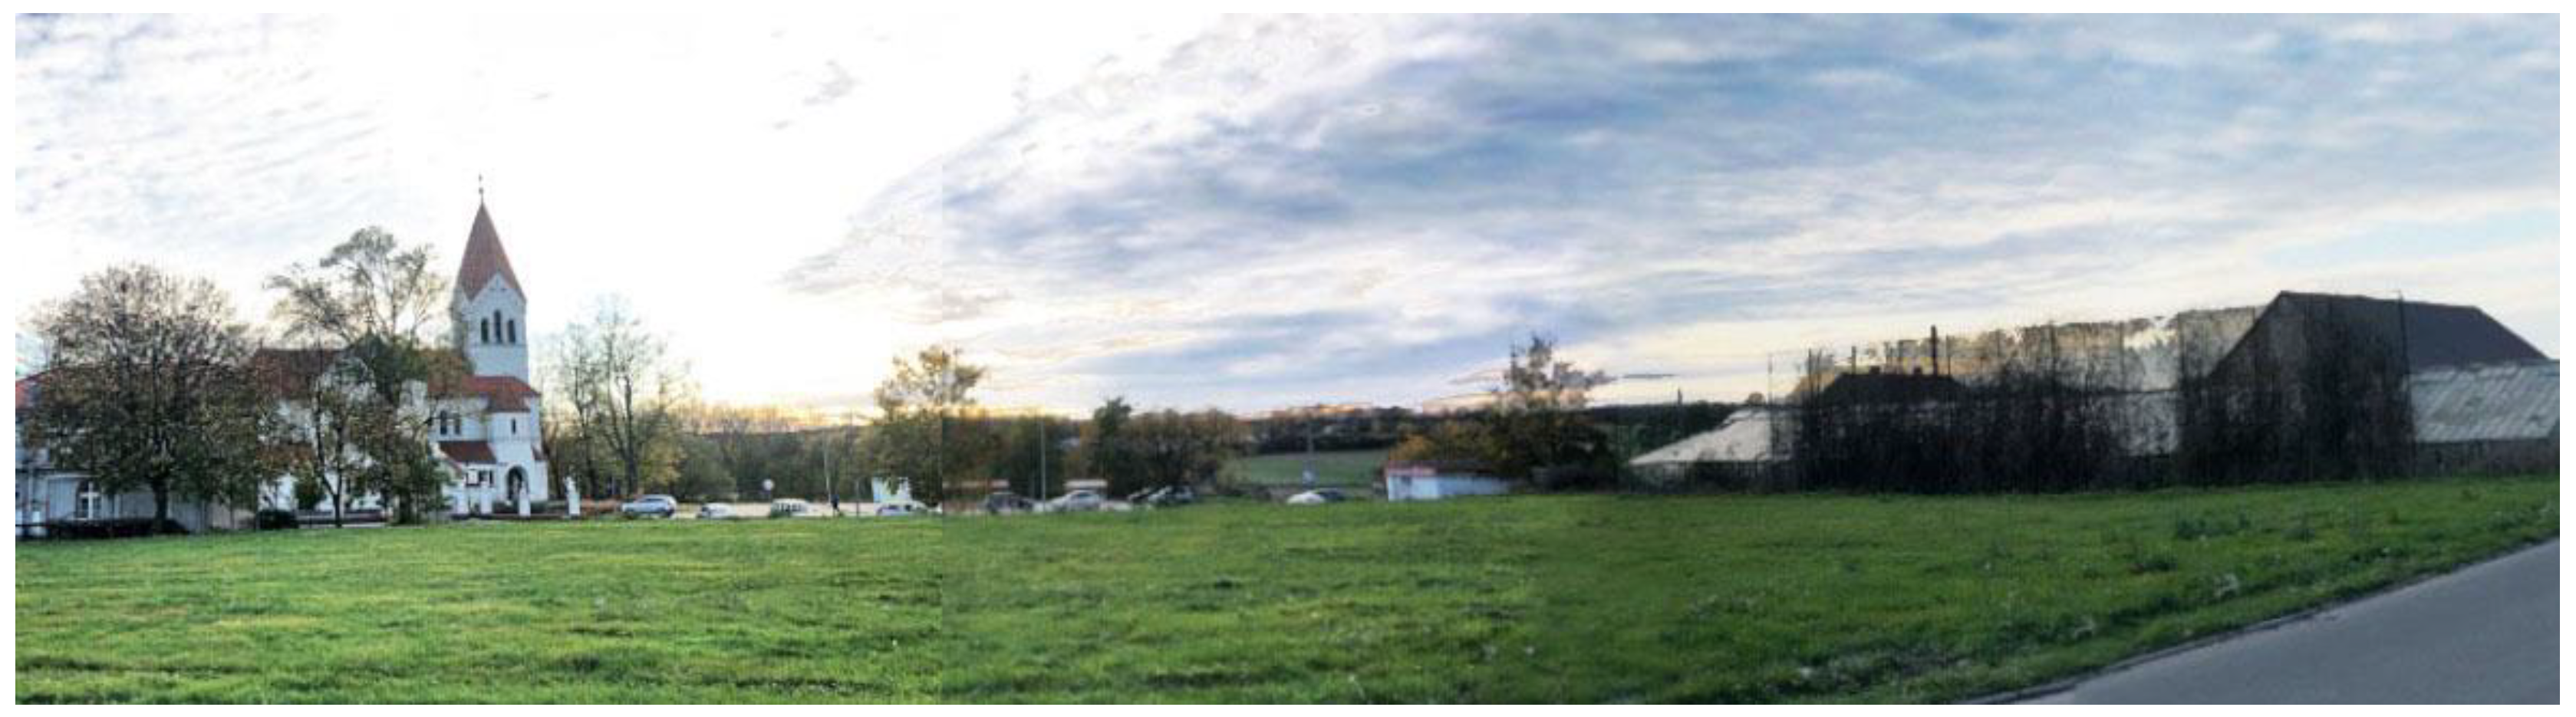
Figure 8), another example, indicate a conflict situation besides its generally positive reception. The landscape inventory, composition analysis, and evaluation tools should be used to analyze the situation and identify the source of conflict. The evaluation provides planning guidelines on how to fix the situation. A generalized strategy of incorporating the methodology tested in this study in the planning practice will be presented in the conclusions.

5. Conclusions

In this study, the key visually positive attributes of cultural landscapes were distinguished within the Poznań agglomeration area. They include four essential element types: cultural (built) heritage, landmarks, ordered greenery, and surface water. The results also showed that the clarity of composition and the limitation of elements’ number have a positive influence on landscape evaluation. Considered a sign of sustainable development, maintaining the visual balance at a proper level or enhancing it to achieve such a level should become a standard component of spatial development policies. Depending on the situation, visual balance protection and perfection scenarios should be included in regional development studies. This task can be accomplished through the following steps:
  • Include expert surveys in spatial development studies to identify key visual values of the local landscape type(s);
  • Include landscape analysis and evaluation within the framework of spatial development studies, which will allow us to identify specific views to be protected or revised (perfected) depending on the current situation;
  • Systematically involve participatory planning tools to socially validate the results of landscape analysis and evaluation done by experts;
  • Set policies of visual balance protection or perfection—for example, by banning development in certain places or setting specific requirements regarding architecture and finishing materials;
  • Require local plans to realize the policies mentioned above;
  • Introduce a system for the ongoing monitoring of the effects of spatial policy and responsibility for decisions made.
From these six steps, the step 1 and 2 are direct applications of the methodology tested in this study.
We should also address greenery’s influence on a landscape scene’s positive assessment. Considering that the landscape panoramas characterized by a high vegetation content achieved higher levels of expert agreement in this survey study, the potential of greenery to improve visual balance should be rethought. Greenery can be considered as a fabric to create an exceptionally efficient background that will help the viewer focus on the informative landscape content (landmarks). Many visual conflict situations can be fixed with the proper use of greenery. At the same time, the study showed that greenery maintenance is vital for positive landscape perception.
Finally, the notion of the landmark within the landscape needs to be broadened. As demonstrated by this survey, positive values within the cultural landscapes in the Poznań agglomeration were in large part created by historic buildings (built heritage), but not exclusively. The experts recognized some new architectural dominants as creating positive values as well. The definition of the cultural (built) heritage in landscape studies should thus also comprise more recent structures that will presumably become landmarks for future generations. Expert surveys with open questions, like the one used in this study, provide the possibility to identify such elements. Following their identification as landmarks, such elements should then be placed under the same visual protection or enhancement policy procedures.

Author Contributions

Conceptualization, M.G. and M.P.; methodology, M.G. and M.P.; formal analysis, M.P.; investigation, M.G. and M.P.; resources, M.G. and M.P.; data curation, M.P.; writing—original draft preparation, M.P.; writing—review and editing, M.G. and M.P.; visualization, M.P.; supervision, M.G.; funding acquisition, M.G. and M.P. All authors have read and agreed to the published version of the manuscript.

Funding

This research was funded from statutory funds of the Poznań University of Technology, Faculty of Architecture. Funds numbers: 0111/SBAD/0406 and 0111/SBAD/2116.

Institutional Review Board Statement

Not applicable.

Informed Consent Statement

Not applicable.

Data Availability Statement

Data sharing not applicable.

Acknowledgments

The authors express their gratitude to the students for participating in the study by (1) taking part in the survey, (2) realizing landscape composition analyses, and (3) giving permission for the use of their graphic materials to illustrate the paper. The authors also thank the photographer Radosław Żyto for his consent to use his images in the study and publication. The authors express their gratitude to the reviewers, whose remarks and suggestions have helped to improve the work.

Conflicts of Interest

The authors declare no conflict of interest.

References

  1. European Landscape Convention, European Treaty Series—No. 176, Council of Europe, Florence (2000). Available online: https://rm.coe.int/1680080621 (accessed on 26 June 2020).
  2. Antrop, M. Geography and landscape science. Belg. Rev. Belge Géographie 2000, 30, 9–36. [Google Scholar] [CrossRef] [Green Version]
  3. Vidal de La Blache, P. Principes de Géographie Humaine: Publiés d’après les Manuscrits de l’auteur par Emmanuel de Martonne; ENS Édition: Lyon, France, 2015. [Google Scholar]
  4. Castree, N.; Demeritt, D.; Liverman, D. Introduction: Making sense of environmental geography. In A Companion to Environmental Geography; Castree, N., Demeritt, D., Liverman, D., Rhoads, B., Eds.; Wiley-Blackwell: West Sussex, UK, 2009; pp. 1–15. [Google Scholar] [CrossRef] [Green Version]
  5. Franch-Pardo, I.; Napoletano, B.M.; Bocco, G.; Barrasa, S.; Cancer-Pomar, L. The Role of Geographical Landscape Studies for Sustainable Territorial Planning. Sustainability 2017, 9, 2123. [Google Scholar] [CrossRef] [Green Version]
  6. Zonneveld, I.S. Land Ecology: An Introduction to Landscape Ecology as a Base for Land Evaluation, Land Management and Conservation; SPB Academic Publishing: Amsterdam, The Netherlands, 1995; p. 199. [Google Scholar]
  7. Antrop, M. Sustainable landscapes: Contradiction, fiction or utopia? Landsc. Urban Plan. 2006, 75, 187–197. [Google Scholar] [CrossRef]
  8. Bonenberg, W.; Zierke, P. Dobra Kultury Współczesnej Jako Element Krajobrazu Powiatu Poznańskiego (en. Contemporary Cultural goods as an Element of the Landscape of the Poznań County); Poznań University of Technology: Poznań, Poland, 2014; p. 245. [Google Scholar]
  9. Kobayashi, A. A Critique of Dialectical Landscape. In Remaking Human Geography (RLE Social & Cultural Geography), 1st ed.; Kobayashi, A., Mackenzie, S., Eds.; Routledge: London, UK, 1989; pp. 164–185. [Google Scholar] [CrossRef]
  10. Raaphorst, K.; Duchhart, I.; van der Knaap, W.; Roeleveld, G.; van der Brink, A. The semiotics of landscape design communication: Towards a critical visual research approach in landscape architecture. Landsc. Res. 2017, 42, 120–133. [Google Scholar] [CrossRef] [Green Version]
  11. Cosgrove, D.F. Social Formation and Symbolic Landscape, 2nd ed.; The University of Wisconsin Press: Madison, WI, USA, 1998; p. 332. [Google Scholar]
  12. Daniels, S.; Cosgrove, D. Introduction: Iconography and landscape. In The Iconography of Landscape: Essays on the Symbolic Representation, Design and Use of Past Environments, 1st ed.; Cosgrove, D., Daniels, S., Eds.; Cambridge University Press: Cambridge, UK, 1988; pp. 1–10. [Google Scholar]
  13. Appleton, J. The Experience of Landscape, 2nd ed.; John Wiley and Sons Ltd.: Chichester, UK, 1996; p. 296. [Google Scholar]
  14. Muir, R. Approaches to Landscape; Palgrave: London, UK, 1999; p. 336. [Google Scholar] [CrossRef] [Green Version]
  15. de Saussure, F. Cours de Linguistique Générale; Payot: Paris, France, 1983; p. 509. [Google Scholar]
  16. Barthes, R. Rhetoric of the Image. In Image, Music, Text; Heath, S., Ed.; Hill and Wang: New York, NY, USA, 1977; pp. 32–51. [Google Scholar]
  17. Eco, U. Function and Sign: Semiotics of Architecture. In The City and the Sign. An Introduction to Urban Semiotics, 1st ed.; Gottdiener, M., Lagopoulos, A., Eds.; Columbia University Press: New York, NY, USA, 1986; pp. 55–86. [Google Scholar] [CrossRef]
  18. Forman, R.T. Land Mosaics: The Ecology of Landscapes and Regions, 1st ed.; Cambridge University Press: Cambridge, UK, 1995; p. 656. [Google Scholar]
  19. Kant, I. The Critique of Pure Reason; Guyer, P., Wood, A.W., Eds.; Cambridge University Press: Cambridge, UK, 1998; p. 785. [Google Scholar]
  20. Husserl, E. The Idea of Phenomenology, 1st ed.; Hardy, L., Ed.; Husserliana: Edmund Husserl—Collected Works; Springer: Dordrecht, The Netherlands, 1999; Volume 8, p. VI 72. [Google Scholar]
  21. Heidegger, M. Basic Writings, Routledge, 1st ed.; Routledge: Abingdon, UK, 1978; p. 392. [Google Scholar]
  22. Norberg-Schulz, C.H. Genius Loci. Paysage, Ambiance, Architecture, 3rd ed.; Seyler, O., Ed.; Mardaga éditions: Brussels, Belgium, 1997; p. 216. [Google Scholar]
  23. Pieczara, M. An architecture course to teach respect for the landscape. World Trans. Eng. Technol. Educ. 2020, 18, 450–455. [Google Scholar]
  24. Górka, A. Landscape perception and the teaching of it in Poland. World Trans. Eng. Technol. Educ. 2020, 18, 124–128. [Google Scholar]
  25. Serraino, M.; Lucchi, E. Energy Efficiency, Heritage Conservation, and Landscape Integration: The Case Study of the San Martino Castle in Parella (Turin, Italy). Energy Procedia 2017, 133, 424–434. [Google Scholar] [CrossRef]
  26. Górka, A. Visual Capacity Assessment of the Open Landscape in Terms of Protection and Shaping: Case Study of a Village in Poland. Sustainability 2020, 12, 6319. [Google Scholar] [CrossRef]
  27. Swanwick, C.; Fairclough, G. Landscape character: Experience from Britain. In Routledge Handbook of Landscape Character Assessment. Current Approaches to Characterization and Assessment, 1st ed.; Fairclough, G., Sarlöv, H.J., Swanwick, C., Eds.; Routledge: London, UK, 2018; pp. 21–36. Available online: https://www.taylorfrancis.com/books/e/9781315753423 (accessed on 2 February 2021).
  28. Laurie, M. An Introduction to Landscape Architecture, 1st ed.; American Elsevier Publishing Company: New York, NY, USA, 1975; p. 214. [Google Scholar]
  29. Zube, E.H.; Brush, R.O. Landscape Assessment: Values, Perceptions and Resources, 1st ed.; Zube, E.H., Brush, R.O., Fabos, J.G., Eds.; Dowden, Hutchinson & Ross: Stroudsburg, PA, USA, 1975; p. 367. [Google Scholar]
  30. Cosgrove, D. Prospect, perspective and the evolution of the landscape idea. Trans. Inst. Br. Geogr. 1985, 10, 45–62. [Google Scholar] [CrossRef]
  31. Antrop, M.; Van Eetvelde, V. Approaches in Landscape Research. In Landscape Perspectives. Landscape Series; Springer: Dordrecht, The Netherlands, 2017; Volume 23, pp. 61–80. [Google Scholar] [CrossRef]
  32. Daniel, T.C. Whither scenic beauty? Visual landscape quality assessment in the 21st century. Landsc. Urban Plan. 2001, 54, 267–281. [Google Scholar] [CrossRef]
  33. Bürgi, M.; Ali, P.; Chowdhury, A.; Heinimann, A.; Hett, C.; Kienast, F.; Mondal, M.K.; Upreti, B.R.; Verburg, P.H. Integrated Landscape Approach: Closing the Gap between Theory and Application. Sustainability 2017, 9, 1371. [Google Scholar] [CrossRef] [Green Version]
  34. Bogdanowski, J. Kompozycja i Planowanie w Architekturze Krajobrazu (en. Composition and Planning in Landscape Architecture), 1st ed.; Zakład Narodowy im. Ossolińskich: Wrocław, Poland, 1976. [Google Scholar]
  35. Bogdanowski, J. Metoda Jednostek i Wnętrz Architektoniczno-Krajobrazowych (JARK-WAK) w Studiach i Projektowaniu (en. The Units and Rooms Method (JARK-WAK) in Studies and Design), 2nd ed.; Cracow University of Technology: Cracow, Poland, 1990; p. 36. [Google Scholar]
  36. Lynch, K. The Image of the City, 1st ed.; The MIT Press: Cambridge, MA, USA, 1960; p. 194. [Google Scholar]
  37. Bell, S. Elements of Visual Design in the Landscape, 2nd ed.; Spon Press: London, UK, 2004; p. 230. [Google Scholar]
  38. Smardon, R.C.; Palmer, J.F.; Felleman, J.P. (Eds.) Foundations for Visual Analysis, 1st ed.; Wiley-Interscience: New York, NY, USA, 1986; p. 374. [Google Scholar]
  39. Wejchert, K. Elementy Kompozycji Urbanistycznej (en. Elements of Urban Composition); Arkady: Warsaw, Poland, 1984; p. 280. [Google Scholar]
  40. Zachariasz, A. Landscape architecture, landscape composition and specialist vocabulary—Preliminary considerations. Diss. Cult. Landsc. Comm. 2016, 32, 11–29. [Google Scholar]
  41. Böhm, A. Planowanie Przestrzenne dla Architektów Krajobrazu: O Czynniku Kompozycji: Podręcznik dla Studentów Wyższych Szkół technicznych (en. Spatial Planning for Landscape Architects: About the Composition Factor: A Textbook for Students of Technical Universities), 1st ed.; Cracow University of Technology: Cracow, Poland, 2006; p. 324. [Google Scholar]
  42. Garson, G.D. The Delphi method in Quantitative Research; Statistical Associates Publishers: Asheboro, NC, USA, 2014; p. 38. [Google Scholar]
  43. Wang, V.C.X. Handbook of Research on Scholarly Publishing and Research Methods, 1st ed.; Wang, V.C.X., Ed.; Information Science Reference IGI Global: Hershey, PA, USA, 2015; p. 589. [Google Scholar]
  44. European Committee for Standardization (CEN). Conservation of cultural heritage. Guidelines for Improving the Energy Performance of Historic Buildings, Standard FprEN 16883; CEN: Brussels, Belgium, 2017. [Google Scholar]
  45. Zagroba, M.; Szczepańska, A.; Senetra, A. Analysis and Evaluation of Historical Public Spaces in Small Towns in the Polish Region of Warmia. Sustainability 2020, 12, 8356. [Google Scholar] [CrossRef]
  46. Graczyk, R. Identyfikacyjna Funkcja Dominanty Architektonicznej w Strukturze Małego Miasta (en. Identifying Function of an Architectural Dominant in the Structure of a Small Town), 1st ed.; Poznań University of Technology: Poznań, Poland, 2015; p. 202. [Google Scholar]
  47. Hodor, K.; Fekete, A. The sacred in the landscape of the city. Tech. Trans. 2019, 116, 15–22. [Google Scholar] [CrossRef]
  48. Ozimek, A. Landscape dominant ELEMENT—An attempt to parametrize the concept. Tech. Trans. 2019, 116, 35–62. [Google Scholar] [CrossRef] [Green Version]
  49. Gyurkovich, J. Znaczenie form Charakterystycznych dla Kształtowania i Percepcji Przestrzeni: Wybrane Zagadnienia Kompozycji w Architekturze i Urbanistyce (en. The importance of Characteristic Forms for the Shaping and Perception of Space: Selected Issues of Composition in Architecture and Urban Planning), 1st ed.; Cracow University of Technology: Cracow, Poland, 1999; p. 216. [Google Scholar]
  50. Ozimek, A. Landscape Measure. Objectification of Views and Panoramas Assessment Supported by Computer Tools, 1st ed.; Cracow University of Technology: Cracow, Poland, 2019. [Google Scholar]
  51. Yang, H.; Qiu, L.; Fu, X. Toward Cultural Heritage Sustainability through Participatory Planning Based on Investigation of the Value Perceptions and Preservation Attitudes: Qing Mu Chuan, China. Sustainability 2021, 13, 1171. [Google Scholar] [CrossRef]
  52. Smith, R.W. A theoretical basis for participatory planning. Policy Sci. 1973, 4, 275–295. [Google Scholar] [CrossRef]
  53. Lodato, T.; DiSalvo, C. Institutional constraints: The forms and limits of participatory design in the public realm. In Proceedings of the 15th Participatory Design Conference: Full Papers—Volume 1 (PDC ‘18); Association for Computing Machinery: New York, NY, USA, 2018; pp. 1–12. [Google Scholar] [CrossRef]
  54. Wang, R.; Zhao, J.; Liu, Z. Consensus in visual preferences: The effects of aesthetic quality and landscape types. Urban For. Urban Green. 2016, 20, 210–217. [Google Scholar] [CrossRef]
  55. Fry, G.; Tveit, M.S.; Ode, Å.; Velarde, M.D. The ecology of visual landscapes: Exploring the conceptual common ground of visual and ecological landscape indicators. Ecol. Indic. 2009, 9, 933–947. [Google Scholar] [CrossRef]
  56. Gobster, P.H.; Nassauer, J.I.; Daniel, T.C.; Fry, G. The shared landscape: What does aesthetics have to do with ecology? Landsc. Ecol. 2007, 22, 959–972. [Google Scholar] [CrossRef]
  57. Fudge, R.S. Imagination and the science-based aesthetic appreciation of unscenic nature. J. Aesthet. Art Crit. 2001, 59, 275–285. [Google Scholar] [CrossRef]
  58. Matthews, P. Scientific knowledge and the aesthetic appreciation of nature. J. Aesthet. Art Crit. 2002, 60, 37–48. [Google Scholar] [CrossRef]
  59. Kołata, J.; Zierke, P. Assessment of spatial cohesion in suburban areas based on physical characteristics of buildings. Ann. Warsaw Univ. Life Sci. SGGW Horticult. Landsc. Architect. 2020, 41, 37–49. [Google Scholar] [CrossRef]
  60. Gyurkovich, M.; Gyurkovich, J. New Housing Complexes in Post-Industrial Areas in City Centres in Poland Versus Cultural and Natural Heritage Protection—With a Particular Focus on Cracow. Sustainability 2021, 13, 418. [Google Scholar] [CrossRef]
  61. Chruscinski, J.; Kazak, J.K.; Tokarczyk-Dorociak, K.; Szewranski, S.Z.; Swiader, M. How to Support Better Decision Making for Sustainable Development? IOP Conf. Ser. Mater. Sci. Eng. 2019, 471, 112008. [Google Scholar] [CrossRef]
  62. Broża, N.; Birnbaum, K.; Garcia Castro, D.; Kazak, J.K. Spatial Absorbency Assessment for Sustainable Land Development. Geomat. Environ. Eng. 2020, 14, 5. [Google Scholar] [CrossRef]
  63. Badach, J.; Raszeja, E. Developing a Framework for the Implementation of Landscape and Greenspace Indicators in Sustainable Urban Planning. Waterfront Landscape Management: Case Studies in Gdańsk, Poznań and Bristol. Sustainability 2019, 11, 2291. [Google Scholar] [CrossRef] [Green Version]
Figure 1. Landscape composition analysis method. Application example for an interior view: (a) definition of basic elements of a landscape interior and their relations. This landscape interior is defined as elongated, concrete, open, and simple; (b) Further analysis of rhythm, articulation, and lines leading the viewer’s sight. Illustration author: Kacprzyk, M., PUT (Poznań University of Technology) 2021.
Sustainability 13 04185 g001
Figure 2. Landscape composition analysis applied to a panorama: (a) A belltower is identified as the main positive dominant, while the old warehouse structure (a ruin) is attributed to a negative value. An accent is a brick building, which distinguishes itself against the background due to its color. The surface of the Warta river forms the foreground. (b) Evaluation of the panorama is a consequence of the analysis step. The positive dominant is pointed as an element to be exposed (“w”), the negative dominant to be removed (“x”). It is also suggested to mask the accent (“m”) and to unify the background (“u”). Greenery and water foreground are marked as positive content to be maintained. Illustration authors: Janczak, Sz.; Guzicka, N.; Plota, A. PUT, 2020.
Sustainability 13 04185 g002
Figure 3. A graphic scheme explaining the research organization and the link between its two stages. Own elaboration.
Sustainability 13 04185 g003
Figure 4. Example of complete landscape analysis with (a) inventory, composition analysis, and evaluation stages; (b) softness (green line) and hardness (red line) assessment. Illustration authors: Marciniak, W.; Łoniewska H. PUT, 2020.
Sustainability 13 04185 g004
Figure 5. Example of a landscape analysis with (a) inventory and composition analysis; (b) evaluation; (c) improvement guidelines. Illustration authors: Kulikowski, T.; Tabert, D.; Strymer, K. PUT, 2020.
Sustainability 13 04185 g005aSustainability 13 04185 g005b
Figure 6. Example of suburban panorama analysis: (a) composition analysis; (b) composition analysis in freehand drawing version; (c) articulation; (d) improvement guidelines. Illustration author: Kacprzyk, M. PUT 2020.
Sustainability 13 04185 g006
Figure 7. Panorama of Malta lake, Poznań. Panorama No. 4 in the survey. Viewpoint location: N 52.40266464803816, E 16.961630012717553. Photo: Bossy, A. PUT, 2019.
Sustainability 13 04185 g007
Figure 8. Panorama of Wiry. Panorama No. 17 in the survey. Viewpoint location: N 52.32180136588434, E 16.852350540368725. Photo: Michałowska, W. PUT, 2020.
Sustainability 13 04185 g008
Figure 9. Panorama over Kórnik lake near Poznań. Panorama No. 20 in the survey. Viewpoint location: N 52.24728286088842, E 17.08538305507003. Photo: Pieczara, M. 2018.
Sustainability 13 04185 g009
Figure 10. Experts’ agreement rate graphs for the three most positively (>75%) evaluated panoramas. Own elaboration.
Sustainability 13 04185 g010
Figure 11. Panorama of Poznań. Panorama No. 1 in the survey. Viewpoint location: N 52.41060889253612, E 16.945173460522557. Photo: Pieczara, M. 2021.
Sustainability 13 04185 g011
Figure 12. Panorama of Poznań. Panorama No. 2 in the survey. Viewpoint location: N 52.413583890398286, E 16.94125026984746. Photo: Loos, E., Maćkowska, N. PUT, 2020.
Sustainability 13 04185 g012
Figure 13. Panorama of Poznań. Panorama No. 8 in the survey. Viewpoint location: N 52.4853225265442, E 16.90479324172883. Photo: Gyurkovich, M. 2021.
Sustainability 13 04185 g013
Figure 14. Panorama of Poznań over Malta lake. Panorama No. 18 in the survey. Viewpoint location: N 52.40107259667871, E 16.98750308423139. Photo: Sznura, S. PUT, 2019.
Sustainability 13 04185 g014
Figure 15. Example of a suburban panorama. Panorama No. 15 in the survey. Photo: Kacprzyk, M. PUT, 2020.
Sustainability 13 04185 g015
Figure 16. Example of a suburban panorama in Skórzewo. Panorama No. 16 in the survey. Viewpoint location: N 52.39104071303244, E 16.776569078162602. Photo: Kasińska-Andruszkiewicz, A. 2021. For this location, the survey used a Google Street View image that was shot in the spring season: https://goo.gl/maps/wSWYhaqz1mhySWFj8, accessed on 27 March 2021.
Sustainability 13 04185 g016
Figure 17. Experts’ agreement rate graphs for panoramas evaluated positively by 50–75% of respondents. Own elaboration.
Sustainability 13 04185 g017
Figure 18. Panorama of Poznań from Winogrady. Panorama No. 10 in the survey. Image curtesy: fot. Radosław Żyto, www.fotokedar.pl. Available online: https://epoznan.pl/news-news-54545-panorama_poznania_z_winograd_zobacz_zdjecia (accessed on 8 April 2021)
Sustainability 13 04185 g018
Figure 19. Experts’ agreement rate graphs for panoramas evaluated negatively (left) and conflictingly (right) by more than 50% of respondents. Own elaboration.
Sustainability 13 04185 g019
Figure 20. Piastowskie District in Poznan. Panorama No. 7 in the survey. Image curtesy: MOs810 CC BY-SA 4.0. Available online: https://upload.wikimedia.org/wikipedia/commons/b/bd/Piastowskie_Distr._Poznan.jpg (accessed on 8 April 2021)
Sustainability 13 04185 g020
Figure 21. Panorama from Dębiński Bridge in Poznań. Panorama No. 3 in the survey. Viewpoint location: N 52.36817652005035, E 16.928234475123023. Photo: Pieczara, M. 2021.
Sustainability 13 04185 g021
Figure 22. Panorama from Dworcowy Bridge, Poznań. Panorama 5 in the survey. Viewpoint location: N 52.40354002563637, E 16.911933353709713. “Bałtyk” office building designed by “MVRDV” architects on the extreme right. Photo: Pieczara, M. 2021.
Sustainability 13 04185 g022
Figure 23. Panorama from Queen Jadwiga Bridge, Poznań. Panorama No. 6 in the survey. Viewpoint location: N 52.398662696245225, E 16.940504605550498. Photo: Pieczara, M. 2021.
Sustainability 13 04185 g023
Figure 24. Panorama of Poznań downtown. Panorama No. 9 in the survey. Image curtesy: fot. Radosław Żyto, www.fotokedar.pl. Available online: https://epoznan.pl/news-news-54545-panorama_poznania_z_winograd_zobacz_zdjecia (accessed on 8 April 2021)
Sustainability 13 04185 g024
Figure 25. Panorama of Poznań, western part of the city. Panorama No. 11 in the survey. Image curtesy: fot. Radosław Żyto, www.fotokedar.pl. Available online: https://epoznan.pl/news-news-54545-panorama_poznania_z_winograd_zobacz_zdjecia (accessed on 8 April 2021)
Sustainability 13 04185 g025
Figure 26. Panorama of Poznań, western side of the city. Panorama No. 12 in the survey. Image curtesy: fot. Radosław Żyto, www.fotokedar.pl. Available online: https://epoznan.pl/news-news-54545-panorama_poznania_z_winograd_zobacz_zdjecia (accessed on 8 April 2021)
Sustainability 13 04185 g026
Figure 27. Panorama of Poznań, residential districts. Panorama No. 13 in the survey. Image curtesy: fot. Radosław Żyto, www.fotokedar.pl. Available online: https://epoznan.pl/news-news-54545-panorama_poznania_z_winograd_zobacz_zdjecia (accessed on 8 April 2021)
Sustainability 13 04185 g027
Figure 28. Panorama of Poznań city center seen from Winogrady. Panorama No. 14 in the survey. Image curtesy: fot. Radosław Żyto, www.fotokedar.pl. Available online: https://epoznan.pl/news-news-54545-panorama_poznania_z_winograd_zobacz_zdjecia (accessed on 8 April 2021)
Sustainability 13 04185 g028
Figure 29. Panorama of PUT campus, seen over the Warta river. Panorama No. 19 in the survey. Viewpoint location: N 52.405428087025406, E 16.945422813277442. Photo: Pieczara, M. 2021.
Sustainability 13 04185 g029
Figure 30. Expert agreement rate graphs for the nine least compliant panoramas. Own elaboration.
Sustainability 13 04185 g030
Table 1. Visual elements creating positive values in the landscape of Poznań agglomeration. Own elaboration.
Type of ElementsElement NameMentions No.Percentage
of All Responses
Greenerygreenery, trees,
green foreground,
green background
42464
Built heritagehistorical buildings, church, cathedral, palace15323 1
Waterwater, water surface, river (also: Warta river), lake (also: Malta lake)15423 2
1 Or 39% of the responses for 12 panoramas where built heritage was present. 2 Or 52% of the responses for nine panoramas with surface water.
Table 2. Visual elements creating negative values in the landscape of Poznań agglomeration. Own elaboration.
Type of ElementsElement NameMentions No.Percentage
of All Responses
Infrastructurechimneys; railway; poles; fencing;
cranes
12719
Buildingsbuildings; offices;
housing blocks
16825 1
Properties or qualitieschaos; disorder;
colors;
grey and monotony
48
12
7
2
1 13% for housing blocks only.
Publisher’s Note: MDPI stays neutral with regard to jurisdictional claims in published maps and institutional affiliations.

