Article

LC and LC-IRT Models in the Identification of Polish Households with Similar Perception of Financial Position

Department of Economic and Financial Analysis, University of Economics, Ul. 1 Maja 50, 40-287 Katowice, Poland
Sustainability 2021, 13(8), 4130; https://doi.org/10.3390/su13084130
Submission received: 16 February 2021 / Revised: 2 April 2021 / Accepted: 2 April 2021 / Published: 7 April 2021

Abstract

:
One of the pillars of sustainable development is related to the elimination of poverty and improvement of quality of life. Financial situation of the households plays a crucial role in the subjective well-being, quality of life and overall satisfaction. According to most recent Eurostat data, Poland is one of the countries with the lowest level of subjective material well-being. In this paper we aim to find latent structures of Poles with similar tendency of self-reporting their income position additionally influenced by the socio-economic features and analyze the item characteristics of the questionnaire as well. To address the questions at hand, first we apply the variant of finite mixture models, i.e., latent class (LC) model for data from all, eight waves (2000–2015) of the Polish Household Panel. We are especially focused on the constrained version of the model under IRT parameterization. We compare the results for LC and LC-IRT models and show the influence of the covariates such as family type, socio-economic status and place of living on the probability of belonging to the three identified classes of Polish households, based both on multinomial and global logit parameterization. In this way we can show which types of families tend to be more satisfied with their financial position and those whose members are prone to belong to the worst situated group of Poles. Note that, we present the results for the data including survey weighs, being omitted in most of the studies concerning Polish financial well-being.

1. Introduction

Although many definitions abound, the most often used definition of sustainable development is that presented as “development that meets the needs of the present without compromising the ability of future generations to meet their own needs” [1,2,3]. It is also widely agreed that there are three pillars of sustainable development: economy —the creation of wealth and livelihoods; society—the elimination of poverty and improvement of quality of life; environment—the enhancement of natural resources for future generations [4] (p. 9). Economic growth may result in an improvement in the standard of living related to a small proportion of the population whilst the majority of the population remains poor. Today, the human needs of many people are not met, and by the same time the ability of future generations to meet their needs is being compromised [5]. Note that, economic growth, which has served as a proxy for gains in well-being has only an indirect and limited impact on well-being in the long run, so there is no reason to pursue such growth directly. Moreover, reduction in potential income not necessarily reduce well-being (particularly for those in upper-income brackets), and fewer consumption choices in some areas may not make much difference to life satisfaction. Furthermore, many of the opportunities for improving well-being discussed so far do not necessitate an increase in environmental harm or even material production. Pursuing sustainability and social well-being can be done in tandem [6].
Reducing inequalities and ensuring no one is left behind are integral to achieving the Sustainable Development Goals established by the UN (United Nations) in 2015 [7,8]. Inequality within and among countries is a persistent cause for concern. If income inequality reaches a very high level, i.e., a small portion of people (or households) earns most of the national income, it is very likely that political and economic systems collapse and it may result in major turmoils [9,10]. According to [11] very high levels of income inequality undermine domestic demand, because very rich people have a low propensity to consume and there will not be sufficient demand to pull the economy. Moreover, the very rich may have a tendency to waste resources since they have enough and more to spare. On the other hand, the very poor may have to depend on natural resources like land and forests and rivers where an overuse of these resources could leave a less productive environment for future generations. Extreme wealth and extreme poverty reduce resources left for posterity. Less economic inequality would save more resources and contribute to a more sustainable future. Tackling inequality becomes the core of any strategy of development that attempts to address issues of sustaining economic development over time and across generations.
In this research we refer especially to the social pillar of the sustainable development analyzing the abilities to meet the needs and income satisfaction among the Polish society in years 2000–2015. We identify different groups of Polish households and characterize especially the group of those with the most difficult financial position. Financial situation of the household is not only essential for a decent standard of living, but it also plays a crucial role in the overall satisfaction and quality of life. Severe material deprivation, poverty and not being able to pursue a desired life hugely affects individuals’ well-being. The EU-28 average rating for satisfaction with the financial situation equalled to 6.0 in 2013 and 6.6 points in 2018 was lower than the rate for overall life satisfaction, i.e., people on average are less satisfied with their financial situation than with their life in general (respondents indicated how satisfied they are with their financial situation on a scale from 0 to 10) [12]. Feelings about household income is particularly strong determinant of subjective well-being. Ref. [13] shown that material well-being is the main determinant of subjective well-being across all the analysed geopolitical regions including 153 countries.
Emerging economies, including Central and Eastern European countries, which have just been through a structural and economic transition, face difficulties in sustainable social and economic development. These economies are immature and have weaknesses in their institutional, legal, economic, and social spheres [14]. However, as for the success side of over 30 years of the Poland’s transition ie., tremendous progress in the convergence to the prosperous countries of Western Europe, significant opening to the world and remarkable improvement in international competitiveness as well as exceptional resistance of Poland’s economy to shocks from the global economy during the latest crisis needs to also be emphasized (e.g., [15,16,17]).
As far as the issues of economic disparities are concerned, transition to a market economy has resulted in higher inequality. Poland was by 2005 far above the average EU-27 level in terms of the thus measured income inequality (Gini coefficient at 0.306), and also had one of the highest income disparity in the region (Gini coefficient at 0.332 for the new member states average). However, since then income disparity in Poland has not increased and according to some sources it might have decreased [18]. As for other measures of economic disparity, ref. [19] report significant decline of absolute poverty, in line with the results of the Social Diagnosis [20]. There is a large economic literature documenting income inequality changes experienced by former communist countries during their post-1989 transformations. While in Russia and in many post-Soviet economies, inequality exploded during the transition, Poland is often perceived as a country where inequality grew rather moderately. In contrast to the standard view [21,22] show that the inequality of living standards in Poland grew sharply over 1989–2015. They present that the adjusted Gini index grew to a level that ranks Poland among the most unequal European countries.
Up to now, income inequalities in Poland have been mostly analyzed with the use of income or wage data, we provide the study based on the subjective measure concerning households perception of their financial position. Polish case seems to be relevant, because according to most recent Eurostat data [23], Poland is one of the countries with the lowest level of subjective material well-being. Ranked at the 22 position, characterized by the lower than EU-28 average rating for satisfaction with the financial situation with 5.7 points in 2013 and 6.3 points in 2018.
In this article we report on the subjective material well-being in the Polish society based on individual responses of the heads of each household. We analyze the survey data for each eight wave of Social Diagnosis panel research [24]. The main objective of the paper is to find latent groups of Poles with similar levels of income perception and characterize them in terms of different socio-economic features.
Note that, we conceive self-reported material well-being as a latent, psychological variable as the role of money in life can be a a function of various factors such as social class, wealth, political beliefs, personality type [25]. Some people regard money as a symbol of power and prestige, while others deem it the root of all evil [26,27,28]. Some people are happy with the money they earn, even if they are not very rich, some people have a lot of money, but they are still not satisfied with it. This may be due to different social comparison processes [29], different aspiration levels [30] or different consumption values and habits, different needs and wants [31]. For that reason we decided to examine attitudes people hold toward money as a latent, psychological trait that might be additionally influenced by different socio-economic features.
To address the question at hand, we adopt the variant of finite mixture models for discrete data, i.e., latent class (LC) models [32,33]. The LC approach is innovative, flexible and can provide suitable solutions regarding the structures recognition, because it takes into account specific features of the data, such as the scale of measure (often ordinal or categorical, rather then continuous), their hierarchical structure and their longitudinal component. We consider especially the  version that enclose the individual covariates [34,35,36]. We include different socio-economic characteristics such as socio-economic group, family type, size of the place of the residence. These features additionally influence the probability of belonging to the different latent classes. We are especially focused on the LC approach combined with Item Response Theory (IRT) models [37,38] in the version developed by [39] for polythomous ordinal items.
Following the research quoted above, we intend to verify the following hypothesis:
Hypothesis 1 (H1).
The relevant constraints on the latent variable models parameters depend on the nature of the response variable (being measured on different scales) and facilitate the interpretation of the analyzed socio-economic issue concerning perception of income satisfaction in Poland.
Hypothesis 2 (H2).
The extended latent variable models (including covariates) reflect the structures of the  data properly and are the guide to the interpretation of the obtained parameters.
With respect to the existing empirical literature, one of the our main contributions of the approach we propose is that of conceiving the subjective level of income of Polish families as a discrete latent (non-observable) construct. Then, we identify latent structures of Poles with similar level of self-reported financial satisfaction in years 2000–2015. Furthermore, we compare the results for different types of discrete latent trait models including (i) the specific constraints; (ii) covariates; and (iii) sample weights. Incorporating weights in descriptive or inferential analyses is needed to compensate for the unequal probability of selection, nonresponse and noncoverage, and poststratification [40].

2. Literature Review

A vast literature has emerged over the last twenty years documenting the many variables that influence social well-being. One of the newest approaches is related to the introduction of the sustainable, or green(ed), GDP [41,42]. Ref. [41] proposed a sweeping assessment of the limits of GDP as a measurement of the well-being of societies. The authors examined how GDP overlooks economic inequality (with the result that most people can be worse off even though their average income is increasing) and whether environmental factor has the impact on one’s economic decisions. After the analysis of the discrepancy between what people tell and what they know about their well-being, the researchers suggest to adjust GDP and present a bold new array of the concepts from sustainable measures of economic welfare to the measures of savings, wealth and the green GDP [43]. Classification of welfare measures based on the notions of well-being, economic welfare and sustainability can be found in work of [44].
Although economic growth has long been considered an important goal of economic policy, in recent years some scientists have begun to speak against further attempts to raise the material standard of living claiming that such attempts hardly contribute to the rise of well-being [45,46]. Income-based measures of welfare have earned much criticism as they present an insufficiently wide picture of human welfare and social progress. As a result, a number of alternative approaches are being developed, and many researchers have started to agree that the common measurement system should shift the emphasis from economic production to people’s well-being (e.g., [47,48,49]). In turn, measures of subjective well-being have gained traction as measures of societal progress in recent years [50]. They constitute a more direct way of measuring welfare than is provided by its more traditional measure of income.
As a result of the disenchantment with the traditional welfare economic framework, a number of alternative approaches have gained more widespread support and attention by researchers (see, e.g., [42,49,51] for overviews). Measures of subjective well-being are attractive because they directly ask individuals for their own assessment of their situation, the capability approach offers a much broader informational space to assess the situation of a person, including a focus not only on outcomes but also on agency and a person’s substantive opportunities [50].
According to [52], subjective measures represent well-being better than economic measures because subjective measures can be considered the direct measures of well-being. Refs. [45,53] have shown that subjective well-being is a function of both an individual’s personality and his or her reaction to life events. There is vast literature showing the material well-being assessment on different psychological and behavioural determinants, such as financial knowledge financial literacy or financial knowledge [54,55,56], financial behaviour [57,58], financial stress [59,60] and other financial attitudes [60,61].
A number of studies are also concentrated on relationships between objective and subjective measures of financial well-being. Refs. [62,63,64] have shown only a modest direct effect of absolute income on social well-being and have tried to explore whether there are any indirect effects of income on social well-being through the subjective assessment of one’s financial condition. These modest correlations are considered as “difficult to explain” [65] and have motivated much of the research exploring alternative perspectives.
Differently from the previous work we conceive financial well-being as an indirect, latent concept and only assessed through items being measured on ordinal scale. With respect to [66,67] that employed single-response ordinal measurement we include also socio-demographic features to better characterize especially families with the worst financial position. As far as the Polish society is concerned most of the studies are focused on the relationships between a subjective assessment of the material situation of households and the characteristics such as gender, age, education, biological type of family observed just in one year and for the selected group of Poles i.e., living in 10-th biggest Polish cities [68], in rural areas of Poland [69] or the group of young people’s households [70]. We base our study on nationally representative sample of Poles being observed in 15 years period of time.
Our work contributes also to other more recently studies using nationally representative surveys for Russian households [71], Slovenian households [72] or Malaysian households [73]. Although those studies provide interesting methodological approaches they are limited to data that is at cross-sectional in nature. Therefore, the presented results might be perceived as showing to narrow picture of financial wellbeing in the analyzed societies. To the best of our knowledge, this is the first analysis of this subject based on long-term national longitudinal study.

3. Materials and Methods

3.1. Data Presentation

We rely our research on Social Diagonsis [24], the national project based on panel research with the first sample being taken in the year 2000. The following took place three years later, and since then has been repeated every two years. This project takes into account all the significant aspects of the life of individual households and their members, both the economic (i.e., income, material wealth, savings), and the not strictly economic (i.e., education, medical care, problem-solving, stress). In our study we analyze the subjective assessment of the financial situation in Polish families. We consider the questionnaire item: “It is easier to make ends meet?” measured by ordinal response variable (with the following five categories: “with the great problem” (0), “with difficulty” (1), “with the certain difficulty” (2), “rather easily” (3), “easily” (4) for each wave of Social Diagnosis panel research (2000, 2003, 2005, 2007, 2009, 2011, 2013, 2015).
We consider the sample of n = 2768 households who participate in all waves of the survey in years 2000–2015 (346 complete observations at each point of time). Table 1 lists the percentage of households in the 8 measurement occasions. Note that, in order to preserve the representative characteristics of the sample [74,75] the survey weights are applied in the frequency table and in the estimation part of our analysis as well. They are derived as the inverse of the sampling fraction for each dwelling in each stratum (more details, the individual-level and households-level data and survey documentation are freely available at the following link http://www.diagnoza.com/index-en.html (accessed on 1 May 2020)). Additionally, the mean response X ¯ j is computed for each item after assigning score 1 to 5 to the five increasing categories, respectively.
We notice that in each year the majority declare to cope with the present income (responses are mainly concentrated on the middle category). Less then 5% (with exception for 2009) seems to be completely satisfied with their financial position, whereas the percentage of those dealing with the great problem is reaching over 30% in the first year of the survey. It is interesting to note that the number of those declaring the worst financial position is substantially decreasing with years. The decreasing tendency can be observed also for the second category ( x = 1 ). Contrary, we notice the increasing value of X ¯ j and percentage for the highest scored category with years.
We use also information on family characteristics such as Z 1 —place of living (1–cities with more than 500,000 inhabitants, 2–cities with 20,000 to 500,00 inhabitants; 3–inhabitants, cities below 20,000 inhabitants and rural areas), Z 2 —socio-professional status (1–employees in public sector, 2–farmers, 3–employees in private sector and entrepreneur/self-employed, 4–pensioners, retirees, pupils and students, unemployed, other professionally inactive) and Z 3 —family type (1–marriage without children, 2–marriage with one child, 3–marriage with two children, 4–marriage with three and more children, 5–other family types, i.e., one-parent family, multi-family, non-family-one person, non-family-multi-person). Note that in the analyzed period of time the respondents are mainly employed, the majority lives in other family types, mainly in the cities below 20,000 inhabitants or in rural areas. For more details and the graphical presentation of the data see [76].

3.2. The Identification of Structures in Socio-Economic Data

The identification of structures in data is closely related to the definition of homogeneity, which is, unfortunately not clearly formulated. Generally, the definition of homogeneity is associated with graphical separation of certain subsets, clusters or finding characteristic observations in the analyzed data set.
The homogeneity of a data set characterized by continuous as well as categorical variables is one of the main assumptions for most statistical methods. The issue of heterogeneity can be frequently found in survey studies, i.e., (respondents’ attitudes to saving, paying habits, trust in public or financial institutions). Respondents with varying demographic features (age, educational level and socio-economic status) usually give different answers to questions. Treating such a data set as a homogeneous structure is groundless and can lead to an erroneous interpretation of estimated parameters.
One of the main determinants of treating the data set as homogeneous or heterogeneous is the approach adopted in the study. It should be emphasized that the methodology of this paper is based on the stochastic approach to the homogeneity of data set (the homogeneity defined above is known also as a “distributional homogeneity” because each data set comes from the population with the certain distribution (the data set can come from the population characterized by mixture of two component distribution and that sense can be treated as homogeneous) [77]. The identification of homogeneous structures in data set associated with the stochastic approach to homogeneity is based on the mixture models. In this approach, the number of components in the mixtures is not known, as it is a latent variable of the model (in the latent class model the latent variable describes the number of clusters). The parameters of the model are estimated for different numbers of categories (category numbers) of the latent variable and then the goodness-of-fit is compared.
The assumption of many of the applied statistical methods is the homogeneity of the data set of observations. In the previous studies concerning Polish financial well-being based mainly on summary statistics or regression analysis for separate years (see i.e., [69,78,79]) it is simply assumed (without prior verification) that the analyzed data set is homogeneous and statistical analyses are carried out.
Moreover, to the best of our knowledge, it is the first to apply latent variable models to evaluate financial assessment of Polish households, while at the same time, presenting socio-economic influences on the latent trait of interest and including survey weights.

3.3. Latent Class (LC) Models

First, we are focused on latent class (LC) model, one of the most well-known latent variable models typically used to classify a sample of subjects on the basis of a series of categorical response variables. The model helps to gain a deeper understanding of the observed relationships between response variables.
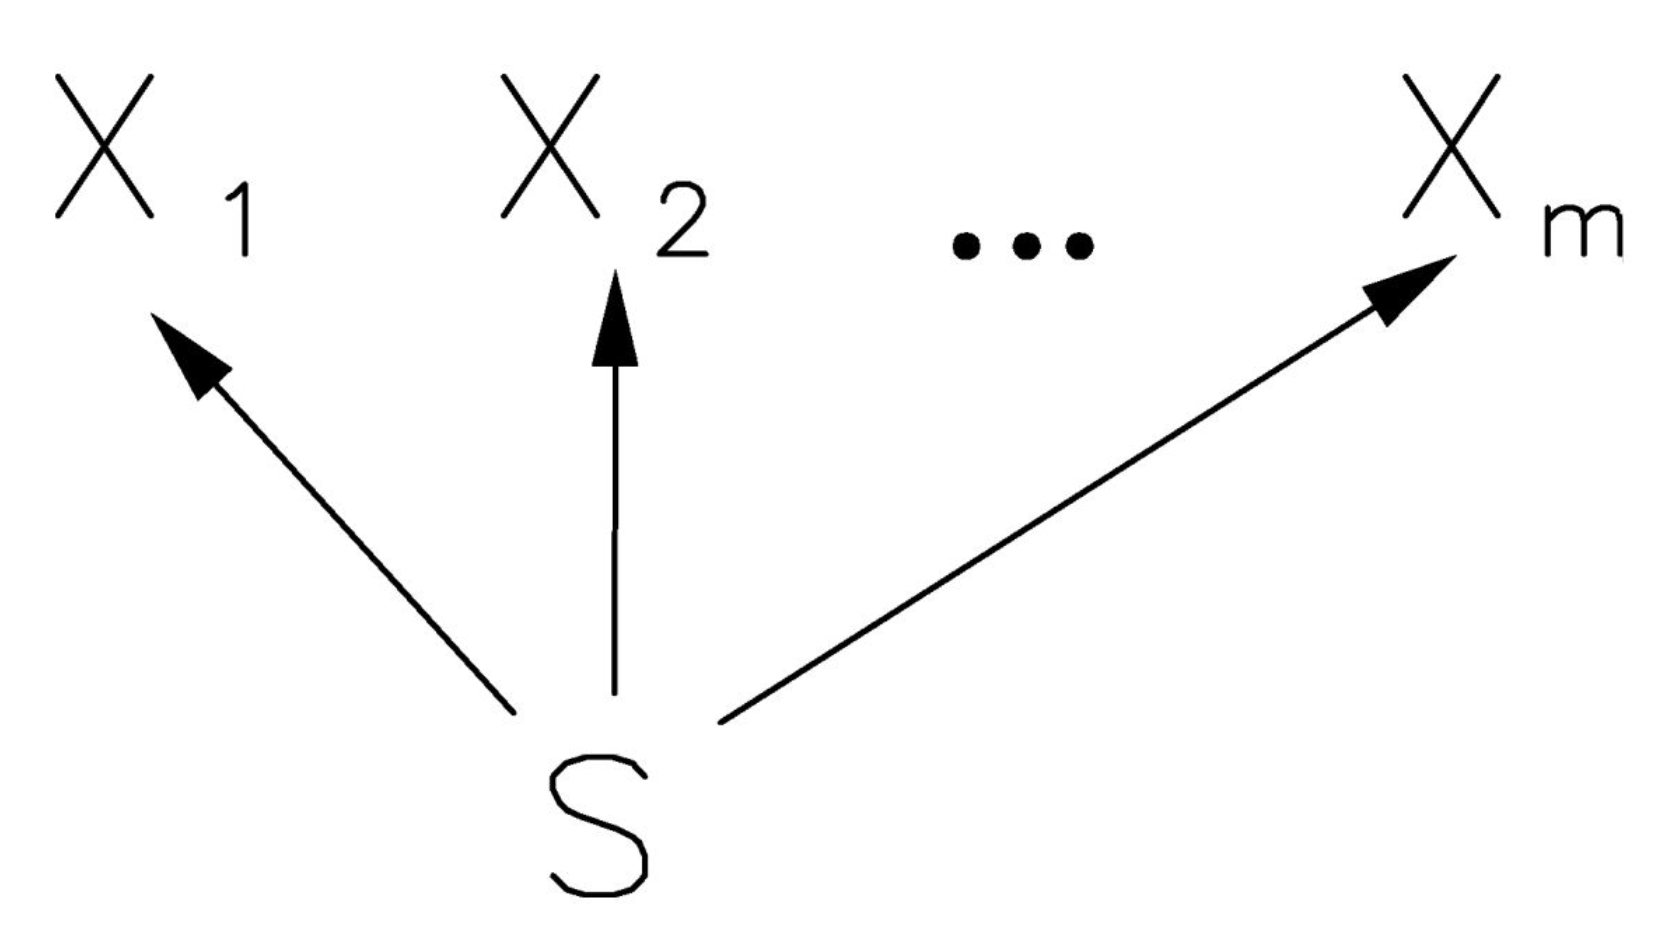
Let, X 1 , , X m denote the response variables, collected in the vector X , which are categorical and labeled from 0 to l j 1 . The random variables in X are assumed to be conditionally independent. The well known assumption of local independence, is common to most latent trait models.
In order to explain the dependence structure between latent and response variables, the LC model assumes the existence of only one discrete latent variable S presented in the Figure 1.
The discrete latent variable S has u levels, which are labeled from 1 to u. Each of these levels corresponds to a latent class in the population for which we have a specific weight, or a priori probability ( π s ), and a specific conditional distribution of the response variables ( ϕ j x | s ).
Additionally, the probability to belong to a given latent class ( π s ) may be influenced by some individual level covariates, then z denotes the column vector of the covariates corresponding to sample unit. The covariates are considered as fixed and known. In this way, there is not a set of weights π s common to all subjects in the sample, but weights π s ( z ) which are subject-specific, i.e., there is π s ( z ) = p ( Z = z ) for each individual i ( i = 1 , , n ) and latent class s ( s = 1 , , u ).
Then, the LC model can be defined as:
p ( x | z ) = s = 1 u ( j = 1 m ϕ j x | s ) π s ( z ) .
In order to model the effect of the covariates on the probabilities π s ( z ) , we adopt a multinomial logit parametrization, under which
log π s ( z ) π 1 ( z ) = β 0 s + z β 1 s , s = 2 , , u ,
with class-specific intercepts β 0 s and regression parameters β 1 s denoting the effect of covariate in z on the logit of π s ( z ) with respect to π 1 ( z ) . The resulting types of models belong to the class of concomitant variable latent class models [34,80].

3.4. Latent Class Item Response Theory (LC-IRT) Models

In the next step we deal with the LC approach in a more specific way. We consider an IRT parametrization of the conditional response probabilities based on explicitly considering a latent trait measured by the items. Thus we adopt the latent class IRT approach for polythomous ordinal items proposed in [39] that extends the approach introduced by [81] for dichotomous items (see also [82]). The combination of the two latent variable models (LC and IRT models) enables to find homogeneous classes of individuals characterized by the similar latent ability levels (the levels of financial well-being in our study), and at the same time, the item characteristics analysis (usually identified as discrimination indices and difficulty parameters) as well.
We consider that the questionnaire is aimed to measure, for each individual i the level of the certain latent trait θ , i.e., job satisfaction, income satisfaction, saving skills. A crucial assumption characterising the models at issue is the discreteness of the distribution of the latent trait θ , giving rise to a finite number of latent classes s ( s = 1 , , u ) , each one characterised by the same latent ability level (support point), denoted as ξ s . Note that, the version of LC-IRT models allow also for multidimensionality, so as to consider that distinct latent traits are jointly measured (see also [81]). We also denote the conditional response probability that a subject with latent trait (or ability) level given by θ responds by category x to item j as follows
ϕ j x ( θ ) = p ( X j = x | Θ = θ ) , x = 0 , , l j 1 ,
with elements of which sum up to 1.
Then, the rule to obtain the manifest distribution of the response vector is extended as follows (see [39]):
p ( x | z ) = s = 1 u p ( x | ξ s ) π s ( z )
The posterior distribution is defined as:
p ( ξ s | x ) = p ( x | ξ s ) π s ( z ) p ( x )
and the conditional probabilities p ( X j = x | θ = ξ s ) depend on the nature of the response variables.
There are many different classifications of IRT models for polytomous items [83,84].
In general, the adopted IRT models assume that
g x ( p j ( θ ) ) = α j ( θ ϑ j x ) , j = 1 , , m , x = 1 , , l j 1 ,
where g x is a link function specific for category x and α j and ϑ j x are item parameters which are usually identified as discrimination indices and difficulty levels and on which suitable constraints may be assumed.
On the basis of the specification of the link function and on the basis of the adopted constraints on the item parameters, different IRT models for polytomous responses’ are analysed. The most common IRT models based on global logits (given in Equation (6)) are also known as graded response models, those based on local logits (given in Equation (7)) are known as partial credit models.
g x ( p j ( θ ) ) = log p ( X j x | θ ) p ( X j < x | θ ) , x = 1 , , l j 1 ,
g x ( p j ( θ ) ) = log p ( X j = x | θ ) p ( X j = x 1 | θ ) , x = 1 , , l j 1 .
Constraints may be posed on the discrimination parameters (each item may discriminate differently from the others or all the items discriminate in the same way) and item difficulty parameters (the item difficulty parameters may be unconstrained, ie., there are as many difficulty parameters as the number of response categories l j minus 1 or constrained, ie., the distance between difficulty levels from category to category is the same for each item τ j x = τ x ). By combining those constraints, four different specifications of the item parameterization for each of the link functions are obtained. All the possible combinations of the item parameters constraints for local and global logit link functions are given in Table 2.
We remind among the most well-known models for polytomous responses presented in Table 2: Graded Response Model (GRM; ref. [85]) and the Generalized Partial Credit Model (GPCM; ref. [86]), models with free both item parameters, global and local logit link function respectively, as well as the Partial Credit Model (PCM; ref. [87]), model with constrained α j and free ϑ j x , local logit link function; Rating Scale Model (RSM; ref. [88]), model with local logit link function and both parameters being constrained. RS-GRM model (with free α j and constrained ϑ j x , global logit link function) is the rating scale version of the GRM introduced by [89], RS-GPCM (with free α j and constrained ϑ j x , local logit link function) are the rating scale versions of GPCM [90]; 1P-GRM and 1P-RS-GRM [91] are the equally discriminating versions of GRM and RS-GRM, respectively (see also [38,92] for more details).
Note that also under the IRT specification of the LC model, the effect of the covariates on the probabilities π s ( z ) may be modelled through a multinomial logit parametrization as in (2). However, in order to have a more parsimonious model, the effect of the covariates is modelled also through a global logit parametrisation. In particular, we assume that
log π s ( z ) + + π u ( z ) π 1 ( z ) + + π s 1 ( z ) = β 0 s + z β , s = 2 , , u ,
where the intercepts β 0 s depend on s, whereas the regression parameters β are common to all classes and are of simple interpretation. In fact, if one coefficient in β is positive then the corresponding covariate in z has a positive effect on the ability level and as the ordered categories covariate increases, the ability level also increases.
Typically, the estimates of the LC and LC-IRT models are obtained through the EM algorithm [81,93]. In the empirical part of this work we adopted the discrete marginal maximum likelihood using MultiLCIRT package of R [94,95]. The selection of the number of latent classes, the type of logit link function and the selection of the item parameterization was performed on the basis of the BIC and AIC indices [96,97]. In these criteria, a term to the likelihood penalizing the complexity of the model is added, so that it may be minimized for more parsimonious parameterizations and smaller numbers of groups than the loglikelihood. Accordingly, the smaller value of the information criteria, the stronger evidence of the model.

4. Results

In the first part of our analysis we show the results of the application of the LC model in the basic version and including covariates as well. Then we compare the results for different LC-IRT types of models (imposing different constraints on item parameters). We present the results with more details for latent variable models with covariates achieving the optimum measure of fit.

4.1. Results for LC Models

In applying the basic LC model to the subjective income perception dataset, we choose s = 3 latent classes, which corresponds to the lowest BIC (see Table 3). The model with three latent classes will be denoted as LC; its maximum log-likelihood equal to ^ = 3020.356 with 98 free parameters. The corresponding values of BIC and AIC are 6604.325 and 6236.712 respectively. Note that AIC leads to choosing a model with four number of classes; however, as usual, we prefer to rely on BIC for this choice because it leads to the most parsimonious choice. We fitted also the models with covariates presented in Section 3.1 (family type, socio-economic status and place of living) for s = 1 , , 8 . Finally, based on information criteria we choose also three as the most suitable number of latent classes for the model denoted by LC-cov. Due to limit of space in the further part of our work we present the analysis of the extended model, i.e., including covariates (LC-cov) as this model presents even better measure of fit and allows for a more detailed analysis.
The estimates of the conditional response probabilities for the selected model (LC-cov) are reported in Table 4, whereas the estimated class weights are given in Table 5.
We observe that the latent classes correspond to increasing tendency to respond with the higher income satisfaction and have considerably different sizes. In particular, the third class, which is the smallest with about 17 % of subjects, corresponds to the highest income satisfaction. The second group, includes close to 58 % of subjects being generally satisfied with their income position and the first class is referred to about 25 % of Poles characterized by the lowest income perception. In fact, when s goes from 1 to 3, the conditional probability of the first category ( x = 0 ) tends to decrease for every time occasion, whereas that of the last category ( x = 4 ) tend to increase for each item (corresponding to the following years).
Note that, the highest values of conditional probabilities for the first category in the first class, corresponding to the highest dissatisfaction is observed for the sixth and seventh wave of the survey following the year of the economic crisis. However, the smallest values for the first and second categories ( x = 0 and x = 1 ) in this class can be observed in the last year of the study showing the improving financial situation in the recent years. As far as the latent class with the highest income satisfaction is concerned, the lowest share and its increasing tendency reaching the breaking point in the 2009 year of those coping easily with their finances can be observed. Moreover, we note also the high value of conditional probabilities for x = 3 in the last wave for this group.
For a more precise check, we computed class/item-specific scores ϕ j s that are obtained by the weighted average of a set of scores assigned to each response category (1 for the first, 2 for the second, and so on) and weights equal to the conditional response categories. The class/item-specific scores are presented in Table 4 and confirm that we are essentially dealing with ordered latent classes.
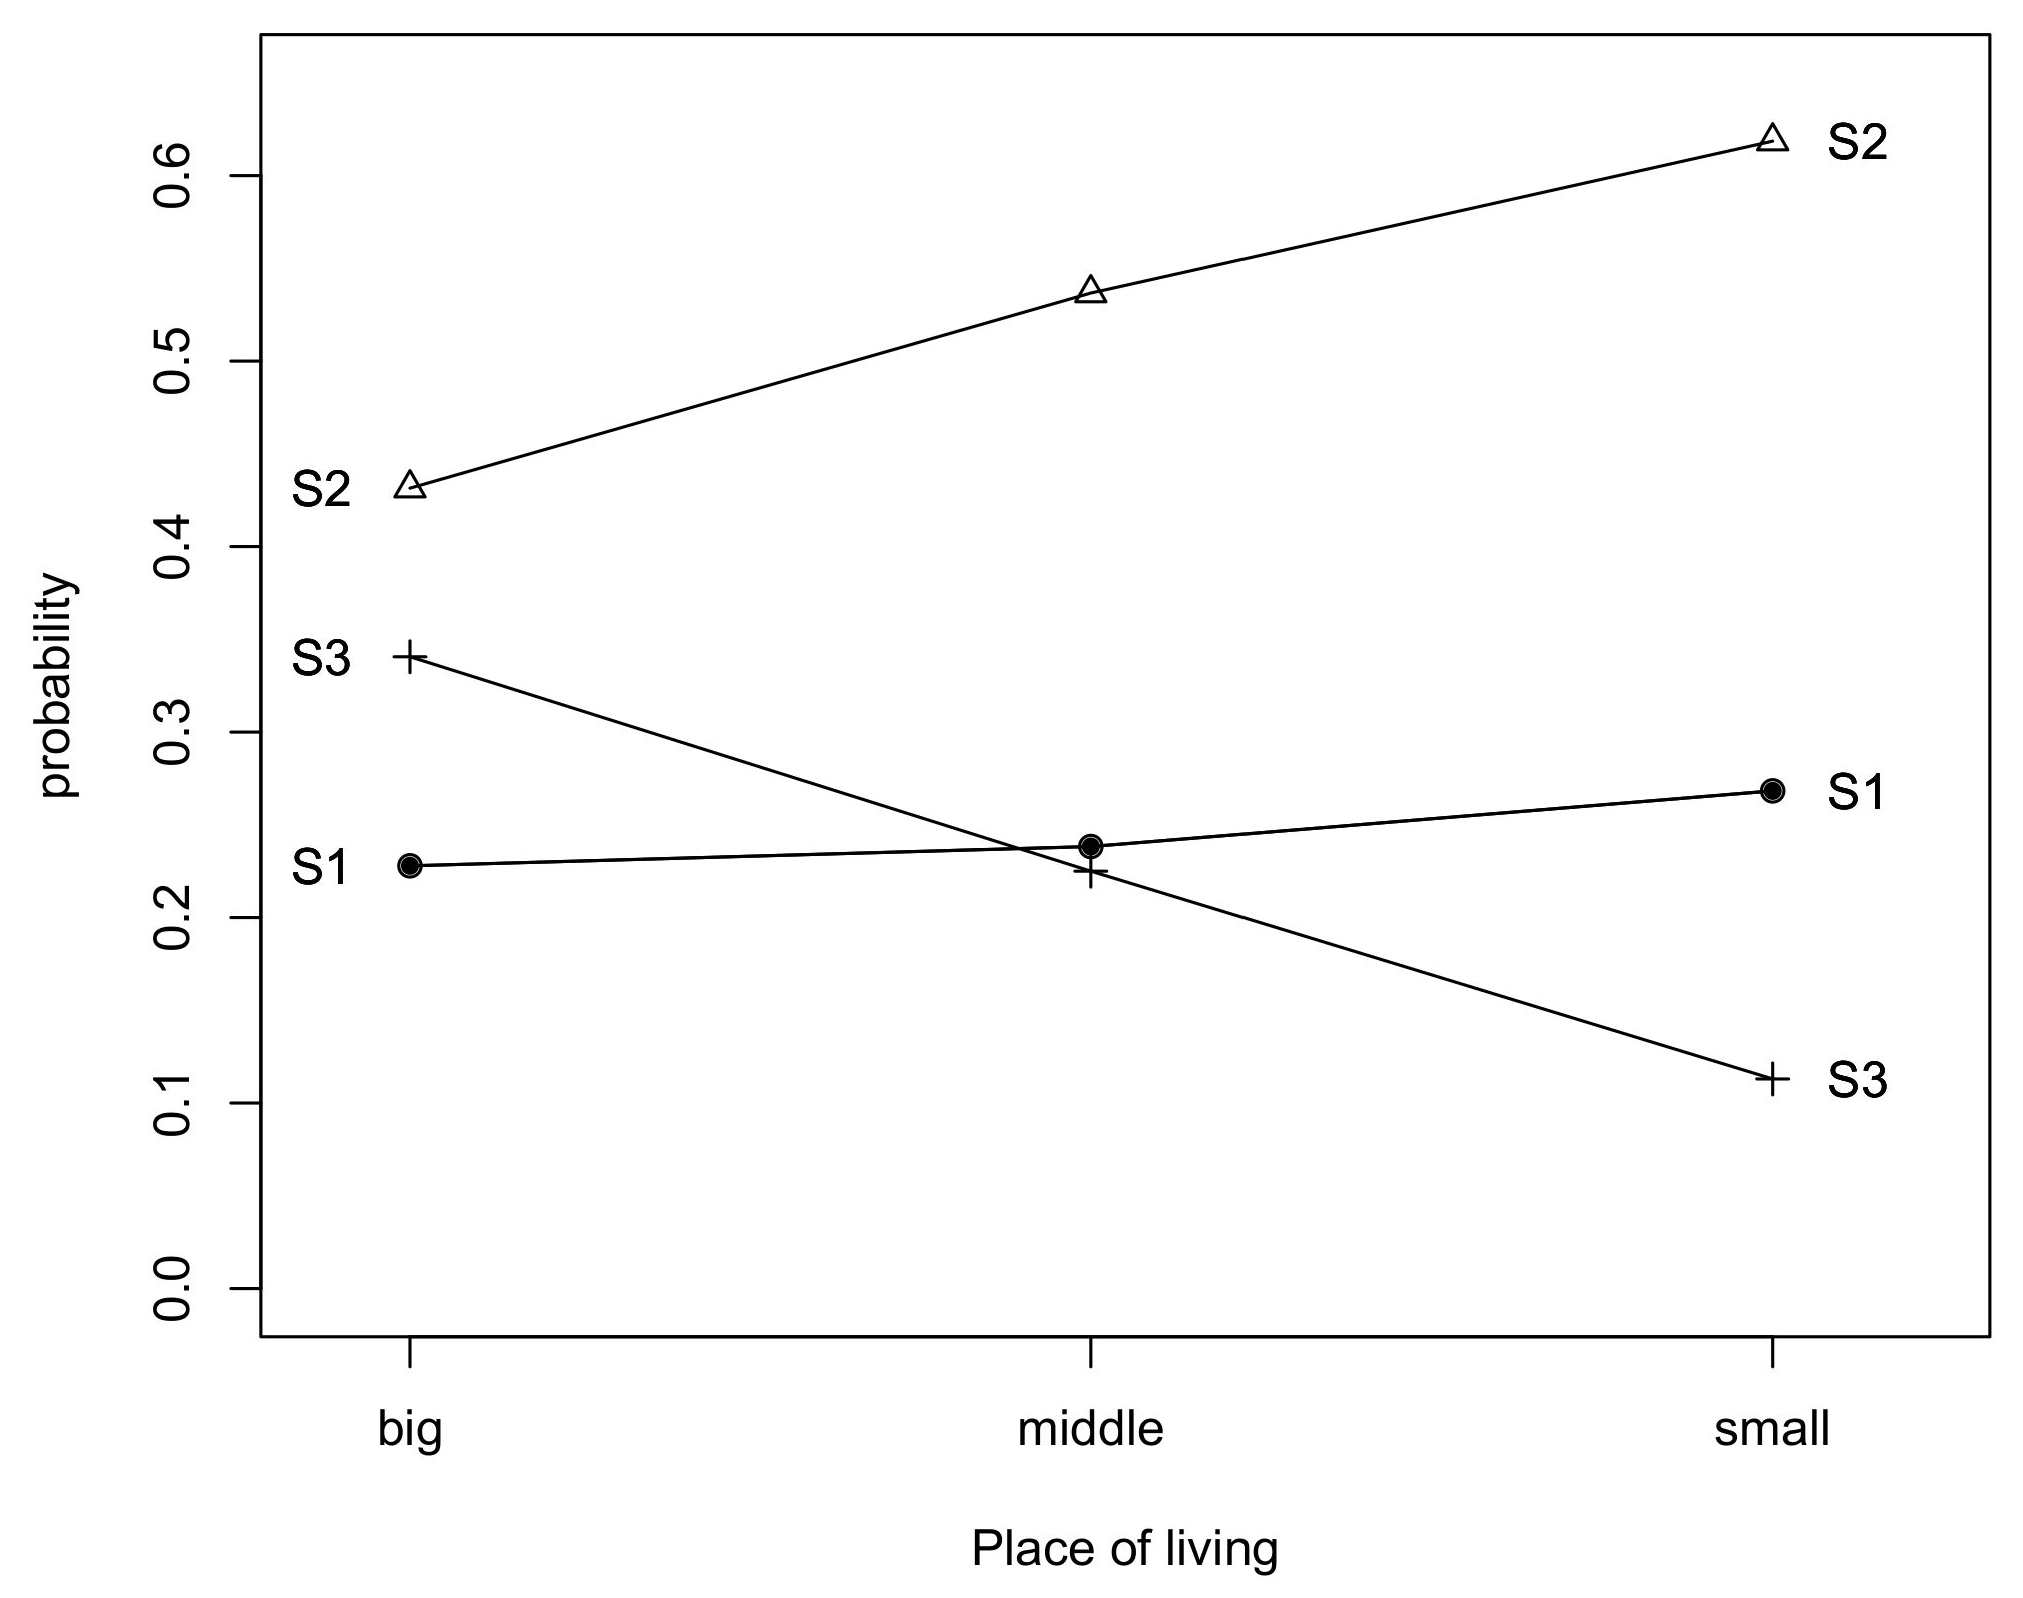
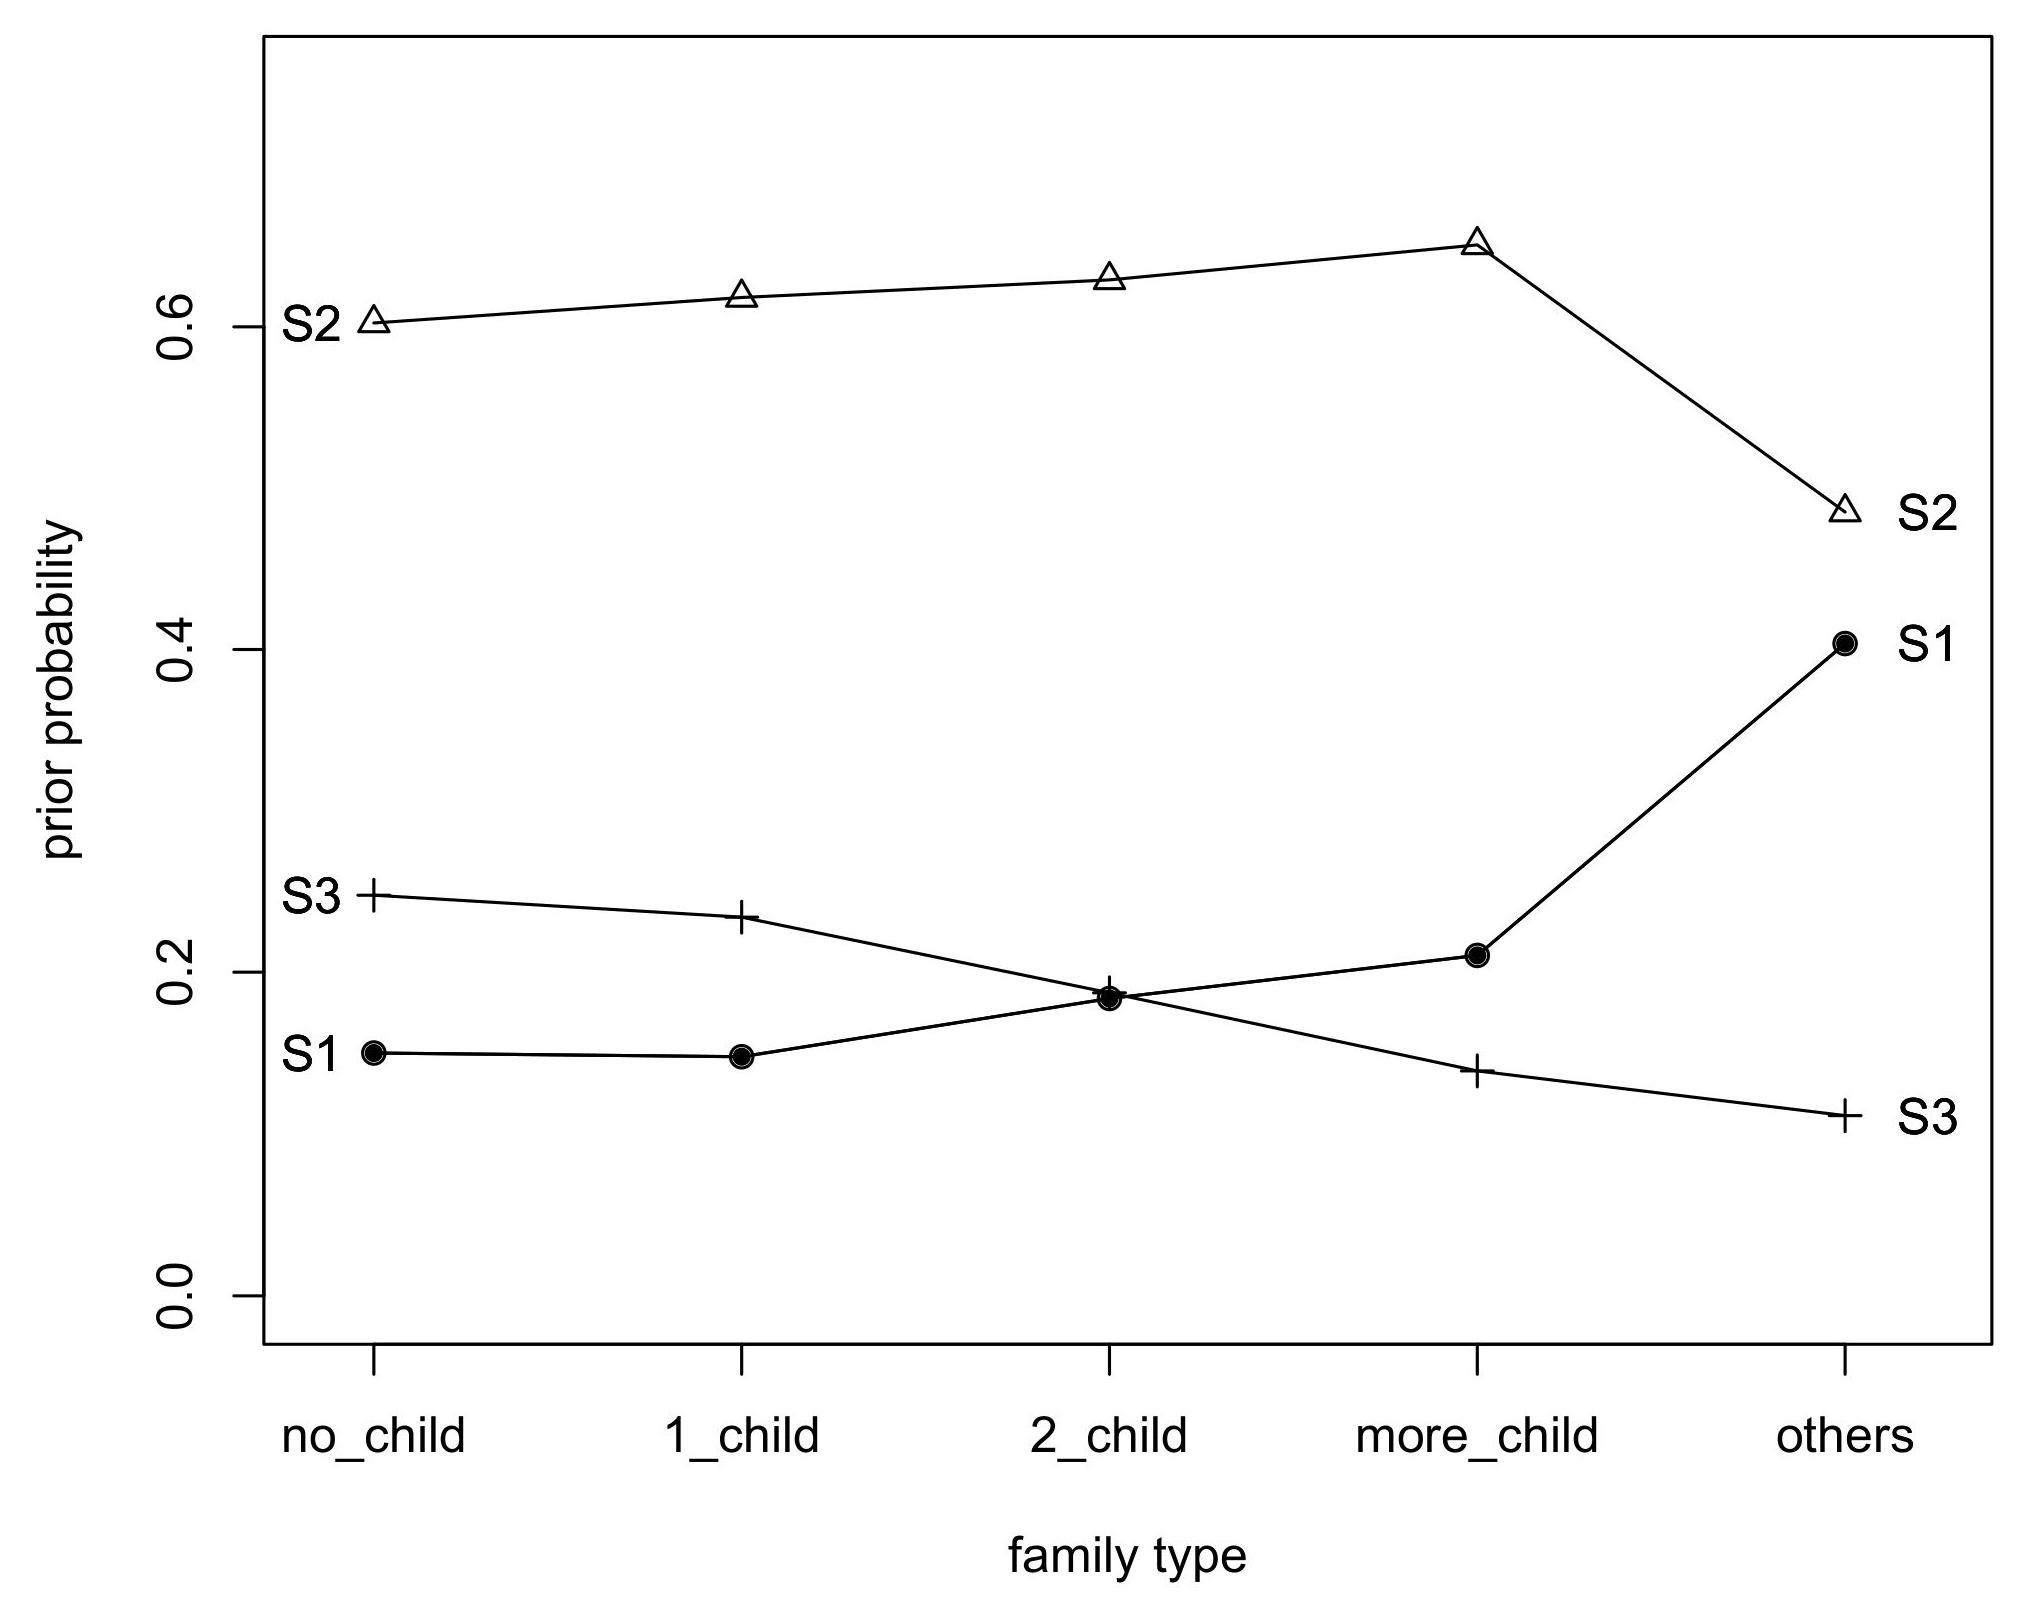
The important part of our study aimed at understanding how the covariates affect the latent trait of the model. Therefore, in the next stage of our analysis, we calculated and plotted the prior probabilities of class membership, at varying levels of covariates. The estimated prior probabilities of class membership are given separately for each family type, socio-economic status and place of living covariate and presented in Figure 2, Figure 3 and Figure 4.
We observe the highest prior probability to belong to the generally satisfied group of Poles for more children family types. The other family types are most prone to belong to the completely unsatisfied group of respondents. As expected, those living in no children or one children family types have the highest chance to be fully satisfied with their financial position (see Figure 2).
The results given in Figure 3 present that employees have over a 20% prior of belonging to the best situated group of Poles, while pensioners, retired and other professionally inactive people have almost 40% prior of belonging to the worst situated class. However, farmers followed by employees have the highest chance to belong to the second class.
The probability of belonging to the third class is significantly higher for those living in big cities, while residents of countrysides have just slightly higher prior of belonging to the first group then to those living in middle sized or big cities of Poland. However it is interesting to observe (Figure 4) the highest chance to belong to the group of living quite comfortably on present income (belonging to the second class) for people living in the smallest towns or villages.

4.2. Results for LC-IRT Models

In order to better understand the analyzed phenomena, we apply a constrained LC model. Accordingly, in this part of our analysis, we adopt the latent class of Item Response Theory (IRT) models. In particular, we rely on the models for polythomous ordinal items. Through these models we find latent classes of Poles with similar levels of financial satisfaction, we study the effect of different socio-economic covariates on the probability of belonging to these classes, and we assess the item characteristics.
The first stage of our LC-IRT analysis is focused on the choice of the best logit link function. A comparison between a model with global logit link and a model with local logit link is carried out on the basis of the BIC index and by assuming s = 3 latent classes, free item discriminating and diffculties parameters. Because the global logit link has to be preferred to a local logit link function (the smaller BIC and AIC values, see Table 6) in the following we fitted different types of the LC graded response type models with free and constraint discriminating index as well as free and constrained threshold difficulty parameters, for each item.
Besides, because the compared models are nested, the parameterization is selected on the basis of an LR test and BIC, AIC criteria as well. For the sake of completeness, log-likelihood and information criteria values for local logit link function are also included in the Table 7 (see LC-GPCM, LC-RS-GPCM, LC-PCM, LC-RSM). The results given in this table show that LC-1P-RS-GRM model has to be preferred among all of the LC-IRT models considered, that is the LC graded response model with constrained discriminant and difficulty parameters as well.
Also, it can be observed that a graded response type model has a better fit than the standard LC model, as the BIC value observed for the former is smaller ( BIC = 6310.307 ) than that detected for the latter ( BIC = 6604.325 ). Therefore, the results for LC-1P-RS-GRM model including also the socio-economic features are presented in further part of this work.
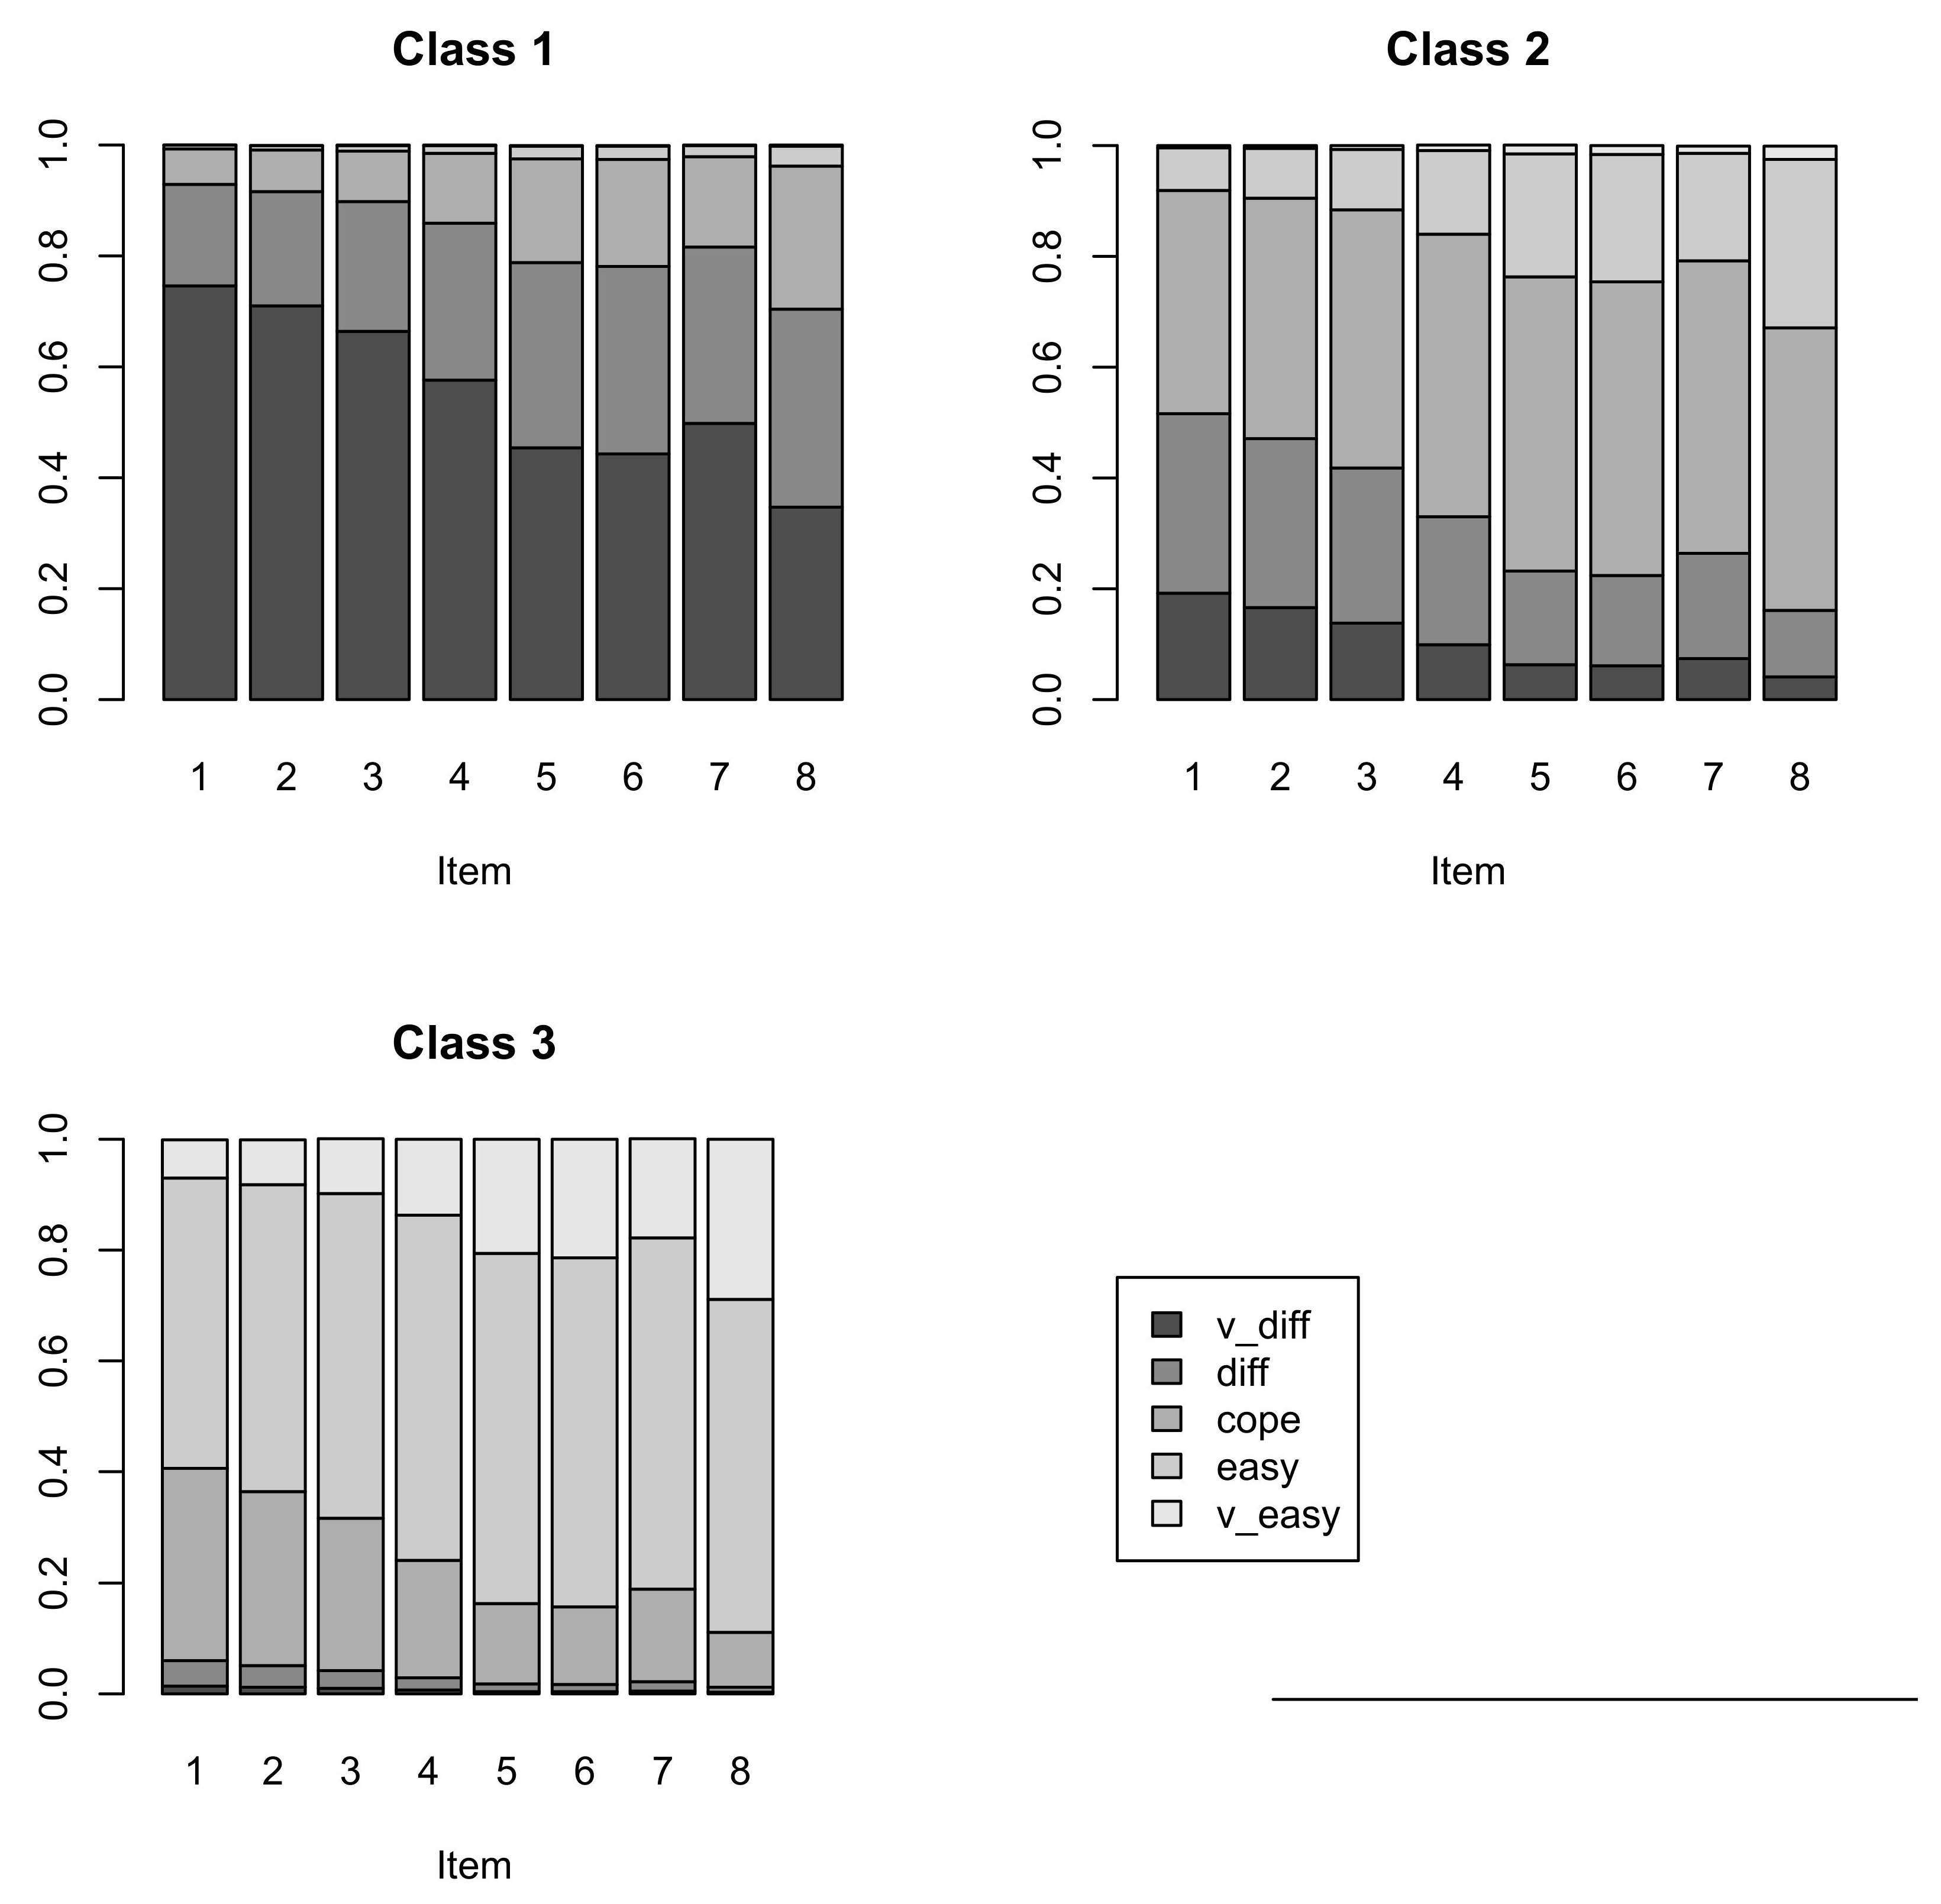
The estimated conditional probabilities under the selected LC-1P-RS-GRM-cov model presented in Figure 5 generally lead us to the same conclusions as for LC-cov model. The analysis of the conditional probabilities confirm again that the first latent class consist of those with the most difficult financial situation, the second group comprises those coping with the present income and the third class is made mainly by those satisfied with their financial position.
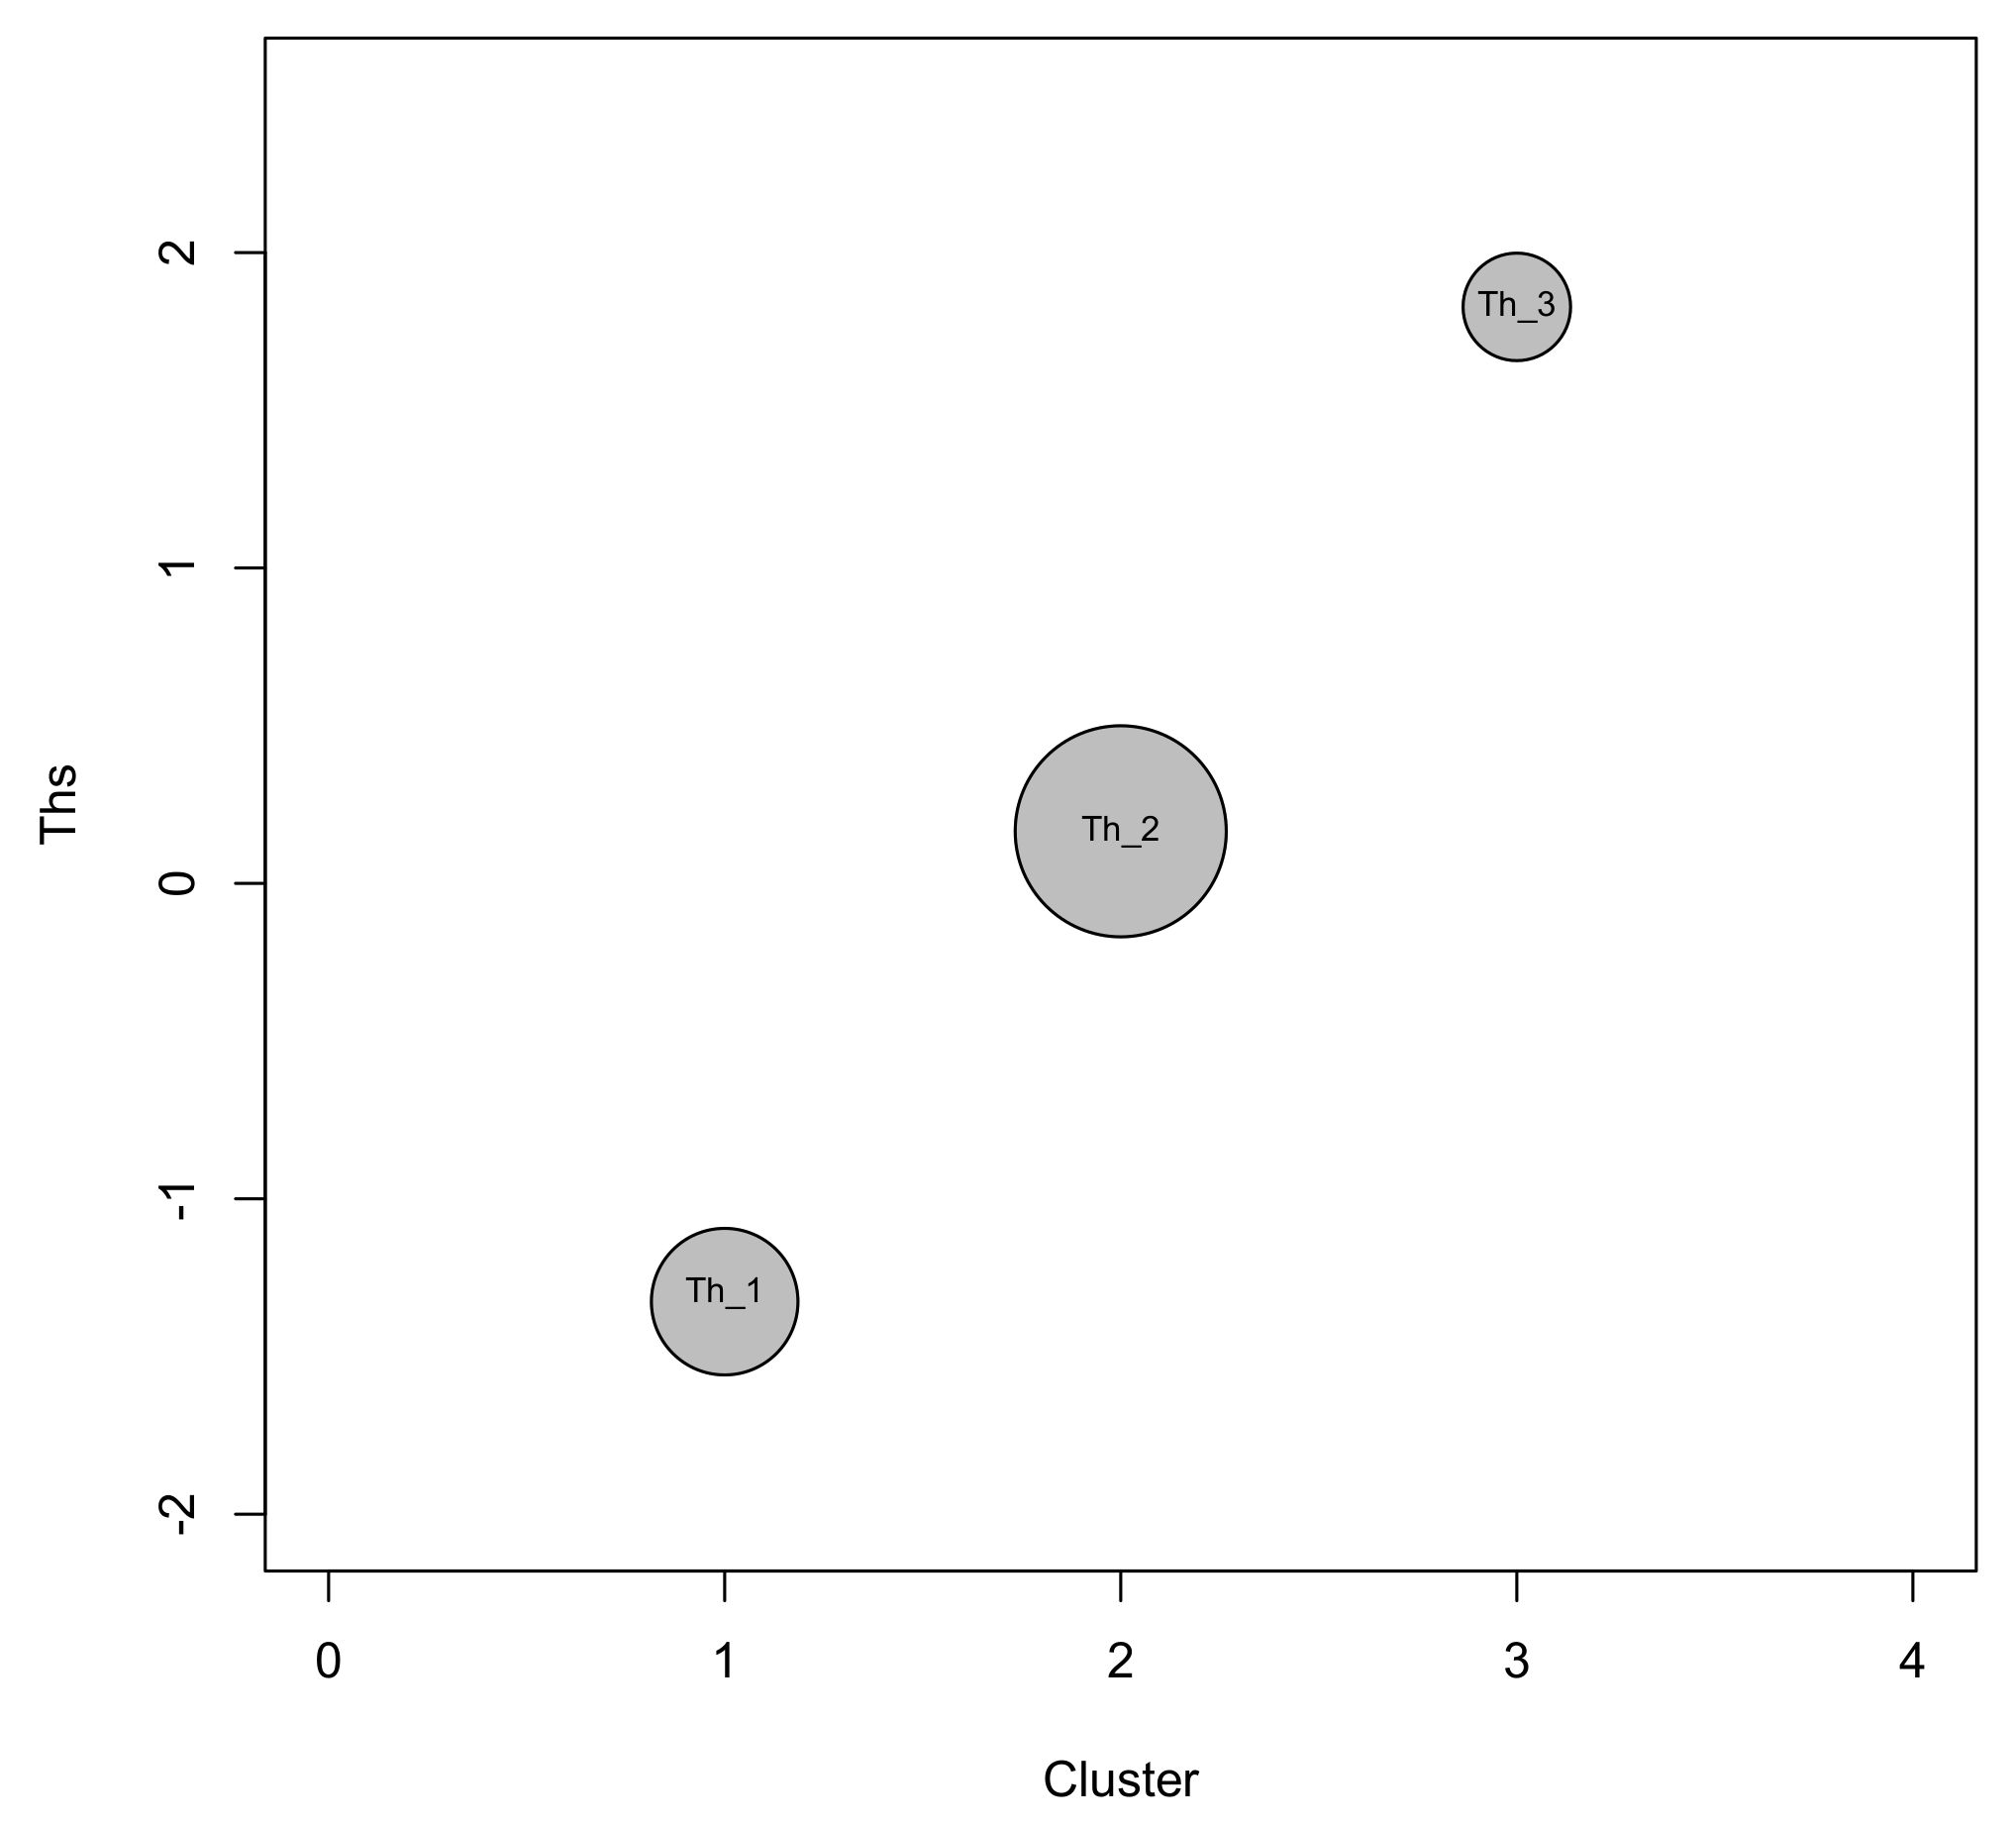
Note that, additionally the support points ( ξ ^ s , s = 1 , , u ), estimated under the selected model, and the corresponding prior probabilities ( π ^ s ( z ) , s = 1 , , u ) reported in Table 8 facilitate interpretation of the results. Moreover, the depicted latent trait levels in Figure 6 allow for cluster labeling in an efficient way.
We remark that, the support points are standardised so as to have null mean and unitary variance and the item parameters are transformed accordingly; (see [38] Section 4.6) for details.
As with the previous model LC-cov we observe that most subjects (57.4%) belong again to class 2 (shown with the biggest circle in the Figure 6), which is characterised by an intermediate level of income perception ( ξ ^ 2 = 0.165 ). This class is also characterised by the highest conditional probabilities for the third category (“coping with the present income”) among all classes (especially for X 3 , X 5 , X 6 , X 7 ). Over 27% of subjects are in class 1 (represented by the smallest circle in Figure 6) and close to 15% of subjects are in class 3, corresponding to the lowest and highest levels of subjective well-being, respectively. Note that, compared to the LC-cov the prior probability for the third class of the model LC-1P-RS-GRM-cov (see Table 8) is slightly smaller in favour of the first class.
The estimates of the standardised item parameters (difficulty parameters) for the selected model are given in Table 9. Note that, the selected model (LC-1P-RS-GRM-cov) is characterized by the constrained both difficulties and discrimination indices (all items discriminate in the same way). Therefore, Table 9 presents only single discrimination parameter (the threshold parameters are the same for all response categories) for each item. We observe the highest estimate for the first item τ = 0.687 . This means that the X 1 (regarding the question in the first year of the analysis) is considered to have the highest difficulty level of the item. In turn, the eight item (regarding the last year of the study) is considered to have the lowest difficulty level (meaning that this is the aspect of the highest satisfaction of the interviewees).
In further analysis we ran the test for significance of the covariates coefficients. The estimates of the significant covariates coefficients for LC-1P-RS-GRM-cov model based on the multinomial logit parametrization are given in Table 10. We observed that the significant covariates are typical family, socio-economic group, big city. The effects of the family type covariate on the logarithm of the probability of being in class 2 with respect to class 1 equals to δ ^ h 2 = 0.352 . Since, the latent classes of respondents are ordered from that with the lowest to that with the highest level of income perception and two estimates (for s = 2 and s = 3 ) of the parameters for this covariate are negative (−0.352, −0.537 ), as the number of children increases the level of income satisfaction decreases.
Similarly, all the estimates of the parameters for the socio-economic status covariate are also negative. Respondents with other socio-economic status then employees have a lower financial perception (are characterized by the lower level of the latent trait).
Furthermore, the analysis of the estimates for the place of living covariate leads to the similar conclusions. As the size of the place of living decreases, the the level of perceived income perception also decreases (big city is assumed as the first, reference category).
Similar findings for the socio-demographic features were obtained in the results for LC-cov. Note that the interpretation parameters is not always easy. Therefore, the prior probabilities at varying levels of covariates are ofently depicted on Figures similar to those given in Figure 2, Figure 3 and Figure 4 (see i.e., [98]) or the estimates of individual weights for different pattern of covariates are compared.
Finally, we have considered also LC-1P-RS-GRM model with covariates based on the global logit parameterization (see Equation (8)). The global logit parameterization is more parsimonious compared to multinomial logit parameterization and the interpretation of the effect of covariates is easier (there is a single regression parameter of each covariate). The estimates of the significant covariates coefficients for LC-1P-RS-GRM model based on the global logit parametrization are given in Table 11. Similarly, the covariates have a significant, negative effect on the financial satisfaction level. Households with the higher-level category assigned (as referred to the first) report worse financial satisfaction.
For a better interpretation of results, on the basis of the estimated model the probabilities of belonging to the latent classes ( π ^ s , s = 1 , 2 , 3 ) for different patterns of covariates (see Table 12) may be assessed. Estimated π ^ s ( z ) allow for several types of prediction. For instance, respondent living in other family type, being retired and resident of countryside has the smallest chance to achieve the highest level of income perception (to be assigned to the class 3). The same probability rises slightly to 7.1% for famers (living also in other family type and in rural area of Poland). The probability to achieve the highest satisfaction level is the highest for employee, having no children and living in big city. The probability to achieve the highest satisfaction level ranges from 3.8% to 49.1%. As far as the second group is concerned, the highest chance of belonging is observed for employees with one children, living in the smallest towns or villages.
We observed that the predicted values are slightly different for global logit parameterization but generally lead to the same conclusion.
5. Discussion

In this article we provide a strategy to analyze heterogenous socio-economic longitudinal data in order to identify groups of Poles whose response patterns are similar in following years and characterize them in terms of covariates. We use and compare the results for LC and different types of polytomous LC-IRT models for the Polish social survey data in years 2000–2015.
The methodologies presented in other works concerning Polish perception of financial well-being accounts only for observed questionnaire response variables in the one year [78] and in the specified subsamples of Poles living in 10-th biggest Polish cities [68], in rural areas of Poland [69], the group of young people’s households [70] or the group of internet users [79]. Those studies based mainly on different types of regression analysis or are limited to regular summary statistics tables [99].
Similarly, studies presented for other representative surveys for Russian households [71], Slovenian households [72] or Malaysian households [73] assuming the homogeneity of the analyzed sample and are limited to one year analysis. The presented results might be perceived as showing to narrow picture of financial wellbeing in the analyzed societies (see [73] p. 722).
Contrary to previous researches, we show that the analyzed (heterogenous) survey data can be explained by three latent class LC-1P-RS-GRM model with different levels of self-reported income satisfaction additionally influenced by family type, place of living and socio-economic status of the analyzed households. The model with constraint difficulty and discrimination indices allows for better computational efficiency (parameter reduction) compared to regular LC model and the estimated support points improve the interpretation results. The depicted latent trait levels might be especially useful for the multivariate discrete heterogenous data described by many classes, being helpful in cluster labelling stage of structures identification. Furthermore, the IRT under LC class model approach provides item-level analysis, which gives insight into individual items and scales of the questionnaire. In this regard, we positively verified the hypothesis considering the relevant constraints and the potential interpretation of the estimated parameters of latent variable models in the analyzed issue concerning perception of income satisfaction in Poland.
It’s worth noting that, the class of LC-IRT models is more flexible because compared to traditional IRT models is not based on the restrictive assumption such as normality of the latent trait (is based on discreteness assumption) and at the same time allows also for multidimensional structure of it (see [39,100]). Those assumption may be especially useful in real data analyzes, described by many response variables where the normality and unidimensional assumptions of the latent trait (explicitly introduced) are very often restrictive to fulfill.
In accordance with Hypothesis H2, we confirmed that the extended versions of the latent class models shows even better measure of fit and allows for a more detailed analysis. We presented the estimated parameters of the considered covariates in a different ways and predicted the class memberships for Polish households characterized by different socio-economic features. We observed significant, negative effect on financial satisfaction level for all the analyzed covariates. We briefly recall only some of the results concerning Poles living on unearned sources, in other family types and families with more children, inhabitants of rural areas as being the most prone to belong to the group of those with the lowest income perception. Our results are consistent with [20], however the cited work is based on summary statistics only for the last two waves of the survey.
The adopted model accounts for heterogenous structure of the data measured at different points of time and item characteristics as well. Moreover, to the best of our knowledge, it is the first to apply latent variable model to evaluate financial assessment of Polish households, while at the same time, presenting socio-economic influences on the latent trait of interest and including survey weights, needed to compensate for the unequal probability of selection.

6. Conclusions

Building sustainable societies with a high quality of life and improving the quality of the social and natural environment is the essence of achieving sustainable development. Despite some positive signs toward reducing inequality and improving financial situations, inequality still persists especially in the lower-income country as Poland. Achieving sustainable development requires gaining enough confidence of the interrelated issues to actually begin making the necessary changes to make society more equal. Our work present the approach helping to evaluate the well-being of households measured in a long period of time. We identified different groups of Polish households and characterize especially the group of those with the most difficult financial situation. Moreover, providing the predicted values for different patterns of socio-economic features allow to better characterize especially families with the worst financial perception. Compared to most of the latest studies, our analysis is based on longitudinal data and enables to show the changes of attitudes among the society. The results may provide useful insight for policy makers in approaching the issue of income adequacy for income maintenance programs, formulate social policies enabling the protection of the individuals and social groups that are vulnerable to poverty and consequently may lead to social exclusion.
The detailed analysis of the estimated parameters achieved for LC-1P-RS-GRM may help to precisely address the needed policy reforms to different types of households. Note that, the 500 Plus family program, launched in April 2016, significantly reduces the scale of the socially and economically disadvantageous phenomenon, i.e., the current lowest income satisfaction in many families with more children. Although the improving tendency might be observed, the targeted policy should be delivered especially to identified group of the worst situated more children and non-family households living on unearned sources in small towns, residents of countrysides.
Despite efforts to provide a complete picture of the Polish financial well-being this study is still subject to some limitations. Firstly, based on household self-reported responses provided in all available waves (2000–2015), it does not reflect the current state of the household situation (data were not collected in the following waves, i.e., 2017, 2019). Secondly, the study provides results based on socio-economic features not changing with time.
Therefore, in future work we aim to apply the dynamic variant of latent class model, in which subjects are allowed to move between the latent classes during the period of observation. Accordingly, we are going to apply the adopted LM model incorporating survey weights and including time-varying socio-economic features. This type of model enable to better characterize the group of households being stable with their opinion or prone to switch i.e., from group of households generally satisfied to those with the worst position in the analyzed period of time.

Funding

This research was funded by the National Science Centre, Poland, the research grant SONATA 12, UMO-2016/23/D/HS4/00989, “Latent variable models in the identification of homogenous structures in socio-economic longitudinal data”.

Data Availability Statement

The public dataset and more information can be found at http://www.diagnoza.com/index-en.html (accessed on 1 May 2020).

Conflicts of Interest

The author declares no conflict of interest.

References

  1. United Nations General Assembly. Report of the world commission on environment and development: Our common future. In Oslo, Norway: United Nations General Assembly, Development and International Co-Operation: Environment; Oxford University Press: Oxford, UK, 1987. [Google Scholar]
  2. Dernbach, J.C. Achieving sustainable development: The Centrality and multiple facets of integrated decisionmaking. Indiana J. Glob. Leg. Stud. 2003, 10, 247–285. [Google Scholar] [CrossRef]
  3. Cerin, P. Bringing economic opportunity into line with environmental influence: A Discussion on the Coase theorem and the Porter and van der Linde hypothesis. Ecol. Econ. 2006, 56, 209–225. [Google Scholar] [CrossRef]
  4. Dalal-Clayton, B.; Bass, S. National Strategies for Sustainable Development: The Challenge Ahead; Environmental Planning Issues, International Institute for Environment and Development: London, UK, 2000; Volume 25. [Google Scholar]
  5. Kruja, A.D. Sustainable Economic Development, a Necessity of the 21st Century. Mediter. J. Soc. Sci. 2013, 4, 93–98. [Google Scholar] [CrossRef] [Green Version]
  6. Barrington-Leigh, C. Sustainability and Well-Being: A Happy Synergy. Development 2016, 59, 292–298. [Google Scholar] [CrossRef]
  7. United Nations. The 2030 Agenda for Sustainable Development, A/RES/70/1. Available online: https://sustainabledevelopment.un.org/content/documents/21252030%20Agenda%20for%20Sustainable%20Development%20web.pdf (accessed on 9 March 2021).
  8. Stanescu, S.-G.; Paduraru, A.; Comandaru, A.M. The role of the accounting profession in achieving the objectives of sustainable development. Ann. Constantin Brancusi Univ. Targu Jiu Econ. Ser. 2018, 3, 117–122. [Google Scholar]
  9. Choi, S. Is the Current Trend of Income Inequality Sustainable? Sustainability 2019, 11, 5329. [Google Scholar] [CrossRef] [Green Version]
  10. Piketty, T. Putting distribution back at the center of economics: Reflections on capital in the twenty-first century. J. Econ. Perspect. 2015, 29, 67–88. [Google Scholar] [CrossRef] [Green Version]
  11. Carvalho, L.; Rezai, A. Personal income inequality and aggregate demand. Camb. J. Econ. 2015, 40, 491–505. [Google Scholar] [CrossRef]
  12. European Commission. Eurostat Subjective Well-Being—Statistics. 2019. Available online: https://ec.europa.eu/eurostat/statistics-explained/index.php?title=Subjective_well-being_-_statistics#Life_satisfaction_and_income (accessed on 26 August 2020).
  13. Diego-Rosell, P.; Tortora, R.; Bird, J. International determinants of subjective well-being: Living in a subjectively material world. J. Happiness 2018, 19, 123–143. [Google Scholar] [CrossRef]
  14. Piosik, A.; Strojek-Filus, M.; Sulik-Górecka, A.; Szewieczek, A. Gender and Age as Determinants of Job Satisfaction in the Accounting Profession: Evidence from Poland. Sustainability 2019, 11, 3090. [Google Scholar] [CrossRef] [Green Version]
  15. Bogumił, P.; Wielkedek, R. Securing Poland’s economic success: A good time for reforms. ECFIN Country Focus 2014, 9, 1–8. [Google Scholar]
  16. Bogdan, W.; Boniecki, D.; Labaye, E.; Marciniak, T.; Nowacki, M. Poland 2025: Europe’s New Growth Engine; McKinsey & Company: Warsaw, Poland, 2015. [Google Scholar]
  17. Gomułka, S. Poland’s economic and social transformation 1989–2014 and contemporary challenges. Cent. Bank Rev. 2016, 16, 19–23. [Google Scholar] [CrossRef] [Green Version]
  18. Grejcz, K.; Żółkiewski, Z. Household wealth in Poland: The results of a new survey of household finance. Bank Credit 2017, 48, 295–326. [Google Scholar]
  19. Brzeziński, M.; Jancewicz, B.; Letki, N. Growing Inequalities and Their Impacts in Poland. 2013. Available online: http://gini-research.org/system/uploads/450/original/Poland.pdf?1370090614 (accessed on 9 March 2021).
  20. Panek, T.; Czapiński, J. Household living conditions. Income and income management. Social Diagnosis 2015, The Objective and Subjective Quality of Life in Poland. Contemp. Econ. 2015, 9, 461–464. [Google Scholar]
  21. Brzeziński, M.; Myck, M.; Najsztub, M. Reevaluating distributional consequences of the transition to market economy in Poland: New results from combined household survey and tax return data. WNE Work. Pap. 2019, 8, 1–107. [Google Scholar] [CrossRef] [Green Version]
  22. Brzeziński, M.; Myck, M.; Najsztub, M. Income Inequality in Transition. New Results for Poland Combining Survey and Tax Return Data. Policy Brief. 2020. Available online: https://freepolicybriefs.org/2020/01/13/income-inequality-in-transition-new-results-for-poland-combining-survey-and-tax-return-data/ (accessed on 11 March 2021).
  23. European Commission. Eurostat—Average Rating of Satisfaction by Domain, Sex, Age and Educational Attainment Level. 2021. Available online: https://ec.europa.eu/eurostat/databrowser/view/ilc_pw01/default/table?lang=en (accessed on 26 August 2020).
  24. Czapinski, J.; Panek, T. (Eds.) Social Diagnosis. In Objective and Subjective Quality of Live in Poland; Social Monitoring Council: Warszawa, Poland, 2015; Available online: http://www.diagnoza.com/index-en.html (accessed on 1 May 2020).
  25. Furnham, A.; Argyle, M. Psychology of Money; Routledge: London, UK, 1998. [Google Scholar]
  26. Tang, T.L.-P. The development of a short money ethic scale: Attitudes toward money and pay satisfaction revisited. Pers. Individ. Differ. 1995, 19, 809–816. [Google Scholar] [CrossRef]
  27. Tang, T.L.-P.; Luna-Arocas, R.; Sutarso, T.; Tang, D.S.-H. Does the love of money moderate and mediate the income-pay satisfaction relationship? J. Manag. Psychol. 2004, 19, 111–135. [Google Scholar] [CrossRef]
  28. Yamauchi, K.; Templer, D. The development of a money attitudes scale. J. Pers. Assess. 1982, 46, 522–528. [Google Scholar] [CrossRef]
  29. Clark, A.E.; Oswald, A.J. Satisfaction and comparison income. J. Pub. Econ. 1996, 61, 359–381. [Google Scholar] [CrossRef] [Green Version]
  30. Diener, E.; Diener, M.; Diener, C. Factors predicting the subjective well-being of nations. J. Pers. Soc. Psychol. 1995, 69, 851–864. [Google Scholar] [CrossRef]
  31. Pravitz, A.D.; Garman, E.T.; Sorhaindo, B.; O’Neill, B.; Kim, J.; Drentea, P. InCharge Financial Distress/Financial Well-Being Scale: Development, administration, and score interpretation. Financ. Couns. Plan 2006, 17, 34–50. [Google Scholar]
  32. Lazarsfeld, P.F.; Henry, N.W. Latent Structure Analysis; Houghton Mifflin: Boston, MA, USA, 1968. [Google Scholar]
  33. Goodman, L.A. Exploratory latent structure analysis using both identifiable and unidentifiable models. Biometrika 1974, 61, 215–231. [Google Scholar] [CrossRef]
  34. Dayton, C.M.; Macready, G.B. Concomitant-variable latent-class models. J. Am. Stat. Assoc. 1988, 83, 173–178. [Google Scholar] [CrossRef]
  35. Bandeen-Roche, K.; Miglioretti, D.L.; Zeger, S.L.; Rathouz, P.J. Latent variable regression for multiple discrete outcomes. J. Am. Stat. Assoc. 1997, 92, 123–135. [Google Scholar] [CrossRef]
  36. Vermunt, J.K. Latent class modeling with covariates: Two improved three-step approaches. Polit. Anal. 2010, 18, 450–469. [Google Scholar] [CrossRef] [Green Version]
  37. Hambleton, R.K.; Swaminathan, H. Item Response Theory: Principles and Applications; Springer: Berlin, Germany, 1985. [Google Scholar]
  38. Bartolucci, F.; Bacci, S.; Gnaldi, M. Statistical Analysis of Questionnaires. A Unified Approach Based on R and Stata; Chapman and Hall/CRC: Boca Raton, FL, USA, 2015. [Google Scholar]
  39. Bacci, S.; Bartolucci, F.; Gnaldi, M. A class of Multidimensional Latent Class IRT models for ordinal polytomous item responses. Commun. Stat. Theor. Method 2014, 43, 787–800. [Google Scholar] [CrossRef] [Green Version]
  40. Kalton, G. Modeling considerations: Discussion from a survey sampling perspective. In Panel Surveys; Kasprzyk, D., Duncan, G., Kalton, G., Singh, M., Eds.; Wiley: New York, NY, USA, 1989; pp. 575–585. [Google Scholar]
  41. Stiglitz, J.E.; Sen, A.; Fitoussi, J.P. Mismeasuring our Lives Why GDP Doesn’t Add Up; The New Press: New York, NY, USA, 2010. [Google Scholar]
  42. Fleurbaey, B. Beyond GDP: The Quest for a Measure of Social Welfare. J. Econ. Lit. 2009, 74, 1029–1075. [Google Scholar] [CrossRef]
  43. Stundziene, A. Human Welfare: Can We Trust What They Say? J. Happiness Study 2019, 20, 579–604. [Google Scholar] [CrossRef]
  44. Bleys, B. Beyond GDP: Classifying alternative measures for progress. Soc. Indic. Res. 2012, 109, 355–376. [Google Scholar] [CrossRef]
  45. Stevenson, B.; Wolfers, J. Economic growth and subjective well-being: Reassessing the Easterlin paradox. NBER Work. Pap. 2008, 14282, 1–30. [Google Scholar]
  46. Van den Bergh, J.C.J.M. The GDP paradox. J. Econ. Psychol. 2009, 30, 117–135. [Google Scholar] [CrossRef]
  47. Kábat, L. Příjmová situácia a životná podmienky obyvatel’stva Slovenska podl’a štatistiky SILC (Income Situation and Living Situation in Slovakia). Slov. Štat. Demogr. 2007, 3, 36. [Google Scholar]
  48. Stiglitz, J.E. The Stiglitz Report; The New Press: New York, NY, USA; London, UK, 2010. [Google Scholar]
  49. Michalos, A.C. What did Stiglitz, Sen and Fitoussi get right and what did they get wrong? Soc. Indic. Res. 2011, 102, 117–129. [Google Scholar] [CrossRef]
  50. Binder, M. Subjective Well-Being Capabilities: Bridging the Gap between the Capability Approach and Subjective Well-Being Research. J. Happiness 2014, 15, 1197–1217. [Google Scholar] [CrossRef] [Green Version]
  51. Binder, M.; Witt, U. As innovations drive economic growth, do they also raise well-being? Pap. Econ. Evol. 2011, 1105, 1–19. [Google Scholar]
  52. Angner, E. Are subjective measures of well-being ‘direct’? Aust. J. Philos. 2010, 89, 115–130. [Google Scholar] [CrossRef]
  53. Binder, M.; Ward, F. The structure of subjective well-being: A vector autoregressive approach. Metroeconomica 2013, 64, 361–400. [Google Scholar] [CrossRef]
  54. Consumer Financial Protection Bureau. Financial Well-Being: The Goal of Financial Education; Report; Consumer Financial Protection Bureau: Iowa City, IA, USA, 2015.
  55. Rao, A.; Barber, B.L. Financial well-being: Descriptors and pathways. In Take Charge America Institute (TCAI) Working Paper 5-2; TCAI: Tucson, AZ, USA, 2005. [Google Scholar]
  56. Sabri, M.F.; Falahati, L. Estimating a model of subjective financial well-being among college students. Int. J. Humanit. Soc. Sci. 2012, 14, 121–130. [Google Scholar]
  57. Sabri, M.F.; Hayhoe, C.R.; Goh, L.A. Attitudes, values and belief towards money: Gender and working sector comparison. Pertanika J. Soc. Sci. Humanit. 2006, 2, 191–199. [Google Scholar]
  58. Shim, S.; Xiao, J.J.; Barber, B.L.; Lyons, A.C. Pathways to life success: A conceptual model of financial well-being for young adults. J. Appl. Dev. Psychol. 2009, 30, 708–723. [Google Scholar] [CrossRef]
  59. Delafrooz, N.; Paim, L.H. Determinants of financial wellness among Malaysia workers. Afr. J. Bus. Manag. 2011, 5, 10092–10100. [Google Scholar]
  60. Joo, S.H.; Grable, J.E. An exploratory framework of the determinants of financial satisfaction. J. Fam. Econ. Issues 2004, 25, 25–50. [Google Scholar] [CrossRef]
  61. Gerrans, P.; Speelman, C.; Campitelli, G. The relationship between personal financial wellness and financial well-being: A structural equation modelling approach. J. Fam. Econ. Issues 2014, 35, 145–160. [Google Scholar] [CrossRef] [Green Version]
  62. Gasiorowska, A. The relationship between objective and subjective wealth is moderated by financial control and mediated by money anxiety. J. Econ. Psychol. 2014, 43, 64–74. [Google Scholar] [CrossRef]
  63. Grable, J.E.; Cupples, S.; Fernatt, F.; Anderson, N. Evaluating the link between perceived income adequacy and financial satisfaction: A resource deficit hypothesis approach. Soc. Indic. Res. 2013, 114, 1109–1124. [Google Scholar] [CrossRef]
  64. Sahi, S.K. Psychological biases of individual investors and financial satisfaction. J. Consum. Behav. 2017, 16, 511–535. [Google Scholar] [CrossRef]
  65. Christoph, B. The relation between life satisfaction and the material situation: A re-evaluation using alternative measures. Soc. Indic. Res. 2010, 98, 475–499. [Google Scholar] [CrossRef]
  66. Porter, N.M.; Garman, E.T. Testing a conceptual model of financial well-being. Financ. Counsel. Plan. 1993, 4, 135–164. [Google Scholar]
  67. Cantril, H. The Pattern of Human Concerns; Rutgers University Press: Brunswick, NJ, USA, 1965. [Google Scholar]
  68. Zalega, T. Diagnoza sytuacji materialnej polskich gospodarstw domowych w okresie kryzysu finansowo-ekonomicznego. Manag. Bus. Adm. Cent. Eur. 2012, 118, 50–82. [Google Scholar] [CrossRef]
  69. Kalinowski, S.; Kozera-Kowalska, M. Samoocena sytuacji dochodowej ludności wiejskiej o niepewnych dochodach. Self-Assessment of the Income Situation of the Rural Population with Precarious Income. Handel Wewnętrzny 2017, 4, 110–121. [Google Scholar]
  70. Wałęga, A. Sytuacja materialna a konsumpcja gospodarstw domowych ludzi młodych w Polsce. Konsumpcja Rozwój 2015, 2, 61–73. [Google Scholar]
  71. Popova, D.; Pishniak, A. Measuring Individual Material Well-Being Using Multidimensional Indices: An Application Using the Gender and Generation Survey for Russia. Soc. Indic. Res. 2017, 130, 883–910. [Google Scholar] [CrossRef] [Green Version]
  72. Verbič, M.; Stanovnik, T. Analysis of Subjective Economic Well-Being in Slovenia. East. Eur. Econ. 2006, 44, 60–70. [Google Scholar] [CrossRef]
  73. Mahdzan, N.S.; Zainudin, R.; Sukor, M.E.A.; Zanir, F.; Ahmad, W.M.W. Determinants of Subjective Financial Well? Being Across Three Different Household Income Groups in Malaysia. Soc. Indic. Res. 2019, 146, 699–726. [Google Scholar] [CrossRef]
  74. Ernst, L. Weighting Issues for Longitudinal Household and Family Estimates; Kasprzyk, D., Duncan, G., Kalton, G., Singh, M.P., Eds.; Panel Survey; Wiley: New York, NY, USA, 1989; Volume 19, pp. 139–159. [Google Scholar]
  75. Verma, V.; Betti, G.; Ghellini, G. Cross-sectional and longitudinal weighting in a rotational household panel: Applications to EU-SILC. Stat. Transit. 2007, 8, 5–50. [Google Scholar]
  76. Genge, E. Graphical tools of discrete longitudinal data presentation in R. Econ. Adv. Appl. Data Anal. 2019, 23, 26–39. [Google Scholar] [CrossRef] [Green Version]
  77. Jajuga, K. Statystyczna Analiza Wielowymiarowa; PWN: Warszawa, Poland, 1993. [Google Scholar]
  78. Hanusik, K.; Łangowska-Szczęśniak, U. Uwarunkowania samooceny sytuacji materialnej gospodarstw domowych w Polsce w 2011 r (Determinants of Self-Assessment of Households’ Material Situation in Poland in 2011). Konsumpcja Rozwój 2013, 1, 83–98. [Google Scholar]
  79. Gasiorowska, A. The impact of money attitudes on the relationship between income and financial satisfaction. Pol. Psychol. Bull. 2015, 46, 197–208. [Google Scholar] [CrossRef]
  80. Formann, A.K. (Almost) equivalence between conditional and mixture maximum likelihood estimates for some models of the Rasch type. In Multivariate and Mixture Distribution Rasch Models; Von Davier, M., Carstensen, C., Eds.; Springer: New York, NY, USA, 2007; pp. 177–189. [Google Scholar]
  81. Bartolucci, F. A class of multidimensional IRT models for testing unidimensionality and clustering items. Psychometrika 2007, 72, 141–157. [Google Scholar] [CrossRef]
  82. Von Davier, M. A general diagnostic model applied to language testing data. Br. J. Math. Stat. Psychol. 2008, 61, 287–307. [Google Scholar] [CrossRef] [PubMed]
  83. Van der Linden, W.; Hambleton, R.K. Handbook of Modern Item Response Theory; Springer: Berlin, Germany, 1997. [Google Scholar]
  84. Nering, M.L.; Ostini, R. Handbook of Polytomous Item Response Theory Models; Taylor and Francis: New York, NY, USA, 2010. [Google Scholar]
  85. Samejima, F. Estimation of ability using a response pattern of graded scores. Psychometrica 1969, 34, 1–97. [Google Scholar] [CrossRef]
  86. Muraki, E. A generalized partial credit model: Application of an EM algorithm. Appl. Psycholog. Measur. 1992, 16, 159–176. [Google Scholar] [CrossRef]
  87. Masters, G. A Rasch model for partial credit scoring. Psychometrika 1982, 47, 149–174. [Google Scholar] [CrossRef]
  88. Andrich, D. A rating formulation for ordered response categories. Psychometrika 1978, 43, 561–573. [Google Scholar] [CrossRef]
  89. Muraki, E. Fitting a polytomous item response model to Likert-type data. Appl. Psycholog. Measur. 1990, 14, 59–71. [Google Scholar] [CrossRef] [Green Version]
  90. Muraki, E. A generalized partial credit model. In Handbook of Modern Item Response Theory; Van der Linden, W., Hambleton, K.R., Eds.; Springer: New York, NY, USA, 1997; pp. 153–164. [Google Scholar]
  91. Van der Ark, L.A. Relationships and properties of polytomous Item Response Theory models. Appl. Psycholog. Measur. 2001, 25, 273–282. [Google Scholar] [CrossRef] [Green Version]
  92. Genge, E. IRT and LC-IRT models for items with ordinal polytomous responses. Econometrics 2017, 4, 62–76. [Google Scholar] [CrossRef] [Green Version]
  93. Dempster, A.P.; Laird, N.M.; Rubin, D.B. Maximum Likelihood from Incomplete Data via the EM Algorithm (with discussion). J. R. Stat. Soc. B 1977, 39, 1–38. [Google Scholar]
  94. Bartolucci, F.; Bacci, S.; Gnaldi, M. MultiLCIRT: An R package for multidimensional latent class item response models. Comput. Stat. Data Anal. 2014, 71, 971–985. [Google Scholar] [CrossRef] [Green Version]
  95. Bartolucci, F.; Bacci, S.; Gnaldi, M. MultiLCIRT: Multidimensional Latent Class Item Response Theory Models. R package Version 2.10. 2016. Available online: http://CRAN.R-project.org/package=MultiLCIRT (accessed on 10 September 2020).
  96. Akaike, H. Information Theory as an Extension of the Maximum Likelihood Principle. In Second International Symposium on Information Theory; Petrov, B.N., Csaki, F., Eds.; Akademiai Kiado: Budapest, Hungary, 1973; pp. 267–281. [Google Scholar]
  97. Schwarz, G. Estimating the Dimension of a Model. Ann. Stat. 1978, 6, 461–464. [Google Scholar] [CrossRef]
  98. Genge, E. LC-IRT models with covariates in polish job satisfaction analysis. Argum. Oecon. 2020, 1, 207–226. [Google Scholar] [CrossRef]
  99. Gasińska, M. Dochody gospodarstw domowych w Polsce–wybrane obiektywne i subiektywne ujęcia i dane. (Incomes of Households in Poland—The Selected Objective and Subjective Approaches and Data). Zeszyty Naukowe Uczelni Vistula 2016, 50, 100–142. [Google Scholar]
  100. Genge, E. Teoria reakcji na pozycję w podejściu modelowym w taksonomii (Item response theory in model-based clustering). Econometrics 2016, 1, 9–19. [Google Scholar] [CrossRef]
Figure 1. Path diagram for LC model.
Sustainability 13 04130 g001
Figure 2. Estimated prior probabilities according to the family type under the selected LC model with 3 classes, covariates, and multinomial logit link function.
Sustainability 13 04130 g002
Figure 3. Estimated prior probabilities according to the socio-economic status under the selected LC model with 3 classes, covariates, and multinomial logit link function.
Sustainability 13 04130 g003
Figure 4. Estimated prior probabilities according to the place of living under the selected LC model with 3 classes, covariates, and multinomial logit link function.
Sustainability 13 04130 g004
Figure 5. Estimated conditional probabilities showed according to the latent classes for LC-1P-RS-GRM-cov.
Sustainability 13 04130 g005
Figure 6. Estimated standardised support points and prior probabilities under the LC-1P-RS-GRM with 3 classes and covariates (the number in each circle indicates the latent class and its surface is proportional to its average prior probability).
Sustainability 13 04130 g006
Table 1. Weighted frequency distributions for each response variable (%) and weighted average scores ( X ¯ j ).
Year x = 0 x = 1 x = 2 x = 3 x = 4 X ¯ j
200031.2727.1928.1112.640.792.24
200326.7829.5230.529.913.262.33
200525.2022.7337.3312.991.752.43
200722.8124.7726.0823.552.792.59
200916.4922.0533.2123.135.122.78
201119.1512.4138.9125.813.722.83
201319.3214.0744.2718.543.802.73
201512.0414.9139.0129.524.522.99
Table 2. Unidimensional IRT models for Ordinal Polytomous Responses.
α j ϑ jx Parameters of the ModelGlobalLocal
freefree α j ( θ ϑ j x ) GRMGPCM
freeconstrained α j [ θ ( ϑ j + τ x ) ] RS-GRMRS-GPCM
constrainedfree θ ϑ j x 1P-GRMPCM
constrainedconstrained θ ( ϑ j x + τ x ) 1P-RS-GRMRSM
Source: (see [38] p. 127)
Table 3. Information criteria, log-likelihood values ( ^ ), number of parameters (#par) for basic LC models.
s ^ #par BIC AIC
1−3570.485327325.0077204.970
2−3176.866656727.5576483.732
3−3020.356986604.3256236.712
4−2947.9141316649.2306157.828
5−2945.8891646834.9676219.777
6−2922.8721976978.7226239.744
7−2932.4952307187.7566324.989
8−2902.2872637317.1296330.575
Table 4. Estimates of the conditional response probabilities ϕ j x under LC model with 3 classes and covariates (LC-cov).
ϕ jx
jsx = 0x = 1x = 2x = 3x = 4 ϕ js
10.6000.2900.1100.0000.0001.510
120.2580.3070.3710.0610.0032.245
30.0660.1350.2520.5130.0343.314
10.5680.3300.0830.0190.0001.553
220.1960.3540.4060.0280.0172.316
30.0560.0620.3170.4360.1303.522
10.5600.2840.1380.0170.0001.613
320.1890.2510.5090.0320.0192.443
30.0000.0730.2950.5940.0383.597
10.6240.2520.1110.0100.0031.515
420.1150.3070.3890.1840.0042.655
30.0000.0580.0820.7220.1383.939
10.5120.3830.1050.0000.0001.592
520.0470.2150.5150.2230.0002.914
30.0250.0000.0990.5920.2844.111
10.6480.2300.1230.0000.0001.475
620.0320.1150.6200.2100.0243.080
30.0230.0000.0630.7810.1323.999
10.6590.2430.0930.0000.0041.447
720.0370.1380.6540.1710.0002.960
30.0000.0000.2960.5000.2043.908
10.3920.2610.3180.0300.0001.984
820.0320.1440.4840.3070.0333.166
30.0000.0010.2060.6460.1473.939
Table 5. Estimates of the prior probabilities π ^ s under LC-cov.
s π ^ s
10.254
20.576
30.169
Table 6. Graded response and partial credit type models with s = 3 .
Model ^ # par BIC AIC
Global−3063.398436374.0966212.796
Local−3068.946436385.1936223.893
Table 7. The BIC, AIC values for LC and LC-IRT models with s = 3 .
Model ^ # par BIC AIC
LC−3020.356986604.3256236.712
LC-cov−2995.0331046588.1876198.067
LC-GRM−3063.398436374.0966212.796
LC-1P-GRM−3080.469366367.9796232.937
LC-RS-GRM−3104.905226336.3356253.810
LC-1P-RS-GRM−3112.020156310.3076254.040
LC-GPCM−3068.946436385.1936223.893
LC-RS-GPCM−3096.776226320.0776237.551
LC-PCM−3084.405366375.8526240.810
LC-RSM−3116.456156319.1796262.912
LC-1P-RS-GRM-cov−3089.913216300.5996221.825
Table 8. Estimated standardised support points and average prior probabilities under the LC-1P-RS-GRM with 3 classes and covariates.
Class 1Class 2Class 3
ξ ^ s −1.3260.1651.828
π ^ s ( z ) 0.2770.5740.149
Table 9. Estimated standardised difficulty parameters under the LC-1P-RS-GRM with 3 classes and covariates.
Item τ 1
X 1 −0.687
X 2 −0.794
X 3 −0.921
X 4 −1.145
X 5 −1.435
X 6 −1.462
X 7 −1.331
X 8 −1.701
Table 10. The estimates of the covariates coefficients for LC-1P-RS-GRM with 3 classes and covariates based on the multinomial logit parametrization.
Covariate δ ^ h 2 δ ^ h 3
typical family−0.352−0.537
socio economic group−0.425−0.544
big city−0.142−0.764
Table 11. The estimates of the covariates coefficients for LC-1P-RS-GRM with 3 classes and covariates based on the  global logit parametrization.
Covariate δ ^ h
typical family−0.337
socio economic group−0.382
big city−0.379
Table 12. The estimates of individual weights π ^ s i , s = 1 , 2 , 3 for different values of covariates, for LC-GRM model with s = 3 based on the multinomial and global logit parametrization.
CovariateMultinomialGlobal
FamilyStatusPlace π ^ 1 i π ^ 2 i π ^ 3 i π ^ 1 i π ^ 1 i π ^ 3 i
1110.0380.4710.4910.0520.4570.491
1120.0560.6050.3380.0740.5280.398
1420.1930.5800.2270.2020.6250.173
2110.0580.5050.4370.0720.5210.408
2120.0830.6260.2910.1010.5790.320
2130.1090.7130.1780.1410.6150.244
3110.0870.5310.3820.0970.5730.329
3130.1520.7020.1460.1870.6260.187
3330.3030.5990.0980.3310.5720.097
4120.1680.6300.2020.1810.6260.193
4230.2900.6160.0940.3210.5780.101
5230.3730.5560.0710.3990.5270.074
5430.5870.3750.0380.5880.3770.036
Publisher’s Note: MDPI stays neutral with regard to jurisdictional claims in published maps and institutional affiliations.