Abstract
The bicycle is a healthy and sustainable transport mode due to its emission-free characteristics. To increase bicycle use, it is fundamental to provide bicycle-friendly environments. To better monitor bicycle environments, this study proposed the concept of bicycling environment quality (BEQ), which was defined by perceived satisfaction and conflict level. Data collection was conducted at 19 road segments in five sites located in Beijing, China. Then, speed-related and acceleration-related bicycling behavior indicators (BBIs) were extracted from data collected using sensors on mobile phones, while bicycling environment indicators (BEIs), such as bicycle flow, were extracted from recorded data. Taking the BBIs and BEIs as input attributes, a two-level BEQ classification assessment model based on a random forest (RF) algorithm was constructed. The proposed RF-based classification assessment model was able to produce approximately 77.35% overall correct classification. The results demonstrate the feasibility of using GPS data in evaluating BEQ. In addition, a novel dockless bicycle-sharing system (DBS)-based framework for bicycle traffic monitoring is discussed, which is of great significance in the sustainable development of bicycles. This study provides a theoretical method for objective BEQ assessment. It can further be used by planners and road administrators to monitor and improve BEQ and by individual cyclists for optimal route choice.
1. Introduction
The bicycle is a healthy and sustainable transport mode due to its emission-free characteristics. In addition to its contributions to improving physical wellness and air quality, bicycle use can also meet residents’ needs for short-distance trips of less than 5 km and subway connection trips, which is helpful in alleviating traffic congestion [1,2,3,4]. As a means for day-to-day travel, bicycles are also an important tool for residents’ lives and leisure [4].
Given the benefits, most governments have strategies to encourage transport cycling. The most effective strategies are those that create supportive bicycle environments. In Europe and North America, the most common intervention to increase cycling rates has been increasing and improving bicycle paths and lanes [5]. Countries like Denmark and the Netherlands, which have invested the most in developing the safest bicycle facilities as part of comprehensive suites of measures to create supportive environments, have >25% of their population cycling regularly for transport [6]. In contrast, in Australia, which is only starting to use best practices to develop supportive environments, <2% of the population cycles for transport [7]. Bicycle use in Beijing has significantly decreased over the past 30 years (Figure 1). In recent years, Beijing has gradually started to pay attention to bicycle trips and adopt measures such as increasing bicycle lanes and improving bicycle environments. The proportion of bicycle trips in Beijing has increased from 10.3% to 12.1% under the influence of these measures and with the operation of shared bikes since 2016 (Figure 1) [8]. Therefore, a friendly bicycling environment is very important to increase bicycle use.
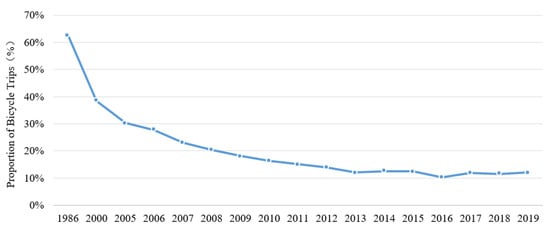
Figure 1.
Proportion of bicycle trips in Beijing.
How can one tell whether a bicycling environment is good or bad? Significant research efforts have been conducted in evaluating bicycling environments over the last three decades [9]. Davis et al. proposed a bicycle safety index rating (BSIR) model based on the subjective perception of road environmental facilities [10]. Sorton et al. focused on different bicycle infrastructures and established bicycle stress levels ranging from 1 to 5 [11]. The influencing factors include curb lane traffic volume, speed of motor vehicles, curb lane width, number of commercial drives per mile along the street, parking turnover and percentage of heavy vehicles using the road. Landis et al. proposed another method to evaluate the cycling environment, a statistically calibrated bicycle level-of-service model based on users’ perceptions [12]. The study revealed that pavement conditions and striping of bicycle lanes are important factors in the quality of service. Li et al. explored the factors that contribute to bicyclists’ perception of comfort on physically separated bicycle paths [13]. The results showed that physical environmental factors significantly influenced bicyclists’ perception of comfort, including bicycle pathway width, shoulder width, the presence of grades, the presence of a bus stop, the surrounding land use and the flow rate of electric and conventional bicycles. The San Francisco Department of Public Health Environmental Health Section developed the Bicycle Environmental Quality Index with a quantitative observational survey [14]. This index assesses the bicycle environment on roadways. The index was created by 21 empirically based indicators which embody five categories of important physical, environmental factors for bicyclists: intersection safety, vehicle traffic, street design, safety and land use; as the indicators include bicycle pavement treatment, number of vehicle lanes, traffic calming, bicycle facility width, connectivity, driveway cuts, bicycle signs, bicycle parking and land use.
However, in addition to the subjective feelings of cyclists, conflicts during cycling are also an important basis for dividing the level of road service [15]. Wang et al. established a service level evaluation model of shared pedestrian–cyclist infrastructure based on the number of traffic conflicts [16]. It can be used to judge whether a slow-moving road is suitable for sharing between pedestrians and non-motor vehicles.
Both infrastructure-based service level assessment and subjectively based service level assessment are limited in data acquisition. Compared to cycling, there have been too many investments into more dominant transport modes to make them smart and intelligent. Hence, Behrendt proposed the concept of smart velomobility, which is concerned with networked practices, systems and technologies around cycling [17].
In recent years, many studies have attempted to use global positioning systems (GPSs) to overcome the limitations of traditional data sources. Strauss extracted the deceleration rate of cyclists based on mobile GPS data and verified it with the observed number of injuries [18]. Bíl et al. developed a dynamic comfort index to evaluate the smoothness of surface pavement in cycling tracks based on GPS devices and accelerometers [19]. Portability of the dynamic comfort index was verified with the subjective feelings of 43 cyclists through questionnaires. Joo et al. used an instrumented probe bicycle equipped with GPS receiver, accelerator and gyro sensor to obtain data for evaluating bicycle performance in terms of safety and mobility [20]. Subsequently, using the GPS data of public bicycles, they developed a methodology for categorizing bicycling environments defined by the bicyclist’s perceived level of safety and comfort [21]. GPS-based bicycle speed and acceleration features were used as inputs for the proposed categorization algorithm. This study provides a novel approach to the connection between subjective perception and cycling behavior.
This study aimed at developing a methodology for evaluating the bicycling environmental quality in Beijing. Beijing has good bicycle lane conditions and bicycle space is reserved in planning and design. However, with rapid motorization, part of the bicycle road space is used for car parking. Motor vehicles in and out of parking spaces cause great interference to cycling. It is necessary to consider conflicts during the cycling process when assessing bicycle environments. Therefore, the concept of bicycling environmental quality (BEQ) is proposed in this article to assess the bicycle environment, taking into account both subjective satisfaction and objective conflict. Subjective satisfaction was obtained from questionnaires and objective conflict incidents were acquired from video recordings.
The popularity of bike-sharing in Beijing generates a large amount of GPS data, which can be used to obtain bicycling behaviors and assess BEQ. However, the accuracy of GPS data generated by bike-sharing is poor and far lower than that of mobile GPS data. In this study we attempted to acquire GPS data from smartphones, fixed on dockless shared bikes, to verify the feasibility of GPS data in evaluating BEQ. This can provide a theoretical framework for the application of GPS data generated by improved shared bicycles in the future.
Due to different bicycling environments leading to different bicycling experiences and behaviors, in this study we developed a methodology for categorizing bicycling environments evaluated by bicycling behavior indicators (BBIs) and bicycling environment indicators (BEIs). BBIs refer to the cycling speed and acceleration-related indicators extracted from GPS data obtained from a mobile phone mounted on a bike. BEIs refer to the bicycle traffic flow-related indexes obtained through surveys (they can also be obtained through video monitoring and other traffic monitoring methods). The study in this paper has significant advantages in terms of data acquisition and can provide a theoretical method for objective BEQ assessment.
2. Materials and Methods
2.1. Methodology
The first step in establishing a bicycle-friendly environment is to assess the BEQ. A classification assessment model for the BEQ using mobile sensor data and bicycle flow data was developed, which takes the BBIs and BEIs as input attributes. Our major concern was to verify the feasibility of using GPS data in assessing BEQ.
Figure 2 shows the research procedure, which consisted of three steps. The data used in this paper were obtained through a questionnaire survey, video recordings, GPS in smartphones and bicycle traffic flow observation. Next, features were measured from these data. The questionnaire survey was used to collect the subjectively perceived satisfaction of cyclists. Objective conflict incidents were obtained based on video recording data. The BBIs were extracted through GPS data from smartphones fixed on shared bikes. The BEIs were counted from the observed bicycle traffic flow. Then, subjective satisfaction and objective conflict incidents were comprehensively considered in order to calculate the BEQ index using the entropy method. Finally, taking the BBIs and BEIs as input attributes, a classification assessment model based on a random forest technique was constructed for identifying the bicycling environmental quality.
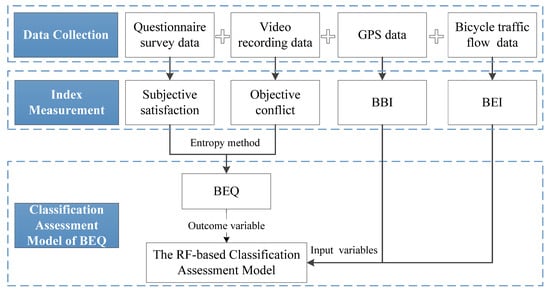
Figure 2.
Research procedure.
In previous studies, the perceived satisfaction of cyclists has been taken as the main indicator to measure the bicycling environment [21]. However, the BEQ is affected by many objective factors, especially conflict incidents during cycling. In this study, subjectively perceived satisfaction and the objective conflict incidents were comprehensively considered to calculate the BEQ index. Weights of both perceived satisfaction and conflict level were calculated with the entropy method. The entropy method is an objective weighting method, which can avoid the influence of human factors on the index weight. The entropy method evaluates value by measuring the degree of differentiation [22]. The higher the entropy, the more chaotic the data, the less information it carries, the smaller the utility value, and the smaller the weight.
This study used the random forest (RF) technique to construct a classification assessment model for BEQ. The BBIs and BEIs were used as inputs for the classification assessment model. The RF technique is a machine learning method that is considered one of the most efficient methods for evaluating the importance of variables [23]. Compared with traditional variable selection methods, such as the classification trees and stepwise regression techniques, the RF technique has the capability of handling the multicollinearity problem of candidate variables. It has demonstrated high capability in obtaining unbiased and stable results without a need for a separate cross-validation test dataset. Moreover, RFs run efficiently on a large dataset even with thousands of variables.
The RF technique consists of an ensemble of randomized classification and regression trees [24]. A predetermined number of classification and regression trees are generated randomly and aggregated to give one single prediction. When solving classification problems, the RF model chooses the classification with the most votes from all trees in the forest (Figure 3). The random forest method uses two measures to evaluate the importance of each variable based on the Gini index and the out-of-bag (OOB) error rate. In this study, the measure based on the Gini index was used to select the variables that contribute to the BEQ. The decrease in the Gini index for each node was calculated for the variable that was used to make the split. Then, the importance measure for a particular variable was given as the average decrease in the Gini index over all trees in the forest. The Gini index for a node t in a single tree can be calculated using Equation (1).
where denotes the Gini index for the node t; i represents the number of classes; and represents the estimated class probabilities.
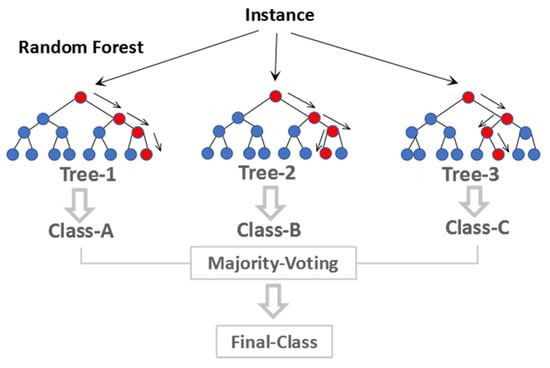
Figure 3.
Random forest simplified.
In this paper, rapid miner software was used to establish a classification assessment model of BEQ; this software consists of several operators. First, the “Read Excel” operator was used for loading model data. The second was the “Filter Examples” operator, used to filter invalid data; the third operator, “Cross-Validation”, was the core operator in the model. In this operator, the sample data is divided into 10 parts, 9 of which are used for learning and the other for testing. At the same time, the operator can also realize the output of results and the evaluation of accuracy. The last operator, “Weight by Gini Index”, is used for calculating the relevance of the attributes of the given example set based on the Gini impurity index.
2.2. Data Collection
Road infrastructure is one of the important factors in traditional evaluations of the bicycle environment. Bicycle lanes under high road grades generally have a higher quality in Beijing because the bicycle lane design is often synchronized with the construction of the vehicle lane. The impacts of vehicles on bicycling under different separation forms are generally significantly different. Furthermore, the effective width of a bicycle lane is one of the important factors used in evaluating bicycling quality. However, most of the roads in Beijing are relatively flat and the difference in road slope is small. Therefore, the road slope was not considered when selecting experiment sites. Combined with the road environment characteristics in Beijing, in this study we selected experiment sites that covered different road grades, separation forms and effective widths of the bicycle lane. As a long cycling distance may reduce cyclists’ satisfaction, the lengths of experiment sites had to be as similar as possible. Data collection was conducted at 19 road segments in five study sites, located in Beijing, China. The experiment route mainly involved turning right or going straight to avoid the influence of intersections on cyclists. The experiment sites and their road environment characteristics are shown in Figure 4 and Table 1. The experiment sites cover different road grades and separation forms. The lengths of most road sections were similar, and the effective widths of bicycle lanes ranged between 0 m and 5 m. The experiment was conducted in two sessions, both of which recruited volunteers through the Internet. A total of thirty-one volunteers (52% males and 48% females) were recruited in the first experiment session, all aged between 20–50 years (youth from 20–30 years: 48%, middle-aged from 31–50 years: 52%). The experiments were carried out on 18 May and 22–24 May 2018, which were sunny and windless weekdays. The experiment was carried out with 5 min intervals between departures to avoid interactions between volunteers. The second experiment session was carried out on 7–8 March and 12 March 2019, to ensure enough data. The second experimental process was the same as the first session. Thirty youth volunteers (50% male and 50% female) were recruited to ride a bicycle twice (peak and off-peak periods) along each route in sites C, D and E (Figure 4).
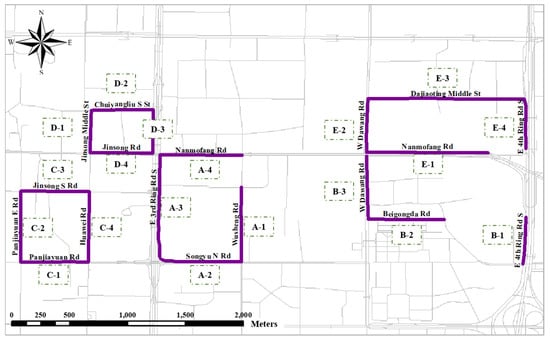
Figure 4.
Experiment sites.

Table 1.
The road environment characteristics of experiment sites.
All volunteers completed a questionnaire regarding the perceived feeling of bicycle environments after completing their travel on each road segment. The questionnaire was used to collect the scores for volunteers’ perceived satisfaction of the road segment. The question used a five-point Likert scale, with 1 being the worst and 5 the best. Finally, 1119 subjective feeling scores were obtained for different road segments.
Both experiments used dockless shared bikes as experimental bikes; each shared bike was equipped with two smartphones (Figure 5a), one with “acceleration” software (Figure 5b) fixed on the lower tube to collect GPS data during the ride (data were recorded at 1-s intervals), and the other with real-time video recording fixed on the handlebars to collect conflict data during the ride. Meanwhile, an investigator recorded the bicycle traffic flow and retrograde bicycle traffic flow on the road sections. A total of 1119 units of data were obtained.
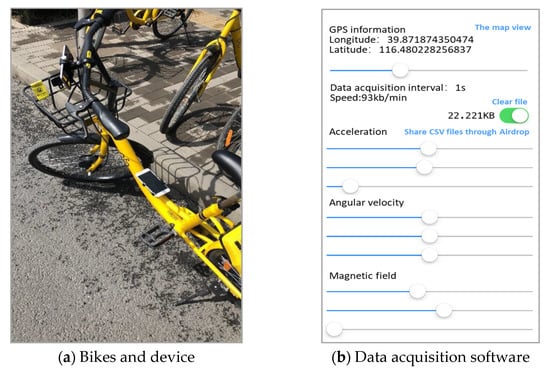
Figure 5.
Experimental preparation.
3. Data Preprocessing
Five types of data were collected from the software: acceleration data (three-axis acceleration), gyroscope data (three-axis angular velocity), magnetic field data (three-axis magnetic field), GPS location data (longitude and latitude) and Euler angle data (roll, pitch and yaw) (Table 2).
Table 2.
GPS data sample.
3.1. GPS Data Preprocessing
GPS data (recorded at 1-s intervals) obtained through sensors allowed us to extract the change in bicycle positions over time and thus obtain the bicycling speed more simply and directly. Firstly, based on the longitude and latitude information of the GPS data, the instantaneous speed of the cyclist was calculated, and then the data were cleaned by using the PauTa criterion [25]. The main idea of this criterion is that, if a measured value only contains random errors and the measurement is carried out according to the normal distribution, the probability of the data falling outside the confidence interval ±3 is only 0.27% if the velocity data satisfies Equation (2), and is cleared as abnormal data.
where refers to the sample variance, refers to the instantaneous velocity and refers to the average instantaneous velocity.
3.2. Acceleration Data Preprocessing
Detailed maneuvering of the bicycle could be measured with the installed mobile sensors [20]. In addition to the GPS receiver, this study utilized both an accelerometer and gyro sensor. The accelerometer provided for three-axis acceleration data, and the gyro sensor provided for three-axis angular velocity data. Figure 6a illustrates the three axes (x: lateral, y: longitudinal, z: vertical). To capture the lateral orientation or tilt during the movement of the bicycle, a three-axis gyro sensor was further utilized in this study [20]. Characteristics of each angular velocity measurement are illustrated in Figure 6b–d. The attitude solution is shown in Equation (3) [26,27].
where refer to the triaxial acceleration collected in the coordinate system of the mobile phone; refer to the yaw, roll and pitch Euler angles collected in the coordinate system of the mobile phone; and refer to the triaxial acceleration in the geodetic coordinates.
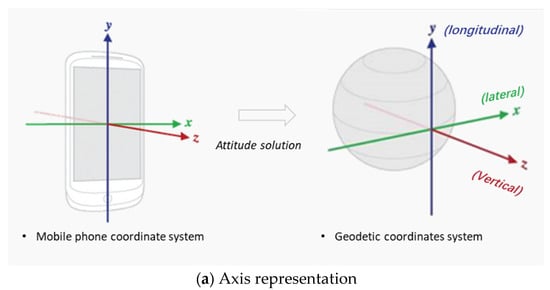
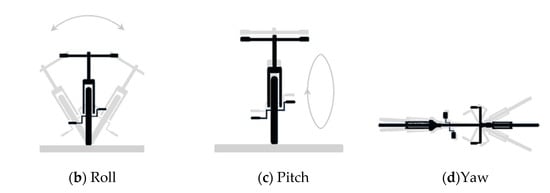
Figure 6.
Illustration of three-axis movement of a bicycle.
3.3. Video and Bicycle Traffic Flow Data Preprocessing
If road users are close to other road users at the same time and in the same space, road users must change their running state; otherwise, a collision may occur. This phenomenon is defined as traffic conflict [16]. In this study, conflict incidents referred to the events in which cyclists changed their cycling states—such as changing direction, changing speed or stopping suddenly—to avoid conflict with pedestrians, non-motor vehicles and motor vehicles. The number of conflict incidents experienced during cycling was counted through the video, and then the conflict incidents were binned in three boxes according to the number and the conflict level was processed in reverse order. The more conflicts, the lower the conflict level; for example, when the number of conflict events was the largest, the conflict level was the lowest, which was level 1. The bicycle traffic flow and reverse bicycle traffic flow in the road section were counted and invalid data were eliminated. Finally, 1011 valid units of data were obtained.
4. Results
4.1. Index Measurement
4.1.1. Measurement of Perceived Satisfaction and Conflict Level
Table 3 summarizes the descriptive statistics of perceived satisfaction. The perceived satisfaction of cyclists for each segment was relatively high, with only 16.82% lower than 3 points. Table 3 also shows the descriptive statistics for the conflict level. Level 1 conflicts accounted for 22.85%, indicating that only 22.85% of cycling processes involved more conflicts. The level 3 conflicts accounted for 48.27%. This indicated that there were many conflicts in more than half of the cycling processes (51.73%).
Table 3.
Descriptive statistics of perceived satisfaction and conflict level (n = 1011).
4.1.2. Extraction of BBIs and BEIs
Speed-related indicators are an important index to measure bicycling behavior. They reflect the cyclists’ perceived environmental comfort to some extent, while acceleration-related indicators reflect the perceived environmental safety of cyclists [21]. The following BBIs related to cycling speed and triaxial acceleration were extracted respectively: average value, variance, minimum value, maximum value, median value, coefficient of variation, 85th percentile value and 15th percentile value; a total of 32 indexes. The BEIs were obtained from recorded bicycle traffic flow data, including bicycle traffic and retrograde bicycle traffic. Table 4 summarizes the descriptive statistics for the BBIs and BEIs.
Table 4.
Descriptive statistics for bicycling behavior indicators (BBIs) and bicycling environment indicators (BEIs).
4.1.3. Calculation of the BEQ
The BEQ comprehensive index was calculated by subjectively perceived satisfaction and objective conflict level. Subjectively perceived satisfaction acquired from questionnaires provided the score of the subjective feelings of volunteers and the objective conflict level was derived from video. The weights of both perceived satisfaction and conflict level were calculated by the entropy method (Table 5). To judge the level of the BEQ more directly, it was classified into four levels (very poor, relatively poor, relatively good, very good) according to the principle of rounding, and then it was further divided into two levels (poor, good) (Table 6).
Table 5.
Weight calculated by the entropy method.
Table 6.
Descriptive statistics of the bicycling environment quality (BEQ) (n = 1011).
4.2. BBI and BEI Analysis
Typical BBIs at different BEQ levels were analyzed. Figure 7a–c show the relationship between average speed, speed variance, longitudinal acceleration variance and BEQ, respectively. Different characteristics of speed and acceleration data according to different BEQ levels were readily observed: riding with a high BEQ level generally showed the characteristics of high speed, small acceleration and speed change.
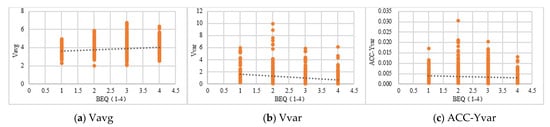
Figure 7.
The relationship between typical BBIs and the BEQ.
BEIs at different BEQ levels were analyzed. Figure 8a,b show the relationship between bicycle traffic, retrograde bicycle traffic and BEQ, respectively. Different characteristics of bicycle traffic according to different BEQ levels were readily observed: riding with a high BEQ level generally was associated with high bicycle traffic and small retrograde bicycle traffic.
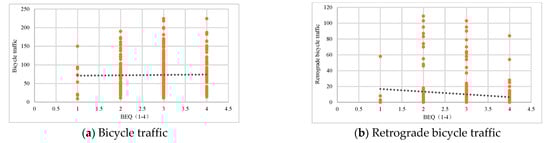
Figure 8.
The relationship between typical BEIs and the BEQ.
4.3. Classification Assessment Model of the BEQ
The random forest technique was used to construct a classification assessment model for the BEQ, in which BBIs and BEIs were used as input variables. The prediction accuracy of the classification assessment model of the four-level BEQ was only 54.01%, while the prediction accuracy produced an encouraging result of 77.35% when it came to the classification model of the two-level BEQ. The model prediction results are shown in Table 7.
Table 7.
Model accuracy of the two-level BEQ.
Table 8 shows the ten most important feature attributes in the model. The results show that retrograde bicycle traffic and bicycle traffic were the most important attributes to assess BEQ. As for the BBIs, the variation coefficient of speed, 15-percentage value of speed, minimum value of speed, variance of speed and maximum and minimum value of acceleration were important attributes to assess BEQ.
Table 8.
Top ten important attributes.
5. Discussion and Conclusions
5.1. Discussion
A bicycle-friendly environment is fundamental to increase bicycle use because bicyclists are often threatened by various hazardous situations such as collisions, near misses and falls. The first step toward providing better environments is to identify the present conditions by monitoring bicycle mobility. From this perspective, we attempted to develop a methodology for identifying BEQ based on mobile sensor data and bicycle traffic flow data.
The results indicated that riding with a high BEQ level generally showed the characteristics of high speed, small acceleration and speed change, which is in line with the general reality. In general, lower speed and larger variation in speed were observed from a road segment that bicyclists perceived as unsatisfactory and dangerous. Also, abrupt changes in accelerations had a tendency to lead to unsatisfactory perceptions. Adverse bicycling environments, including uphill grade, uneven surfaces, obstacles, crossings and near-miss situations, led to these observations [19,21,28]. Bicycle traffic was found to be positively related to the BEQ. This makes sense in Beijing. More bicycle traffic increases the cyclists’ sense of security when motor vehicles enter and exit parking spaces on bike lanes. On the other hand, retrograde bicycle traffic was found to be negatively related to the BEQ. This is consistent with the study by Landis [12]. The more retrograde bicycle traffic there is, the greater the disturbance is and the lower the cyclists’ sense of security.
On average, the proposed RF-based classification assessment model was able to produce approximately 77.35% overall correct classification. This is respectively 8.95% higher and 1.85% higher than the binary logistic regression (BLR)-based statistical model (68.4%) and the support vector machine (SVM)-based model (75.5%) established in Joo’s study [21].
BBI factors, including the variation coefficient of speed, 15-percentage value of speed, minimum value of speed, variance of speed and maximum and minimum value of acceleration, were important attributes to assess the BEQ. This confirmed the results of Joo’s study [21]: BBIs reflect cyclists’ satisfaction with the cycling environment to some extent. For example, greater variance of speed or acceleration indicates worse smoothness of the cycling environment, while a higher speed indicates faster cycling. However, the results showed that retrograde bicycle traffic and bicycle traffic are the most important attributes to assess BEQ, even with the inclusion of BBIs. This resulted in a new finding, which was different from previous studies: the BEQ cannot be fully and independently explained by BBIs; the BEIs (bicycle traffic flow and other factors) are also important factors to be considered in addition to BBIs.
This study proposed a novel method for evaluating BEQ using GPS-based bicycling behavior data and bicycle traffic flow data. One issue is how to use this method in practice. A viable application might be to incorporate the method in dockless bicycle-sharing systems (DBSs). A DBS is a kind of new public bike-sharing system (PBS). It breaks the limit of fixed stations and realizes station-free bicycling completely. Each bike can be located by a GPS positioning module in its smart lock. Users can rent bikes by scanning a QR code on them using smartphones. People can rent or return bikes anywhere. Since DBSs were first launched in Beijing, China, in 2015, hundreds of millions of bikes have been put into use in over 200 cities in China, and the average daily use frequency of DBSs has reached approximately 2,250,000 uses [29]. It is required by the government that all data have to be uploaded to the government’s operation monitoring platform (OMP), and the data uploading interval of the GPS module is 1 s, which is expected to facilitate the application of the proposed method. An agency in the OMP can then monitor the bicycle environment in a more intelligent, automatic and labor-efficient manner. Monitoring results could be further utilized in developing measures to improve bicycling environments. A conceptual illustration for monitoring bicycle environments based on DBSs is presented in Figure 9.
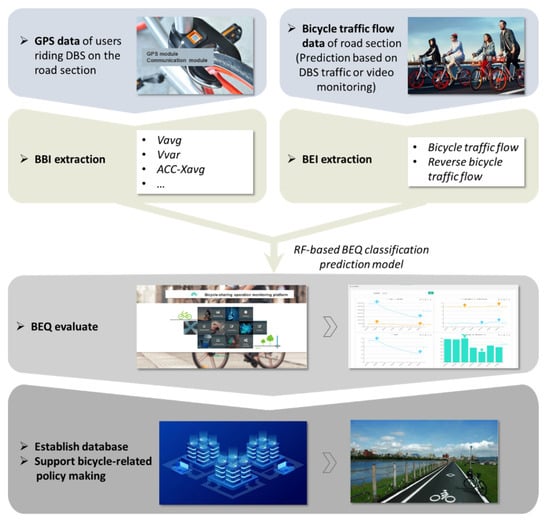
Figure 9.
Conceptual illustration of an application of the proposed methodology.
5.2. Conclusions
This paper carried out cycling experiments in five sites in Beijing, China. In the experiment, a smartphone equipped with a GPS receiver, accelerometer and gyroscope was used to collect detailed GPS data, and another smartphone was used to collect bicycle conflict data. In addition, bicycle traffic data on the road section was also recorded, and each participant completed a cycling perception satisfaction scale. Then, speed- and acceleration-related bicycling behavior indicators and bicycling environment indicators, such as bicycle flow, were extracted to be used as inputs of the model. The bicycling environment quality, which was defined by perceived satisfaction and conflict level, was also calculated. Finally, a two-level BEQ classification assessment model was constructed based on the random forest algorithm. In addition, this study proposed a bicycling environment assessment method based on the dockless bicycle-sharing system, which had significant advantages in data collection and application.
The findings from this study indicated that GPS data can be effectively used to evaluate the BEQ and can overcome the limitations of traditional data acquisition. The results showed that bicycling behaviors and bicycling environments are different under different BEQ levels. BBIs are important attributes to evaluate the BEQ but the most important factors are the retrograde bicycle traffic and bicycle traffic. This also indicates that the BEQ cannot be independently explained by BBIs and BEIs are also important to consider.
This proactive approach can be used to evaluate the BEQ based on the observed BBIs and BEIs. Smartphone-based GPS data and bicycle traffic data can be collected more frequently and easily than traditional methods. It is not only planners and road administrators who can benefit from this objective method for monitoring the BEQ. Individual cyclists can choose an optimal route based on the BEQ. To verify the feasibility of GPS data in evaluating the BEQ, we only collected data in 19 road sections in Beijing. However, many road environmental characteristics affect the bicycling behavior and subjective satisfaction of cyclists, for example, pavement conditions. In the future, we could use a large amount of GPS data to extract bicycling behavior under different road environment characteristics, once the accuracy of GPS data generated by sharing bicycles is improved. Furthermore, less effort has been devoted to exploring smarter ways of collecting bicycle traffic data in this paper, such as measurement based on DBS traffic. We expect that the findings of this study will be effectively used to develop bicycling environment monitoring systems.
Author Contributions
Conceptualization, L.L.; Data curation, D.X.; Formal analysis, L.L.; Investigation, H.Z.; Methodology, Y.B. and J.R.; Project administration, Y.B. and J.R.; Resources, J.W.; Supervision, Y.B.; Visualization, L.L.; Writing—original draft, L.L.; Writing—review & editing, L.L. All authors have read and agreed to the published version of the manuscript.
Funding
This research received no external funding.
Institutional Review Board Statement
Not Applicable.
Informed Consent Statement
Informed consent was obtained from all subjects involved in the study.
Data Availability Statement
No new data were created or analyzed in this study. Data sharing is not applicable to this article.
Conflicts of Interest
The authors declare no conflict of interest.
References
- Litman, T. Evaluating Active Transport Benefits and Costs: Guide to Valuing Walking and Cycling Improvements and Encouragement Programs; Victoria Transport Policy Institute: Victoria, BC, Canada, 2015. [Google Scholar]
- Figliozzi, M.; Blanc, B. Evaluating the Use of Crowdsourcing as a Data Collection Method for Bicycle Performance Measures and Identification of Facility Improvement Needs; Oregon Department of Transportation and Federal Highway Administration: Salem, OR, USA, 2015.
- Garrard, J.E. Evaluating cycle promotion interventions. In Cycling Futures; Bonham, J., Johnson, M., Eds.; Adelaide University Press: Adelaide, SA, Australia, 2015; pp. 429–452. [Google Scholar] [CrossRef]
- Götschi, T.; Garrard, J.; Giles-Corti, B. Cycling as a part of daily life: A review of health perspectives. Transp. Rev. 2016, 36, 45–71. [Google Scholar] [CrossRef]
- Pucher, J.; Buehler, R.; Seinen, M. Bicycling renaissance in North America? An update and re-appraisal of cycling trends and policies. Transp. Res. Pt. A Policy Pract. 2011, 45, 451–475. [Google Scholar] [CrossRef]
- Koorey, G. Spaces for cycling. In Cycling Futures; Bonham, J., Johnson, M., Eds.; Adelaide University Press: Adelaide, SA, Australia, 2015; pp. 251–282. [Google Scholar] [CrossRef]
- World Health Organization. The Ottawa Charter for Health Promotion. Available online: https://www.who.int/teams/health-promotion/enhanced-wellbeing/first-global-conference (accessed on 31 March 2016).
- Beijing Transportation Research Center. Beijing Transport Annual Report 2019. Available online: http://www.bjtrc.org.cn/List/index/cid/7.htm (accessed on 20 July 2019).
- Kazemzadeh, K.; Laureshyn, A.; Winslott Hiselius, L.; Ronchi, E. Expanding the Scope of the Bicycle Level-of-Service Concept: A Review of the Literature. Sustainability 2020, 12, 2944. [Google Scholar] [CrossRef]
- Davis, J. Bicycle Safety Evaluation; Auburn University, City of Chattanooga, and Chattanooga-Hamilton County Regional Planning Commission: Chattanooga, TN, USA, 1987. [Google Scholar]
- Sorton, A.; Walsh, T. Bicycle Stress Level as a Tool to Evaluate Urban and Suburban Bicycle Compatibility. Transp. Res. Record 1994, 1438, 17–24. [Google Scholar]
- Landis, B.W.; Vattikuti, V.R.; Brannick, M.T. Real-time Human Perceptions: Toward a Bicycle Level of Service. Transp. Res. Record 1997, 1578, 119–126. [Google Scholar] [CrossRef]
- Li, Z.; Wang, W.; Liu, P.; Schneider, R.; Ragland, D.R. Investigating bicyclists’ perception of comfort on physically separated bicycle paths in Nanjing, China. Transp. Res. Record 2012, 2317, 76–84. [Google Scholar] [CrossRef]
- Bicycle Environmental Quality Index (BEQI). Draft Report 2009. Environmental Health Section Program on Health, Equity and Sustainability, San Francisco Department of Public Health, Calif. 2009. Available online: https://merritt.cdlib.org/d/ark%253A%252F13030%252Fm5qz3r51/1/producer%252F892131162.pdf (accessed on 16 February 2021).
- 2010 Highway Capacity Manual. Transportation Research Board; National Research Council: Washington, DC, USA, 2011. [Google Scholar] [CrossRef]
- Wang, W.; Sun, Z.; Wang, L.; Yu, S.; Chen, J. Evaluation Model for the Level of Service of Shared-Use Paths Based on Traffic Conflicts. Sustainability 2020, 12, 7578. [Google Scholar] [CrossRef]
- Behrendt, F. Why cycling matters for Smart Cities. Internet of Bicycles for Intelligent Transport. J. Transp. Geogr. 2016, 56, 157–164. [Google Scholar] [CrossRef]
- Strauss, J.; Zangenehpour, S.; Miranda-Moreno, L.F.; Saunier, N. Cyclist deceleration rate as surrogate safety measure in Montreal using smartphone GPS data. Accid. Anal. Prev. 2017, 99, 287–296. [Google Scholar] [CrossRef] [PubMed]
- Bíl, M.; Andrášik, R.; Kubeček, J. How comfortable are your cycling tracks? A new method for objective bicycle vibration measurement. Transp. Res. Pt. C Emerg. Technol. 2015, 56, 415–425. [Google Scholar] [CrossRef]
- Joo, S.; Oh, C. A novel method to monitor bicycling environments. Transp. Res. Pt. A Policy Pract. 2013, 54, 1–13. [Google Scholar] [CrossRef]
- Joo, S.; Oh, C.; Jeong, E.; Lee, G. Categorizing bicycling environments using GPS-based public bicycle speed data. Transp. Res. Pt. C Emerg. Technol. 2015, 56, 239–250. [Google Scholar] [CrossRef]
- Zhu, Y.; Tian, D.; Yan, F. Effectiveness of Entropy Weight Method in Decision-Making. Math. Probl. Eng. 2020, 2020, 1–5. [Google Scholar] [CrossRef]
- Liaw, A.; Wiener, M. Classification and regression by random Forest. R News 2002, 2, 18–22. [Google Scholar]
- Breiman, L. Random forests. Mach. Learn. 2001, 45, 5–32. [Google Scholar] [CrossRef]
- García, S.; Luengo, J.; Herrera, F. Tutorial on practical tips of the most influential data preprocessing algorithms in data mining. Knowl. Based Syst. 2016, 98, 1–29. [Google Scholar] [CrossRef]
- Chen, C.Y.; Guo, Y.; Bi, J.X. Experimental Analysis of Positioning Based on Smart Phone MEMS. J. Navig. Position. 2014, 4, 74–82. [Google Scholar]
- Zhao, H.; Guo, L. Space coordinate transformation algorithm for built-in accelerometer data of smartphone. J. Comput. Appl. 2016, 36, 301–306. [Google Scholar]
- Chen, X.; Yue, L.; Yang, K. Safety evaluation of overtaken bicycle on a shared bicycle path. Tongji Daxue Xuebao 2017, 45, 215–222. [Google Scholar] [CrossRef]
- Wang, J.C.; Ouyang, S.S. Disequilibrium of Bicycle-sharing in Rail Transit Station Areas in Beijing. J. Transp. Syst. Eng. Inf. Technol. 2018, 19, 214–221. [Google Scholar] [CrossRef]
Publisher’s Note: MDPI stays neutral with regard to jurisdictional claims in published maps and institutional affiliations. |
© 2021 by the authors. Licensee MDPI, Basel, Switzerland. This article is an open access article distributed under the terms and conditions of the Creative Commons Attribution (CC BY) license (https://creativecommons.org/licenses/by/4.0/).