1. Introduction
The Sustainable Development Goals (SDG 2030) include the establishment of good human–nature relationships and the enhancement of ecosystem service (ES) provision, to ensure the sustenance of economies and livelihoods of communities effectively. Land use, which is a major link between ESs and human activities [
1], facilitates the achievement of diverse needs in human society. However, land use activities could adversely affect ecosystem structure and processes, and drive the evolution of such processes and functions [
2]. From a global socioeconomic development perspective and ES evolution, land use structures influence the levels and threshold ranges of ESs that have benefits [
3], through the modification of factors such as ground vegetation and landscape characteristics. Today, intense and extensive human activities—including globalization, regional urbanization, local industrialization, agriculture, animal husbandry, and tourism—have had considerable impacts on regional and local environments. Such activities constantly alter land surface structure and influence the relationships among components of natural ecosystems, spatial distribution of resources, as well as material circulation. Consequently, different regions are affected by different factors and their interaction to different degrees, so the evolution of ES values (ESVs) shows big differentiation in different natural ecological types of areas, which is necessary to optimize and regulate from the policy level.
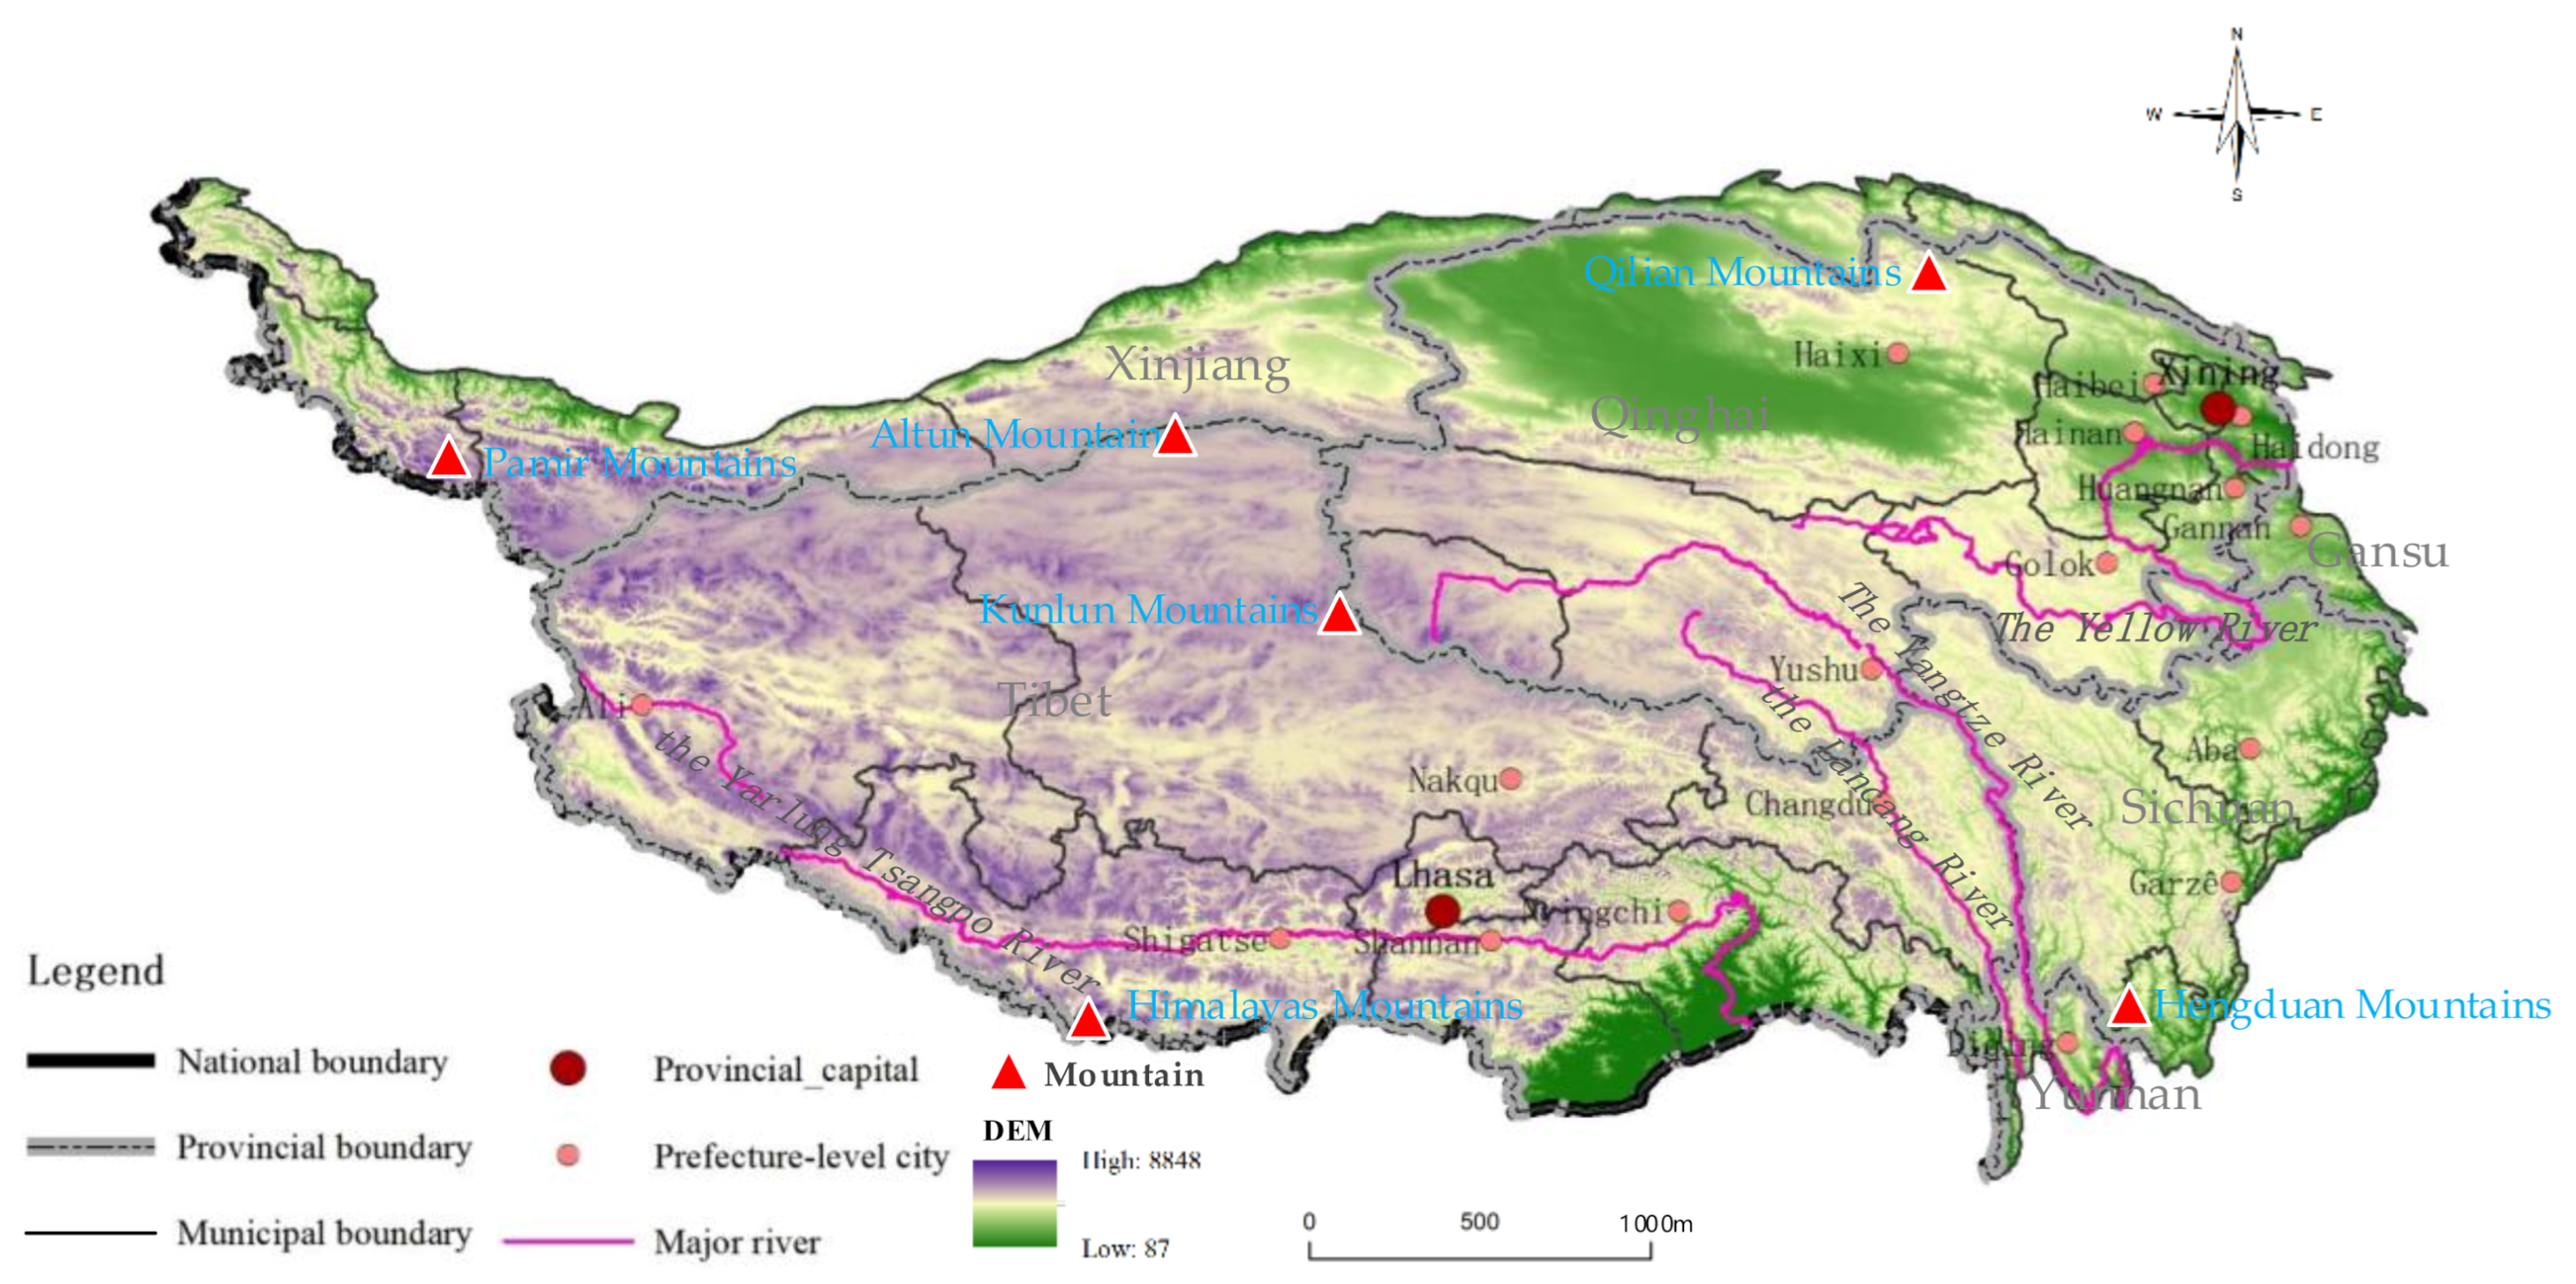
The Qinghai–Tibet Plateau (QTP) is not only the largest plateau in China, but is also the plateau located at the highest altitude globally. The plateau has been subjected to diverse land use activities over the years, ranging from nomadic activities to farming, with a modern tourism economy being the current mainstay. In addition, the urban patterns in the region have shifted from a central city system to a system of regional cities and towns, and the land use structure is increasingly diversifying and becoming larger in scale [
4]. During such transition processes, land use change associated with human activities have more obvious impacts on the ESVs of the QTP, and are mainly manifested as follows: (i) destruction of the grassland ecosystem caused by unregulated livestock rearing and conflict between food production and livestock rearing, (ii) uncontrolled infrastructure development to support tourism development, and (iii) high volumes of industrial migrants regionally above the land carrying capacity. The QTP is an important ecological security barrier in western China [
5], and the foundation of ESVs for development in the region is being affected adversely by changes in the land use structure arising from human activities, resulting in challenges such as land shortage and human–nature conflicts.
The present study investigated the coupling relationship between shifts in the QTP land use structure and its ESVs. The aims of the present study were to explore (i) changes in the QTP’s land use structure, (ii) spatial trends of ESVs under land use change, and (iii) future trends under natural evolution and ecological protection scenarios. The findings of the present study could facilitate the formulation of policies to support the sustainable exploitation of ESs in the QTP.
1.1. Land Use Change and Ecosystem Services
Land use change is a major aspect via which human activities influence ecosystem services and function. The subsequent changes in surface vegetation structure and patterns have major impacts on ecosystem structure and function. In addition, changes in land use type and management methods also influence ESs. For example, overgrazing modifies the characteristics and scale of the land cover, which, in turn, affect primary productivity, habitat and species diversity, in addition to biogeochemical cycles and energy flow patterns [
6].
Numerous studies have investigated the factors affecting ESs. Research on ES emerged in the 1970s [
7], and has attracted the attention of diverse scholars over the years [
8]. In 2005, the United Nations clarified the relationship between ecosystems and land use in the Millennium Ecosystem Assessment (MA) and classified the various types of ESVs [
9]. Through the examination of land use types and their change, in addition to shifting land use patterns in space [
10], scholars have been able to analyze the factors driving the establishment of different ESs.
1.2. Evaluation and Simulation of Ecosystem Service Values
ESVs are dynamic but predictable. The development of remote sensing and geographical information systems technologies has facilitated the emergence of various ES classification and evaluation systems worldwide, as well as a batch of ecological models, such as Integrated Valuation of Ecosystem Services and Tradeoffs, Artificial Intelligence Ecosystem Services, Revised Universal Soil Loss Equation, Soil and Water Assessment Tool, Cellular Automata (CA), and gray forecasting models [
11]. Such models have been applied extensively in quantitative research on the supply of single or multiple ESs at various scales, ranging from local to global scales [
12]. Some scholars have further achieved the monetization of ESVs by estimating the per-unit pricing of ES functions or using equivalent value per unit area of ES as the basis [
13]. Such models and tools have provided new opportunities and approaches for the evaluation and prediction of ESVs.
Although there are numerous studies that have explored the relationship between land use and ESVs, simulation studies based on historical data exploring potential future trends in the relationship between land use and ESVs under multiple scenarios are largely lacking. The CA-Markov model combines the capacity of Markov Chain Monte Carlo methods to predict long-term series and the advantages of CA in simulating spatial changes in complex systems. The model is significantly superior to other physiological and ecological models in terms of goodness-of-fit, simulation dynamics, and multi-scenario land use analysis [
14]. For example, Sun et al. used the CA-Logistic-Markov model to analyze changes in land use patterns and the spatial distribution of ES regionally in the Atlanta metropolitan area in 1985–2012. They also simulated ES characteristics under four landscape scenarios in 2030 to explore the optimal land use strategies that could enhance ESs [
15]. The quantitative characteristics and spatial relationships of ES supply and demand were determined by matching the spatial layout of the supply and demand. Research carried out in the QTP has seldom involved the quantification of ES demand, and has rarely paid attention to the ES characteristics changes over the long-term. To better grasp future macro trends and facilitate the formulation of relevant policies, the CA-Markov model can be used by setting up separate scenarios of natural development and ecological protection, to simulate future land use change and their impacts on ES.
1.3. Land Use Change on the Qinghai–Tibet Plateau
The QTP is a unique geographical feature and the highest plateau in the world, with its average altitude being greater than 4000 m. It is a critical ecological security barrier for China and has extremely high ESVs associated with water conservation and hydrological regulation [
16]. In recent decades, the QTP has been experiencing the Westerlies and the East Asian and Indian monsoons at increased intensities, which could have altered the distribution of water vapor in the region [
17]. In addition, the average temperature in the region has increased substantially since 1997, and significantly after 2005 [
18]. Such shifting environmental conditions have introduced climatic differences between the southeastern and northwestern regions of the QTP, with generally warmer and humid conditions [
19]. Compounded by various factors, including the sustained intensification of human activities, grassland degradation, desertification, expansion of urban spaces, glacial melting, and particularly, dynamic shifts in alpine grassland vegetation communities, ESVs have been affected considerably.
The QTP is highly vulnerable to the effects of climate change and human activities, so that the regional environment is both climate-sensitive and ecologically vulnerable. In addition, the region is an important base in China for animal husbandry due to the grassland resources, with marked increases in grazing activities and population [
20]. Demand by the Chinese population for high-quality livestock products (milk, meat, and fur goods) from naturally-fed animals, it has been driving the increase in the quantity and intensity of grazing in the region annually. Due to the considerable changes in the regional climate and environment in QTP in recent years, coupled with climate warming, water pollution, grassland degradation, and desertification, sustainable socioeconomic development at the local level has been seriously impaired [
21].
Studies have reported that changes in QTP’s ES capacities in 1995–2015 were either stable or rising [
22]. An increase in ES demand in the eastern region of the QTP was especially obvious, which could have been due to the impacts of climate warming and human activities on the QTP ecosystem. Notably, ES supply decreased significantly in areas that had undergone land use and structure change associated with marked permafrost degradation, and land desertification or natural disasters [
23]. In addition, the overall ES demand has increased continuously in areas with widespread human activities, bringing about greater challenges with regard to the sustainable supply of ES services regionally, as well as their regulation functions [
24].
Considering the emerging challenges above, there is a need to explore the mechanisms via which land use change affects ESs on the QTP, in addition to the interactions between the two factors. Such studies could provide an essential reference resource and facilitate the formulation of appropriate ecological protection measures and sustainable regional development in the QTP. The present study used land use data spanning a 23-year period and ESV accounting methods to estimate ESVs in the QTP in 1992–2015. In addition, we examined the spatiotemporal distributions of the estimated ESVs. With the historical patterns of ESV changes as the basis, the CA-Markov model was used to predict the ESV trends in the QTP’s ESVs in 2035 under two scenarios: natural development and ecological protection, in turn, revealing the relationship between land use and ESV on QTP.
3. Results
3.1. Land Use Change Characteristics on the QTP
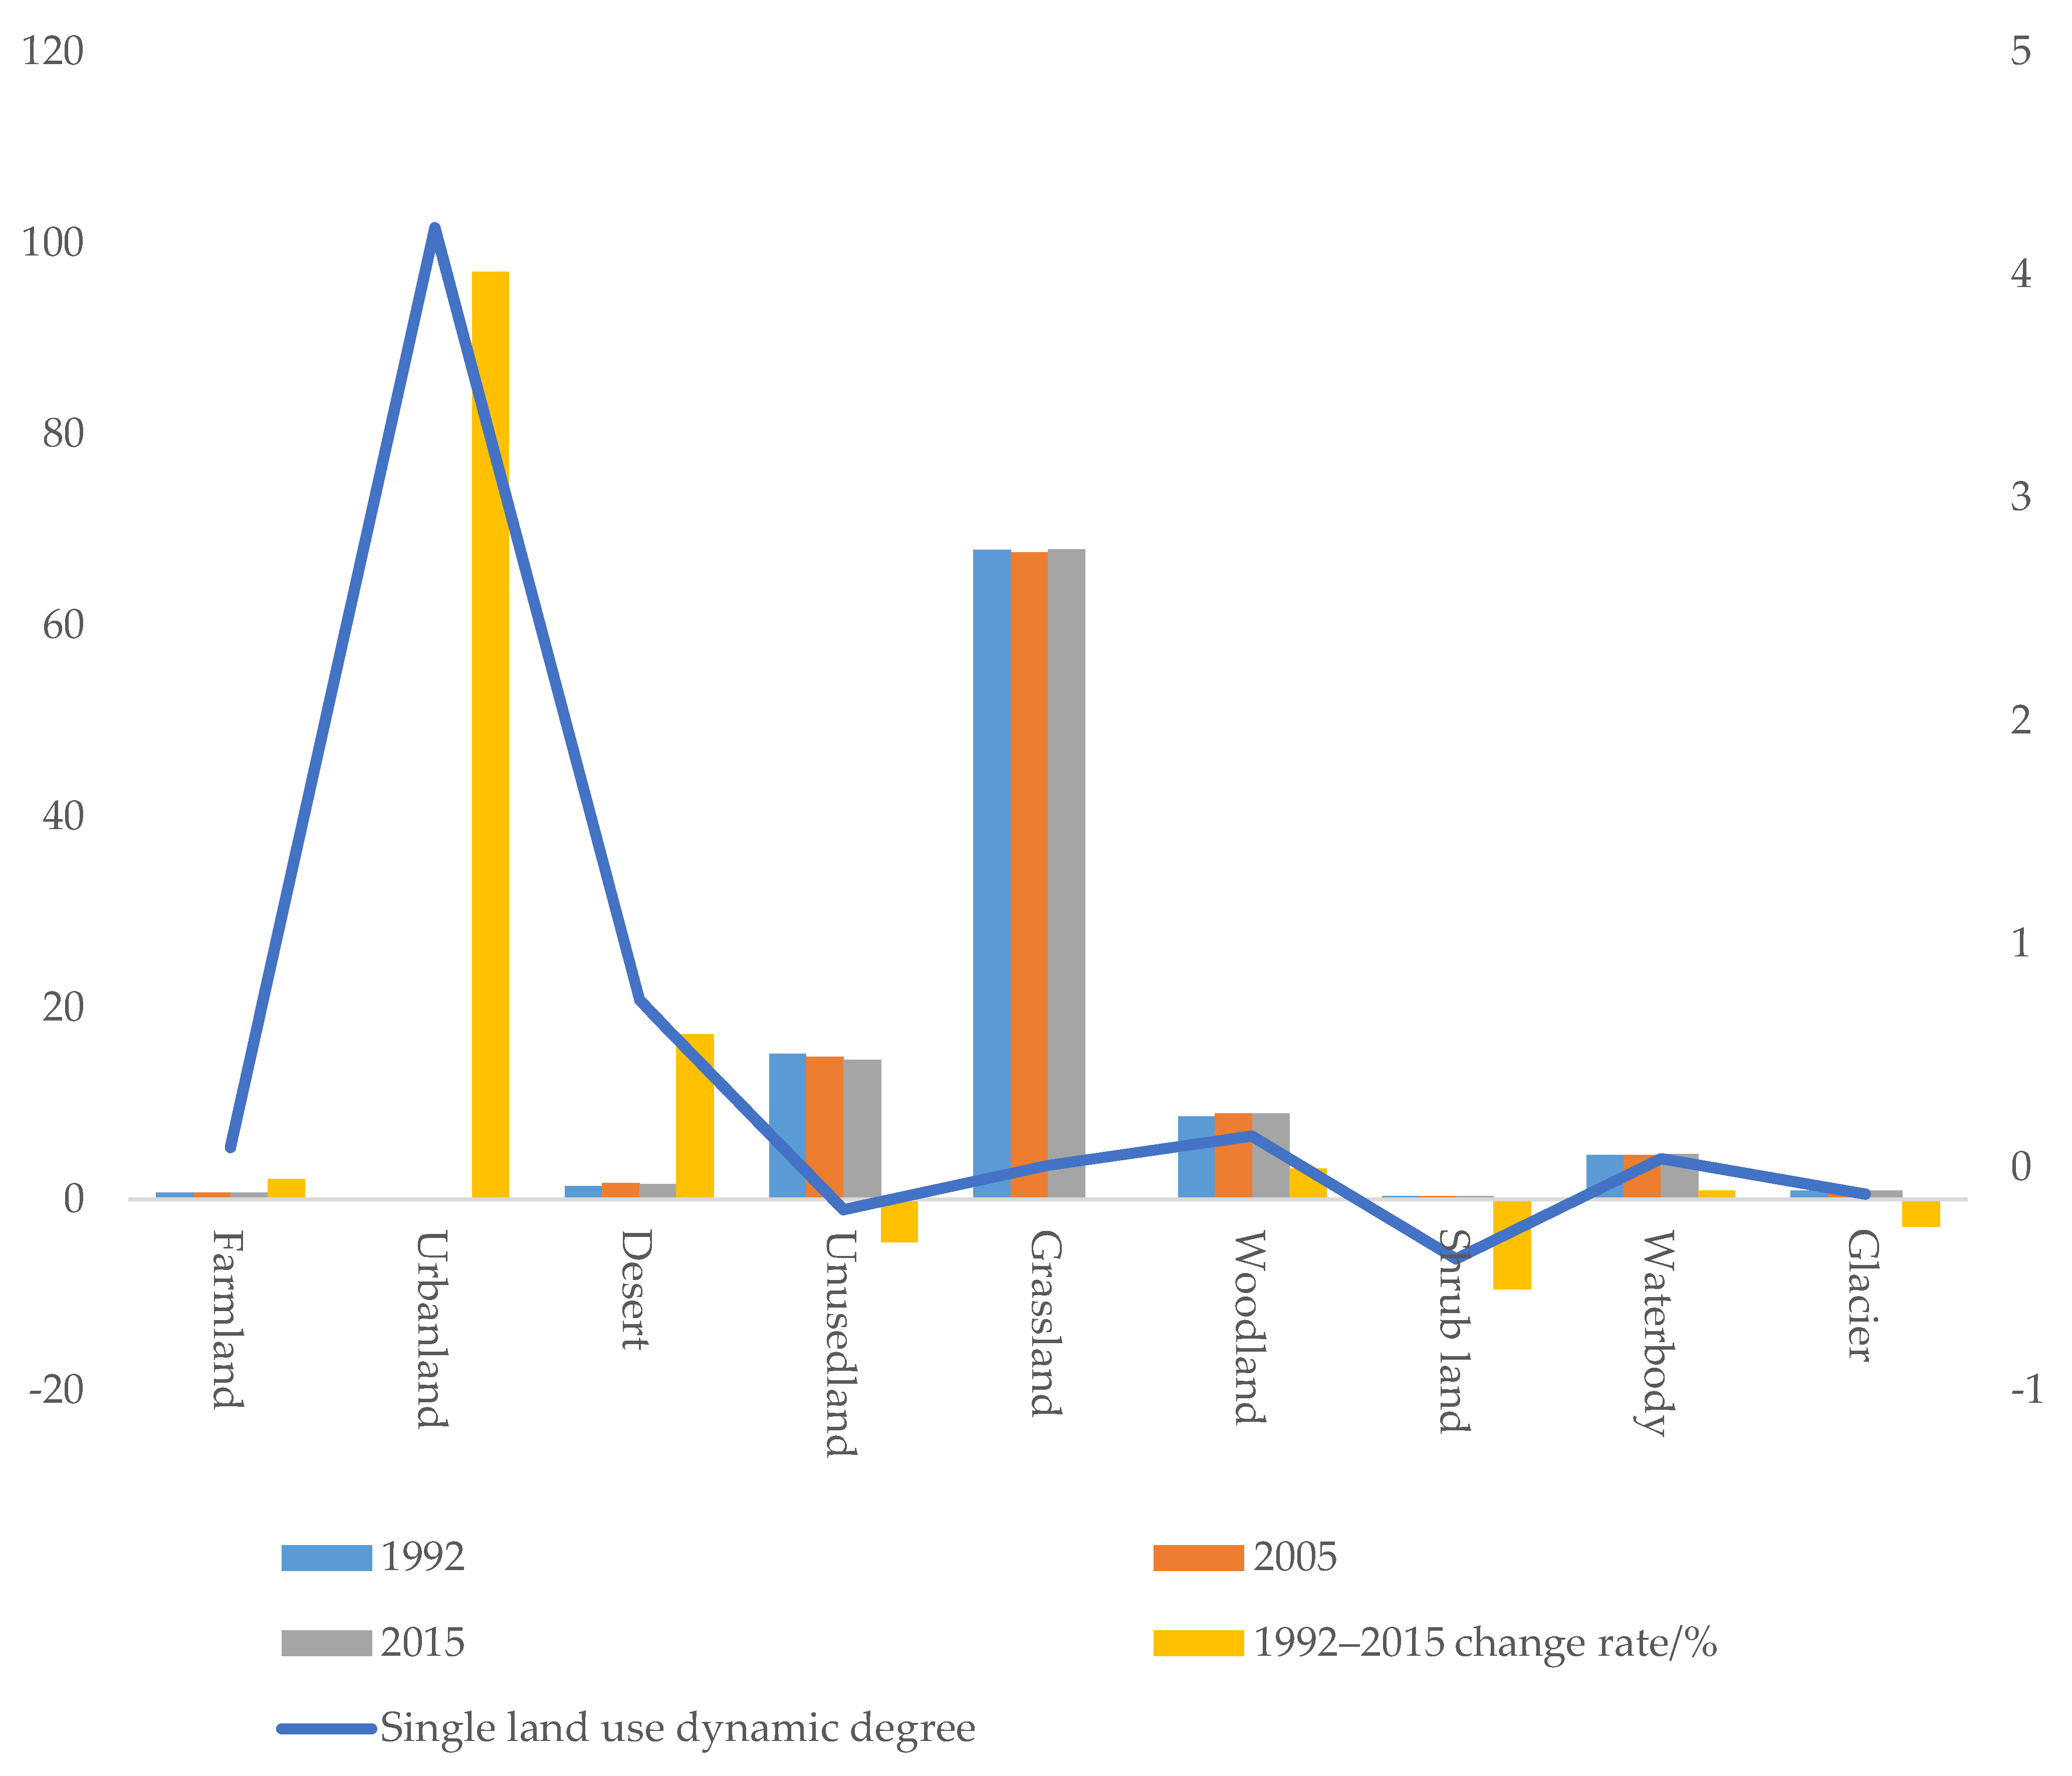
According to the comparison table of “Three Categories” in “Land Use Status Classification” and “Land Management Law of the People’s Republic of China”, the land cover classification system of the QTP was constructed, and the land cover types in the QTP were divided into nine categories: farmland land, urban land, desert, bareland, grassland, forest, shrub, water, and glacier. Local adjustments occurred in QTP land use structure over the 23-year study period, with the two prominent changes being an increase in urban land and desert areas, and a decrease in shrubland and bare land (
Figure 3). The QTP was predominantly grassland in 1992–2015, with the land use type accounting for 67.91% of the total area. This was followed by bare land and woodland, accounting for 14.59% and 9.01% of the total area, respectively. The three land use types jointly comprised 91.51% of the total area, with no obvious change in their predominance over time. Driven by urbanization and expansion of urban construction, the growth rate of urban land area reached 96.92%. There was also an obvious increase in desert area (17.31%) due to temperature, precipitation, and climate warming factors. Correspondingly, there were reductions in shrub land and bare land areas, at −4.41% and −9.42%, respectively. In addition, glacial melting decreased by 2.84%.
Based on a land use dynamic change perspective, there were increases in urban land (4.21%), desert (0.75%), and woodland (0.14%), and decreases in bare land (0.19%), shrubland (0.41%), and glaciers (0.12%). Over the study period, overall land use change on the QTP was affected by both human activities directly and the indirect effects of the activities. The impacts of urbanization and global warming resulting from population agglomeration on the plateau were significant, while ecological environmental protection policies played key regulating roles. For example, in 1992–2015, grassland area decreased from 67.81% to 67.57%, which was as a result of policies that restricted grazing and promoted a reasonable balance in the grassland–livestock relationship. With the restriction on overgrazing, grassland area increased substantially.
3.2. Direction of Transfer of Land Use Types
From 1992 to 2015, the transfer activities of land use types on the QTP are multi-directional. Urban, desert, and shrubland accounted for relatively high proportions of the transformed areas. Land uses that were transformed included farmland, grassland, and waterbody, accounting for 93.09% of the total amount of transformed urban land (
Table 2). On the whole, there is a significant mutual conversion phenomenon between grassland and desert. About 5093 km
2 of desert area is converted into grassland, and in other places, the amount of grassland transferred to desert is 6937 km
2. Shrubland was mainly transformed into woodland, accounting for 86.51% of the total area transformed. Glacier transformation into a waterbody was also widespread.
The land areas transformed into urban land, grassland, farmland, and bare land were quite high. The area of urban land on the QTP doubled over the 23-year period, accounting for 60.83% of the total transformed land use. At the same time, a portion of grassland and bare land had degenerated into deserts, with their areas accounting for 56.21% and 43.04% of the transformed area, respectively. According to the QTP land use transfer matrix, the transformation of bare land and shrubland into grassland and woodland, respectively, was particularly notable.
3.3. Ecosystem Service Values on the Qinghai-Tibet Plateau and Their Trends
Overall, grassland, waterbody, and woodland land use types were the major contributors to the ESVs. The combined contributions of the three land use types above were 98.55%, 98.55%, and 98.59% over the three years, successively (
Figure 4). The major factor influencing ESV tends was land use type transfer. Although land use change affects the ecosystem value of different land types, it does not have a great impact on the whole.
From a dynamic change perspective, the ESV trends in the QTP exhibited decreases followed by increases (
Table 3). The ESV was 7140.31 B in 1992, reduced to 7062.29 B in 2005, and then increased to 7202.74 B in 2015. The increase in the latter stage was greater than the decrease in the earlier stage, which was consistent with the overall trend of land use structure. The changes in the value in the two periods were −7.802 and 14.045 B yuan, respectively.
Grassland had the highest ecological value, accounting for 48.77% of the total value. The value of deserts was the lowest, accounting for only 0.11% of the total value. The ESV produced per unit of waterbody was relatively high. Although the area of the waterbody land use type was only half that of woodland, its total ESV was higher than that of the woodland. The ESVs of bare land and glaciers declined continuously, with their magnitudes being greater in 2005–2015 than in 1992–2005. The main reasons were the continuous transfer of bare land to grassland and urban land, and conversion of glaciers to waterbodies, especially in the latter ten years of the study period, the influence of the external environment becomes more and more intense.
3.4. Characteristics of Different Dimensions of Ecosystem Service Values and Their Changes
3.4.1. Characteristics of ESVs of Different Eco-Geographical Areas
An eco-geographic area reflects the natural environment characteristics, so that the land use patterns derived would be similar in different sites with similar eco-geographic features. Hence, the analysis of zonal characteristics of the ESVs in the QTP was analyzed from an eco-geographic area perspective. First, using the QTP’s ESV scores as the basis, the ArcGIS natural breaks classification method was used to divide the plateau into five types of zones based on value: very low (VL), low (L), average (A), high (H), and very high (VH), which shows that the areas around the eastern Kunlun Mountains, Altun Mountains, and Qaidam Basin are mostly desert and bare land, which account for 17.38% and 0.95% of the total land use, respectively. They have low ESVs and belong to the VL-value zone. There are no large urban built-up areas in the areas, and not much change has occurred to the land use structure. The Sichuan–Tibet alpine-valley, located to the southeast of the QTP, is an A-value zone and accounts for only 9.01% of the total value. H- and VH-value zones, which are mainly distributed in the Qilian Mountains, QTP, and valleys in southern Tibet, account for 72.66% of the total value (
Figure 5). The VL-value zones in northern QTP had a decreasing trend over the study period, with the reductions in the Altun Mountain–Qaidam Basin belt being the most prominent. The ESV changes in the belt were mostly from the L- and VL-value zones to the A- and H-value zones. ESV increases were more notable in the belt along the Gangdise Mountain and the edge of the Himalayas and were mainly from the A- and H-value zones to the VH-value zones.
From 1992 to 2015, the area where the ESV on the QTP decreased accounted for 3.17% of the total area, and the area of decreased value was mainly concentrated in the southern area of Kunlun Mountains - Altun Mountains and the eastern part of the southern valley of Tibet. The main reason for the decrease in the ESV in the two regions is that the aquatic and grass conditions are relatively good and suitable for grazing activities. Disorderly human grazing activities aggravate the inherent vulnerability of the region and ultimately lead to the deterioration of the regional ecological environment. In different regions, the trend of ESVs in the QTP is different, with some places increasing and some places decreasing. However, on the whole, the decreasing area of ecosystem service value is less than the increasing area of ESVs. This suggests that the implementation of effective national grazing management and farming strategies adapted to local conditions has optimized the ecological environment of the QTP.
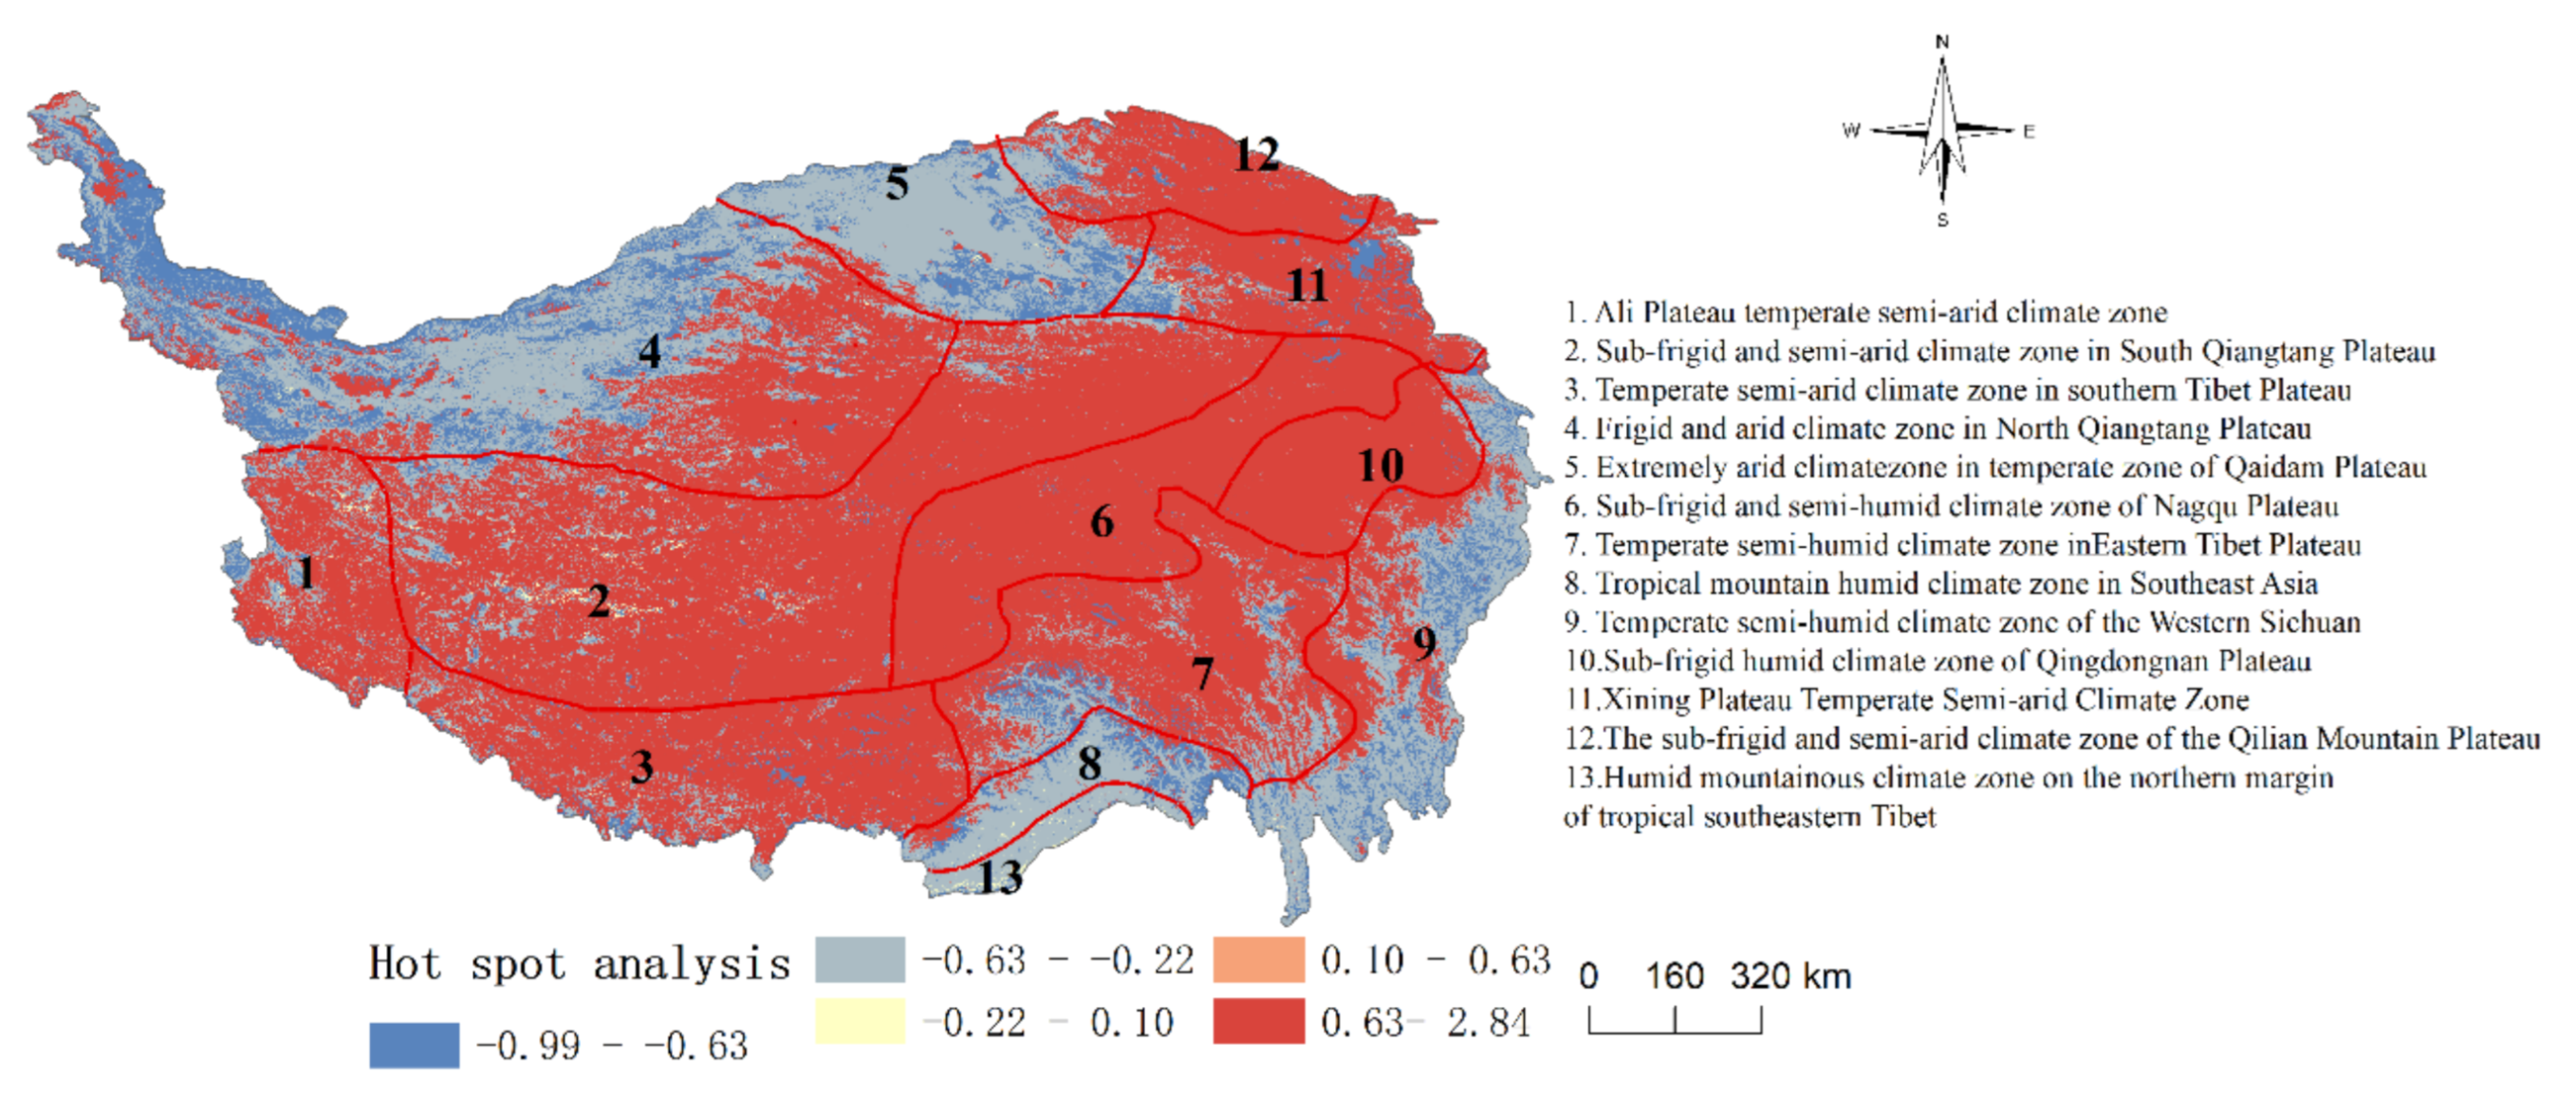
3.4.2. Variations in ESVs between Different Climatic Zones
Climate is a key factor influencing surface cover, with climatic zones with different ESVs exhibiting significant spatial heterogeneity. Reference was made to Lin et al. [
33] and their classification of 13 climatic types (
Figure 6).
After superimposing the figure above onto the QTP’s ESV map, the areas with low ecosystem service value on the QTP are mainly concentrated in the southwest and northwest of the QTP. The low value area of ecosystem service value in the southwest of the Qinghai-Tibet Plateau is mainly distributed intropical mountain humid climatic zone in southeastern Tibet, mountain humid climatic zone (Ia) in the northern margins of southeastern Tibet, and a temperate humid climatic zone (HIIIa) in the western Sichuan Plateau. The northwest region is mainly distributed in the extremely arid temperate climatic zone associated with the Qaidam Plateau, and the cold arid climatic zone associated with the northern Qiangtang Plateau. The conditions of the arid climatic zones of the northwestern QTP are under the influence of their geographical locations. It is difficult for warm and humid air currents to reach the locations because they are surrounded by mountains and are far from the oceans. The resultant arid climates are not conducive for vegetation growth, resulting in widespread bare land. Conversely, the humid area in the southeast has excellent moisture and temperature conditions, with the predominant vegetation being subtropical evergreen broad-leaved forests. However, the overall ESV is low due to limited woodland area.
The sub-frigid semi-humid climatic zone of the Nagqu Plateau and the sub-frigid humid climatic zone of the southeastern QTP are areas with high ESVs. The two climatic zones are under the influence of weather features such as shear lines. Pasture growth in the area is excellent and the grassland is contiguously distributed, leading to the high ESVs. The temperate arid climatic zone of the Ali Plateau (which is a mountain–plateau border zone), the sub-frigid semi-arid climatic zone of the southern Qiangtang Plateau, and the sub-frigid semi-arid climatic zone of the Qilian Mountains plateau are all areas with alternating climates. The ESVs of the climatic zones are mainly influenced by the differences in humidity conditions and natural resource endowment between the north and south, and the east and west. Their ESVs lie between those of two states described previously.
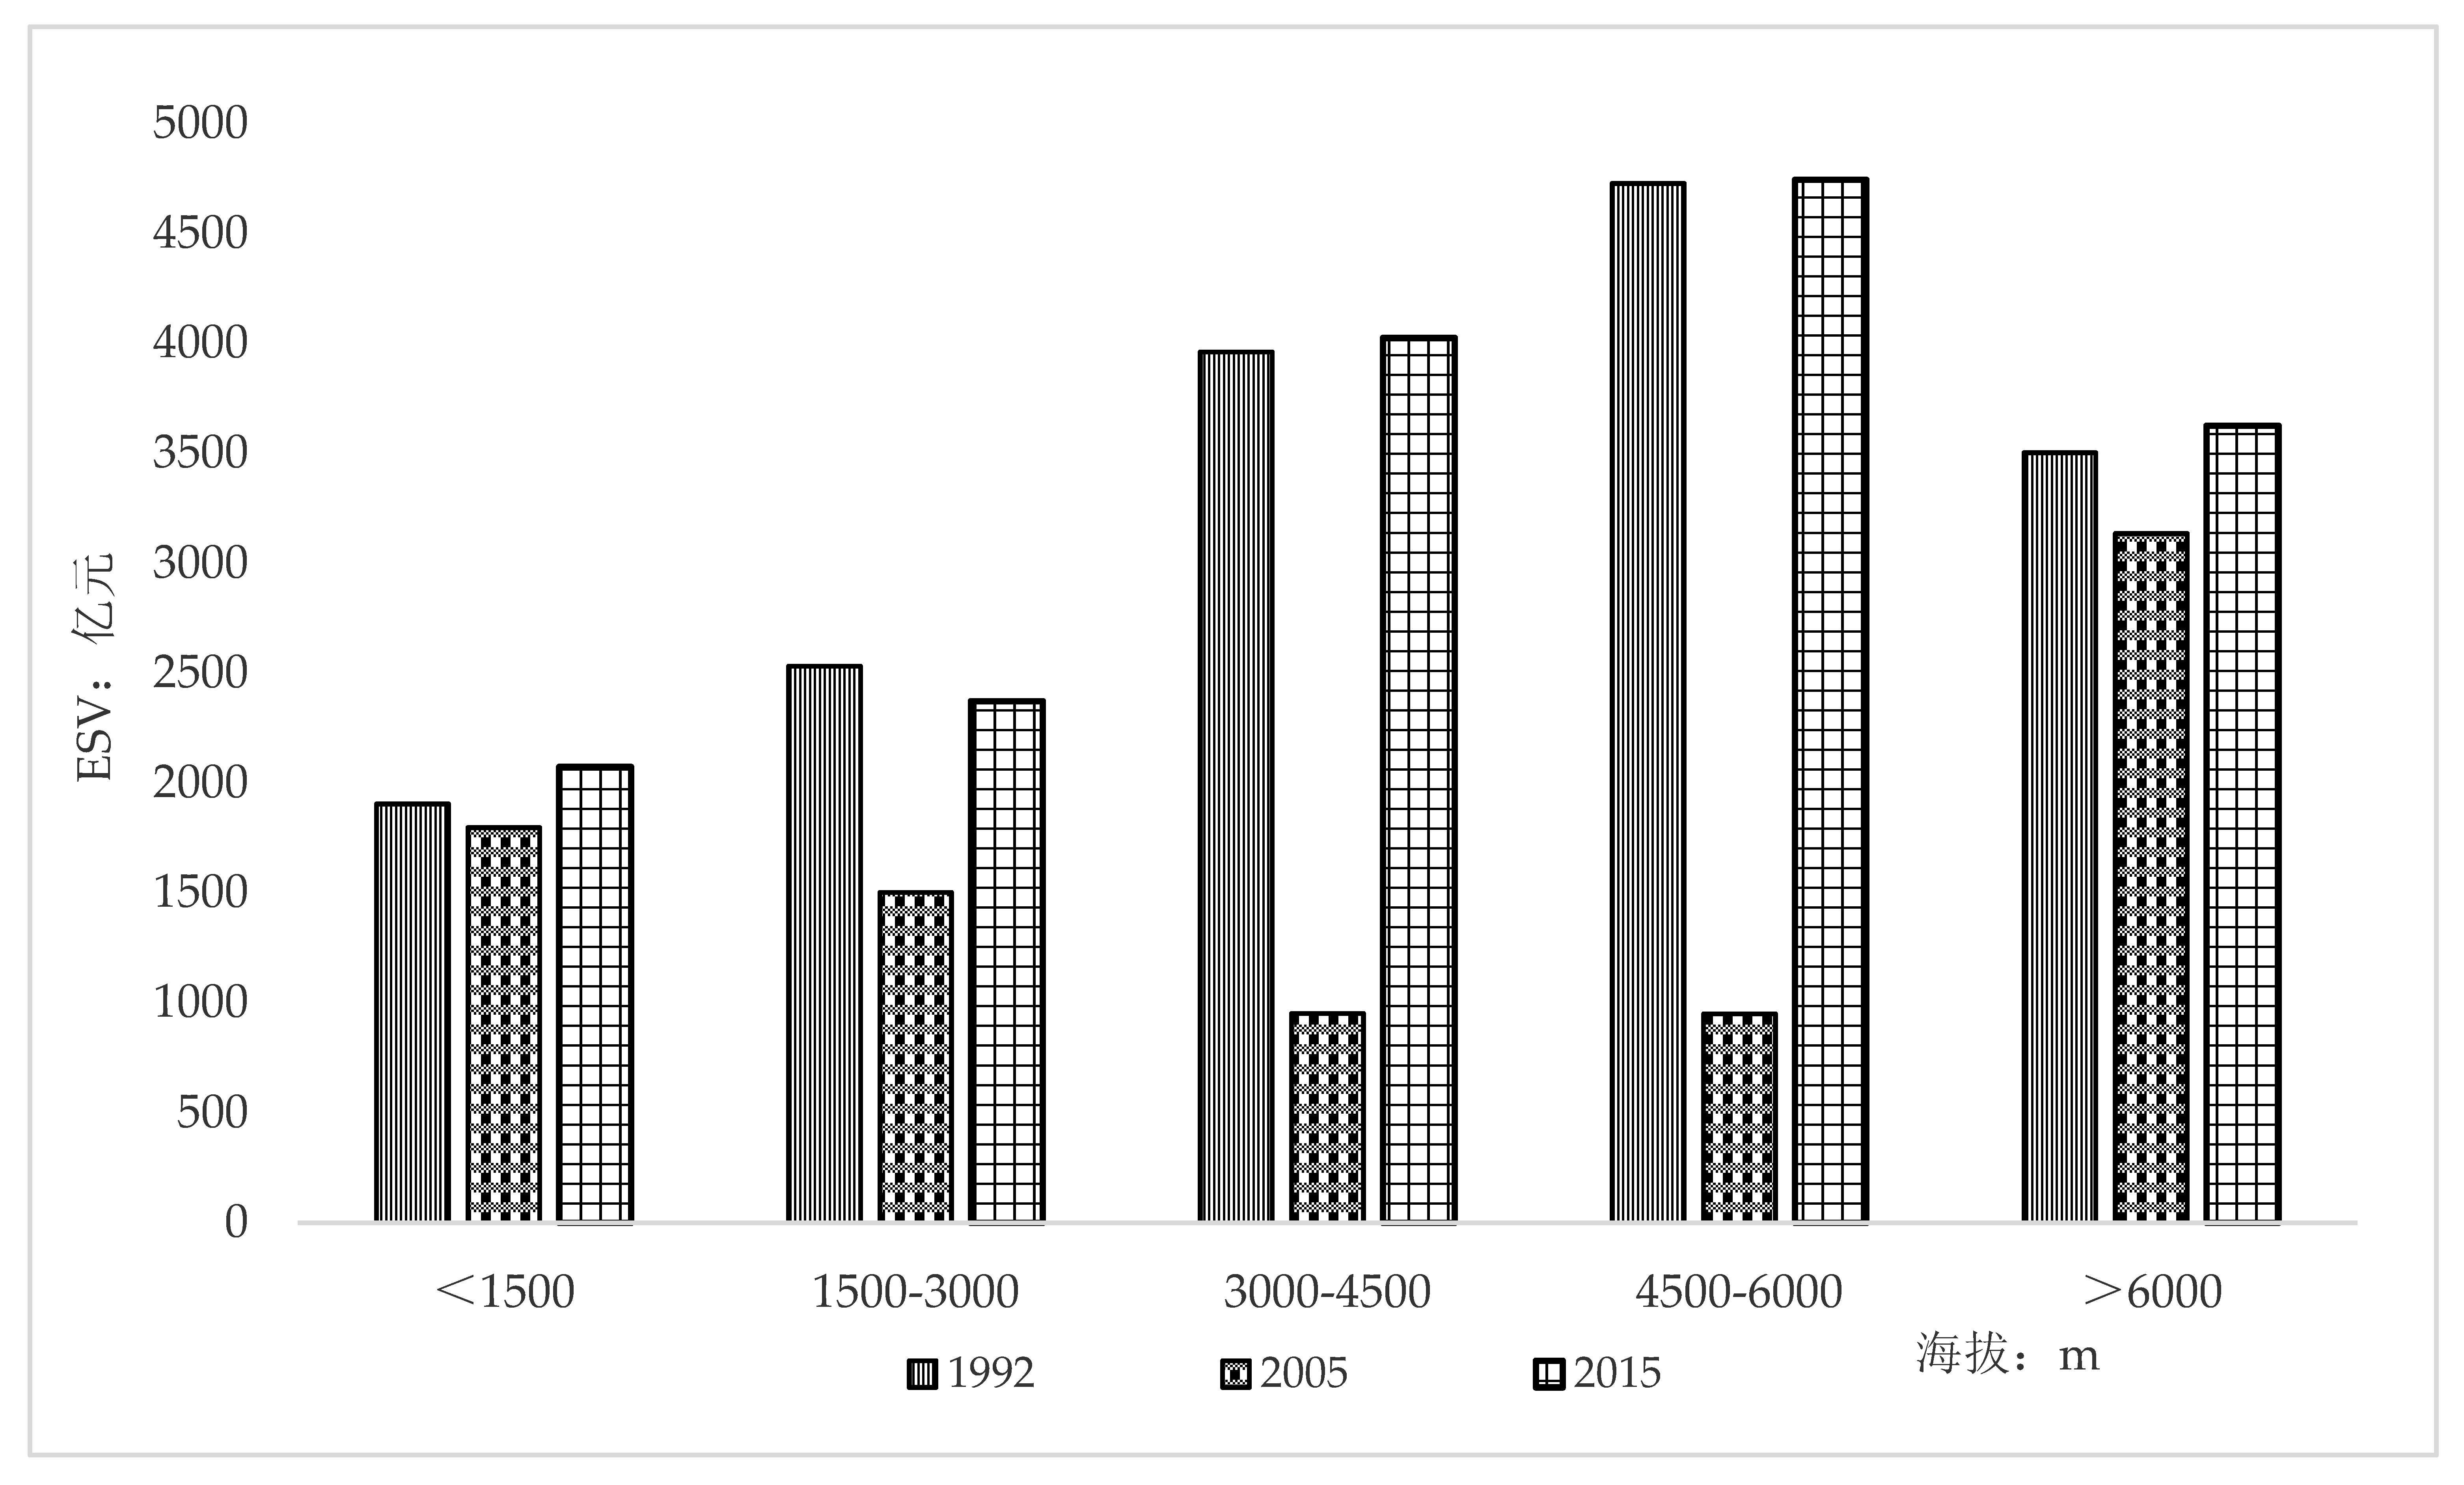
3.4.3. ESV Characteristics at Different Altitudes
The QTP ESVs are controlled by the scale and combination of land use types, resulting in dissimilar characteristics at different altitudes. There is a critical point at 6000 m above sea level (ASL), beyond which there are vast changes in temperature and precipitation (
Figure 7). The vegetation cover types become simplified, resulting in a substantial decline in the ESVs. In terms of the overall characteristics, the ESVs within the same altitudinal ranges decreased before increasing, with rising trends on the whole. Across the different altitudinal ranges, the ESVs of areas below 3000 m ASL exhibited fluctuating increases. These areas have dense population distributions and urbanization, resulting in large-scale land occupation and exploitation, all of which have led to the permanent destruction of already-damaged ecosystems.
In the 3000–6000 m ASL range, the ESVs declined sharply at first and then increased rapidly. The reason is that the altitudinal range hosts numerous human activities, including urbanization, intensive livestock grazing and rearing, and transportation infrastructure associated with the QTP’s rapid development in recent years. After a dramatic decline in 1992–2005, the regional ecology of areas at the altitudinal range gradually improved and their ESVs were enhanced substantially, which is attributable to the enhancement of ecological conservation activities after 2005. The measures were achieved following the implementation of the Operation Green Shield program and real-time monitoring using remote sensing technologies, which provided full cover and facilitated the monitoring of all nature reserves. In addition, many illegal buildings were demolished and numerous activities with negative impacts on the ecological environment were banned.
Areas above 6000 m ASL are not suitable for human habitation. The main land use types are frozen soil, glacial snow, and alpine meadows, all of which have inherently low ESVs. The changes observed at the altitude are relatively mild because human activities are limited, with sporadic alpine grazing being the only disturbance, therefore, human activities have less impact on the ESVs.
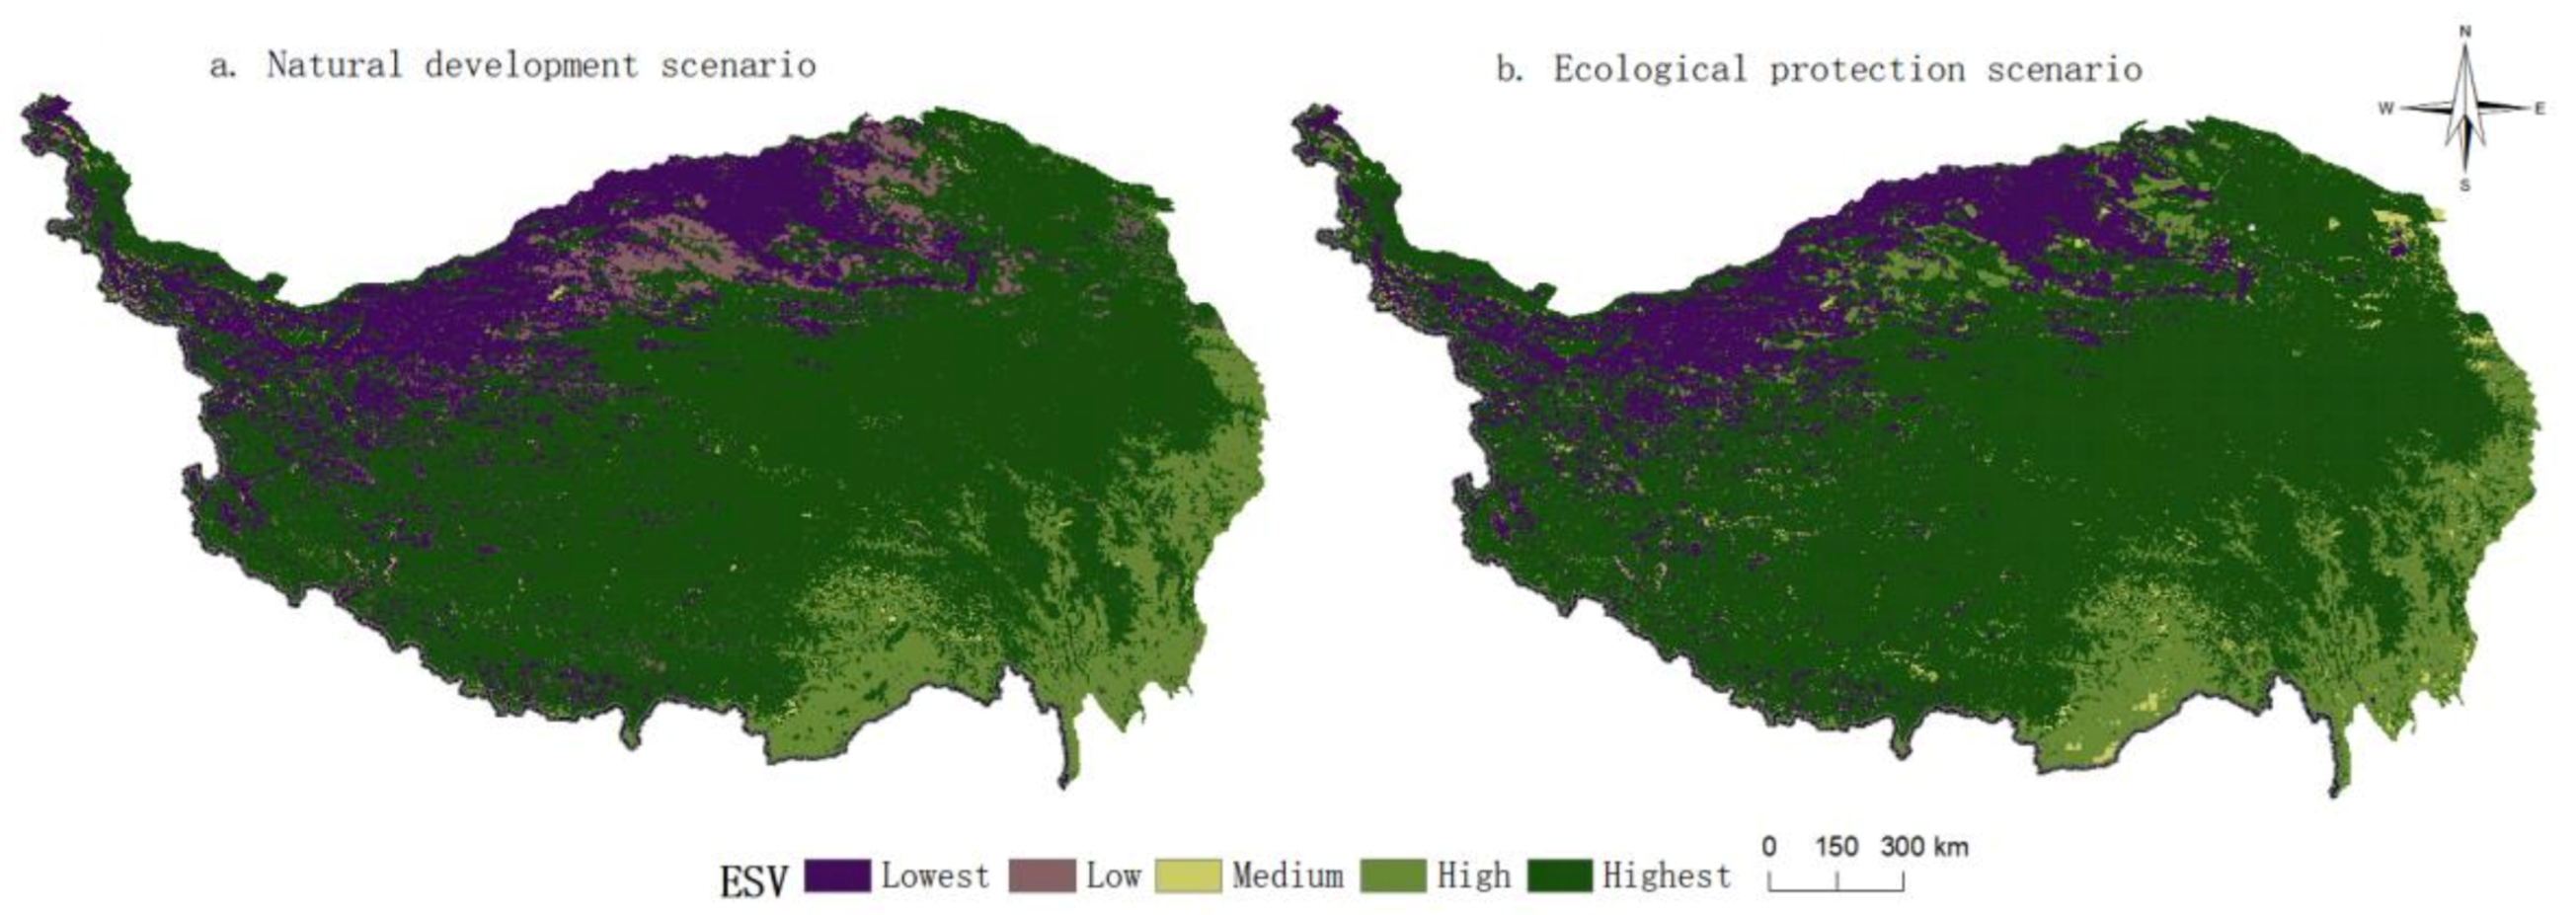
3.5. Simulation of ESVs under Future Land Use Change Scenarios
The earlier analyses show that QTP land use change is a key factor driving ESVs, with both variables exhibiting a strong coupling consistency in the dimensions of time and space. To ensure that the research results better serve the future developmental timeframe, two future scenarios were evaluated based on actual policies formulated for QTP ecological conservation. The first scenario is natural development, which is the continuation of the land use change law of the QTP from 1992 to 2015; the second scenario placed emphasis on ecological protection. A comparative analysis was carried out on the effects of regulation and control on changes to both land use and ESVs, so as to provide a theoretical basis for the formulation of appropriate regional policies.
3.5.1. Analysis of Future Land Use Changes under Different Scenarios
The areas of deserts, shrubland, bare land, and woodland increased under the natural development scenario. Deserts had the largest increase, amounting to 54,914 km
2 (6.30%), followed by shrubland, bare land, and woodland, with the rates of change being 2.10%, 0.97%, and 0.60%, respectively. Farmland had the greatest decrease (−0.81%), followed by glaciers, grassland, and urban land (
Table 4). Overall, urban land, shrubland, and farmland had transformation rates above 50%, with urban land having the highest rate, at 71.71%, and becoming mainly grassland, farmland, and bare land. The rate of transformation of shrubland was 56.48%, mainly into grassland and bare land. Farmland mostly became grassland and woodland, with the amount transformed into grassland being as high as 5714 km
2. All three land use types with the high transfer rates were largely transformed into grassland. The rates of transformation into deserts, urban land, and shrubland were all higher than 70%, with deserts being the highest at 74.86%. Approximately 80.23% and 18% of areas that became deserts were transformed from grassland and bare land, respectively. The rates of transformation into urban land and shrubland were 70.36% and 70.07%, respectively. Urban land was mainly transformed from farmland and grassland, while shrubland was mainly transformed from woodland and grassland. The rates of transformation either into or from urban land and shrubland were relatively high. In the case of shrubland, the difference between the two directions of transformation was 3874 km
2, with the amount of land transformed into shrubland being able to offset the amount transformed from urban land.
Under the ecological conservation scenario, the magnitudes of the various land use changes in 2015–2035 were relatively mild, with the overall trends being positive. The exceptions were grasslands and glaciers, which showed slight decreases. The reduction in the area of glaciers was the largest, at −0.66%, while that of grassland was only, −0.13%. In comparison, the area of urban land increased the most, from 2369 to 3068 km2 (1.48%). Under the ecological conservation scenario, shrubland had a transformation rate of 50%, at 5131 km2 and 60.15%. The lands were mainly transformed into grassland and bare land, with grassland land being the main direction. The rates of transformation of land use into shrubland, urban land, and farmland were all above 50%. The rate for transfer into shrubland was the highest at 63.81%, with the main sources being woodland, grassland, and bare land. Both urban land and farmland mainly originated from grassland. Under the ecological conservation scenario, the simultaneous conversions among grassland, woodland, and shrubland were prominent.
Between the two future scenarios, land use structure change was balanced, and the expansion of deserts and bare land was under control. Due to the limited amount of bare land on the QTP and the objective under the ecological conservation scenario being “to develop while protecting and to protect while developing,” it is necessary to consider population growth and developmental needs. Therefore, there would still be minor expansions in farmland and urban land. Glacial melting arising from global climate change would also occur.
3.5.2. ESV Trends under Different Scenarios
ESVs under the natural development and ecological conservation scenarios were 699.549 B and 729.768 B yuan, respectively. Compared with the situation in 2015, the natural development scenario led to a deterioration, with the ESVs decreasing by 2.88%. In contrast, the ESVs increased by 1.32% under the ecological conservation scenario, indicating an improvement in the overall ecological environment (
Table 4).
Under the natural development scenario, farmland, grassland, waterbody, and glacier ESVs decreased by 23.77%, 9.91%, 0.24%, and 12.02%, respectively. Among them, the farmland ESVs declined the most due to the encroachment of urban land. Deserts had the greatest ESV increase, from 789 million to 1.784 B yuan, reflecting, to a certain extent, the proliferation of the land use type. The magnitude of change in ESVs under the ecological conservation scenario was small. Only shrubland and glaciers exhibited ESV reductions; however, they were not considerable (2.68% and 13.19%, respectively). The ESV reduction for glaciers was greater than that for shrub, with the decline associated with glaciers being related to global warming and population pressure. During the simulation of the ecological conservation scenario, many restrictions were placed on the transformation of deserts, to increase their transfer costs. Nevertheless, the land use type still had a significant increase in area, leading to an increase in the ecological values of deserts by 7.51%. However, this was still a vast improvement compared with the 126.11% increase under the natural development scenario (
Figure 8).
4. Discussion
This paper has four important findings on the relationship between land use change and ecosystem service value. Firstly, QTP land use changes were consistent with ESV trend, consistent with other studies, the trend of improvement was generally maintained [
34], but it is attributable to changes in the properties of individual land use indicators arising from land use changes triggering a dynamic dependency effect with corresponding changes in the ESVs. Secondly, the changes in land use on the Qinghai-Tibet Plateau indicate that climate change and human activities are the two main causes of changes in land use structure, and the irreversible land use change caused by these two factors is the key factor that leads to the permanent damage of ecosystem value. Thirdly, eco-geographical area, climatic zone, and altitude were the key factors affecting QTP ESVs. Especially, areas below and above 6000 m presented dissimilar trends due to the different influential factors, such as interactions between land use structure and human activity limitations. The altitude factor of the Qinghai-Tibet Plateau affects the evolution of other elements through the control of climate and temperature. Fourth, enhancing the implementation of ecological and environmental protection policies on the current basis is conducive to improving the value of ecosystem services in the future, because policy intervention is undoubtedly a key measure to regulate ecological protection and human activities [
35]. This further supports the efforts of China’s environmental protection policies to enhance the value of ecosystem services.
The directions of transfer were dissimilar across the different land use types. In the past 23 years, the prominent changes were increases in urban land and deserts and decreases in shrubland and bare land. For glaciers and waterbodies, there were linear and inverse relationships between their increases and decreases. Based on the research of Xu et al., the QTP’s ESVs in 1995–2015 were mainly stable or rising [
36]. Zhang et al. found that changes in the area of level-1 land use types amounted to less than 7%, and there was an overall improvement in land cover conditions [
37]. The findings are consistent with the results of the present study. QTP land use changes showed a deteriorating trend with the expansion of urban land and bare land. However, China’s regulatory and governance policies on ecological protection after 2005 greatly reversed the trend, resulting in the transformation of other land use types into grassland. Consequently, ES supply was improved regionally.
Climate change and human activities: these two reasons have overall and local effects on the land use of the Qinghai-Tibet Plateau, which affects the changes in the value of ecosystem services. Climate change has been particularly prominent in the region over the past 50 years, with the warming in the region being two-fold the global average over the same period. Such changes have led to glacial retreat, permafrost degradation, and avalanches, which have generally influenced the land use change in the region. The sustained melting of glaciers has led to a reduction in area by 2.84%. Separately, climate warming has triggered overall warming and humidification, changes in precipitation, and acceleration of the water cycle, with water vapor transported inland from the oceans and evaporation from humid inland areas increasing, and, in turn, increasing the amount of water vapor in the atmosphere [
38]. Such trends have further accelerated the transformation of shrubland into woodland, bringing about an overall increase in ESVs. Bare land, shrubland, and glaciers exhibited declining ESVs to varying degrees. The conversion of glaciers to water bodies has increased the value equivalent of ecosystem services, but in terms of actual development, glacier melting has also brought other negative effects, such as the formation of barrier lakes, glacial lake outbursts, rainfall changes, natural landscape degradation, etc., as well as changes in grassland types, which have led to large fluctuations in grassland productivity, degradation, and desertification, and other negative effects, that will in turn affect the ecological service capabilities of animal husbandry, crop growth, and tourism development. Besides, human activities are certainly influencing and altering the fragile ecosystems in the QTP. The impact of human activities was primarily due to rapid population growth in the plateau as a result of economic activities such as tourism. The outcome was a rapid expansion of urban land, whose area increased by 96.92%. It is difficult to reverse such permanent changes. Land degradation caused by increased grazing is reversible. Transitional grazing in the early stages of the study played a key role in grassland degradation. However, after its restriction in the latter stages, the ecological environment improved significantly, leading to overall enhancements in the ESVs.
Simulations were carried out under two scenarios: natural development and ecological protection in this paper. Land use change was more balanced under the latter scenario, and the proliferation of deserts and bare land was inhibited to a certain extent. ESVs generally increased under the ecological protection scenario, resulting in enhanced sustainable development, indicating that China’s environmental policies had a beneficial effect [
39]. From 2000, the Chinese government and scholars began researching and managing the grassland–livestock balance challenge on the QTP. Overgrazing was reduced through the formulation and implementation of grazing prohibitions on the grassland and the grassland–livestock balance system. Other issues that were addressed included land desertification and surface soil erosion which were associated with excessive growth in the populations of wild animals that destroyed the high-altitude alpine grassland vegetation. Such actions have optimized the land use structure and ES capacity to a large extent. Under this basic law, the green development of the Qinghai-Tibet Plateau must consider differentiated regulation and dynamic adjustment. Differentiated regulation is mainly to establish land use methods that are coordinated with the dominant functions of natural ecological areas, and establish green energy levels such as national parks, natural reserves, and natural parks through large-scale protection and small-use models in large areas of primitive habitats. Encourage the development of ecotourism rather than excessive grazing to increase the value of ecosystem services; an active population and industrial urbanization policy should be implemented in areas with a foundation for urbanization and relatively abundant water resources, and relocate people from high altitudes (greater than 5000 m), which is not suitable for human habitation. In terms of dynamic adjustment, it is necessary to seek the leading influencing factors in areas where ecological value increases and decreases, and to conduct dynamic observations on the scale of population urbanization, agriculture and animal husbandry, and the scale of wildlife growth, and scientifically and rationally adjust the balance between them. To build a friendly ecological protection and utilization pattern within the scope of carrying capacity.
5. Conclusions
To achieve the research aim (to reveal the relationship between land use change and ESVs in the Qinghai-Tibet Plateau), a comprehensive theoretical literature in land science, ecology, and economics is reviewed to establish a conceptual framework of land use transfer matrix and ESVs, and evaluated the change of ecosystem service value under the two scenarios in the future. This paper adopts the method of ecosystem function research in the Qinghai-Tibet Plateau by predecessors and carried out a confirmative case study on the changes of ecosystem service value on the Qinghai-Tibet Plateau from 1995 to 2015, which found that the data results calculated by the model method were in good agreement with previous studies, which proved that the method and case selection in this paper were appropriate and universal. It can provide reference for other related research. We summarise some key theoretical implications here.
It is observed that the impact of land use change on the ESVs was synchronous and positive in the Qinghai-Tibet Plateau, although the change of some indexes weakened the value, the land use structure and ESVs of the Qinghai-Tibet Plateau generally developed in a good direction. In the process, climate change and topography are the leading factors affecting land use and ESV changes, while human activities played an important regulatory role in local areas. Proactive ecological protection Policies could effectively reverse the QTP’s Trend of land use deterioration and optimize its ESVs supply capacities. So, in order to alleviate the negative impact of climate change, it is necessary for the Qinghai-Tibet Plateau to always adhere to green economic policies such as agriculture, animal husbandry, and tourism, and joint efforts of global economies to maintain the integrity and authenticity of the Qinghai-Tibet Plateau ecosystem from irreversible damage. Active improvements should be made in controlling the amount of agriculture, animal husbandry, and livestock, controlling the disorderly development of urbanization, and advocating green and low-carbon tourism behavior.
However, although ecological protection policies need to be adhered to for a long time, this result cannot conceal the current policy crisis, and future evaluation and improvement of the rationality and effectiveness of policies are needed. In the future, China will still need to promote the protection of the Qinghai-Tibet Plateau through regional ecological public welfare forest policies, ecological transfer payments, and ecological compensation, explore new models for integrating farmers and herdsmen into the protection system is also needed. The current subsidy policy is based on the grassland area owned by the basic family unit and the unit compensation standard for ecological protection subsidies, as well as ethnic population subsidies, border residents’ subsidies, etc., and it has also formed some negative effects, including long-term government subsidies. Development inertia, human-to-livestock conflicts caused by insufficient feed for returning grazing to the grassland, and the fencing economy, and the difficulty of changing the way of animal husbandry caused by the limitation of development capacity. Their existence has caused large-scale payment pressure from the central government and the development of Tibetan governments and members of society. There is an urgent need to jointly explore new ways of land use in the Qinghai-Tibet Plateau and use new development models to promote the development of the Qinghai-Tibet Plateau during the period of ecological civilization. How can we stimulate the spontaneous motivation of local residents to optimize the land use structure and its ecosystem services? These still require a lot of scientific investigation and analysis, including comprehensive consideration of multiple dimensions such as education quality, employment skills, national concepts, industrial models, and protected area policies.
The present study had a key limitation with regard to methodology. It involved the combination of the equivalent factor per unit area algorithm with remote sensing image analyses to objectively analyze the patterns of change in land use in the QTP and ESVs, before carrying out preset simulations of future scenarios (with and without protection). It is unclear to what extent the simulated results can reflect the overall state. In future studies, the methodology could be optimized and improved by including an assessment of the qualities of different land cover types. In addition, the double threats of global change and human activities also persist in Central Asia, West Asia, Africa, and other regions [
40]. The results achieved for the other regions were quite dissimilar to that of China due to the different governance models adopted. In the future, the relationships and the mechanisms governing them should be compared and analyzed in other ecosystems, which would enhance our understanding of the factors influencing land use structure and ES optimization under different socioeconomic conditions.


