Article

An Economic Equilibrium Model for Optimizing Passenger Transport Corridor Mode Structure Based on Travel Surplus

1
School of Economics and Management, Chang’an University, Middle-Section of Nan’er Huan Road, Xi’an 710064, China
2
College of Transportation Engineering, Chang’an University, Middle-Section of Nan’er Huan Road, Xi’an 710064, China
*
Authors to whom correspondence should be addressed.
Sustainability 2021, 13(7), 4024; https://doi.org/10.3390/su13074024
Submission received: 20 February 2021 / Revised: 31 March 2021 / Accepted: 2 April 2021 / Published: 5 April 2021
(This article belongs to the Section Sustainable Transportation)

Abstract

:
Proper corridor configuration is the basic prerequisite for meeting demand to the maximum extent and optimally configuring transport resources. As the existing studies only pursue quantitative balance, without good understanding of the decision-making mechanism of passenger travel, they can hardly be used to guide effective infrastructure planning. The aim of this study was to put forward a new planning concept from the perspective of economics. Firstly, the decision-making mechanism of travel behavior was considered based on the demand subject, and the travel demand was classified. Next, the travel surplus of the demand subject was analyzed, and the travel decision-making criterion of maximizing the travel surplus was put forward. Then, a discrete economic equilibrium model for structural optimization of the passenger transport corridor was constructed and solved by the GlobalSearch algorithm. Finally, the effectiveness of the model and algorithm was verified through examples. The results indicate the good convergence of the algorithm. Different corridor travel demand, time value distribution and fixed cost of service mode all have great influence on the service mode configuration of the comprehensive transport passenger corridor and basically conform to the internal mechanism of supply and demand. The results show that the model and algorithm proposed in this paper are valid and can provide effective reference for the design and policy making of passenger transport corridor mode supply.

1. Introduction

The mode configuration of regional transport corridor is an important part of comprehensive transport network planning. In recent years, with the rapid expansion of the scale and quantity of various transport modes, coordination problems such as “preemption” of resources, redundant construction and waste of capacity among corridors have become increasingly prominent [1], and so far the problem of structure surplus in China’s transport has become very severe [2]. How to make efficient use of scarce resources, optimize the network layout of transport corridors and improve the transport capacity of the corridors has become an urgent problem to be solved in the optimal configuration of regional transport network resources.
Optimal configuration of transport modes in regional transport corridors is an important cross-cutting field of modern transport planning science, complex system science, economics and management science, etc. As a consistent research focus for scholars, it is also a key problem that has not been solved [3,4]. The existing research on optimal configuration of transport modes can be divided into three categories:
The first is from the supply-side perspective based on the technical and economic characteristics of transport modes. This kind of research is mainly based on the definition and quantitative evaluation of the comparative advantages of various transport modes, such as safer trains, flexible cars, fast airplanes and low water transport costs, so as to gradually form a corridor configuration method based on the total amount control method [5] and game theory [6,7,8,9,10]. Generally speaking, corridor transport modes are mainly configured from the supply side. However, with the increase in the scale of various transport modes, there are more alternatives, and the influence of demand selection on transport mode configuration has gradually become evident [11,12]. This kind of optimal configuration based only on the supply side has become impractical.
The second is from the demand-side perspective of choosing behavior based on demand mode. Most researchers focus on the demand structure of comprehensive transport corridors and, on this basis, carry out corridor configuration. Since the large-scale application of the demand analysis model in transport planning, it has gradually developed into two generations of models: aggregate and disaggregate models. Due to lack of complete theoretical assumptions, the need to collect a large quantity of data in application and the poor transferability of lumping results in time and space, the aggregate model is rarely used in transport mode selection. The disaggregate model takes individuals as the research object and analyzes passengers’ travel option behavior. It is favored by researchers because of its high data utilization rate as well as good time and geographical transferability [13,14,15,16,17]. It provides a strong theoretical and methodological support for promoting the study of passengers’ travel mode selection [18,19,20,21]. However, using it to directly configure the comprehensive transport corridor mode still has the following limitations: (1) There is a deviation in understanding travel demand subject. The existing research mainly focuses on travelers. In fact, there are dual characteristics of travel subject and demand subject. The former is the bearer of the utility and cost of travel behavior, while the latter is the actual traveler. The existing research considers factors more concerned by travel entities but has not yet separately considered the travel demand subject and travel subject. (2) The disaggregate model is based on the utility maximization theory, which studies the choice of travel behavior on the basis of existing transport modes. However, the best choice under limited supply is not the most satisfactory choice, and it cannot explain the travel intention of potential travelers. From the perspective of planning, comprehensive transport corridor planning should study what kind of transport supply should be planned in the corridor and how much specific transport supply should be planned with limited data. (3) Travel utility includes absolute utility and relative utility. In the general commodity and labor market, consumers realize the conversion from money to utility by purchasing goods, which is a direct utility conversion. However, in the field of transport, due to the particularity of obtaining “displacement”, people’s purchase of “displacement” is not realized through the use of “displacement” itself but through the satisfaction of the demand subject after the completion of “displacement”, which is an indirect utility conversion and not the absolute utility that the realization of “displacement” really brings to the demand subject. Therefore, the study of travel choice based on utility theory involves comparing and choosing among alternative schemes, which cannot reveal the economic essence of the process from travel demand generation to travel decision making.
The third is the planning model of corridor structure optimization based on the interaction between supply and demand by some researchers. For example, Li [22] constructed a double-level multi-objective planning model for corridor passenger transport structure with the goal of corridor system efficiency and operation investment. Considering the interaction between passenger travel choice behavior and transport supply, Wang Ying et al. [23] designed a two-stage calculation method of passenger flow sharing rate based on supply and demand matching. Jiang Pan et al. [24] set up a double-level planning model for optimizing the comprehensive transport corridor layout of the urban agglomeration with the goal of maximizing the social benefits of the corridor and minimizing the generalized expenses of individual travelers. These kinds of research results provide important theoretical and methodological support for comprehensive transport corridor optimization from a quantitative point of view, but it is further found that this kind of planning model places greater emphasis on quantity balance, that is, arranging transport capacity according to the quantity of demand. Under the condition of a market economy, transaction is the main way to unify supply and demand, and if the economic efficiency fails to meet the demand, there will be invalid supply. Economic equilibrium is the essence. It is also difficult to overcome the limitations of the logit model [25]. There is little research on corridor configuration from the perspective of economic equilibrium.
Therefore, the dual characteristics of passenger travel and the decision-making mechanism of passenger travel based on the demand subject were fully considered in this study to break through the limitations of traditional utility theory and propose a new planning concept from the perspective of economics with the aim to optimize a supply structure of a comprehensive transport passenger corridor based on economic equilibrium. The difference between traditional research and this research is shown in Table 1.
This paper is organized as follows. Section 2 mainly classifies travel demand, and Section 3 outlines models and presents solution methods. Section 4 illustrates the proposed models and solution approaches through the medium- and long-distance passenger corridor. Section 5 outlines the conclusions and contributions of the study and directions of future research.

2. Travel Demand Classification

There have been many studies on the classification of passenger transport demand, such as commuting, attending school and working, according to travel characteristics. In terms of income, passengers can be divided into high-income, low-income and price-sensitive passengers, etc. This single classification standard cannot fully reflect the choice mechanism of passenger travel mode. Generally speaking, economy is the most critical factor determining the choice of passenger travel mode. Passengers have to pay a certain economic cost when traveling. Because of the different nature of passenger travel, there will be a correlation between passengers and the economic cost paid. For different correlation, there will be different choice of travel modes. It is important to clarify this point when analyzing the economic mechanism of passengers’ travel choice. Referring to Wu’s research [26], this paper divides travelers into three categories: the first is consumption travel, in which travelers fully bear the economic costs related to the travel process, such as visiting relatives and friends, shopping and journeys. The second is productive travel, which does not involve its own economic interests. The economic costs of travel are all undertaken by other relevant interest subjects, such as business negotiations and official business trips. The demand subject and travel subject are separated from each other, and the demand subject is the bearer of the utility and cost of travel behavior. The third category is emergency travel, such as emergency rescue and disaster relief and medical treatment. The aim of this study was to explore the internal mechanism of mode selection based on demand subject.
According to the value of travel time and its correlation with its own interest, the above three types of travelers can be subdivided into six types of travel groups in Table 2, in which C represents all monetary expenses paid and T represents the value of travel time. Different demand subjects certainly have different technical and economic demand characteristics, but in essence, under the condition of a market economy, transport demand subjects all seek to maximize their own interests, which determines their behavior in choosing transport modes.
It should be noted that for productive travel, the traveler does not bear any travel expenses, all the travel costs are paid by relevant subjects and the private opportunity costs it bears are negligible. In reality, there is usually a system to regulate the traveler’s choice behavior, such as who can take airplanes and who can take a soft sleeper. However, the fixed thinking set of such travelers is usually “better high than low”, and they will choose the best travel mode as long as they can avoid institutional constraints. Since the subject that determines the travel of such travelers is the economic unit, other costs of such travelers are not considered for the time being.

3. Model and Methodology

3.1. Hypotheses

Hypothesis 1 (H1).
Hypothesis of the rational man, that is, the demand subject always tends to choose the transport mode with the largest travel surplus, in other words, according to the principle of maximum travel surplus.
Hypothesis 2 (H2).
Only the service mode configuration problem of parallel connection of different transport modes between the same origin and destination (OD) in the corridor transport network is considered. The combined transport of various transport modes between the same origin and destination points is not considered.
Hypothesis 3 (H3).
There is only one transport line corresponding to the same level among each transport mode in the regional transport corridor.

3.2. Travel Surplus Analysis

Consumer surplus refers to the difference between the total value that a consumer is willing to pay to consume a certain commodity and the actual expense when the consumer buys the commodity [27]. As a rational person, the essence of the travel demand subject’s choice of transport mode is to obtain travel surplus. The size of the travel surplus is determined by the travel profit (travel value) V a i and travel loss (travel cost) C a i j , as shown in Equation (1). The travel value V a i is mainly affected by the purpose of travel and the subject of travel demand. Different travel purposes and different subjects of demand have great differences in travel value. For a detailed study of travel value, please refer to the work of Sun et al. [28]. Since the specific numerical calculation of travel value is an engineering problem, this study used quantitative analysis to simplify the analysis.
E a j = V a i C a i j
Suppose the passenger transport corridor in a certain area includes A pairs of O–D, there are N categories of travel demand subject, and M modes of transport are to be planned. The pair of O–D is a A , the travel demand subject is i I and the transport mode is j J . Under random conditions, each mixed strategy is a probability vector s a i = { s a i j | j J } T for the ith travel demand subject in the ath O–D pair, indicating the probability of choosing various transport modes. s a i S a i , in which S a i is the strategic space of the ith travel demand subject. For all transport modes j J , 0 s a i j 1 and j J s a i j = 1 , so the strategic space of all travel demand subjects is i I s a i . Make Φ a i ( s a i | i I ) represent the travel surplus function of the ith demand subject when the strategy combination of all types of travel demand subjects is ( s a i | i I ) i I s a i .
The existing research on travel cost is mostly on the explicit travel money cost and travel time cost, but in the actual process, passengers’ travel behavior, is also affected by hidden factors such as physiology and psychology. Therefore, it is considered that for the ith travel demand subject, the travel cost of the jth transport service mode is C a i j :
C a i j = P a j + ( T T a j ( v a j , D a j ) + W T a j + C T a j ) β a i + T T a j ( v a j , D a j ) + W T a j + C T a j ) γ a i
Then, for the jth transport mode, the travel surplus of the ith travel demand subject in the ath O–D pair is:
Φ a i j ( s a i j , s a i ) = ( V a i C a i j ) s a i j = ( V a i ( P a j + ( T T a j ( v a j , D a j ) + W T a j + C T a j ) β a i + ( T T a j ( v a j , D a j ) + W T a j + C T a j ) γ a i ) ) s a i j
Total travel surplus of ith travel demand subject in the ath O–D pair is:
Φ a i ( s a i j , s a i ) = i J Φ a i j ( s a i j , s a i )
where γ a i is the other psychological cost coefficient of the ith travel demand subject in the ath O–D pair. The psychological cost of travel is the psychological pressure and mental burden caused by various subjective and objective factors. For more research on the psychological cost, please refer to the research of Algers [29]. Since the measurement of psychological cost is a complex process of utility transformation, Sun et al. proposed a formula for calculating the psychological cost of travel [28], which involves many factors and requires travel surveys to obtain relevant data. To simplify the problem, quantitative processing was used in this study. β a i is the travel time value coefficient of ith travel demand subject in the ath O–D pair. For the calculation of β a i , at present, the income method, production method and willingness-to-pay method are mainly used. For more research on the value of travel time, please refer to the research of Andrew Daly et al. [30].
Table 3 summarizes the notation used throughout this paper.

3.3. Model Construction

There are many transportation modes with different technical and economic characteristics in a corridor, but the fundamental driving force for providing transportation services is to meet demand as a means to maximize profits. Different transportation modes have different fixed structures, and their operational efficiencies and benefits have different sensitivities to transportation demand characteristics. The core is that implementation of an equilibrium return operation introduces corresponding requirements for a given transportation volume. This is one of the key conditions for rational configuration of transportation modes to clarify the relationship between a price for a transportation mode to implement an equilibrium return operation and a possible transportation volume. Using cost–volume–profit analysis (CVP), for any type of transportation mode j, the transportation price rate pj must meet the following condition:
paj − (Faj/Qaj + AVaj) ≥ Raj
In the equilibrium regional passenger transport corridor, the characteristics of various transport modes can maximize the total travel surplus of various travel demand subjects of the corridor. At the same time, due to the competitiveness of the market economy, the overall realistic result of the supplier’s pursuit of profit maximization under the action of the law of value is often the average remuneration level of the industry. The fixed structure of different transport service modes is different, so various transport modes pose requirements for the possible transport volume to meet their own basic equilibrium rate of return. Therefore, the structural configuration models of passenger corridors in various ways can be expressed as follows:
Max i I Φ a i ( s a i j , s a i )
s . t . Φ a i j ( s a i j , s a i ) 0
P a j ( F a j i I N a i s a i j + A V a j ) R a j
i J s a i j 1
0 s a i j 1
The objective Function (6) reflects that the ath O–D pair has the largest overall travel surplus for the transport demand subject, showing that the fundamental goal of transport corridor supply configuration is to meet the demand to the maximum extent.
Equations (7) and (8) reflect the feasible region of model solution, which is a nonlinear constraint condition, so the model solution is an optimization problem of nonlinear programming.
Equation (7) shows that the basic principle that the transport demand subject chooses the jth transport mode in the ath O–D pair is when its travel surplus is greater than 0, otherwise it is meaningless to travel.
The economic significance of Equation (8) is that if the possible turnover of the jth transport supply for the ath O–D pair at Pj price level is not less than Qj, then this transport mode has sustainable market vitality on this corridor, and vice versa. Among them, R is the basic rate of return of various modes of transportation. When R is 0, the various modes of transportation only realize break-even operation.

3.4. Solution Algorithm

The above discrete economic equilibrium model is a nonlinear programming problem, and the solution of the model is non-convex optimization. GlobalSearch is a function for solving the global optimization problem of multivariable constrained nonlinear minimization in the MATLAB optimization toolbox, which can search multiple basins, use multiple initial points to search the extreme points in their basins, and then find the global optimum [31]. Therefore, the GlobalSearch algorithm was adopted in this study to solve the discrete model of the passenger corridor. The flow chart of the model optimization algorithm is shown in Figure 1. Convergence is one of the basic requirements for optimization algorithms. Different types of algorithms may have different definitions of convergence. This paper simply defines the convergence of global optimization algorithms as follows: Let the sampling points of the algorithm be { P n } , make f n = f { P n } , then when lim n f n = f * , the algorithm is said to converge to f * . While seeking global optimum, the global optimization algorithm uses the decentralized search algorithm to continuously update the test points and obtains various local optimum solutions until all the test points are searched. Then, it sorts the local optimum solution vectors and outputs the optimum solution. At this time, the algorithm searches out the global optimum, which shows that the demand subject in the passenger transport corridor insists on their own choice and reaches the equilibrium state of supply and demand with the supply subject, thus maximizing the travel surplus of the whole society travel demand subject while guaranteeing the break-even operation (i.e., R = 0) of various transport supplies.

4. Examples

With the change in travel distance, the transport demand characteristics of the passenger corridor are quite different. We took the medium- and long-distance transport corridor as an example and used the scenario simulation method to analyze the influence of parameter changes on the structural configuration of the medium- and long-distance passenger transport corridor in the hope of reaching meaningful conclusions.

4.1. Specification of Model Parameters

The parameters specified in this paper mainly include the two aspects of travel demand and supply subject. The specific parameters are shown in Table 4 and Table 5 below. It should be noted that the parameters assumed in this paper are only used for example analysis, and the main purpose is to clarify the theory and analysis method, rather than present its authenticity. β1 and β2 represent two different time value coefficients.

4.2. Convergence Analysis

For the above model and algorithm, the GlobalSearch solver of MATLAB 7.0 was used for the solution, and the interior point solver was used when calling GlobalSearch. The results of the following analysis were all obtained by this solver.
We studied the convergence of the global optimization algorithm proposed above, which is an important basis for further research on structural optimization of the comprehensive transport corridor. 
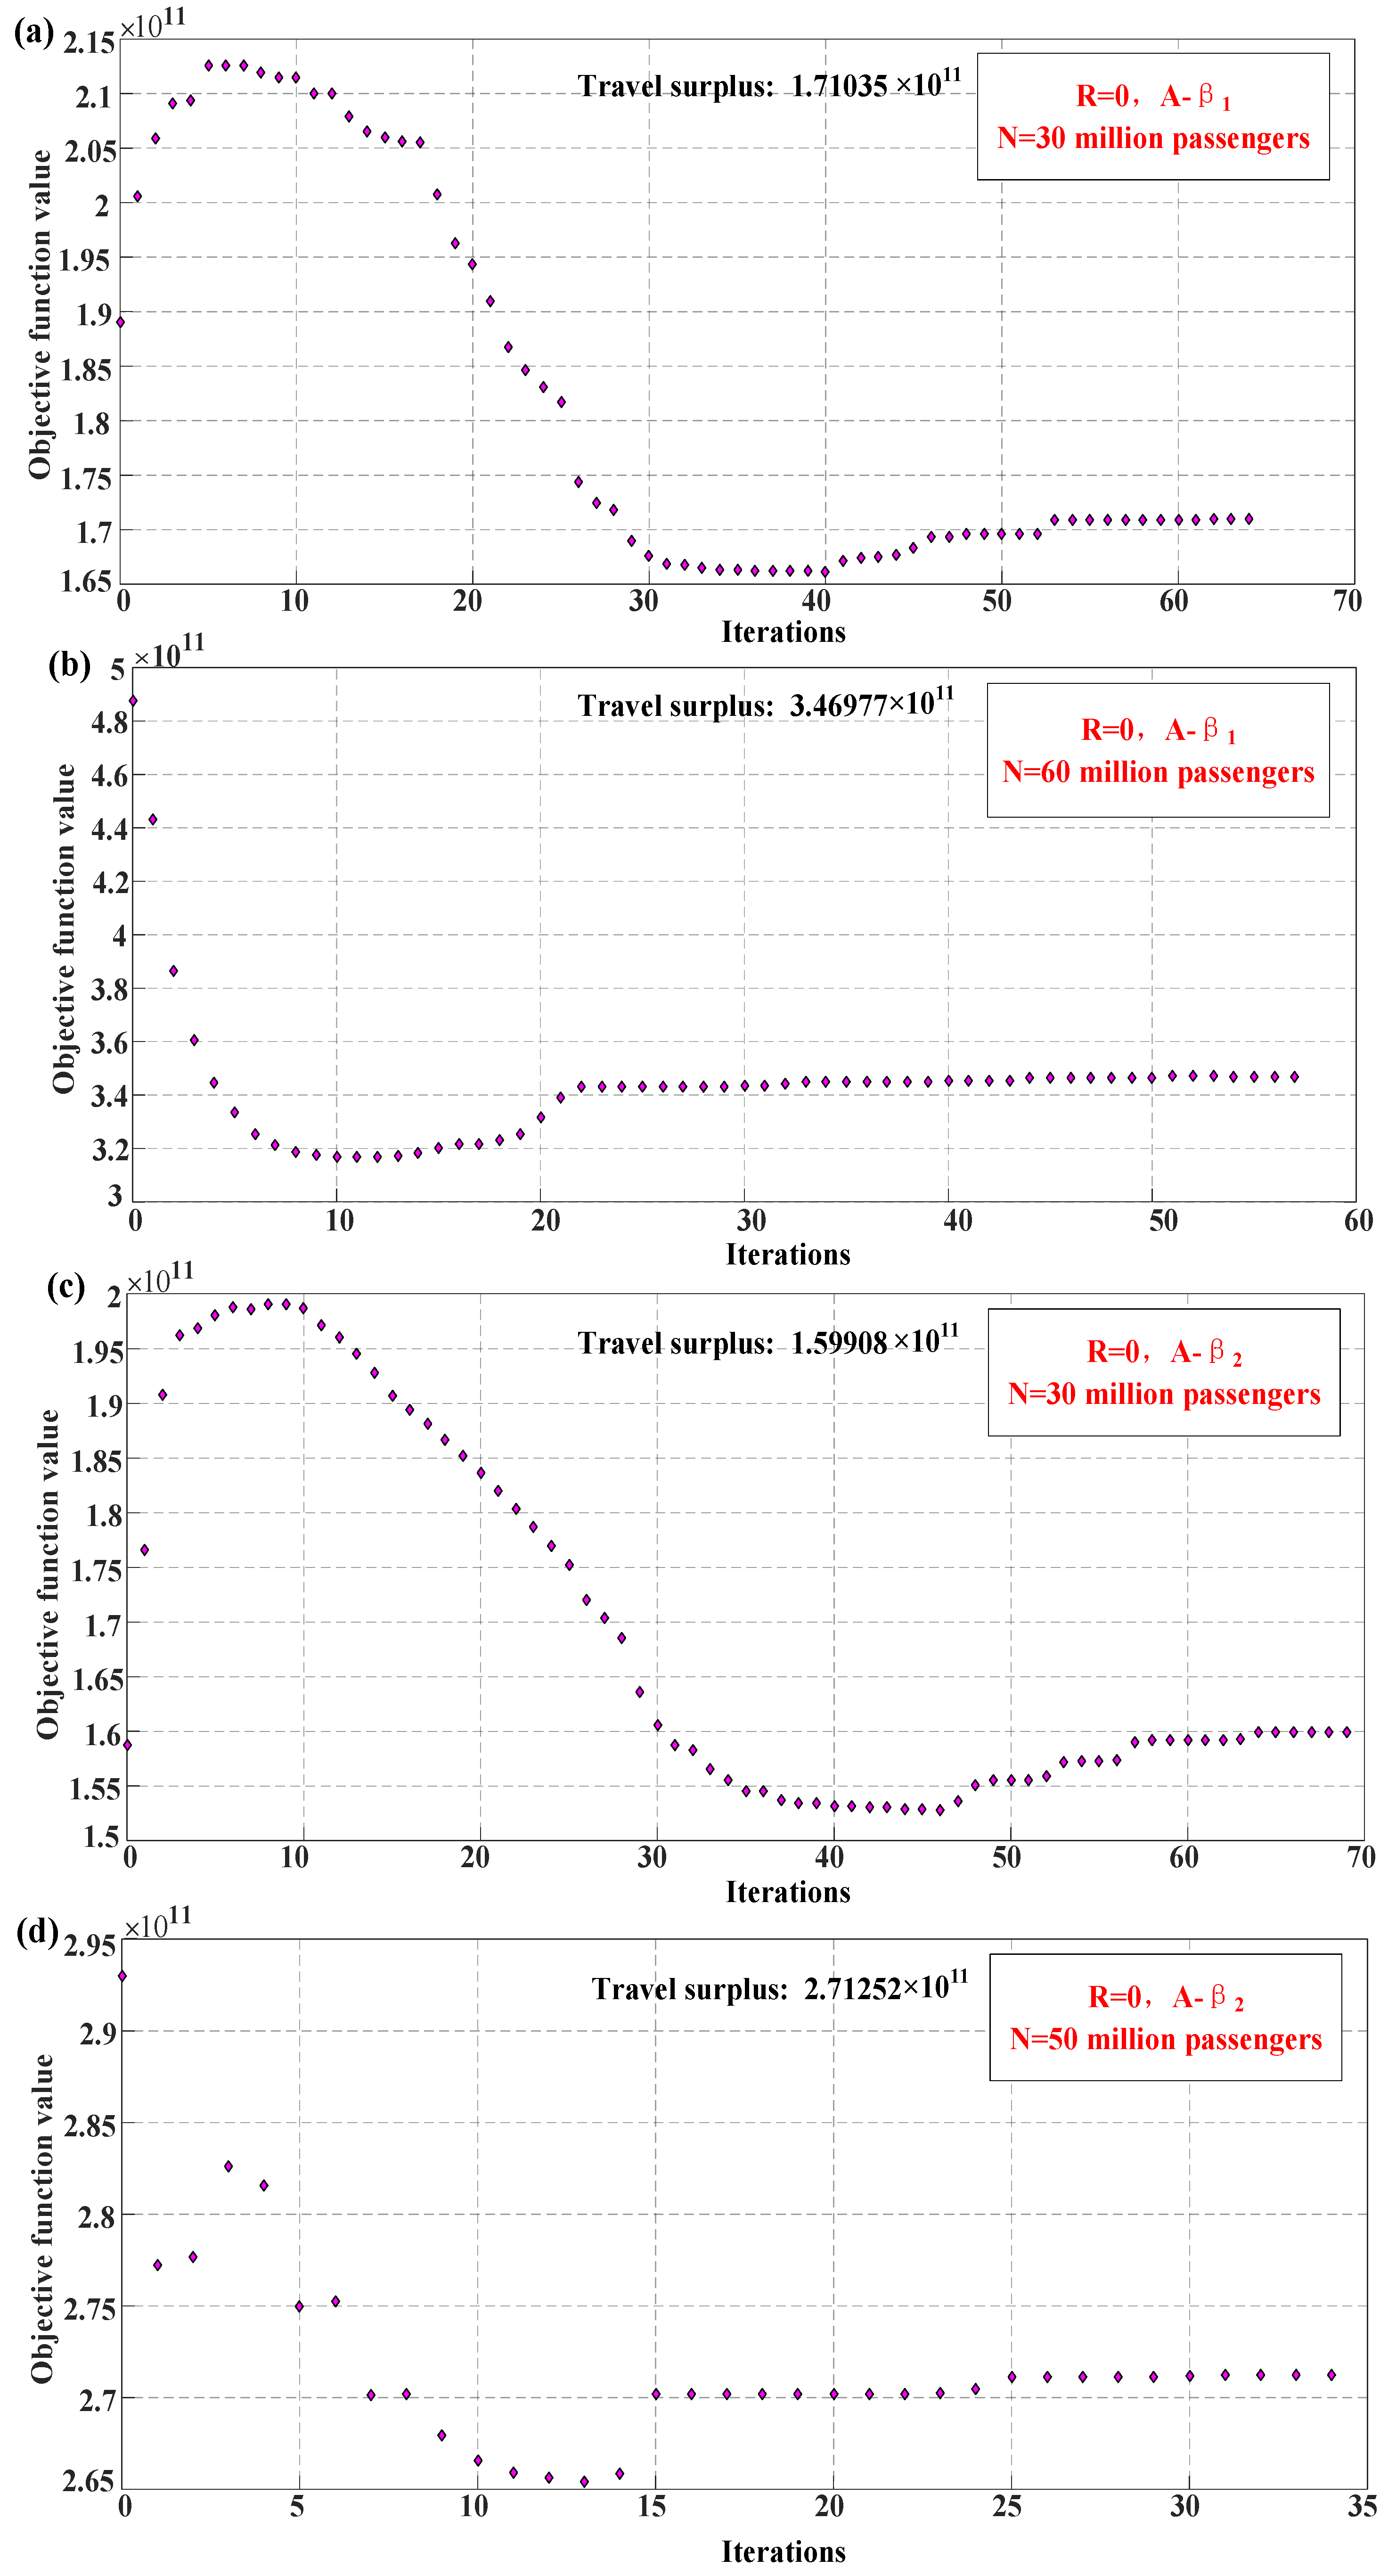
Figure 2 shows the model convergence analysis results of value distribution and travel demand at different times. We used the minimum value of f instead of seeking the maximum value of the objective function f. The abscissa represents the iteration times of the optimization algorithm when seeking global optimum, and the ordinate represents the objective function of the model, i.e., the travel surplus of the whole society. Figure 2a reflects the convergence of the algorithm when the travel time value distribution of the travel demand subject is β1 and the travel demand is 30 million. It is found that after nearly 65 iterations, the algorithm basically converges and finds the global optimum. At this time, the travel surplus of the whole society reaches 1.71 × 10¹¹. When the demand increases to 60 million, the convergence effect of the algorithm is better. When the value distribution of travel time is β2, the results are similar to those in Figure 2b,c, and the algorithm basically converges, which shows that the algorithm in this paper is basically feasible. This is the premise of parameter influence analysis in the following paragraphs.

4.3. Influence of Travel Demand

Based on the above parameter assumptions, we observed the influence of total travel demand on the structural configuration of passenger transport modes. We assumed that the equilibrium return rate of various transport modes services is 0%, that is, under the guaranteed break-even operation of various transport modes, the proportion of various travel demand subjects is combination A, and the corresponding travel time value distribution is β1 and β2. The economic equilibrium state of supply and demand of passenger transport corridors with 10 million to 130 million travels was simulated and analyzed, and the results are shown in Table 6 and Figure 3 and Figure 4.
From Table 6 and 
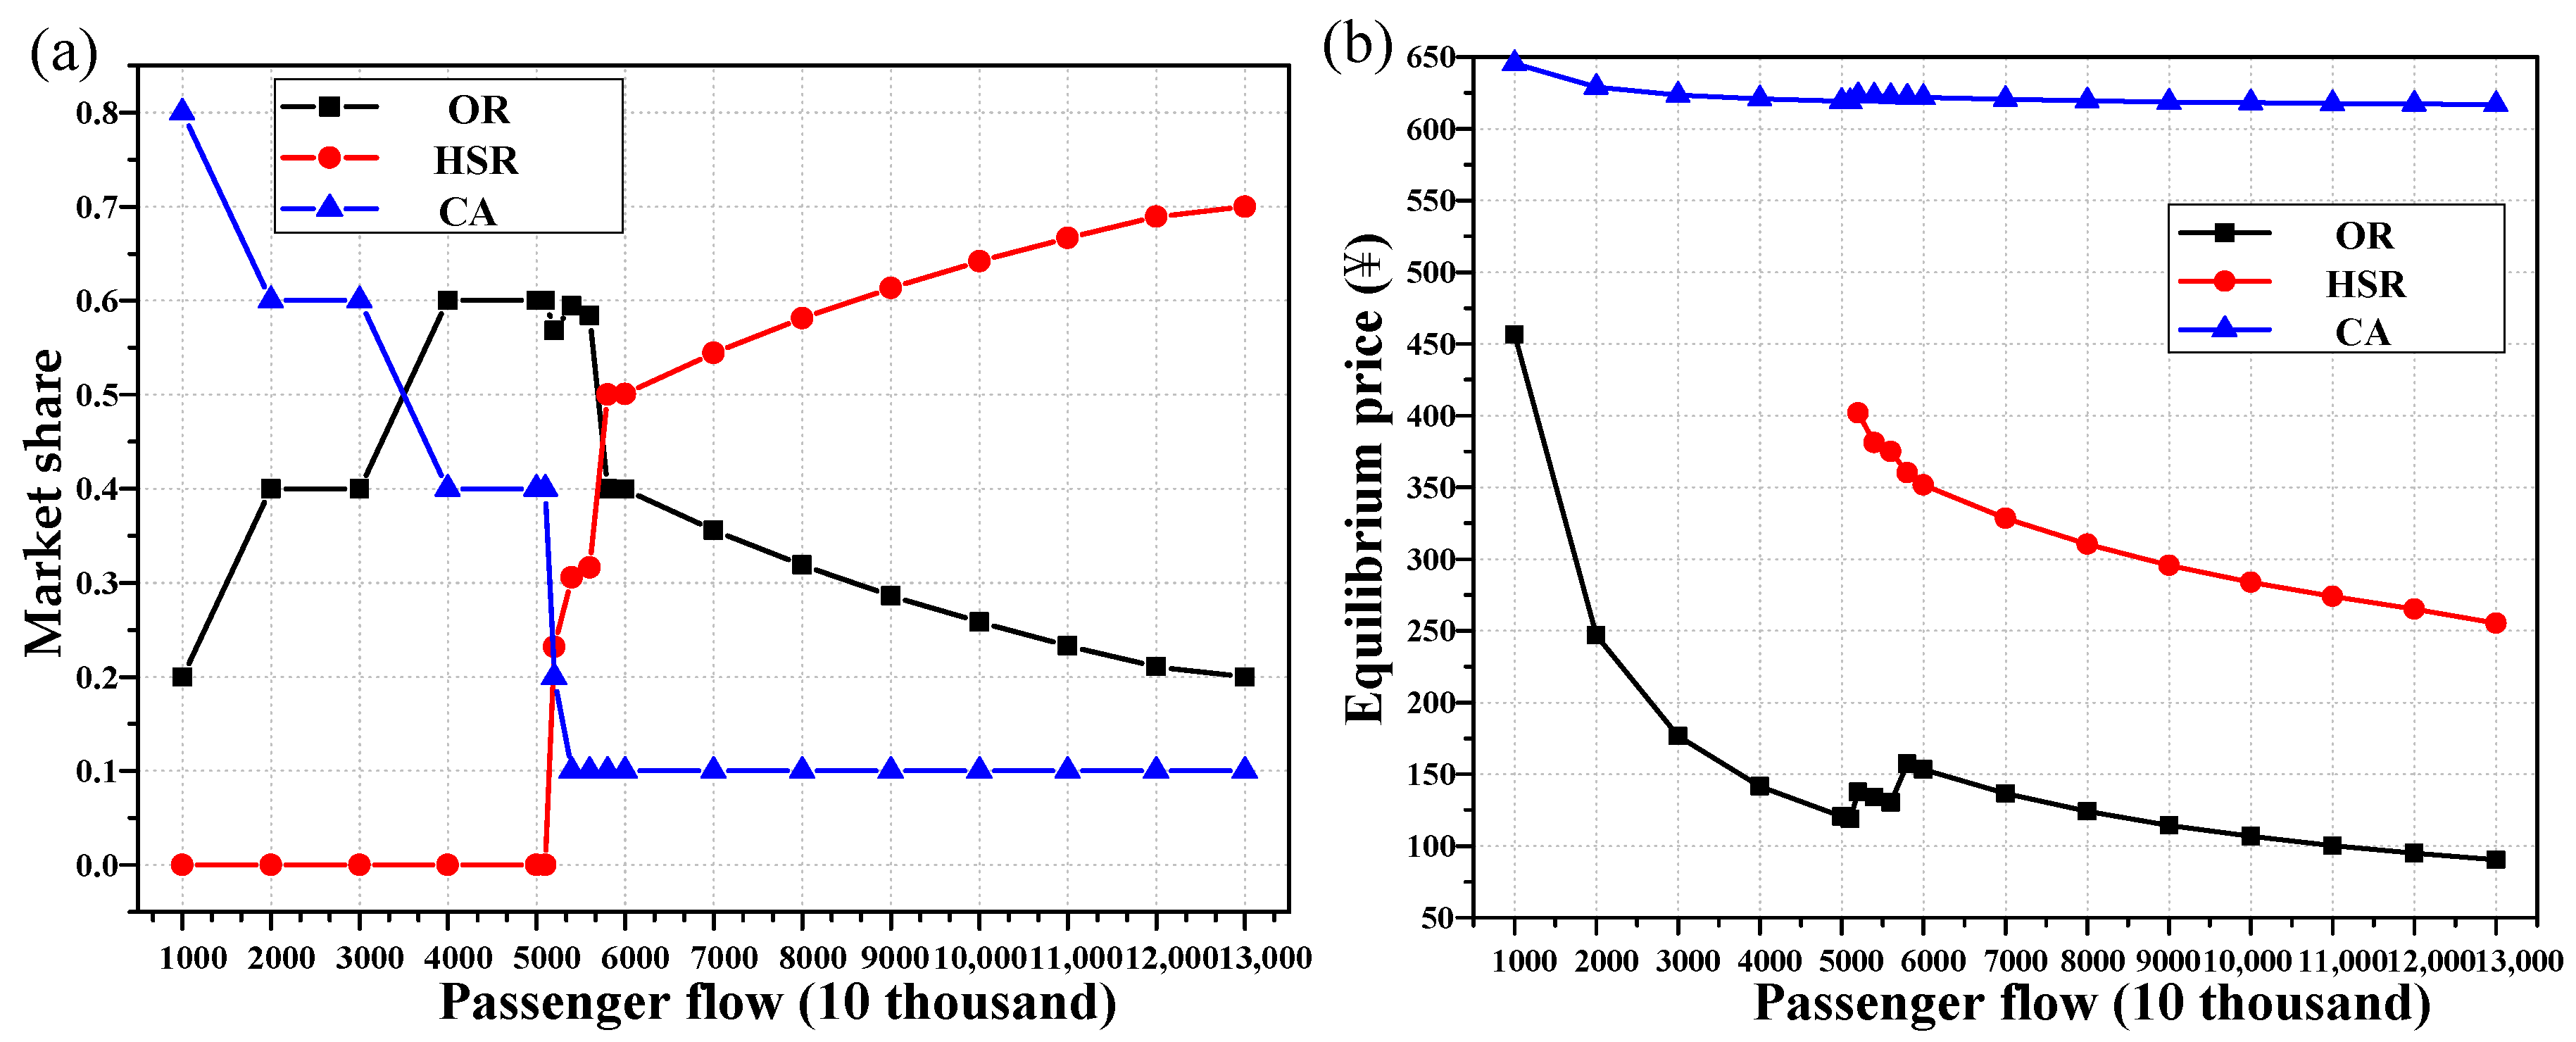
Figure 3, it can be seen that when the time value distribution of travel demand is β1 and the travel demand is 10 million to 51 million, only two service modes need to be configured for the passenger transport corridor: conventional railway and civil aviation. Because the demand for high-speed railway is not enough to ensure its break-even operation, the high-speed railway will not be opened for the time being, otherwise the travel surplus of the whole society will be reduced. At this stage, with the increase of travel demand, the equilibrium fares of conventional railway and civil aviation are gradually reduced, in which the fare of former is reduced by nearly 75%, while the passenger flow sharing rate undertaken by conventional railway is gradually increasing from 20% to 60%. In contrast, the passenger flow sharing rate of civil aviation is gradually decreasing from 80% to 40%. In-depth observation of Figure 3a shows that when the passenger flow reaches between 30 million and 40 million people, the travel demand of conventional railway gradually exceeds that of civil aviation.
When the travel demand of the corridor reaches 52 million, it will be a good time to open the high-speed railway. At this time, the equilibrium fare of the high-speed railway is 401.89 yuan, and the corresponding passenger flow sharing rate is 23.2%. This part of passenger flow is mainly transferred from civil aviation, and a small part of the passenger flow is transferred from conventional railway. Subsequently, with the continuous increase of the total travel demand of the corridor, the passenger flow sharing rate of the high-speed railway gradually increases from 23.2% of 52 million to 70% of 130 million and is basically balanced. At this stage, the passenger flow sharing rate of the conventional railway gradually decreases to 20%, while the passenger flow of civil aviation remains basically unchanged. Nearly 10% of emergency trips choose civil aviation all the time. It can be seen from Figure 3b that with the continuous increase of the total travel demand, the equilibrium fares of various transport modes all continue to decline, which is basically consistent with the economic mechanism.
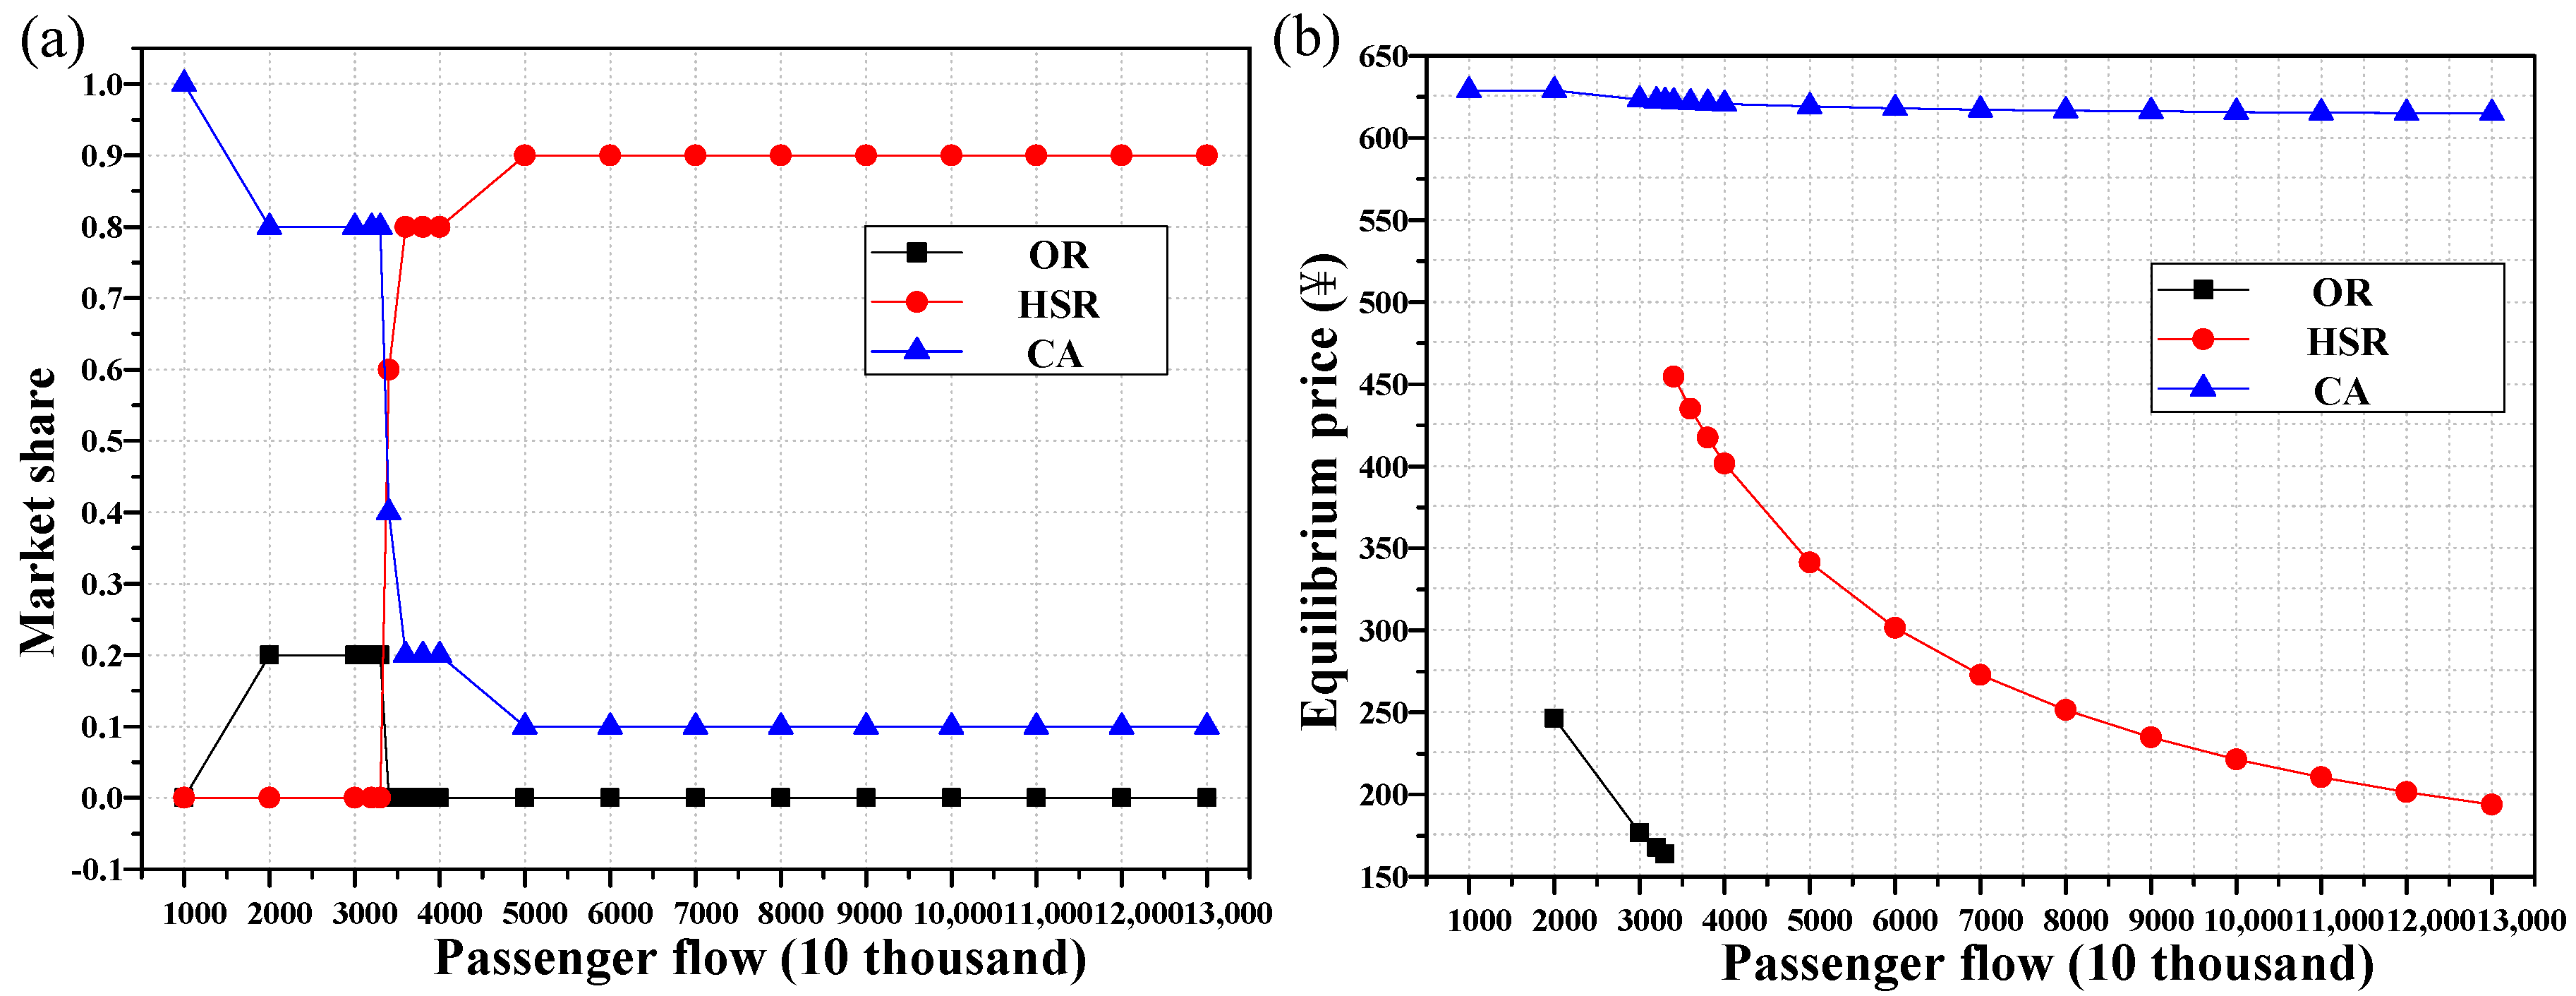
When the value distribution of corridor travel time is β2, the evolution trend of analysis results is basically similar to that of β1 (Table 6 and Figure 4), but the configuration results are obviously different.
In order to further analyze what kind of travel demand subjects are the passenger flows of various modes, and what is the travel surplus when different travel demand subjects choose different service modes, the corridor travel demand of 38 million and the A-β2 distribution characteristics of travel demand subjects were used in this study as an example. The analysis results are shown in Table 7. The results show that when the conventional railway and civil aviation services are planned in the corridor, the travel surplus of the whole society is about 2.02876 × 10¹¹ yuan, which is relatively smaller than that of high-speed rail and civil aviation (2.03738 × 10¹¹ yuan). When general railway, high-speed rail and civil aviation are planned, the travel surplus of the whole society is 2.02324 × 10¹¹ yuan (minimum). Therefore, in order to meet the travel demand of the whole society to the maximum extent, the corridor should include two service modes, namely high-speed railway and civil aviation, under the established parameter assumption. At this time, the first, second, third and fourth groups of travel demand subjects tend to choose high-speed railway, while the fifth and sixth groups choose civil aviation. All groups of travel demand subjects can realize relatively large travel surplus. Some travel demand subjects who subjectively tend to choose general railway are forced to choose high-speed railway, which has the second best travel surplus, so as to ensure that the total travel surplus of the whole society is maximized on the basis that various transport supplies realize their own equilibrium remuneration operation. In this equilibrium state, the equilibrium fares of high-speed railway and civil aviation are 417.3 and 621.2 yuan, respectively.
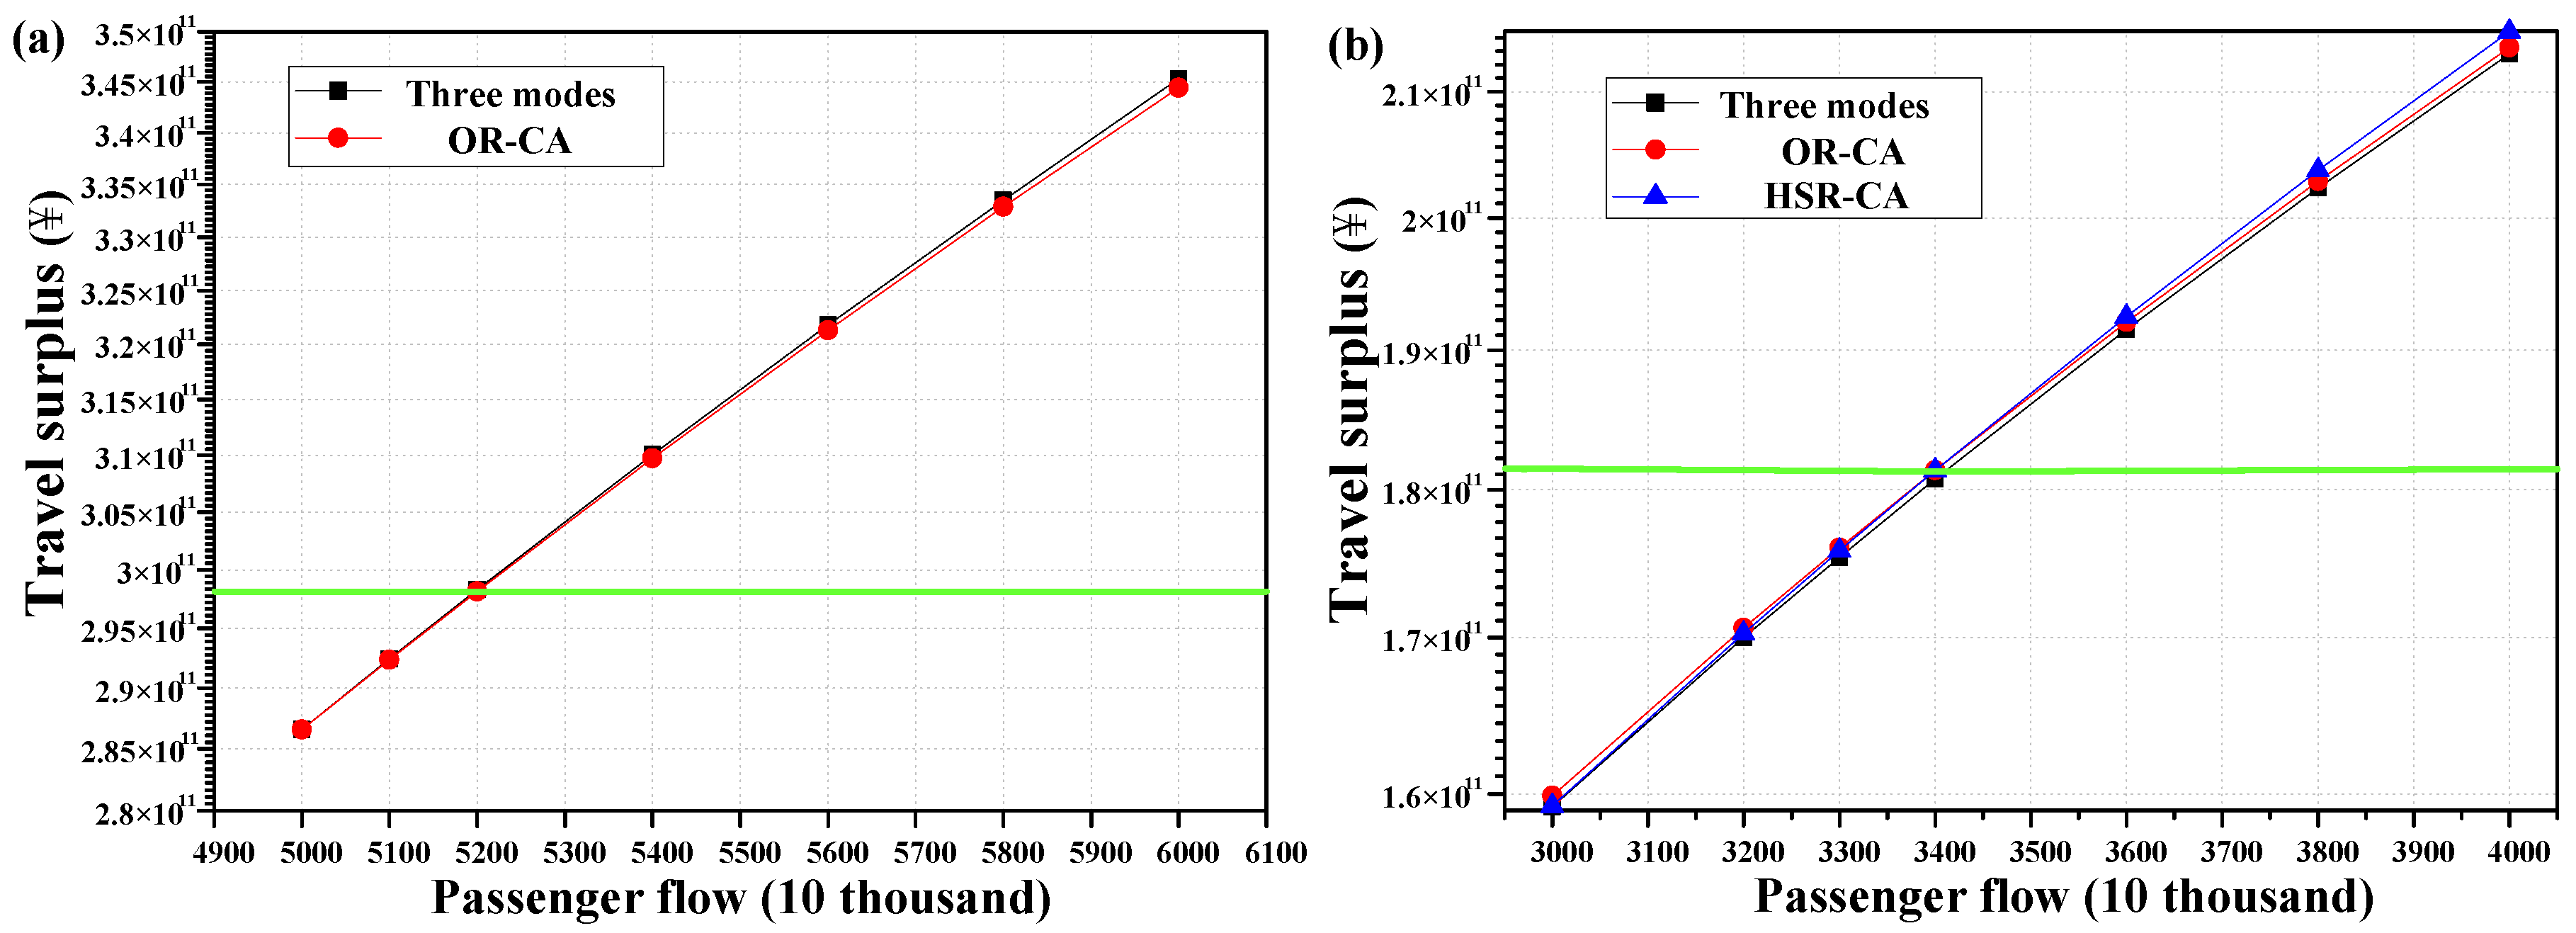
In order to better reflect the difference between the total travel surplus of the whole society realized by different service modes when the travel demand of the passenger transport corridor is different, we compared the social travel surplus realized by various travel modes, as shown in Figure 5. In the figure, (a) shows the comparison of the whole society’s travel surplus of different service modes when the main distribution characteristics of travel demand are A-β1. It focuses on the analysis that the travel demand of the corridor is between 50 million and 60 million. It is found that when the travel demand is less than 52 million, the whole society’s travel surplus brought by the two service modes of conventional railway and civil aviation transport is larger than that brought by the three service modes. Because of the high fixed cost, it is difficult for the high-speed rail to maintain its break-even operation, so the travelers who wish to choose high-speed rail have to turn to the other two ways. When the travel demand of the corridor is greater than or equal to 52 million, the travel surplus satisfied by configuring three service modes (conventional railway, high-speed rail and civil aviation) is greater than that of configuring only two service modes (conventional railway and civil aviation). At this stage, high-speed rail opening is proper, and planning high-speed rail will improve the travel surplus of the whole society.
In the figure, (b) reflects the comparison of the travel surplus of the whole society with different service modes when the distribution characteristics of the travel demand subject are A-β2. When the travel demand of the corridor is less than 34 million, only conventional railway and civil aviation need to be configured. On the other hand, when the travel demand is higher than 34 million, high-speed railway and civil aviation need to be configured. This is consistent with the results in Table 5. On the whole, with the increase of travel demand, the corridor service mode configuration will be more comprehensive, so as to meet the diversified travel demand. In addition, the distribution characteristics of the travel demand subject also have a great influence on the passenger transport corridor mode configuration.

4.4. Influence of Changes in Travel Time Value

In the previous section, the influence of travel demand on the mode configuration of the passenger transport corridor is analyzed, and this section mainly explores the influence of the change in travel time value of travel demand subject. In real life, the travel time value distribution of the travel demand subject is quite different. This study mainly analyzed two different travel time value distributions: β1 and β2. Using the optimization model and algorithm proposed above, the results are shown in Table 5.
It can be seen from Table 5 that when other parameters are unchanged, the travel time value of travel demand subjects is different, and the configuration results of the passenger transport corridor mode are also different. Taking a corridor travel demand of 40 million people as an example, when the corridor travel time value distribution is β1, all types of travel demand subjects will choose conventional railway and civil aviation in equilibrium state, and the proportions of travel demand subjects who choose the two modes are 0.6 and 0.4, respectively. When the travel time value distribution is β2, high-speed rail and civil aviation should be configured in the passenger corridor, accounting for 0.8 and 0.2, respectively. Obviously, two different travel time value distributions have completely different planning and configuration results (Figure 3, Figure 4 and Figure 5). With the increase of travel time value, the travel demand subjects will pay more attention to time efficiency, so that they will choose the transport mode with fast speed and high quality.

4.5. Influence of Changes in Fixed Costs

The previous two sections analyze the change in demand. In order to better verify the effectiveness of the model and algorithm, we explored from the perspective of the supply side and analyzed the influence of the change in high-speed rail fixed cost on the mode configuration of the passenger transport corridor.
This section discusses the trend of structural changes of various modes of passenger transport corridors. When the total passenger travel demand of a certain corridor reaches 56 million and 60 million, the distribution of passenger travel demand subject is combination A, the travel time value distribution is β1 and the equilibrium rate of return is 0%, and the cost of high-speed rail changes by +20%, +10%, 0%, −10% and −20%. The results are shown in the following table.
It can be seen from Table 8 that when the total travel demand of the corridor is 56 million, and the characteristic distribution of travel demand subject is A-β1, when the fixed cost change is 0% (that is, the cost data in Table 4), the passenger sharing rates of conventional railway, high-speed rail and civil aviation in the passenger transport corridor are 58.36%, 31.64% and 10%, respectively, in equilibrium state. The corresponding equilibrium fares are 130, 375 and 622 yuan. With other parameters unchanged, the fixed cost of high-speed rail increases by 10%. 10% of the passenger flow of high-speed rail is transferred to civil aviation in equilibrium state, and the equilibrium fare of high-speed rail increases by 27.35 yuan, which is due to the increased travel cost of some travel demand subjects who choose high-speed rail. In order to maximize their travel surplus, they choose high-speed rail instead of civil aviation with larger travel surplus. At this time, the consumer surplus in the whole society is lower than when the fixed cost remains unchanged. When the fixed cost of high-speed rail increases to 20%, the share rate of high-speed rail passenger flow is reduced to 20%, and the reduced passenger flow is transferred to conventional railway, which undertakes 60% of the passenger flow in the corridor. On the other hand, when the fixed cost of high-speed rail is reduced by 10%, the competitive advantage of high-speed rail is enhanced, attracting part of the passenger flow of conventional railway. The passenger flow sharing rate of conventional railway is reduced from 58.36% to 37.71%, while the passenger flow sharing rate of high-speed rail is rapidly increased to 52.28%. For passengers with higher time requirements, they still choose civil aviation. When the fixed cost of high-speed railway continues to decrease to 20%, the passenger flow sharing rate of high-speed railway increases slowly to 56.73%.
When the total travel demand of a passenger corridor is 60 million, other parameters are consistent with the above. When the fixed cost of high-speed rail increases by 10% or even 20%, the competitive advantage of high-speed rail drops rapidly, and the passenger flow gradually shifts from high-speed rail to conventional railway and civil aviation, and the passenger flow sharing rate of high-speed rail decreases from 50.05% to 30% or even 20.27%. In contrast, when the fixed cost of high-speed rail decreases by 10% and 20%, the passenger flow sharing rate of the high-speed rail increases to some degree, by 54.15% and 58.49%, respectively. The equilibrium fare somewhat decreases. It can be seen that when the travel demand of a certain corridor reaches 60 million, the increase of fixed cost of high-speed rail has a fairly great impact on the passenger flow, but the decrease of fixed cost of high-speed rail has a certain influence on its passenger flow sharing rate, but only with limited influence. On the whole, when other parameters remain unchanged, the change of fixed cost of high-speed rail has great influence on the supply configuration of the passenger transport corridor. Therefore, the results of fixed cost changes analyzed by the model and algorithm basically conform to the economic mechanism, showing that the model and algorithm proposed in this paper are basically feasible and effective.
It should be noted that this study only considered the direct influence of fixed cost changes of the high-speed rail, ignoring indirect impact.

5. Conclusions

In this study, a new planning concept was used to explore the optimal configuration of the passenger transport corridor structure. First, the decision-making mechanism of travel behavior was explored based on the demand subject, and passengers’ travel demand was classified according to the travel time value and its correlation with its own interest. Then, an economic equilibrium model for optimizing the structure of the passenger transport corridor was constructed, and a solution algorithm was designed. Finally, an example was given to analyze the influence of travel demand, time value distribution and changes in fixed cost of high-speed rail. The conclusions are as follows:
(1)
According to the value of travel time and its correlation with its own interest, travel groups can be divided into three categories: consumption travel, productive travel and emergency travel, and can be subdivided into six categories.
(2)
An economic equilibrium model for structural optimization of the passenger transport corridor was constructed in this study, and a global optimization algorithm was designed to solve it. The results show that the algorithm has good convergence. In addition, it simulates the travel demand of 10 million to 130 million and the influence on the configuration result of the service modes when the time value distribution is β1 and β2 and when the fixed cost of high-speed rail changes by +20%, +10%, 0%, −10% and −20%. It is found that the travel demand, time value distribution and fixed cost all have an important influence on the mode configuration of the passenger transport corridor. With the increase of travel demand of passenger transport corridors, various transport modes can gradually realize the basic equilibrium rate of return, and the configuration of corridor modes will be perfected and diversified. With the increase of travel time value, the travel demand subject will pay more attention to time efficiency, and then choose a fast and high-quality transport mode. The increase of fixed cost of high-speed rail will reduce its passenger flow sharing rate, and vice versa. On the whole, the analysis results of examples basically conform to the economic equilibrium mechanism of supply and demand. The results show that the model and algorithm proposed in this paper are effective, and can provide reference for the design and policy making of passenger transport corridor mode supply.
The method proposed in this paper still has some limitations, and has set foot in neither the relationship between the comprehensive transport hub and comprehensive transport corridor nor the relationship between multiple corridors. Therefore, further study needs be conducted on the optimization of the supply structure of the comprehensive transport passenger transport corridor with multiple ODs and networking conditions. In addition, case studies or empirical analysis will continue to test the practicability of models and algorithms, and impacts on the environment, energy consumption and demand preferences will also be introduced and further studied.

Author Contributions

Author Contributions: Conceptualization, Q.W.; methodology, X.W. and J.S.; software, X.W.; writing-original draft preparation, X.W.; writing—review and editing, J.S.; supervision and project administration, Q.W. All authors have read and agreed to the published version of the manuscript.

Funding

This project is financially supported by the National Natural Science Foundation of China (No.71871027), the Social Science Foundation of Shaanxi (No.2020D028), Shaanxi Provincial Postdoctoral Science Fund (No.2018BSHERZZ125) and the Fundamental Research Funds for the Central Universities, CHD (No. 300102341104).

Institutional Review Board Statement

Not applicable.

Informed Consent Statement

Not applicable.

Data Availability Statement

Not applicable.

Conflicts of Interest

The authors declare no conflict of interest.

References

  1. Lu, D.D. The Proposition to Avoid the Over Advance and Inappropriate Construction of China′s Transport Infrastructures. Sci. Geogr. Sin. 2012, 32, 2–11. [Google Scholar]
  2. Peng, Z.M.; Wu, Q.Q. Study on supply-demand matching of transport service based on economic equilibrium. J. Highw. Transp. Res. Dev. 2018, 35, 146–151. [Google Scholar]
  3. Liu, Q.; Lu, H.P.; Wang, Q.Y. Tri-level model of traffic mode choice in regional transportation corridors. J. Harbin Inst. Technol. 2011, 43, 113–118. [Google Scholar]
  4. Wu, Q.Q.; Li, Z.L. The research frame work of integrated transportation planning based on transportation demand. J. Transp. Syst. Eng. Inf. Technol. 2011, 11, 13–19. [Google Scholar]
  5. Zhang, S.S.; Zhou, W. Total amount control method for highway network planning. E. China Highw. 1996, 2, 42–46. [Google Scholar]
  6. D’Alfonso, T.; Jiang, C.; Bracaglia, V. Air transport and high-speed rail competition: Environmental implications and mitigation strategies. Transp. Res. Parta: Policy Pract. 2016, 92, 261–276. [Google Scholar] [CrossRef]
  7. Xia, W.Y.; Zhang, A.M. High-speed rail and air transport competition and cooperation: A vertical differentiation approach. Transp. Res. Part B Methodol. 2016, 94, 456–481. [Google Scholar] [CrossRef]
  8. Avenali, A.; Bracaglia, V.; D’Alfonso, T.; Reverberi, P. Strategic formation and welfare effects of airline-high speed rail agreements. Transp. Res. Part B Methodol. 2018, 117, 393–411. [Google Scholar] [CrossRef]
  9. Tsunoda, Y. Transportation policy for high-speed rail competing with airlines. Transp. Res. Part A Policy Pract. 2018, 116, 350–360. [Google Scholar] [CrossRef]
  10. Wang, W.; Sun, H.; Wu, J. How does the decision of high-speed rail operatoraffect social welfare? Considering competition between high-speed rail and air transport. Transp. Policy 2020, 88. [Google Scholar] [CrossRef]
  11. Daganzo, C.F. Structure of competitive transit networks. Transp. Res. Part B Methodol. 2010, 44, 434–446. [Google Scholar] [CrossRef] [Green Version]
  12. Hong, T.V.; Kasem, C.; Satosh, F. The effect of attitudes toward cars and public transportation on behavioral intention in commuting mode choice—A comparison across six Asian countries. Transp. Res. Part A Policy Pract. 2014, 69, 36–44. [Google Scholar]
  13. Rich, J.; Holmblad, P.M.; Hansen, C.O. A weighted logit freight mode-choice model. Transp. Res. Part E 2009, 45, 1006–1019. [Google Scholar] [CrossRef]
  14. Bharat, P.; Bhatte, O.I. Errors in variables in multinomial choice modeling: A simulation study applied to a multinomial Logit model of travel mode choice. Transp. Policy 2011, 18, 326–335. [Google Scholar]
  15. Thrane, C. Examining tourists’ long-distance transportation mode choices using a Multinomial Logit regression model. Tour. Manag. Perspect. 2015, 15, 115–121. [Google Scholar] [CrossRef]
  16. Rashedi, Z.; Mahmoud, M.; Hasnine, S.; Habib, K.N. On the factors affecting the choice of regional transit for commuting in Greater Toronto and Hamilton Area: Application of an advanced RP-SP choice model. Transp. Res. Part A Policy Pract. 2017, 105. [Google Scholar] [CrossRef]
  17. Kevin, M.; El-Geneidy, A.M. Does distance matter? Exploring the links among values, motivations, home location, and satisfaction in walking trips. Transp. Res. Part A Policy Pract. 2013, 50, 198–208. [Google Scholar]
  18. Shanmugam, L.; Ramasamy, M. Study on mode choice using nested logit models in travel towards Chennai metropolitan city. J. Ambient Intell. Humaniz. Comput. 2021, 1, 1–9. [Google Scholar]
  19. Mokhtarian, P.L.; Salomon, I. How derived is the demand for travel? Some conceptual and measurement considerations. Transp. Res. Part A Policy Pract. 2001, 35, 695–719. [Google Scholar] [CrossRef] [Green Version]
  20. St-Louis, E.; Manaugh, K.; van Lierop, D.; El-Geneidy, A. The happy commuter: A comparison of commuter satisfaction across modes. Transp. Res. Part F 2014, 26, 160–170. [Google Scholar] [CrossRef]
  21. Qi, C.; Zhu, Z.; Guo, X.; Lu, R.; Chen, J. Examining Interrelationships between Tourist Travel Mode and Trip Chain Choices Using the Nested Logit Model. Sustainability 2020, 12, 7535. [Google Scholar] [CrossRef]
  22. Li, Y.H.; Yuan, Z.Z.; Chen, J.Y.; Tian, M. Combined capacity optimization of comprehensive transportation corridor based on multi-objective decision making. J. Jilin Univ. Eng. Technol. Ed. 2009, 39, 1480–1485. [Google Scholar]
  23. Wang, Y.; Hao, D.; Li, H.; Luan, X.; Wang, H. Research on share rate of passenger flow in railway transportation corridor based on matching between supply and demand. J. China Railw. Soc. 2014, 36, 5–9. [Google Scholar]
  24. Jiang, P.; Yang, J.Q.; Fang, R.W. Bi-lever programming model for optimization of urban agglomeration comprehensive transportation corridor layout. J. Jilin Univ. Eng. Technol. Ed. 2017, 47, 1061–1067. [Google Scholar]
  25. Song, J.; Chen, F.; Wu, Q.; Liu, W.; Xue, F.; Du, K. Optimization of Passenger Transportation Corridor Mode Supply Structure in Regional Comprehensive Transport Considering Economic Equilibrium. Sustainability 2019, 11, 1172. [Google Scholar] [CrossRef] [Green Version]
  26. Wu, Q.Q.; Xu, X. Mechanism research on travelling choices of passengers. J. Chang’an Univ. Soc. Sci. Ed. 2007, 2, 18–20, 40. [Google Scholar]
  27. Ke, Y.H.; Yun, M.P. Analysis of traveler’s choice behavior mechanism. J. Transp. Eng. Inf. 2007, 5, 95–101. [Google Scholar]
  28. Sun, R.F. Research on the Travel Surplus Analysis Theory. Ph.D. Thesis, Chang’an University, Xi’an, China, 2018. [Google Scholar]
  29. Algers, S.; Hansen, S.; Tegner, G. Role of waiting time, comfort and convenience in modal choice for work trip. Transp. Res. Rec. 1975, 534, 38–51. [Google Scholar]
  30. Daly, A.; Hess, S. VTT or VTTS: A note on terminology for value of travel time work. Transportation 2019, 47, 1359–1364. [Google Scholar] [CrossRef] [Green Version]
  31. Ugray, Z.; Lasdon, L.; Plummer, J.; Glover, F.; Kelly, J.; Martí, R. Scatter search and local NLP solvers: A multistart framework for global optimization. Inf. J. Comput. 2007, 19, 328–340. [Google Scholar] [CrossRef]
Figure 1. Flow chart of optimization solution.
Sustainability 13 04024 g001
Figure 2. Model convergence analysis (a) shows that the corridor demand is 30 million (A-β1); (b) indicates that the corridor demand is 60 million (A-β1); (c) indicates that the corridor demand is 30 million (A-β2); (d) indicates that the corridor demand is 60 million (A-β2).
Sustainability 13 04024 g002
Figure 3. Scenario simulation results (A-β1) (a) market share; (b) equilibrium price.
Sustainability 13 04024 g003
Figure 4. Scenario simulation results (A-β2) (a) market share; (b) equilibrium price.
Sustainability 13 04024 g004
Figure 5. Social consumer surplus in different configurations. (a) The distribution characteristic of travel demand subjects is A-β1; (b) the distribution characteristic of travel demand subjects is A-β2.
Sustainability 13 04024 g005
Table 1. The difference between traditional research and this research.
AttributesThe Traditional ResearchThis Paper
Research subjectTravelerTravel demand subject
Basic theoryUtility maximization theoryThe travel surplus theory
Research threadQuantity equilibriumEconomic equilibrium
ModelDiscrete disaggregate model and its extended formThe economic equilibrium model
Table 2. Passenger travel demand category and mode selection mechanism.
GroupClassificationDescriptionSelection Mechanism
1Consuming travelC >> TAll the travel expenses are paid by the traveler, and the time value of the traveler is very smallA travel mode with low price, slow speed and poor comfort is chosen
2C ≤ TGenerally, the value of personal time corresponds to its economic situation. Economically, travelers will choose cheap modes of travel as much as possible, making C ≤ TThe principle of “value for money” is used to choose the mode of travel. As long as the cost paid for travel is equal to the satisfaction obtained, the traveler will make the corresponding choice
3C << TThe travel expenses are very small with respect to the time value of the travelerTravel modes with high quality, high speed and good comfort are chosen, but these are usually more expensive, such as plane, express or direct train or car.
4Productive travelC > TThe traveler’s own travel has little influence on the demand subjectCommon staff or employees
5C < TThe traveler’s own travel has a great influence on the demand subjectGovernment officials or staff from enterprises and institutions; the demand subject generally chooses high-quality transport methods
6Emergency travelC << TThe opportunity cost of travel time is infiniteEmergency ambulance travel, travel to other places in order to handle temporary and urgent major events, etc.
Table 3. Summary of notation.
SetsMeaning
ISet of passengers, indexed by i.
JSet of transport modes, indexed by j.
ANumber of O–D pairs of passenger transport corridors
VariablesMeaning
PajThe price of the jth mode of transport in the ath O–D pair.
QajNumber of passengers demanded in transport mode j in the ath O–D pair.
ParametersMeaning
NNumber of categories for travel demand subjects.
MNumber of transport modes.
EaijConsumer surplus for the ith travel demand subject to select the jth mode in the ath O–D pair.
VaiTravel value of the ith travel demand subject in the ath O–D pair.
CaijTravel cost for the ith travel demand subject to select the jth mode in the ath O–D pair.
TTajThe pure running time of the jth mode in the ath O–D pair.
vajTransport speed of the jth mode in the ath O–D pair.
DajDistance of the jth mode in the ath O–D pair.
WTajWaiting time of the jth mode in the ath O–D pair.
CTajConnection time of the jth mode in the ath O–D pair.
FajFixed cost of transport mode j in the ath O–D pair.
AVajUnit variable cost of the jth mode in the ath O–D pair.
βaiTime value cost coefficient for the ith travel demand subject in the ath O–D pair.
γaiOther psychological cost coefficient for the ith travel demand subject in the ath O–D pair.
pajTicket price rate of the jth mode.
RajEquilibrium rate of return for the jth mode in the ath O–D pair.
NaiNumber of the ith travel demand subject in the ath O–D pair.
Table 4. Main parameter assumptions for certain travel demand subjects.
AttributesConsumer TravelProductive TravelEmergency Travel
C >> TC ≤ TC << TC > TC < TC << T
123456
Distribution A20%20%20%20%10%10%
Travel value V (¥/trip)200040008000500010,00020,000
Time value coefficient β1 (¥/h)12.530604080500
Time value coefficient β2 (¥/h)25407050901000
Other psychological cost coefficient (¥/h)51010102020
Table 5. Parameter settings for a medium- and long-distance transport corridor.
AttributesOrdinary Railway (OR)High-Speed Railway (HSR)Civil Aviation (CA)
Construction cost (108 ¥/year)21601.6441381
Sharing fixed cost F (¥/year km)1,435,406.74,552,352.05139,570.3
Unit variation cost AV (¥/person km)0.025 (700 persons/train)0.077 (700 persons/train)0.52 (300 persons/plane)
Travel time t (h)157.95.6
Distance (km)146313181178
Equilibrium return rate R0
Table 6. Scenario simulation results.
Travel Demand
(10,000 Persons)
Market ShareEquilibrium Price (¥)
ORHSRCAORHSRCA
A-β1
10000.2000.0000.800456.575--645.443
30000.4000.0000.600176.575--623.521
50000.6000.0000.400120.575--619.137
51000.6000.0000.400118.928--619.008
52000.5680.2320.200137.537401.890623.099
54000.5940.3060.100133.797381.208622.709
56000.5840.3160.100130.325374.934622.347
58000.4000.5000.100157.265360.107622.009
60000.4000.5000.100153.242351.642621.694
70000.3560.5440.100136.575328.290620.389
90000.2860.6140.100114.353295.728618.649
11,0000.2330.6670.100100.211273.774617.542
13,0000.2000.7000.10090.421255.332616.776
A-β2
10000.000.001.00----629.001
20000.200.000.80246.575--629.001
30000.200.000.80176.575--623.521
32000.200.000.80167.825--622.836
33000.200.000.80163.848--622.524
34000.000.600.40--454.427622.231
36000.000.800.20--434.819621.694
38000.000.800.20--417.275621.213
40000.000.800.20--401.486620.781
50000.000.900.10--341.486619.137
90000.000.900.10--234.819616.214
13,0000.000.900.10--193.794615.089
Table 7. Comparison of various service mode allocations with N = 38 million passengers (A-β2).
AttributesIndividual Consumer Surplus (¥)Selection RatioEquilibrium Price (¥)Total Consumer Surplus (¥)Comparison
ORHSRCAORHSRCAORHSRCA
Allocation OR and CA
Group 11402.9--1210.81--0147.1--621.22.02876 × 1011Small
Group 23102.9--3098.81--0
Group 36652.9--6930.80--1
Group 43952.9--4042.80--1
Group 58202.9--8762.80--1
Group 64552.9--13,666.80--1
Allocation HSR and CA
Group 1--1345.71210.8--10--417.3621.22.03738 × 1011Large
Group 2--3187.73098.8--10
Group 3--6950.76930.8--10
Group 4--4108.74042.8--10
Group 5--8713.78762.8--01
Group 6--11,524.713,666.8--01
Table 8. Impact of high-speed rail fixed cost changes on mode structure.
AttributesMarket ShareEquilibrium Price (¥)Social Consumer Surplus (¥)
ORHSRCAORHSRCA
N = 56 Million Passengers (A-β1)
+20%0.60.20.2130.33422.91622.353.21017 × 1011
+10%0.58360.21640.2130.33402.28622.353.21325 × 1011
0%0.58360.31640.1130.33374.93622.353.21753 × 1011
−10%0.37720.52280.1161.58349.64622.353.22315 × 1011
−20%0.33270.56730.1161.58335.45622.353.23181 × 1011
N = 60 Million Passengers (A-β1)
+20%0.59730.20280.2124.08402.52621.693.44437 × 1011
+10%0.60.30.1124.08376.49621.693.44828 × 1011
0%0.39950.50050.1153.24351.64621.693.45257 × 1011
−10%0.35850.54150.1153.24338.80621.693.4606 × 1011
−20%0.31510.58490.1153.24325.23621.693.46977 × 1011
Publisher’s Note: MDPI stays neutral with regard to jurisdictional claims in published maps and institutional affiliations.

