Abstract
The open burning of agricultural residues derived from rice is a social issue in Thailand, as it causes air pollution in the form of smoke. A way to prevent smoke air pollution is to pulverize glycosylated non-edible biomass and convert it to monosodium glutamate (MSG). This study assessed MSG produced by non-edible biomass and compared the environmental performance of MSG produced using tapioca starch. The scope of this study ranges from the cultivation of raw materials to the production of MSG. The adopted impact categories include carbon, water, and air pollution. The primary data refer to the average unit input and fuel consumption of annual MSG production. The secondary data are used for inventories, namely, Ecoinvent 3, the Water Footprint Network, and the EMEP/EEA air pollutant emission inventory guidebook. We also conducted an impact assessment of the health impacts and weighting across several impact categories using LIME-3. The human health impact assessments for MSG from non-edible biomass and tapioca starch show gains of 1.92 × 10⁻⁵ and 3.59 × 10⁻⁵ DALYs per kg MSG, respectively. This difference is due to declining water scarcity and air pollution footprints. We found that using rice straw prevents water scarcity and smoke air pollution caused by open burning.
1. Introduction
The agricultural industry in Thailand is very active due to the country’s warm climate, bountiful water resources, and wide flat land. Thus, the agricultural sector accounts for 40% of the jobs held by people in Thailand. The top-ranking agricultural production crops in terms of volume in Thailand are sugarcane, rice, cassava, lubber, and corn. Agricultural crops are associated with an environmental burden in the context of global warming due to the use of fertilizers and agrochemicals, in addition to contributing towards water scarcity. A social issue in Thailand is smoke air pollution caused by the open burning of agricultural residues derived from rice and corn [1,2], with such residues collectively amounting to 30 million and 5 million tons per year, respectively. The rice supply chain sells edible parts to the market and incorporates non-edible parts into agricultural fields, poultry beds, and pellets for fuel, with the remaining non-edible parts being disposed of via open burning. PM2.5, derived from open burning, causes smoke air pollution. A way of preventing smoke air pollution is to glycosylate the pulverized non-edible biomass and convert it to ethanol fuel. Previous studies have described pretreatment technologies for pulverizing non-edible biomass (physical, physiochemical, chemical, and biological) [3] and compared the low carbon footprint of non-edible biomass fuel with fossil fuels and edible biomass fuel [4,5]. Other studies have compared the carbon footprints between fossil ethanol and bio ethanol derived from grass straw and sugarcane, maize grain and stover, sugar beet, and wheat. However, such studies have only described the issue of land-use changes in producing non-edible biomass fuel for the fuel market. Hence, there has been no mention of efforts to decrease the level of water consumption required for such processes. Monosodium glutamate (MSG), produced via the hydrolysis of glucose from pulverized non-edible biomass, is a solution to overcome the issues related to land-use change and water consumption. A previous study described a way to decrease environmental impacts by utilizing cleaner production methods of MSG derived from maize [6]. No previous studies have proposed decreasing the environmental burden by using discarded non-edible biomass for the production of MSG.
This study compared the lifecycle of MSG produced from fermenting pulverized and glycosylated rice straw (non-edible residue biomass), and MSG produced from fermenting glycosylated tapioca starch of cassava origin as a conventional process. Furthermore, this study also compared the carbon, water, and air pollution footprints associated with such methods, as these factors are known to be associated with MSG and agricultural crop production, with consequent effects on human health. The goal of this study was to evaluate three environmental aspects, integrating these with human health via a lifecycle assessment.
2. Materials and Methods
Via a lifecycle assessment, we configured the functional unit and the boundary according to ISO 14040:2006, Environmental management—Life cycle assessment—Principles and framework [7] and ISO 14044:2006/AMD 2:2020, Environmental management—Life cycle assessment—Requirements and guidelines—Amendment 2 [8].
The scope of this study ranges from the cultivation of raw materials to the production of MSG. Figure 1 shows the system boundary in this study for inventory analysis. MSG is an ingredient in food with a savory and umami taste. It is considered the purest form of umami (C5H8NO4Na) and is produced from starch or sugar, with 3 million tons per year being consumed in the global market. We defined a functional unit as 1 kg MSG per year per capita, according to the average per day consumption of glutamate per capita as 2 g [9].
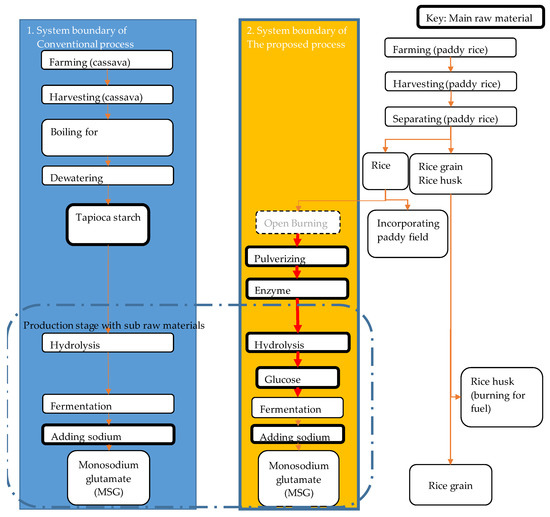
Figure 1.
The system boundary of monosodium glutamate (MSG).
This study selected Thailand as the study region. Thailand is one of the biggest markets for MSG and a global producer for the Ajinomoto Group.
As the conventional system, MSG is produced from tapioca starch of cassava origin, of which, 30 million tons is produced per year in Thailand [10]. In the raw material stage of tapioca starch, cassava nursery plants are cultivated using water and fertilizer on agricultural farms. To remove toxins, cassava is pulverized, dissolved, concentrated-filtered, and dried to tapioca starch. The total rice produce amounts to ~30 million tons per year in Thailand [10].
This study selected rice straw—which is usually openly burned in Thailand—as non-edible biomass for use in the production process of MSG. The focus of this study was on the cultivation and processing of raw materials to produce MSG. As a non-edible biomass raw material, rice straw in Thailand has a low market value and is incorporated into paddy fields, with the residue being disposed of via open burning. Therefore, the environmental impact of rice straw has not been widely recognized in relation to the carbon and water scarcity footprint. The environmental impacts of rice and rice husk have received slightly more recognition.
In Figure 2, it is shown how rice straw in the form of cellulose is pulverized to starch and hydrolyzed to glucose in order to produce the raw MSG material. The fermentation–purification–isolation production process, after glycosylation, is the same as in the non-edible biomass and tapioca starch methods.
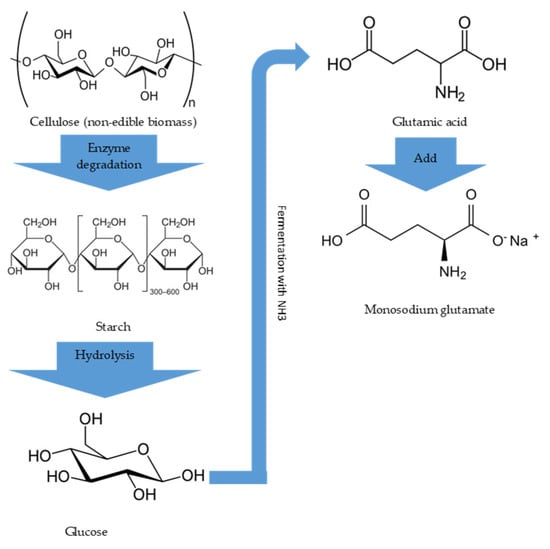
Figure 2.
Process image from non-edible biomass to MSG.
Table 1 shows a list and weight mix of the input raw materials and the production of fuel, electricity and sub-raw material for the output of 1 kg of MSG, derived from the non-edible biomass and tapioca starch production methods.

Table 1.
The list and weight mix of main raw material and production with sub-raw material.
The impact assessment in this study was evaluated by quantifying the environmental impacts, namely, global warming as the carbon footprint (CFP), water scarcity as the water scarcity footprint (WSFP), and air pollution (NOx and SOx, PM2.5) as the air pollution footprint (APFP).
2.1. Carbon Footprints
We evaluated the CFP using ISO14067 [11] as the CO2 emission intensity and excluded the sum of the fossil, biogenic, direct land-use change (dLUC), indirect land-use change (iLUC), and aircraft subcategories.
where i is the item input and s is the lifecycle stage.
The CFP is the total of CO2 equivalent emission, which is the item input multiplied by the item CO2 emission intensity throughout its lifecycle. Therefore, the product is assumed to be present in all its forms, namely: the raw material stage, such as tapioca starch and the sodium source; the sub-raw material stage, such as the acid and alkali; the production stage, such as the fuel and electricity. The CFP inventory used was Ecoinvent 3 [12,13]. The reason Ecoinvent 3 [13] was selected is because it takes into consideration various kinds of global items, such as agricultural crops and electric power. We calculated the CFP by the average unit input and fuel consumption of MSG annual production by Ajinomoto Co., Ltd. (Bangkok, Thailand). The data are confidential and cannot be disclosed; however, Table 1 shows the approximate weight mix. The fuel consumption of glycosylation from tapioca starch to glucose was not included in the raw material stage, but rather in the production stage.
2.2. Water Scarcity Footprints
We evaluated the WSFP using ISO14046 [14] as an impact assessment. We conducted the impact assessment because the value for 1 m3 of water varies according to the location at which it is withdrawn and the origin of the water.
where ra is the precipitation WSFP, ri is the surface WSFP, u is the underground WSFP, i is the item input, and s is the lifecycle stage. The definitions of the raw material stage, sub-raw material stage of production, and the production stage are the same as the CFP.
The WSFP quantifies the product’s impact on water resource depletion, caused by water scarcity, which decreases water availability. The WSFP defines the volume reduction by evaporation or addition of production; it can be measured as the difference between the amount of water intake and the amount of water discharge.
Precipitation, surface water, and underground water have different purifying circulation times; therefore, each water type with the same volume (e.g., 1 m3) has a different value. Water originating from precipitation is available for use after falling, whereas surface and underground water must be purged of penetration matters and effluents before use. Therefore, the WSFP of precipitation water, surface water, and underground water require separate calculations [15]. As inventories of water scarcity, we used the Water Footprint Network, Product water footprint statistics, Water footprints of crops and derived crop products (1996–2005) (Water Footprint Network) [16] for crops and Ecoinvent 3 [13] for industrial materials. The reason we selected the Water Footprint Network [16] and Ecoinvent 3 [13] is that these inventories include many kinds of global items, such as crops and industrial materials. Each inventory of crops and materials contains separate entries for precipitation, surface, and underground water. The Water Footprint Network [16] inventory distinguishes between precipitation water (green water) and surface and underground water (blue water). Each inventory of Ecoinvent 3 [13] totals the surface and underground water. Therefore, surface and underground water can be apportioned to blue water in the Water Footprint Network [16] or Ecoinvent 3 [13]. We used data from the AQUASTAT–the Food and Agriculture Organization’s (FAO) global information system on water and agriculture (FAO-AQUASTAT) [17] for fresh surface and groundwater withdrawal and the overlap between surface water and groundwater. We divided the blue water into the Water Footprint Network [16] or Ecoinvent 3 [13] by their surface-to-underground water ratios in FAO-AQUASTAT [17]. The impact assessment multiplies each water resource in each area by a weighting factor, accounting for the impact of different levels of water-use availability between areas that are rich and poor in terms of rainfall. In this study, the weighting factors were the weighted averages of the water availability factors (WAF) in each country, which were proposed by Yano et al. (Yano’s WAF) [18] for estimating the potential impact on freshwater availability. Yano’s WAFs [18] were calculated from the catchment area or time required to obtain a unit amount of water from each water source, based on the global mean level of precipitation. We calculated the WSFP for each water source by multiplying each amount of activity at each lifecycle stage with the factors in the water source inventory and Yano’s WAF [18]. In Yano’s WAF [18], we adopted the factors for the whole of Thailand (precipitation = 0.6, surface water = 1.2, and groundwater = 4.2) and irrigated cropland in Thailand (precipitation = 0.7, surface water = 1.3, and groundwater = 4.3) [18]. We calculated the WSFP using the average unit input and fuel/water scarcity of MSG annual production by Ajinomoto Co., Ltd. (Bangkok, Thailand). The data are confidential and cannot be disclosed; however, Table 1 shows the approximate weight mix.
2.3. Air Pollution Footprints
We evaluated the APFP of NOx and SOx, PM2.5, based on PM2.5 intensity.
where i is the item input and s is the lifecycle stage.
The APFP is calculated by multiplying the item input by the item PM2.5 throughout its lifecycle. Therefore, the definitions of the raw material stage, sub-raw material stage of production, and production stage are the same as the CFP. For the APFP inventory, we used the European Monitoring and Evaluation Programme/European Environment Agency (EMEP/EEA) air pollutant emission inventory guidebook 2019 [19]. The reason why we selected the EMEP/EEA air pollutant emission inventory guidebook [19] is that the guidebook includes many different types of inventory. We calculated the APFP by using the average unit input and fuel consumption of MSG annual production by Ajinomoto Co., Ltd. (Bangkok, Thailand). The data are confidential and cannot be disclosed; however, Table 1 shows the approximate weight mix.
2.4. Impact Assessment on Human Health Using DALYs
We adopted the lifecycle impact assessment (LCIA) method based on endpoint modeling 3 (LIME-3) for the impact assessment [20]. LIME-3 [20] has three steps of LCIA (characterization, damage assessment, and weighting), and a conjoint analysis was used for the weighting. For characterization, nine impact categories (climate change, air pollution, photochemical oxidant creation, water consumption, land-use, mineral resource consumption, fossil fuel consumption, forest resource consumption, and solid waste) and four endpoints (human health, social assets, biodiversity, and primary production) were selected by developers to be used. The conjoint analysis for weighting was conducted in all G20 countries. The damage assessment factors are average values calculated by dividing the difference in health damage by the difference in CO2 emissions for both the fixed scenario of CO2 emissions and the scenario of increased CO2 emissions for the 2000–2063 period [21]. The damage factors in Thailand for carbon, water scarcity, and APFPs are 4.19 × 10⁻⁷ Disability Adjusted Life Years (DALYs) per kg CO2, 7.04 × 10⁻⁶ DALYs per m3, Black Carbon and Organic Carbon (BCOC) (PM2.5) = 1.58 × 10⁻³ DALYs per kg BCOC, SO2 (PM2.5) = 2.22 × 10⁻⁴ DALYs per kg SO2, NOx (PM2.5) = 3.34 × 10⁻⁴ DALYs per kg NOx, respectively.
3. Results and Discussion
3.1. CFP
Figure 3 shows the CFPs of MSG from non-edible biomass and tapioca starch. The CFPs of MSG from non-edible biomass and tapioca starch are similar at 4.34 and 4.35 kg CO2 per kg MSG, respectively.
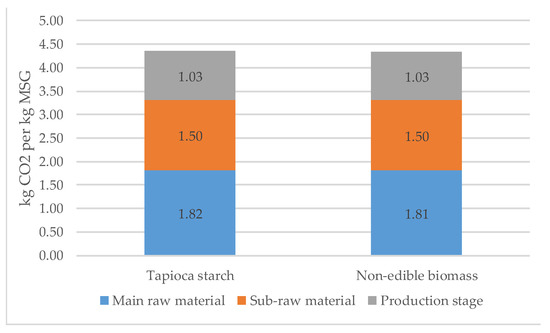
Figure 3.
The carbon footprints (CFPs) of MSG-compared tapioca-starch as raw material with non-edible biomass.
The raw material CFPs of non-edible biomass and tapioca starch are 1.81 and 1.82 kg CO2 per kg MSG, respectively. Figure 4 shows the breakdown of each raw material stage. The sodium source for MSG is 46%. Non-edible biomass and tapioca starch account for ~54% each. In the breakdown of non-edible biomass, the electricity used for pulverizing cellulose accounts for ~20%, whereas the glycosylation materials for glycogen, non-edible biomass (straw) for glycogen, and enzyme reaction materials for glycogen account for ~10% each. The raw material stage of tapioca starch is derived from the nitrogen oxide of fertilizer, the fuel of the tractor, and the energy of the purification process.
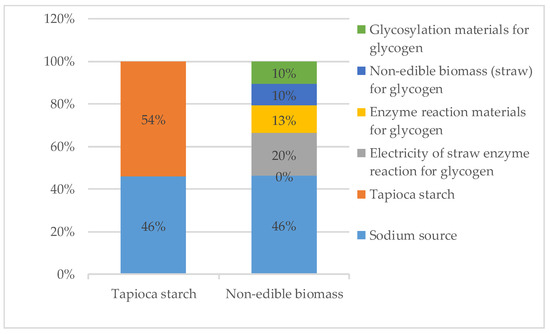
Figure 4.
The breakdown CFPs of main raw material stage.
The CFP of the sub-raw materials used in the production stage is 1.50 kg CO2 per kg MSG. Figure 5 shows the breakdown of sub-raw materials. The ammonia source for fermentation, of which the unit input and inventory are both relatively high, accounts for 58%; minerals for fermentation account for 28%; the acid and alkali of crystallization account for 14%.
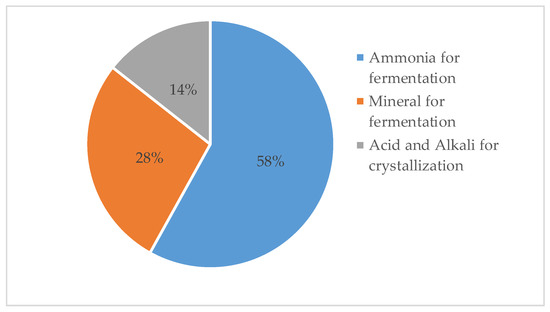
Figure 5.
The breakdown CFP of sub-raw materials.
The CFP of the production stage is 1.03 kg CO2 per kg MSG. Figure 6 shows the breakdown of the production stage. Electricity used for cooling and concentrating accounts for 91%. GHG emissions derived from the fuel are low because biomass fuel is used for the boilers at the model factory.
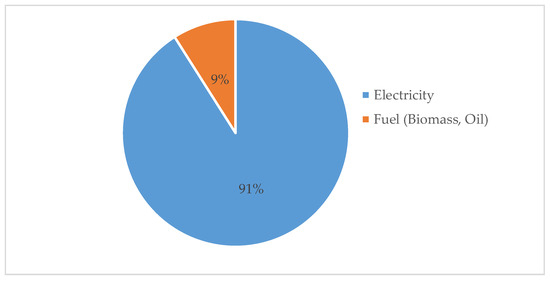
Figure 6.
The breakdown CFP of production stage.
The CFP of MSG hybrid cleaner production [6] was 5.39 kg CO2 per kg MSG. In the breakdown of lifecycle stage, the agricultural stage of maize accounted for 25% (~1.35 kg CO2 per kg MSG), and the other stages accounted for 75% (~4.04 kg CO2 per kg MSG). The CFP of MSG of non-edible biomass in this study was 4.34 kg CO2 per kg MSG, the agricultural stage of rice straw was 0.2 kg CO2 per kg MSG, and for the other stages, it was 4.14 kg CO2 per kg MSG. The CFP values, except for the agricultural stage in this study, were similar to those stated by Yang et al. Table 2 shows the verification of the non-edible biomass agricultural stage via a comparison with previous studies. The CFP of ethanol production derived from grass straw [4] revealed that the hot water case was 470 kg CO2 per 104 MJ and converting this to per weight yielded a value of 1.27 kg CO2 per kg ethanol. In the breakdown of the lifecycle stage, the agricultural stage of grass straw was 0.19 kg CO2 per kg ethanol, the ethanol production stage was 1.00 kg CO2 per kg ethanol, and the transportation stage was 0.08 kg CO2 per kg ethanol. The CFP of bio-based ethanol produced from different agricultural feedstocks [5] revealed that ethanol made from corn grain and stover gave a value of 0.7 kg CO2 per kg ethanol. In the breakdown of lifecycle stage, the agricultural stage of corn grain and stover was 0.5 kg CO2 per kg ethanol, and the ethanol production stage was 0.2 kg CO2 per kg ethanol. The CFP of rice straw in this study was 0.2 kg CO2 per kg MSG, which was similar to that determined by Kumar et al. [4]; both values are presented in the same unit and, thus, we consider this as a reliable result.
Table 2.
Verification of non-edible biomass agriculture stage by comparing previous studies.
3.2. WSFP
Figure 7 shows the WSFP of MSG from non-edible biomass and tapioca starch, respectively. The WSFPs of MSG from non-edible biomass and tapioca starch are 556 and 1768 L per kg MSG, respectively. The WSFP of non-edible biomass decreases water scarcity by 70%.
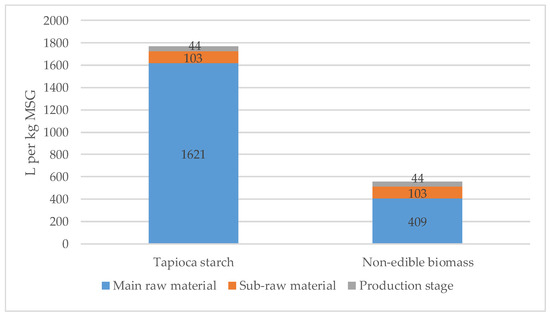
Figure 7.
The water scarcity footprints (WSFPs) of MSG-compared tapioca-starch as raw material with non-edible biomass.
Figure 8 shows the WSFPs for precipitation, surface, and underground water throughout the lifecycles of MSG from non-edible biomass and tapioca starch. The WSFPs of precipitation, surface, and underground water of producing MSG from non-edible biomass are 158, 235, and 162 L per kg MSG, respectively. Hence, these values are similar. Precipitation was only measured for the enzyme reaction material. The WSFPs of precipitation, surface, and underground water of producing MSG from tapioca starch are 1523, 146, and 99 L per kg MSG, respectively. The WSFP of precipitation accounts for 85% by precipitation of cassava cultivation for the raw material of tapioca starch.
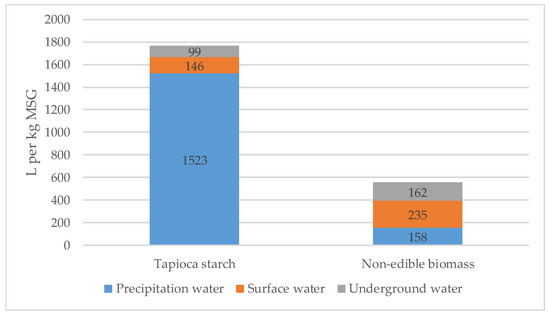
Figure 8.
The WSFPs of the precipitation, surface, and underground water throughout the lifecycles of both raw materials.
The WSFPs of the raw material of non-edible biomass and tapioca starch are 409 and 1621 L per kg MSG, respectively. As rice straw is a non-edible form of biomass in Thailand, it is openly burned due to it having no market value. Thus, it hardly contributed to the inventory of the WSFP.
The WSFP of the sub-raw materials is 103 L per kg MSG. In the breakdown of the sub-raw materials, the ammonia source for fermentation, where the unit input and inventory are both relatively high, accounts for 60%; the acid and alkali of crystallization account for 25%; the minerals for fermentation accounts for 15%.
The WSFP of the production stage is 44 L per kg MSG. Biomass is used as the fuel for the boilers at the model factory and this accounts for most of the WSFP in the production stage. Rice husks in Thailand have a market value for fuel, not food; however, in this study, the water inventory of rice straw—determined by Ecoinvent 3 [13]—in the form of rice husks, only slightly contributed to the inventory of the WSFP as an economic allocation.
3.3. APFP
Figure 9 shows the APFPs of MSG from non-edible biomass and tapioca starch, which are 1.34 × 10⁻⁵ DALYs per kg MSG and 2.17 × 10⁻⁵ DALYs per kg MSG, respectively. The APFP of non-edible biomass decreased by 40% due to the prevention of smoke air pollution from open burning.
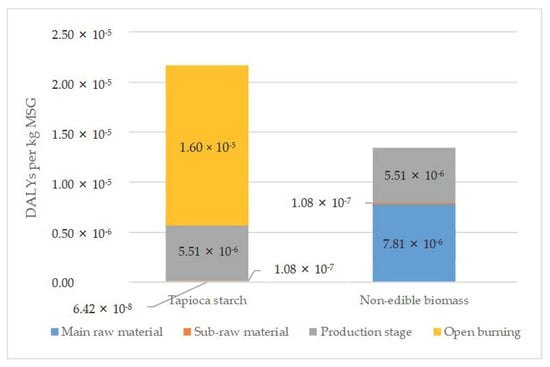
Figure 9.
The air pollution footprints (APFPs) of MSG-compared tapioca-starch as raw material with non-edible biomass.
The APFP of the raw material stage of non-edible biomass is 7.81 × 10⁻⁶ DALYs per kg MSG, derived from the biomass fuel for steam. The APFP of the raw material stage of tapioca starch is 6.42 × 10⁻⁸ DALYs per kg MSG, derived from the nitrogen from fertilizer used for cassava. The APFP of the sub-raw material stage is 1.08 × 10⁻⁷ DALYs per kg MSG, derived from the ammonia for fermentation. The APFP of the production stage is 5.51 × 10⁻⁶ DALYs per kg MSG derived from the fuel.
3.4. Impact Assessment on Human Health Using DALYs
We assessed the impact categories between two cases using the DALYs, which integrated three multi-criteria assessments using LIME-3.
Figure 10 shows the results of converting DALYs. The DALYs of MSG from non-edible biomass and tapioca starch are 1.92 × 10⁻⁵ and 3.59 × 10⁻⁵ DALYs per kg MSG, respectively; the DALYs of the CFP for both are 1.82 × 10⁻⁶ DALYs per kg MSG. The DALYs of WSFPs of MSG from non-edible biomass and tapioca starch are 3.91 × 10⁻⁶ and 1.24 × 10⁻⁵ DALYs per kg MSG, respectively. The APFPs of MSG from non-edible biomass and tapioca starch are 1.34 × 10⁻⁵ and 2.17 × 10⁻⁵ DALYs per kg MSG, respectively.
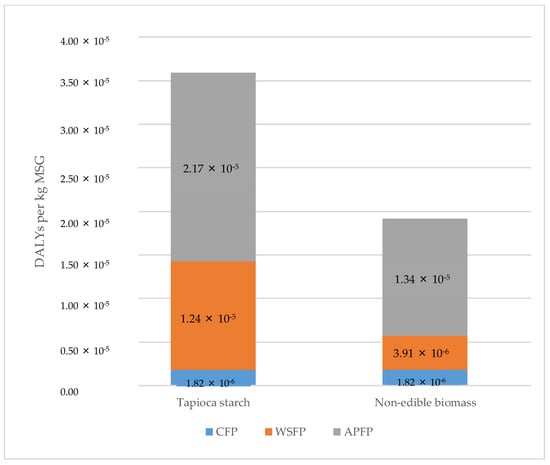
Figure 10.
The DALYs based on the lifecycle impact assessment (LCIA) method based on endpoint modeling 3 (LIME-3) of MSG-compared tapioca starch as raw material with non-edible biomass.
The DALYs of MSG from non-edible biomass are 50% smaller than those from tapioca starch because of the contribution of the decreased WSFP and APFP values, with no CFP contribution. As the MSG market size in Thailand is 120,000 t per year, the social impact DALYs decreases to 2015 DALYs per year by using rice straw as non-edible biomass. The social impact of this equals to a 1.2% reduction in cases of asthma in Thailand in 2019 [22].
3.5. Breakdown of Main Raw Material Stage
Figure 11 shows the analysis of the raw material stage of CFP, WSFP and APFP by comparing the non-edible biomass with tapioca starch. The CFP of non-edible biomass, in terms of the amount of electricity used for pulverizing the cellulose, accounts for 20%. If the electric power source changes to a renewable energy source, such as solar power, the raw material CFP of the non-edible biomass will reduce by 20%. The WSFP of the non-edible biomass, in terms of the enzyme reaction materials used for glycogen, account for ~40%. If the enzymes derived from non-edible biomass are developed, the raw material WSFP of non-edible biomass will reduce by up to ~40%. The APFP of the non-edible biomass, in terms of the biomass fuel used for steam production, accounts for ~90%. If the biomass boiler efficiency is improved by 5%, the raw material APFP of the non-edible biomass will reduce by 4.5%. In the context of sustainability, it is very important that the use of non-edible biomass as an MSG raw material comes to realization via the implementation of these technology developments.
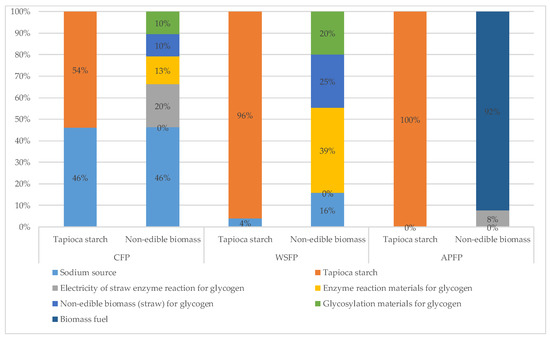
Figure 11.
The analysis of raw material stage of CFP, WSFP and APFP by comparing non-edible biomass with tapioca starch.
4. Conclusions
We compared the LCA of MSG by fermenting pulverized glycosylated non-edible biomass and fermenting glycosylated tapioca starch. Two significant findings were revealed using the non-edible biomass. First, rice straw as a non-edible biomass reduces the WSFP by 70%, which is more than tapioca starch at the raw material stage. At the raw material stage of non-edible biomass, rice straw in Thailand has a low market value and is incorporated into paddy fields, with the residue being disposed of via open burning. Therefore, the environmental impact of rice straw has not been widely recognized in terms of the WSFP inventory. Meanwhile, the environmental impacts of rice and rice husk fuel have received slightly more recognition. The APFP of non-edible biomass also reduces 40% more than tapioca starch by preventing smoke air pollution via open burning. The CFP is similar in both cases and the raw material stage is decreased by using rice straw as a non-edible biomass. However, the CFP is increased by using enzymes and electricity for pulverizing cellulose. Secondly, the impact assessment on human health—using DALYs—suggests a reduction of 50% by using non-edible biomass compared to tapioca starch because of a decrease in the WSFP and APFP. However, the CFP has no influence. As the MSG market size in Thailand is 120,000 tons per year, the social impact DALYs decreased to 2015 DALYs per year by using rice straw as a non-edible biomass. The social impact equals to a 1.2% reduction in asthma cases in Thailand in 2019 [22]. We found that using rice straw prevents water scarcity and smoke air pollution caused by open burning.
This study applied primary data in an inventory analysis. Although this study did not include biodiversity and land-use change as impact categories, we assume that MSG produced via utilizing non-edible biomass has fewer impacts related to these impact categories compared to MSG produced from tapioca starch, because at present, non-edible biomass is discarded in Thailand. Currently, there is no commercial process for pulverizing glycosylated non-edible biomass because this process is associated with high costs due to the large energy and chemical requirements. If more effective enzyme degradation technologies are developed, the market value of non-edible (residue) biomass may increase as a consequence of its effective utilization. In such case, its environmental impact will also increase, while the environmental impact of edible biomass will decrease. Therefore, it is desirable that consequential LCA studies are conducted to address the impacts of such a situation.
Author Contributions
Conceptualization, K.N. and N.I.; methodology, K.N. and N.I.; validation, N.I.; formal analysis, K.N.; investigation, K.N.; resources, K.N.; data curation, K.N.; writing—original draft preparation, K.N.; writing—review and editing, N.I.; visualization, K.N.; supervision, K.N.; project administration, K.N. Both authors have read and agreed to the published version of the manuscript.
Funding
This research received no external funding.
Institutional Review Board Statement
Not applicable.
Informed Consent Statement
Not applicable.
Data Availability Statement
Not applicable.
Conflicts of Interest
The authors declare no conflict of interest.
References
- Titaporn, S.; Norihiro, I.; Shabbir, H.G.; Sate, S. Life cycle assessment of maize cultivation and biomass utilization in northern Thailand. Sci. Rep. 2020, 10, 3516. [Google Scholar]
- Sanwasan, Y.; Sate, S.; Shabbir, H.G. Energy and environmental impact analysis of rice cultivation and straw management in northern Thailand. Environ. Sci. Pollut. Res. 2018, 25, 17654–17664. [Google Scholar]
- Prasad, A.; Sotenko, M.; Blenkinsopp, T.; Coles, S.R. Life cycle assessment of lignocellulosic biomass pretreatment methods in biofuel production. Int. J. Life Cycle Assess. 2016, 21, 44–50. [Google Scholar] [CrossRef]
- Kumar, D.; Murthy, G.S. Life cycle assessment of energy and GHG emissions during ethanol production from grass straws using various pretreatment processes. Int. J. Life Cycle Assess. 2012, 17, 388–401. [Google Scholar] [CrossRef]
- Muñoz, I.; Flury, K.; Jungbluth, N.; Rigarlsford, G.; I Canals, L.M.; King, H. Life cycle assessment of bio-based ethanol produced from different agricultural feedstocks. Int. J. Life Cycle Assess. 2014, 19, 109–119. [Google Scholar] [CrossRef]
- Yang, D.; Jia, X.; Dang, M.; Han, F.; Shi, F.; Tanikawa, H.; Klemeš, J.J. Life cycle assessment of cleaner production measures in monosodium glutamate production: A case study in China. J. Clean. Prod. 2020, 270, 122126. [Google Scholar] [CrossRef]
- International Standard. ISO 14040:2006 Environmental Management—Life Cycle Assessment—Principles and Framework; ISO: Geneva, Switzerland, 2006; Available online: https://www.iso.org/obp/ui/#iso:std:iso:14040:ed-2:v1:en (accessed on 6 February 2021).
- International Standard. ISO 14044:2006/AMD 2:2020 Environmental Management—Life Cycle Assessment—Requirements and Guidelines—Amendment 2; ISO: Geneva, Switzerland, 2006; Available online: https://www.iso.org/obp/ui/#iso:std:iso:14044:ed-1:v1:amd:2:v1:en (accessed on 6 February 2021).
- The Ministry of Health, Labor and Welfare in Japan. The Survey Report of Food Additive One Day Consumption; The Japan Food Chemical Research Foundation: Tokyo, Japan, 2000.
- Agricultural Statistics of Thailand 2019. Available online: http://www.oae.go.th/assets/portals/1/files/jounal/2563/yearbook62edit.pdf (accessed on 6 February 2021).
- International Standard. ISO 14067:2018, Greenhouse Gases—Carbon Footprint of Products—Requirements and Guidelines for Quantification; ISO: Geneva, Switzerland, 2006; Available online: https://www.iso.org/obp/ui/#iso:std:iso:14067:ed-1:v1:en (accessed on 6 February 2021).
- Working Group III Contribution to the Fifth Assessment Report of the Intergovernmental Panel on Climate Change (IPCC), Climate Change 2014 Mitigation of Climate Change: Figure SPM.2. Available online: https://www.ipcc.ch/site/assets/uploads/2018/02/ipcc_wg3_ar5_full.pdf (accessed on 29 March 2021).
- The Ecoinvent Database. Available online: https://www.ecoinvent.org/home.html (accessed on 26 November 2012).
- International Standard. ISO 14046:2014 Environmental Management—Water Footprint—Principles, Requirements and Guidelines; ISO: Geneva, Switzerland, 2006; Available online: https://www.iso.org/standard/43263.html (accessed on 26 November 2012).
- Hoekstra, A.Y.; Chapagain, A.K.; Aldaya, M.M.; Mekonnen, M.M. The Water Footprint Assessment Manual: Setting the Global Standard; Earthscan: London, UK, 2011; pp. 1–206. [Google Scholar]
- Mekonnen, M.M.; Hoekstra, A.Y.; Water Footprint Network. The Green, Blue and Grey Water Footprint of Crops and Derived Crop Products, Value of Water Research Report Series No. 47. Product Water Footprint Statistics, Water Footprints of Crops and Derived Crop Products (1996–2005); UNESCO-IHE: Delft, The Netherland. Available online: https://waterfootprint.org/en/resources/waterstat/product-water-footprint-statistics/ (accessed on 26 November 2012).
- Food and Agriculture Organization of the United Nations, AQUASTAT. Available online: http://www.fao.org/nr/water/aquastat/data/query/index.html?lang=en> (accessed on 15 November 2015).
- Yano, S.; Hanasaki, N.; Itsubo, N.; Oki, T. Water Scarcity Footprints by Considering the Differences in Water Sources. Sustainability 2015, 7, 9753–9772. [Google Scholar] [CrossRef]
- EMEP/EEA Air Pollutant Emission Inventory Guidebook. Technical Guidance to Prepare National Emission Inventories; EEA Report No 13/2019; European Environment Agency: Copenhagen, Denmark. Available online: https://www.eea.europa.eu/publications/emep-eea-guidebook-2019 (accessed on 15 November 2015).
- Itsubo, N.; Inaba, A. LIME 3 (Life Cycle Impact Assessment Method Based on Endpoint Modeling); Maruzen Publishing: Tokyo, Japan, 2018. [Google Scholar]
- Tang, L.; Ii, R.; Tokimatsu, K.; Itsubo, N. Development of human health damage factors related to CO2 emissions by considering future socioeconomic scenarios. Int. J. Life Cycle Assess. 2015, 23, 2288–2299. [Google Scholar] [CrossRef]
- GBD Compare. Available online: https://vizhub.healthdata.org/gbd-compare/ (accessed on 5 February 2021).
Publisher’s Note: MDPI stays neutral with regard to jurisdictional claims in published maps and institutional affiliations. |
© 2021 by the authors. Licensee MDPI, Basel, Switzerland. This article is an open access article distributed under the terms and conditions of the Creative Commons Attribution (CC BY) license (https://creativecommons.org/licenses/by/4.0/).