1. Introduction
The National Art Schools of Cuba are worldwide considered an outstanding example of modern architecture since they translated the Revolution’s will for social renewal into an innovative design [
1]. Each of the five buildings designed by architects Garatti, Gottardi, and Porro was conceived specifically to house a form of art: Ballet, Music, Plastic Arts, Drama, Modern, and Folkloric Dancing. They cover an overall area of approx. 37,000 m
2 (
Figure 1). The construction began in 1961, and the schools were officially inaugurated on 26 July 1965, declared formally finished without actually being completed. The buildings were built with quite the same materials and construction techniques (e.g., the catalan vaults), even if each building is independent. Two of the five schools are completely unused (Drama and Ballet Schools), apart from spontaneous uses. They are perfectly integrated into a 56-hectares city-park occupying Havana’s former golf course in the residential neighbourhood named Playa. Other buildings perform important functions within the complex: the Rectorate building, the school library, the middle-level School of Music (ENA—
Escuelas Nacionales de Arte), the
Facultad de Artes de la Conservación del Patrimonio Cultural, and the dormitory. A Conservation Management Plan (CMP) for this complex was completed in 2020, thanks to the Getty Foundation’s support as part of the Keeping It Modern initiative [
2]. The CMP spans over five actions: (1) documentation, (2) conservation activity, (3) landscape protection, (4) energy sustainability, and (5) management. Different investigation scales are needed to seize the complex and the significant number of issues the conservation plan aims to address. In fact, we can observe a well-integrated system including a park, a river, several pathways in connection with the surroundings at a broad scale (territorial environment), and a network of buildings with different degrees of value and partly in use for teaching activities (architectural environment). At the architectural scale, the five buildings need to be analysed more in detail concerning their level of significance, use and state of conservation.
The CMP takes into account these deepening levels since any conservation issues need to be addressed from a broader perspective. In fact, other problems require detailed analysis and the development of particular intervention protocols, calibrated on the specific characteristics and the state of repair of each material or constructive element. On the other hand, localised deterioration issues need to be addressed on a more detailed level. Therefore, the challenge is how to manage such a combination of scales and buildings with varying levels of interest, significance, and conservation needs. A reliable, informative system was developed and able to ensure the complex’s effective management over time.
The paper’s introduction describes the case study and the aims of the project, together with the current state of the research.
Section 2 discusses the organisation of the management system designed for the National Arts Schools of Cuba, and the results are explained in
Section 3. Finally,
Section 4 is dedicated to the conclusions after the system’s validation and in comparison with similar experiences.
1.1. Tools and Systems for the Conservation Management Plan
“Keeping It Modern” is an initiative launched by the Getty Foundation in 2014, with the aim to promote a comprehensive approach to the conservation of modern architecture. Modern architecture is one of the defining artistic forms of the 20th century; nowadays, it represents a major field of investigation within the architectural preservation sector. In fact, thanks to new construction techniques, and the mechanical properties of materials derived from industry (iron, concrete, glass, polymers), architects and engineers had the opportunity to conceive forms and spaces that were previously unimaginable. However, because of those highly experimental features, buildings have often not performed as expected over the years, and they are now at risk. The program aims at addressing this challenge, and it has supported the preparation of a Conservation Management Plan (CMP) for a selection of iconic buildings during 2014–2019 [
3]. A CMP for the
Instituto Superior de Arte of Havana (ISA) was prepared under this initiative during 2018–2020.
A CMP is a document to help owners and managers understand the heritage values of a place and how those values can be best conserved given the particular management context. It helps to manage change and is a widely used tool [
4].
J.S. Kerr defined a CMP as “a document which explains why a place is significant and how you will sustain that significance in any new use, alteration, repair or management. A conservation management plan is a document which sets out the significance of a heritage asset, and how that significance will be retained in any future use, management, alteration or repair. It is based on a very simple thinking process which starts with describing what is there, why it matters, what is happening to it and the principles by which you will manage it and then sets more detailed work programmes for maintenance, management, access, use or other issues. A plan helps you care for a site by making sure you understand what matters and why before you take major decisions. The approach can be used for any type of heritage asset, site or place” [
5] (pp. 2–3).
A Geographic Information System (GIS) was chosen as the decision-supporting tool to create a single worktable within an extended group of operators. The first activities related to setting up the CMP data management system concerned an early knowledge of the documentary materials and their main typologies. The initial materials come mainly from bibliographic sources and scientific reports. Instrumental data (microclimatic monitoring and three-dimensional documentation), unpublished information, and information from on-site inspections were acquired during the project. The structured tool includes all the features necessary to host such data for their proper and immediate consultation and processing. In selecting the management system typology, it was essential to share the different research phases in order to create a single worktable within an extended group of operators. First, the chosen management tool is a Geographic Information System platform operating as a database, and it is organised at different levels of detail (territorial and architectural environment). It can host the raw materials, the processing and research in progress, and most of the working groups’ results. The acquired materials have been organised, classified, and a hierarchy was assigned to them using different information levels to establish distinct thematic areas based on the typology of data and the implemented research. The information system combines selected graphic support bases such as cartography, modern and contemporary maps, and aerial images. Besides this, other information layers have been processed and associated deriving from the geomorphological and hydrographic studies.
A unitary GIS project was created to organise such data, identify possible queries, thematic and spatial correlations, and pursue specific aims at different investigation levels. A Quantum GIS platform was selected as the most appropriate management software to share the project contents during the phase of data collection and selection and to allow users to evaluate and interpret this considerable amount of information. This tool is open source and flexible for the various multidisciplinary needs to allow distribution to all users involved during the research phase and to local operators who will have to manage the site and all the different areas and objects.
1.2. The National Art Schools of Havana
A concise description of the National Art Schools is necessary to better contextualise the research and introduce its main characteristics. This section is intended to explain the principles underlying the five projects briefly. For a more exhaustive definition, please refer to the reference bibliography [
1].
Vittorio Garatti designed the school of Ballet to host higher-level education courses, and it was built to hold Classic dance classes. The building is just south of the School of Music, across the Rio Quibú, nestled into a lushly vegetated ravine at its bend. The building recalls hypogeal constructions and has a strong connection with the nature of the site. To pursue this goal, the architect did not make a proper distinction between internal and external spaces. The fluid covered gallery links together all the spaces composing the School from the interior, namely: the three dance pavilions, the choreography theatre, the theoretical classrooms, and the three smaller domes (library, infirmary, administrative offices). Another project by Vittorio Garatti is the School of Music, which embraces a hillside roughly paralleling the river. The serpentine building comprises two levels, which run in parallel for about 265 m and then part ways moving towards the extremity overlooking the Rio Quibù. While the lower layer continues for other 88 linear meters, ending against the cylindrical terraces in front of the river, the higher level only proceeds for about 13 m, keeping the same curvature and virtually completing the area of the unbuilt piazza. Both extremities of the building present a deep porch overlooking the park.
The School of Plastic Arts was designed by Ricardo Porro and is located in front of the former Country Club entrance on the northern part of the site. The School of Plastic Arts forms were determined through a spatialised symbolic representation. The architect sought to address identity issues through an architectural synthesis of Cuba’s multicultural heritage, which he defined as a hybrid of patriarchal Spanish baroque culture and nurturing matriarchal African culture, both mediated by the tropics’ sensuality. The schools’ plan evokes an archetypal African village, creating an organic urban complex of streets, buildings, and open spaces. The studios, oval in plan, are the basic cell of the complex. Each of them was conceived as a small arena theatre with a central skylight to provide zenith lighting. The studios are organised along two curving colonnaded paths. Lecture rooms and offices are accommodated in a contrasting block-like plan that is partially wrapped by and engaged with the colonnaded path.
Roberto Gottardi designed the School of Dramatic Arts, and it stands to the east side of the School of Modern Dance on a slight hill stepping down into a densely vegetated bend of the Rio Quibù. If completed, this school and the School of Music would have been the largest of the complex; however, due to the building site’s interruption, they ended up being the most contained. The original program for the School of Dramatic Arts was extensive, complicated, and without clear precedents. The school contained both a large indoor theatre and a smaller amphitheatre with a shared stage and technical support. Various types of classrooms, studios, and administrative facilities made up the rest of the program, including a cafeteria and a library. The complex was supposed to be composed of three clusters, each organised around open courts and connected to one another by the landscaped terraces descending towards the river. While the administrative offices, library, and cafeteria were partially built but left unfinished, the double patios’ unit housing classrooms were never built, just like the flanking storage facility.
Finally, the School of Modern Dance sits on the south side of the Country Club, overlooking the rest of the area. The program called for a performance theatre, four dance pavilions, several theoretical classrooms, library, and administration facilities. In the School of Modern Dance design, Porro wanted to praise the social-political moment he was living in Havana: the revolution’s triumph. Thus, the design process aimed to reflect and absorb the feeling of exaltation, the collective emotional explosion, and, at the same time, a sense of anguish and fear towards the unknown future of the newborn Cuban society. This contrast is evident when moving to access the School from the main entrance, whose tall arches convey a sense of confidence and positivity. However, just across the plaza, the feeling changes, as the strict lining of the rectangular pillars of the porticoed corridors, pointing towards different directions, is quite disorienting.
1.3. Geographic Information Systems for Cultural Heritage Management
Geographic Information Systems (GIS) were borne to acquire, systematise, and display georeferenced data in a defined space through the use of software developed starting from the 1970s [
6]. These tools have made possible the interoperability of data of different nature, mainly of a cartographic type (raster or vector), identifying the GIS not just a tool, but as a system capable of defining new problems, open new research horizons, and integrate an informed spatial perspective [
7,
8]. The continuous experimentation and development of technologies permitted the introduction of a significant variability of information, more and more heterogeneous, making these systems suitable for different application fields. While in the beginning, GIS was intended to simply contain and analyse data at a territorial scale for urban planners and geographers, the technological improvements, the lower costs of hardware, and the hybridisation of software allowed its application at different scales ranging from territory to single objects. Even the fields of application are today the most varied, from health care to manufacturing companies, from the transport sector to public services in general [
9]. GIS technology has become increasingly used in recent decades. It offers the most appropriate tools to local institutions for asset management and administrators to control and plan interventions for improving productivity [
10].
Geographic information systems are now used as a tool for managing information at 360°, as evidenced by various projects that exploit all the potential available to contain, analyse, and thematise data in order to obtain stable and reliable bases for programming or selecting interventions and strategies. It is also possible to move the entire system to web-based platforms and make access and implementation more nimbly, allowing non-specialised people to use these methodologies [
11,
12]. Collaborative planning processes make extensive use of these tools as they proved to be useful in managing different types of information (interactive and public participative GIS) [
13,
14,
15].
The Geographic Information Systems for Cultural Heritage play a fundamental role in managing materials and implementing intervention processes and strategies in the broadest sense of the term. UNESCO introduced the need to create all-around processes of the cultural and natural heritage for their conservation in 1972 [
12]. Article 5 of the Convention concerning the protection of the World Cultural and Natural Heritage states that “each State Party to this Convention shall endeavour... (c) to develop scientific and technical studies and research and to work out such operating methods as will make the State capable of counteracting the dangers that threaten its cultural or natural heritage; (d) to take the appropriate legal, scientific, technical, administrative and financial measures necessary for the identification, protection, conservation, presentation and rehabilitation of this heritage” [
16] (p. 3). This reference recalls the possibilities that a GIS can offer to address these recommendations or UNESCO requests adequately by providing tools for the inventory and assessment of the resources and the cultural sites [
17].
It emerges that the panorama of research that has exploited GIS in various ways is heterogeneous by analysing the experiences that dealt with spatial computerised management tools for Cultural Heritage over the past two decades. This tool is applied significantly to the archaeological context initially. The use of GIS has grown involving all fields related to the management of Cultural and Natural Heritage since the early 2000s [
18,
19]. The research by Ferreira-Lopes carried out a Systematic Literature Review (SLR) on the application of GIS technology in the heritage field. It emerges that the Geographic Information Systems are used for 92% on the immovable heritage, for 6% on the movable heritage, and 2% on the immaterial one. Regarding the field, the GIS is used in 52% of cases for the architectural heritage, 30% in archaeology, 10% in landscape, and 2% in immaterial heritage [
18]. The literary review sample involved 108 scientific articles and quantified the typologies of the analysis carried out with GIS: thematic maps were created in 54% of cases; alphanumeric analysis or queries in 46%; spatiotemporal analysis in 20%; 3D visualisation and geometrical analysis in 15%; layer comparison and density analysis, between 7% and 3%, including pathology, multiple criteria analysis, digital image processing, accessibility, stratigraphic analysis and sun/shade orientation. Finally, three other technologies used in conjunction with GIS were also mentioned or described in 38 articles of the total sample: in 48% of cases, these are data from laser scanner acquisitions, in 42% from photogrammetric processing, and in the remaining 10% from Building Information Modelling (BIM) systems.
These systems’ structuring methodologies are highly debated and continuously advancing topic in scientific research and dedicated tools. This is evidenced by numerous research that has just been concluded or is still in progress [
20,
21,
22,
23,
24,
25,
26,
27]. The use of GISs for CMPs is increasingly frequent even within the Keeping it Modern initiative of the Getty Foundation. The research and conservation planning for the METU Faculty of Architecture building complex by Altuğ-Behruz Cinici in Ankara, Turkey, is an example [
28]. The type of data to be managed and their nature is extremely varied, considering the great differences between experiences. However, there is no reflection on geographic information management tools. Despite this, it is still relevant to trace some common lines. These can guide the structuring of management systems by analysing some significant experiences related to the heritage area in order to bring out the main GIS use issues.
A common point concerns maps (technical maps, aerial and satellite images) or georeferenced drawings, which serve as a support base for the analysis. These materials differ in type, quality, scale of detail, and source. However, their purpose remains to provide a basis for anchor data and materials. It is common to use graphic supports from three-dimensional surveys on a territorial/urban scale and the building scale.
Some systems provide for direct interaction with 3D environments [
29]; in other cases, only the results and processing are exploited (for example, single photogrammetry and projections) [
30]. The spread of online maps starting from the early 2000s and, above all, creating protocols for the supply of maps in the form of images has facilitated the implementation of graphic supports significantly. It is possible to request map images from one or more servers through the standard Web Map Service (WMS), thus defining geographic levels. In contrast, it is similarly possible to obtain vector levels thanks to the standard Web Feature Service (WFS).
Two main approaches can be adopted regarding the information to be inserted into the system. The first is implementing all the raw data available. The second involves skimming, organising, and validating the information before insertion into the GIS environment. Both solutions have strengths and weaknesses, and selecting one of the two options is often functional to the quantity of data to process. The structuring of an attribute table is a way to support this phase for entering raw or processed data. In fact, it is crucial to think in advance about the specifications and characteristics the information must possess. This aspect can result in an early organisation and a hierarchy of the materials upon which the information levels and thematic maps will rest. Furthermore, such filing has the advantage of early identification of the groups of interest and the information fields, thus acting as a structure for validating the information.
Another aspect that associates all systems is the analysis through database queries, perhaps the most important, and that distinguishes the GIS. The most basic spatial analysis form consists of the synoptic visual rendering of a phenomenon’s spatial distribution. GIS enhances this ability by automating even complex calculation operations and analysing one or more thematic layers and their associated attributes. The possibilities of constructing spatial analysis are strongly conditioned by the specific form of modelling and recording the information. Instead, the queries’ outcome can be a new dataset extracted from the one tested or a new thematic map utterly independent from the initial information. The examination is divided essentially into three categories: querying, proximity analysis, and overlay analysis. The querying operates an internal selection of the objects in the analysed theme by defining an objective output, for example, a classification or spatial selection of a particular attribute. The proximity analysis allows a selection through spatial relationships. In contrast, the overlay analysis applies operations of intersection between overlapping themes, giving back data or thematic maps resulting from multiple interactions and calculations. Among the querying processes, the functions of identification, interactive selection, and examination must be indicated as simple query operations. The user can select elements by writing a query that automatically identifies the objects that correspond to a specific selection criterion based on the table information. The simplest type of query in a database is the association through a relationship operator (such as “=“) between a table field and a particular value.
On the other hand, the proximity analysis allows to explore the space surrounding the objects and create new layers based on the analysis. It is possible to set selections based on the spatial relationship with the other items belonging to the same layer instead of selecting the objects according to a value in the table attributes. Buffering allows creating a polygonal area surrounding a specific object and using it for other spatial analysis forms. Finally, the overlay analysis integrates simple queries with operations on spatial relations. The layers derived from a proximity analysis can relate to the attribute fields’ querying operations, thus generating a specific thematic map, for example.
1.4. GIS Experiences and Research
The above issues were dealt with in depth in the project for a small region’s management system on Spain’s east coast, a rural inland near the Mediterranean Sea [
31]. The research considered ten municipalities with typical peculiarities, such as demography, economy, criticisms, and an architectural heritage characterised by vernacular buildings with a reasonably heterogeneous conservation level. The structures have common construction techniques and materials. However, many alterations occurred and modified the historic urban cores over the years. These changes are now the result of a continuous evolution based on current use and the removal of regulations. The study proceeded with the structuring of a GIS taking into account the high number of buildings, the complexity and the amount of information. The aim was to realise a complete database for structuring a series of targeted queries in order to give back valuable results for strengthening the Territorial Heritage Action Plan. The first phase of analysis involved collecting and cataloguing preliminary and previous data concerning the heritage elements. These also included related graphic information (such as floor plans, drawings, and images). The project also finalised meetings with the communities by carrying out structured interviews with residents to highlight a series of interest issues: the villages’ features, the essential values, the characters of the places, the historical and architectonic peculiarities, and the criticisms. All archive data and all information from residents were filtered and implemented in a specific database that allowed the connection between these materials and visual supports.
Therefore, this work permitted the analysis of the historic environments from the past to the current period through multiple themes. Some of them come from simple questions such as the function of the buildings, the position of the elements of interest, the quantification of the characterising architectural features. In contrast, others are more complex for restoring the value of the historical-architectural characteristics and the state of conservation of the structures. The management system also provided the possibility of consulting the data in a simplified and summarised form through each examined building’s information sheets. The compulsory integration of tangible and intangible heritage is one of the critical innovations adopted by this assessment form. It was possible through users and makers’ active involvement in allowing full knowledge of the built heritage’s historical and architectural values.
The research on the building techniques of the 13th–18th centuries in the Sardinia region (Italy) is another example at a different scale and with an even greater sample of information [
32]. The authors considered about 500 buildings highlighting the dimensional, construction, material, chronological, physical, mechanical, and energetic aspects for their knowledge, conservation, and promotion. The research’s primary purpose was to define the structures’ behaviour by proposing a series of interventions for their conservation. This process was made by structuring and implementing a spatial information system (SIS) consisting of a geodatabase connected to a GIS and a WebGIS. The research started from the general catalogue of historical and architectural heritage created by the Central Institute for Catalogue and Documentation (ICCD) of the Italian Ministry for Culture (MiC). It was produced through the SIGEC Web System [
33], which provided a starting structure. However, the tool was organised according to a stratigraphic criterion to better adapt to the project’s aims. Thus, the system allowed the physical and chronological description of the building stratification and created complete knowledge based on continuously updated data. The information hierarchy followed a double path: descriptive and codified through keywords that allowed a high automation level. The system had the purpose of containing a large amount of data and creating a network of relationships between heterogeneous materials for theming operations. It is possible to query the system through multiple instances using the vocabularies.
One of the aspects that guided this system is, above all, the flexibility of action and customisation to be implemented and improved in the new future needs. A further strength is the possibility of carrying out cross-checking of the interdisciplinary data stored in all fields of characterisation, allowing to obtain a critical selection of building techniques. It is worth highlighting the simplicity of consultation and implementation through the WebGIS platform suitably structured through three distinct user levels. In fact, the first level allows the user to view the contents within a straightforward and easy-to-use interface based on the reference cartography and all the materials contained in special levels and cards. The second and third instead allow the operators with different implementation operations and the data’s simple visualisation.
The great potential offered by Geographic Information Systems, together with their ability to integrate many digital technologies, is also exploited for individual historic buildings’ management project. An example is a tool for the preventive conservation of heritage buildings in Southwestern Europe as part of the HeritageCare research [
34]. The study investigated the primary approaches, methods, and management tools for built heritage, highlighting the need to create workflows for the documentation, recording and management of information that can be used by expert users (technicians) and by less experienced users (buildings’ owners or managers). The result was the creation of a Web-based system capable of developing the potential offered by geoinformatics [
35,
36] through the combination of the most current and advanced digital technologies merged into a single tool, the PlusCare system.
This new protocol was applied to different historic buildings but was validated on the General Historical Library of Salamanca (Spain), declared a place of Cultural Interest in 1931. The building dates to the 15th century and has different alterations while preserving the Plateresque style facade intact. The structure houses the university and is used as a museum and library of historical volumes and artefacts. The PlusCare system has been designed to manage complex information considering the significant heterogeneity of data deriving from buildings and the building’s materials. For this reason, the heart of the tool is a geospatial database containing alphanumeric information, images, spatial coordinates, and three-dimensional information. The database can communicate with interactive panoramic images allowing the simple visualisation of the spaces or the consultation of the information registered. It is possible to link any environmental or structural monitoring systems in such a way as to update the data by connecting them spatially to the areas or related elements in real-time. This information is finally linked to warning levels expressed through colour grading scales to rate the assets’ conservation state and better assist the non-expert users in prioritising preventive conservation actions. In this case, we cannot speak of a simple GIS but a complex integrated system that manages the building and the individual components in their complexity.
These experiences and studies demonstrate how GIS can adapt to different application contexts and enable a great variety of analysis that can easily be combined with other digital technologies. However, the difficulty in identifying or defining a shared and unitary process for structuring and organising such methods of analysis and the methodologies and techniques implemented is evident. This difficulty results from the application contexts’ significant heterogeneity, without forgetting the level of detail, the purposes, and the individual projects’ needs. Precisely the system’s ductility allows simple archiving operations, non-complex analyses, data interrelation, displaying graphic contents of various types, quantitative and qualitative studies, theming, or a combination of these. This variability is also found in the kind of data that is frequently used with GIS. For example, the graphic component (cartography and vector drawings) is often associated with various information typologies, such as alphanumeric information, links, images, and cross-query phases [
18].
2. Organising the Management System
Accurate knowledge of the site was the fundamental basis for developing the Conservation and Management Plan regarding Cuba’s National Art Schools in order to arrange and evaluate the area’s intervention and management guidelines (
Figure 2). It was essential to share as much data as possible, materials, and analyses, even in the intermediate processing stages. Different professionals with distinct backgrounds, skills, and working methods were involved during that process. In fact, the evaluation of cultural significance and disseminating the research results were two crucial steps in the project.
The primary purpose of Action 5 “Development of the management system strategy and tools” for the National Art Schools was to create a set of tools able to manage the data and analyses carried out by other work actions, carry out critical assessments, and handle the design and programming of targeted interventions. The analyses developed in the other actions could thus be coordinated within this last working step. Multiple analysis scales were required to consider the whole complex and the various issues to be explored within the National Art Schools’ CMP.
We observe a well-integrated system from an urban point of view and which includes elements such as the park, the Rio Quibù, the connections with the city, and the accessibility to the area (territorial level), in which we find a system of buildings with variable degrees of interest and value. These are partly used for teaching and partially not used (architectural level). Therefore, the CMP took into consideration these different levels as any specific conservation problems cannot be addressed without considering broader and general dynamics (e.g., Rio Quibù level-raising events affecting the surrounding areas and the riverbanks). Other topics require detailed analysis and the development of particular intervention protocols at the same time. These aspects were calibrated on the specific characteristics and the state of conservation of the structures.
It was therefore decided to organise a unitary work plan through a GIS management tool to guide and support the CMP, to include multiple levels of detail, to systematise the numerous topics, to consider the significant architectural characteristics, to share data, and to compare the analyses performed by the different operators. The Geographic Information System is consequently the common platform that aimed to manage an area and a plurality of buildings with varying levels of interest and conservation requirements.
All the information collected during the analytical phase and included in the management system were organised into thematic levels that have demonstrated their functionality and effectiveness for the design phases. That process followed the experiences widely developed in Cultural Heritage [
18,
19] and on coeval examples [
37,
38].
The work was done upstream and downstream to the on-site inspections, in which the necessary information from the geometric and morphological point of view was collected. It consisted of structuring the GIS environment’s information system to manage the architectural complex and the National Art Schools’ entire area. The platform was set up considering any needed information already acquired to obtain a swift structure, with correct graphic bases to be examined for analysis and design operations. The organisation work is described in detail below, following the development and the addition of the processed materials and the activities carried out by the involved project groups. The data were shared to compose a single information database queried to develop critical analysis and identify the project actions.
2.1. The Reference System and the Cartographic Basis
The adopted coordinate reference system was the WGS84 (ID of the EPSG authority: 4326), on which the first geographic information was loaded. An in-depth analysis of the collected materials revealed some critical issues. These regarded the aerial images’ metric and morphological accuracy and the collected modern cartographies due to low quality or huge representation scale (greater than 1:10,000) to distinguish the elements and their main characteristics easily.
Therefore, all cartographic sources available online from different satellite/map databases were verified: Planet, Google, Esri, Apple, Microsoft, WorldImage [
39,
40,
41,
42,
43].
We proceeded with a metric, morphological and qualitative verification of about 25 aerial and satellite images acquired over about ten years (from 2010 to 2019), identifying three recent aerial photographs to be included in the main structure of the management system:
Google Satellite, November 2018;
WorldImage Aerial, December 2018;
Microsoft Bing VirtualEarth, January 2019.
The aerial image “Microsoft Bing VirtualEarth” proved to be the most reliable from a metric point of view for its reduced distortions and the best photographic quality and definition. For this reason, it was selected as the starting primary base of the system (
Figure 3). In fact, the image does not present significant perspective areas, often easily identifiable in the buildings’ immediate closeness. It shows good chromatic quality, the shadows are not too marked, allowing to distinguish details of the covered areas, and the aerial photo refers to a very close moment (January 2019).
The three selected aerial images were imported through direct WMS connection into the GIS system. The maps reproduce data spatially referred to geographical information dynamically to avoid problems related to georeferencing operations. It is worth mentioning the possibility of investigating numerous cartographic thresholds deriving from satellite images in the Planet company database. This made it possible to view all the images taken from 2010 to now with a weekly, monthly, or even daily acquisition rate for some specific periods through the company’s Web platform. These images helped to understand the evolution of green and wooded areas. Still, they could not be used as general support maps for the management system as they are not sufficiently detailed (1: 25,000).
It was decided to insert other WMS maps as these proved to be functional for the verification of the road infrastructures, the surrounding areas, and the urban organisation of the neighbourhood:
We have also chosen to insert four raster levels (Microsoft, Google, WorldImage, ESRI) corresponding to parts of the WMS cartographies given the possibility of not having a stable and adequate internet connection for loading the WMS database.
2.2. 3D Data as Support to the Management System
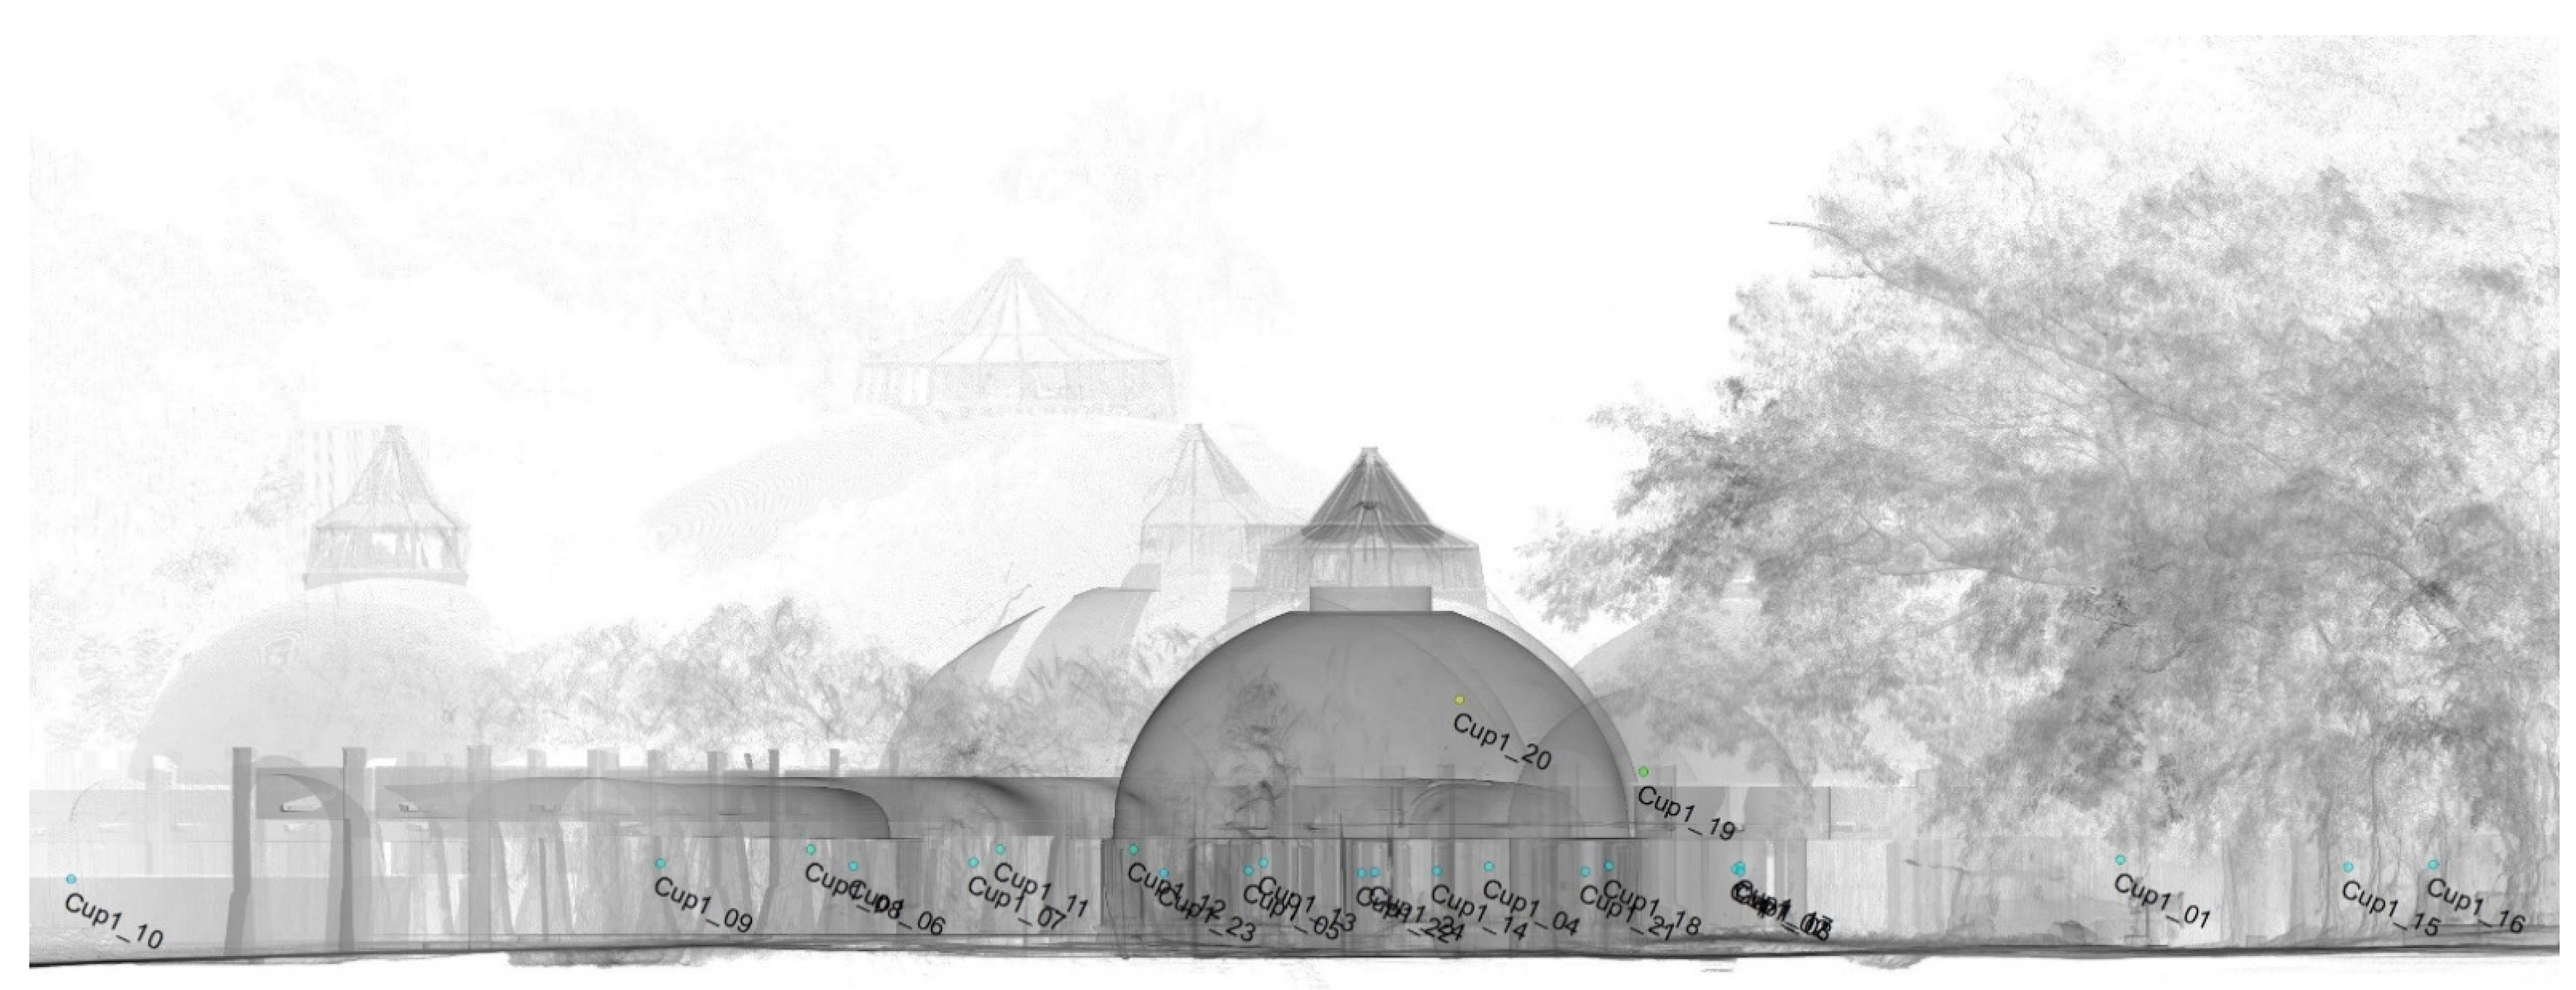
The large- and small-scale three-dimensional acquisitions were made mainly concerning the School of Music, Ballet, and Plastic Arts area as part of the on-site analyses and the capacity building activities with the collaboration of Zenith Ingegneria and Restaura y Proyecto Companies. The goals were to create a whole planimetry of the area and detailed geometrical documentation of the three schools. A high-density three-dimensional acquisition method was chosen to record all the data useful for the structural analysis and the intervention project’s definition of three selected portions. Specifically, the Choreography Theatre of the School of Ballet and two practical classrooms have been identified, one from the Ballet School and one from the School of Plastic Arts.
Three different high-density point clouds with greyscale colouring were obtained regarding the schools’ detailed acquisitions. The coordinates and absolute dimensions recorded using differential GNSS instrumentation were associated at the complete point clouds to establish the three-dimensional elaborations’ georeferencing basis. These clouds were also used to extract the section profiles in plan and elevation and the external façades (
Figure 4 and
Figure 5) to obtain vector-graphic drawings at different detail levels. This dataset was implemented and enriched subsequently through partial elaborations of the geometrically more complex areas. The operation led to create an entire information database, define the detected portions’ structural behaviour, and better understand their morphology. Regarding the large-scale recordings, different groups have been created on the base of the acquisitions’ location. The obtained results helped to contextualise the detailed surveys and check the project plans and the Ballet, Music, and Plastic Arts Schools’ past drawings. This information was organised and exported to generate the appropriate graphic and cartographic support bases for setting up the GIS management tool. It was decided to generate specific documents based on the working groups’ diverse needs, prioritising the cartographic bases’ elaborations on a larger scale and considering how various were the necessary information and the purposes for the different research activities. We proceeded through zenith projection elaborations in 1:200 detail scale, both in grayscale and in colour, for the only scans with chromatic information. This made it possible to significantly enrich the information baggage concerning the area’s morphology, especially for the structures’ correct positioning and rotation.
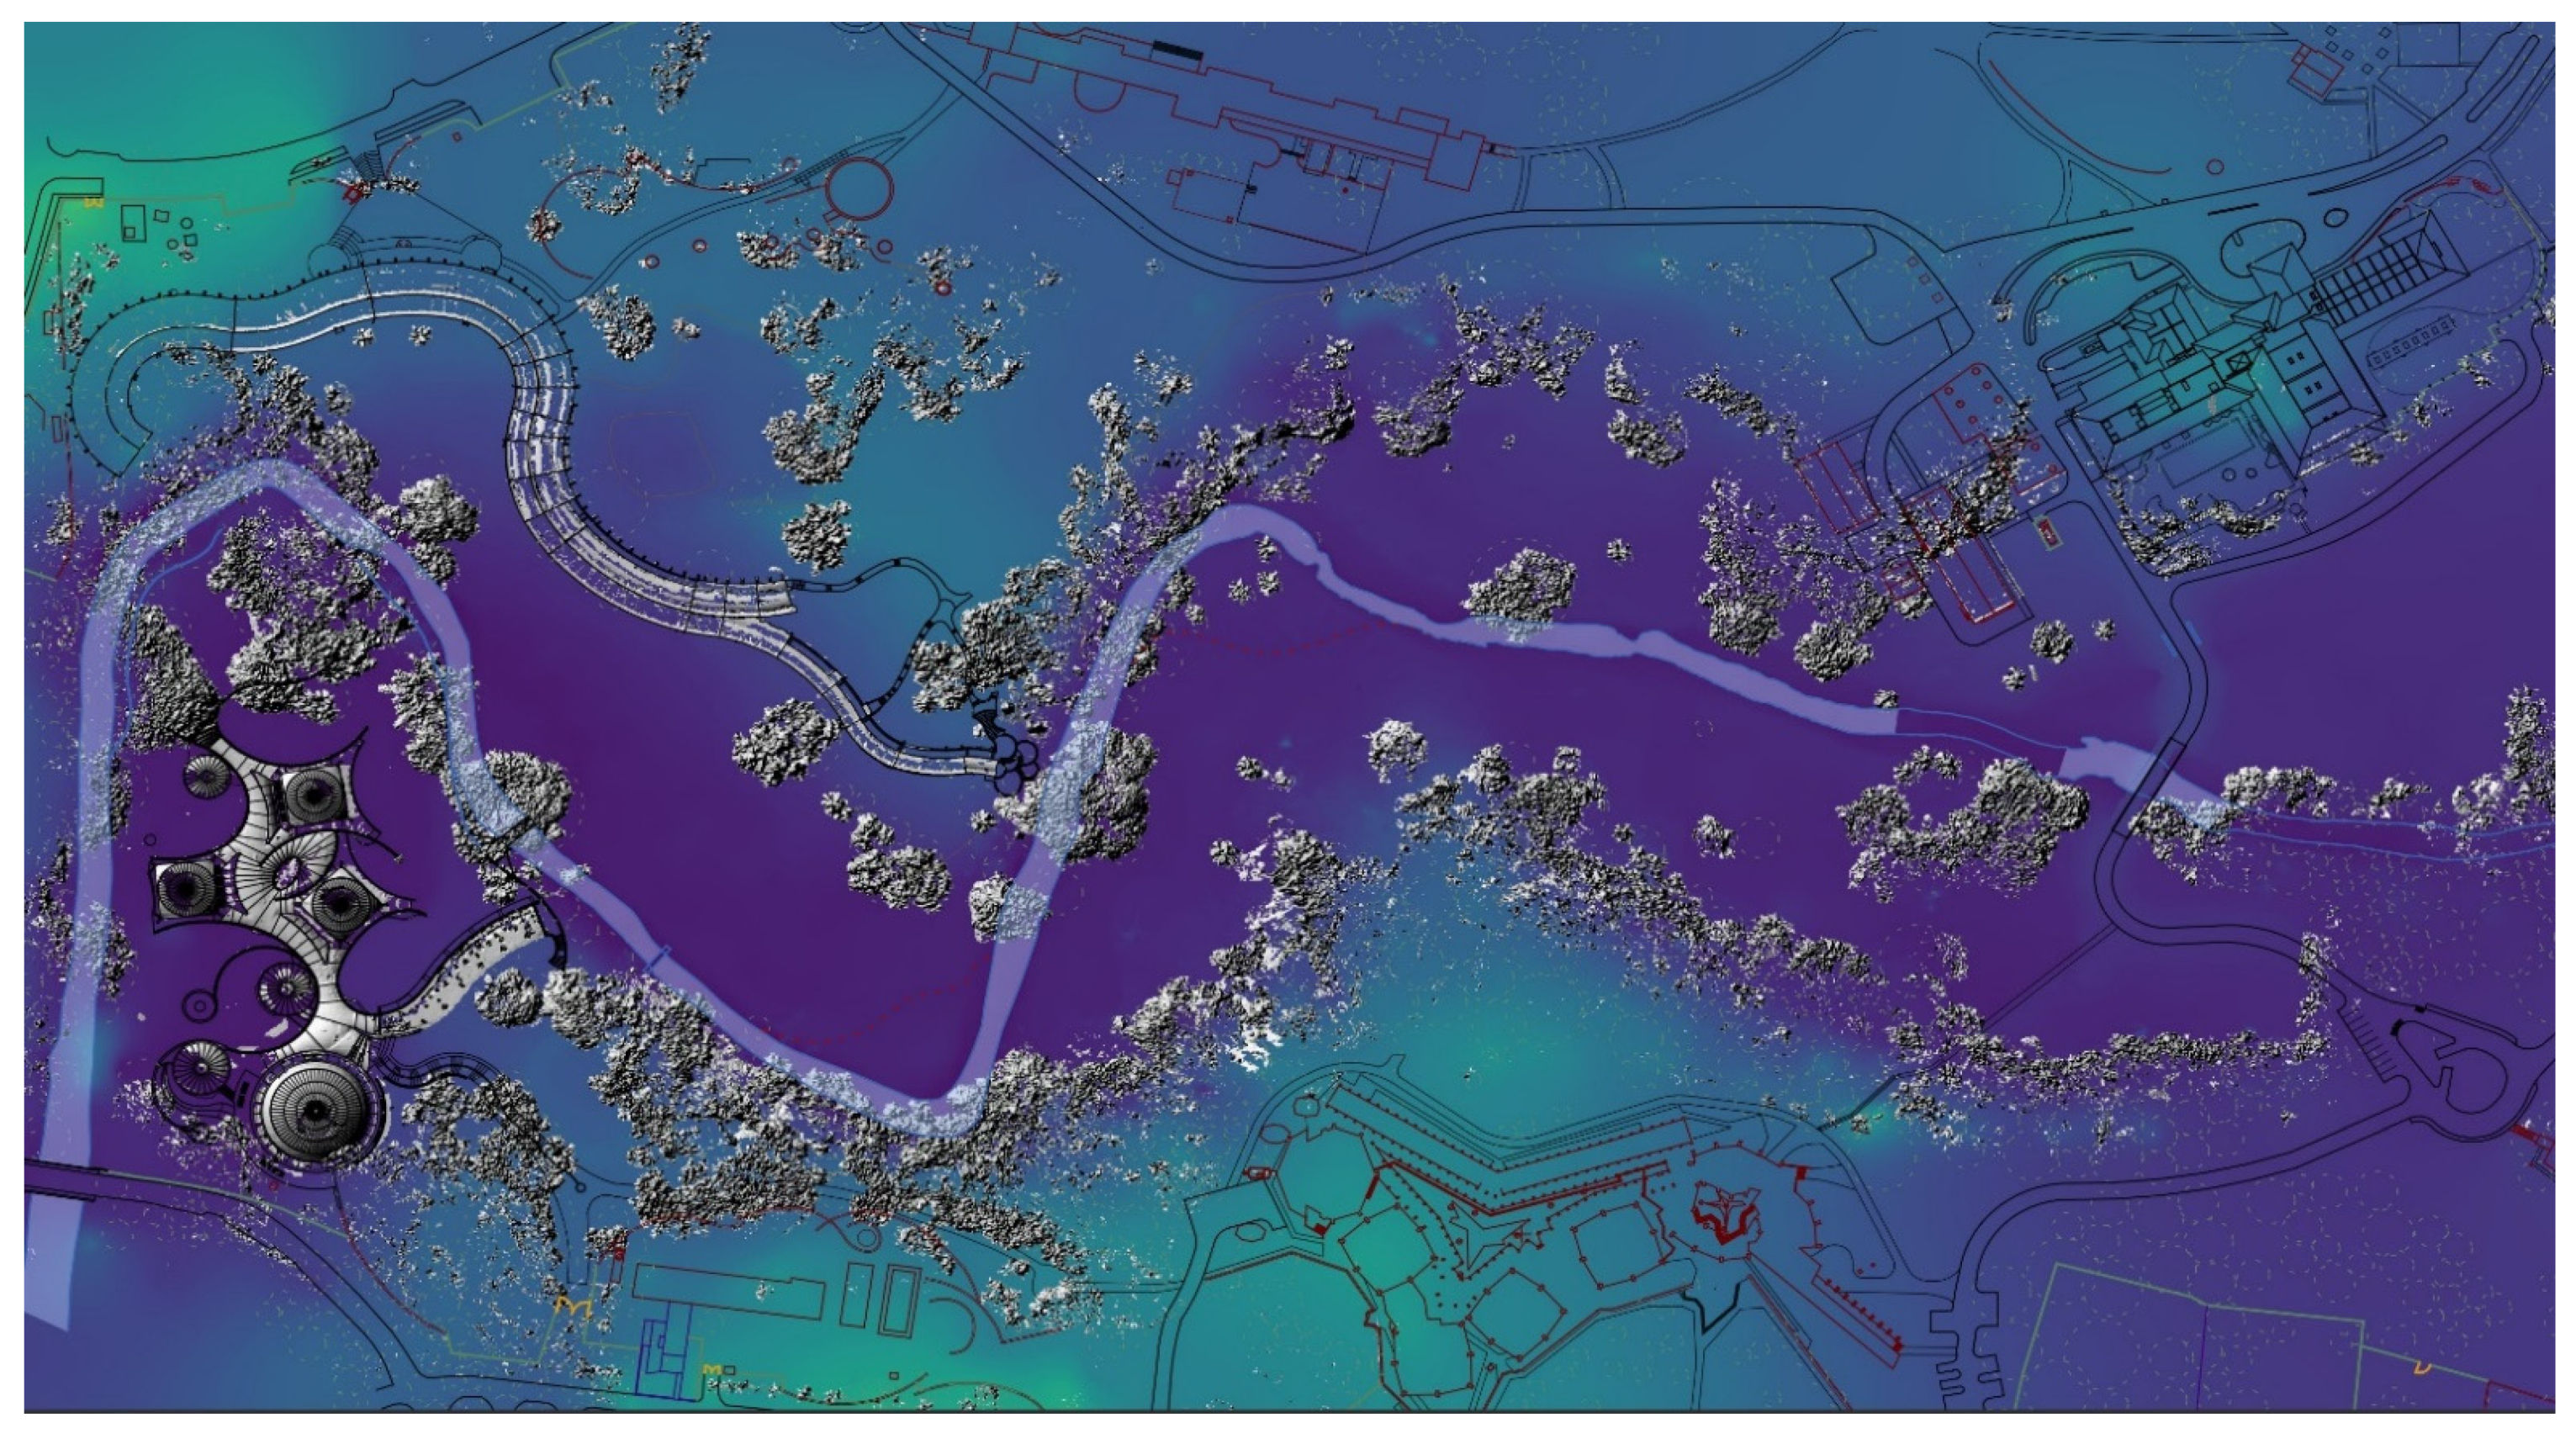
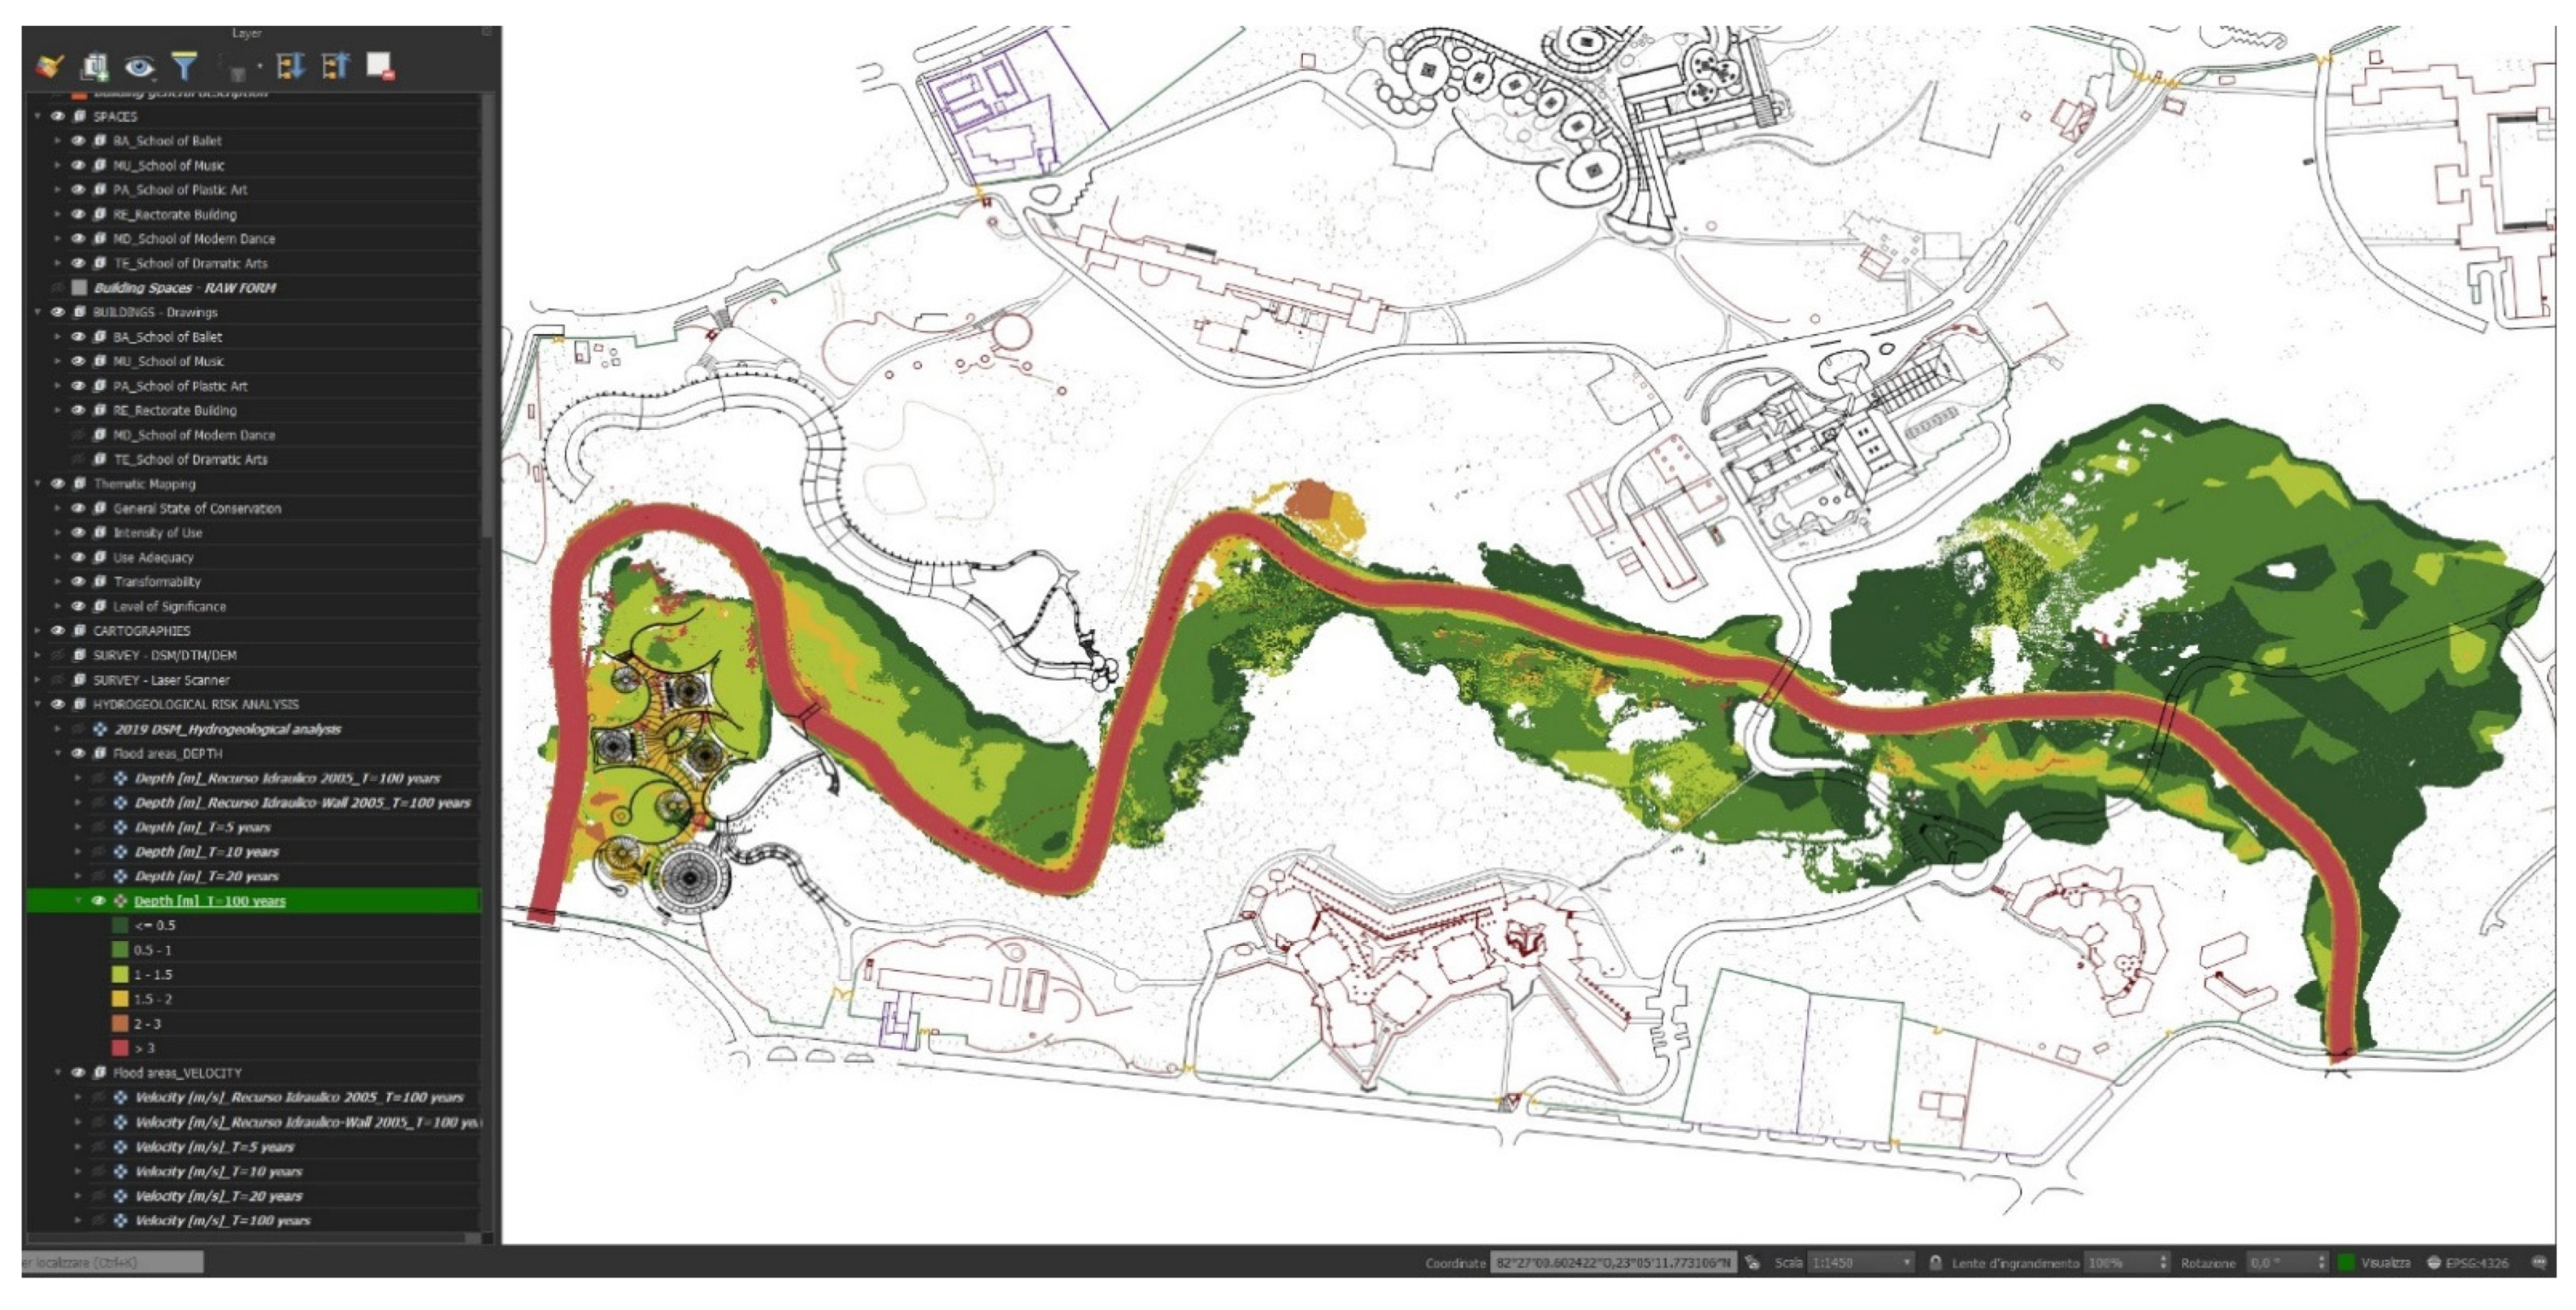
The information thus acquired and processed made it possible to understand the area’s morphology and location, providing a conspicuous aid to the analysis activities. One of the needs was to understand the ground trend in all the areas near the Rio Quibù, in the ISA’s central and western part, especially for the flood risk analysis. Further elaborations have been performed starting from the complete cloud of points to obtain digital models of the terrain and surfaces (DTM, DSM, DEM). An artificial lighting source was added in a three-dimensional environment to simplify the digital models’ interpretation thanks to shadows based on the ground’s slope. This operation made it possible to recognise the soil’s discontinuities more efficiently and, above all, the principal critical points from the point of view of flood risk (
Figure 6). It was finally possible to simplify the DTM to obtain the contour lines’ linear trend that characterises the area. This last process permitted two different simplification and contour levels, the first every 50 cm and the second every 100 cm (
Figure 7).
2.3. Update and Correction of Large- and Small-Scale Vectorial Drawings
The next step involved the insertion of different vector levels created outside the project into the GIS. This made it possible to identify the chosen reference system’s criticisms and verify the graphic representation options. The vector files (.dwg or .dxf) manifested some compatibility problems because drawings were made mainly using the “sp-line” function in the native vector software. In fact, they could not be imported directly into the GIS as they were not wholly recognised and so not allowing adequate spatial queries and processing.
The elaborations concerned the vectorial materials already collected, starting from the area’s general plan drawing, the 2006 “Plan Rector” with subsequent additions. This presented numerous layers, sometimes repetitive or not associated with specific elements and categories because it is a project masterplan only partially realised. Therefore, we have chosen to analyse and systematise the different spatial levels, reducing them to the minimum necessary to represent the area’s elements.
A further problem encountered was related to the metric and morphological accuracy of the materials. The vector plans differed considerably from the precision measurements made during the on-site activities. For these reasons, it was decided to make the required geometric and morphological changes to obtain a reliable and accurate geometric information database considering that it would have been necessary to intervene on all the vector drawings. Therefore, we dealt with the plans on an architectural scale, which is the second level of deepening of the CMP, mainly focusing on the School of Ballet, Music, and Plastic Arts. It was possible to define the building morphology based on the laser scanner survey. This operational phase aimed to obtain architectural scale planimetries (1:100 and 1:200) corresponding to the current condition (as-built), using simple and straightforward levels. All the horizontal sections’ elaborations are represented and referred to well-defined points to place them and not to lose the absolute positioning reference (
Figure 8). The Western part of the “Plan Rector” was arranged with the same methodology up to the Rectorate building.
The verification and systematisation of these drawings and the geometric control of all the cartographic elaborations constitute a fundamental step in recovering materials that are now difficult to acquire or produce. Thus, it was possible to create a specific and univocal database to connect the project results and share materials with the entire workgroup even during the different processing phases. This non-marginal part was necessary for the principle of in-depth knowledge of the site underlying the CMP. Knowing from an architectural perspective to plan interventions on the existing heritage cannot be divided from the study and the correct representation of the elements.
2.4. Organising the Information Levels and Hierarchies
As already mentioned, the GIS was designed to collect different data and materials concerning the area in two progressive levels of detail (general/territorial level, architectural level). The main subdivision structure of raw and processed materials within the GIS is stated to follow in
Table 1:
The categories’ organisation and the primary information levels made it possible to think about the elements’ hierarchy to be inserted before the complete data loading phase. The order was designed to allow operators to view multiple aspects simultaneously, create overlapping mappings, and investigate numerous levels with a single operation. For this reason, the punctual, linear, or areal levels of small extension have been inserted in the first part of the system. The medium-large extension’s territorial or areal levels were instead located in the second part of the structure. Each group was implemented with the data resulting from the various activities’ research and was entirely independent to allow any subsequent shifts in order.
2.5. Descriptive Data of the Buildings and Spaces
During the project, the GIS was used to organise and have immediately available all the information relating to the buildings and individual spaces collected through desk analyses and throughout the inspections. The possibility of collecting comparable data in a single tool permitted archiving a large amount of information in an organised way. Meanwhile, displaying different thematic maps on single cartographic support offered an immediate and synoptic perspective of the various phenomena in such a vast and complex contest. As mentioned in the introductory part, the GIS system has been structured on territorial and architectural levels. The second level, which describes the buildings, is further divided into two sub-levels.
The first sub-level comprises a description, a chronological resume, general information, and aggregated data, such as the overall surface, data on plant networks, and information on projects, uses, and maintenance phases carried out in the past, for all the buildings in the park. This phase allows the first classification and includes all the information that cannot be associated with a single space (e.g., design and state of conservation of the prospects, plant networks). The analysis was carried out for all the buildings in the park, including the older buildings (although heavily altered over time, such as the Rectorate building or the building that hosts the Facultad de Artes de la Conservación del Patrimonio Cultural) and the most recent constructions of little architectural value.
Any decision about management and use should involve the entire complex considering that all these buildings have a specific role from a functional and management perspective, regardless of their different level of interest and cultural significance. It also includes pedestrian and vehicular paths, natural elements and open spaces, although the CMP focuses on the five schools realised in the 1960s, which require specific strategies and conservative interventions. The second level provides detailed information and evaluations for each space of the Schools of Ballet, Music, Plastic Arts, and Modern Dance.
2.5.1. The Attribute Table
Within the organisation, two main layers have been scheduled to collect and organise most of the data and materials. These were structured to contain information according to precise schemes, unlike the other levels in which the materials were inserted as a simple layer of the system.
2.5.2. First-Level Coding
All the park buildings are identified by a 2-digit code, which corresponds to the first descriptive level of the GIS. The first level of coding determines the five schools:
BA: School of Ballet (arch. Vittorio Garatti)
MU: School of Music (arch. Vittorio Garatti)
MD: School of Modern Dance (arch. Ricardo Porro)
PA: School of Plastic Arts (arch. Ricardo Porro)
TE: School of Dramatic Arts (arch. Roberto Gottardi).
The other buildings in the park area were identified similarly:
RT: Rectorate building
BL: Library
PT: Heritage Faculty building
TA: Actual School of Theatre
ME: School of Music (ENA)
RE: Residential building
EA, EB, EC, …: Entrances.
Similar coding can be attributed in future implementations to other elements, which have not been catalogued, such as paths or landscape areas. This last aspect emerged to be of great importance for the managing institution, which recognised biodiversity as one of the characterising elements and, therefore, worthy of protecting this place. The first level (schools and other functional units) was associated with a first descriptive form.
2.5.3. First-Level Form: A General Description of the Buildings
The form includes data analysed in previous actions (
Table 2). The information can be inserted in free fields as text or numerical data. That first level of analysis provides a general overlook of the complex. The data can be implemented over time, and therefore it can be updated for any forthcoming study or project.
2.5.4. Second-Level Coding
The second descriptive level refers to the single rooms or homogeneous portions of external space. Each space (classrooms, offices, theatres, technical rooms) has been associated with an alphanumeric code (
Table 3). It uniquely identifies the spaces and includes the ordering element of the information entered into the system. The codes have also been attributed to open spaces, internal and external paths, and the inner areas, recognising these elements’ functional and architectural value. This categorisation was conceived for the five schools of Garatti, Gottardi, and Porro, starting from a typological-functional criterion, allowing compilers and managers to identify the spaces intuitively. The five schools are autonomous works and characterised by a peculiar architectural language and specificities related to the artistic disciplines. Despite these aspects, they are considered by a common functional scheme, which is repeated substantially identical in the different realisations and allows identifying a hierarchy of spaces.
There are spaces for public use (e.g., the theatre and the exhibition hall) within al the five schools. These are characterised by their imposing size, the possibility of independent access, and often associated with dedicated service spaces. Other rooms are dedicated to laboratory teaching activities and exercises and are characterised by the presence of medium-large domes. These spaces are generally in direct relationship with the covered paths, and with service units for students’ exclusive use (services, dressing rooms, spaces in which to leave equipment and materials). The theoretical courses’ classrooms are more straightforward and arranged in a line, as the offices can have different sizes. The coding so organised allowed the individual area to be identified intuitively, reducing compilation errors.
2.5.5. Second-Level Form: A General Description of the Spaces
The second level of analysis was filled for the Schools of Ballet, Music, Plastic Arts and Modern Dance, and provides detailed information about the indoor and outdoor spaces, including:
a description of the technical elements (windows, skylights, floorings, furniture);
an assessment of the state of conservation of the technical elements;
an evaluation of the maintenance and functionality of the technical systems;
an analysis of the uses.
The attributes scheme was organised into macro-categories, including the sectors described in
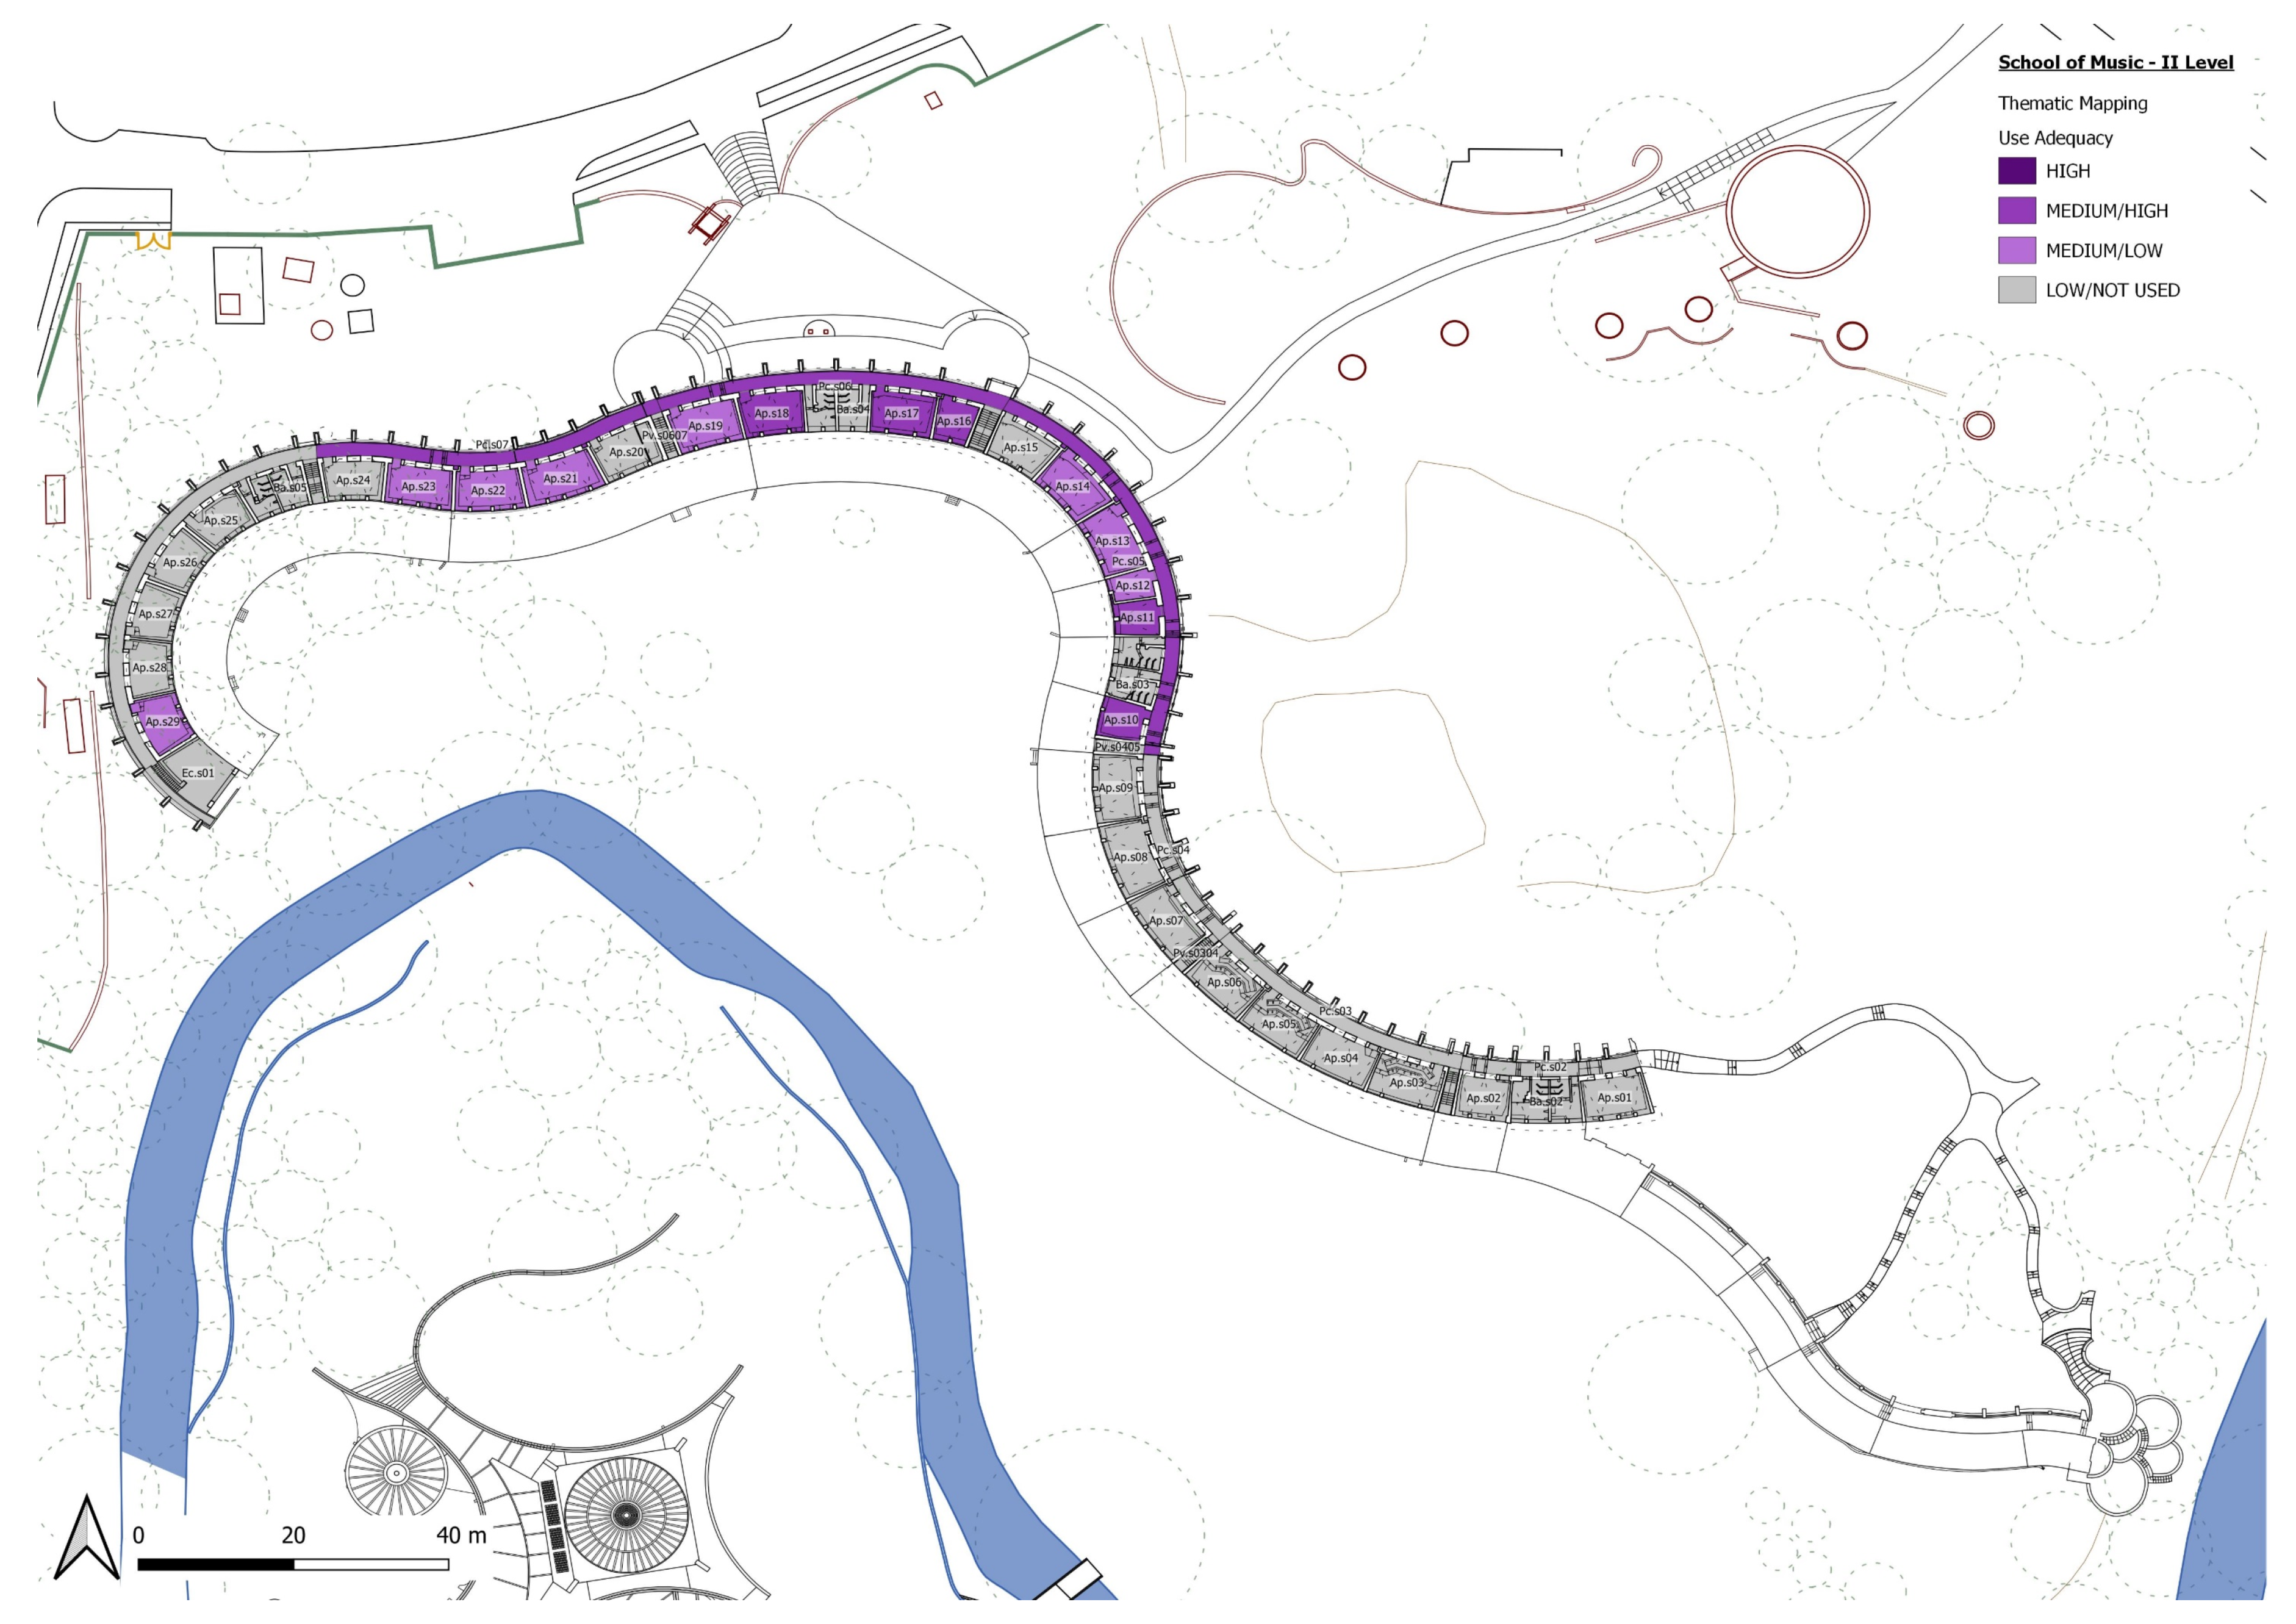
Table 4, and related the data directly to the maps and drawings. The information was inserted through multiple choice forced fields to maintain greater consistency in the descriptions and avoid mistakes due to manual data entry. The form entails specific and synthetic evaluations expressed with a score ranging from 1 (low) to 4 (high). The brief evaluations depend on the particular assessment and are automatically filled by the system but can always be modified to consider the assessed topics’ different weights. The single room data can be displayed in visual sheets (
Figure 9) to get the information at a glance.
2.5.6. Criteria for the Evaluation of Buildings and Spaces
The form described above undoubtedly incorporates a discretionary aspect. Therefore, it is liable to be affected by an expert point of view, which may not entirely represent the users’ point of view. The evaluation scores were assigned by applying strict criteria to reduce the risks deriving from an objective assessment’s impossibility. For each evaluation category, the scores were attributed as follows:
Absent or negative evaluation: 0 points;
Medium evaluation or condition: 0.5 point;
Positive evaluation or high level: 1 point.
In addition, the following criteria and points were attributed:
Morphology of the space and contribution to the overall composition: from 0 to 1 point;
Relevance of the function in the general layout: from 0 to 1 point;
Presence of characterising elements (e.g., domes, fixed furnishings), which cannot be modified without compromising the building’s overall quality: from 0 to 2 points.
The assessments refer to different aspects: the general state of conservation, intensity and adequacy of use, level of transformability and level of significance.
The state of conservation evaluation depends on the weighted sum of partial assessments, and specific evaluation criteria agreed with the Cuban partners (
Table 5).
It is essential to notice that the use-related analysis entails both the intensity of use and the actual uses’ consistency with the spaces’ peculiar characteristics. The intensity of use was evaluated as follow:
Low: for the spaces that are unused or closed;
Medium/Low: for the spaces that are used occasionally;
Medium/High: for the spaces that are continuously used by a few people or in defined time slots;
High: for spaces that are intensively used.
The consistency evaluation weights the match between current use and characteristics of the spaces. The score depends on the results of the interviews and the spontaneous behaviours observed. The consistency evaluation weights the intended uses’ feasibility without significant changes in the currently not used spaces. Iconic elements must not be modified, changed, or replaced because they are fundamental for the image and the schools’ architectural function. The synthetic evaluations are expressed with a variable score from 1 to 4, whose criteria are indicated to follow:
Low: unsuitable space.
Medium/Low: suitable space, unsuitable furniture, and plant system.
Medium/High: suitable space and furniture, unsuitable plant system.
High: suitable space, furniture, and plant system.
Finally, these assessments lead to an overall evaluation of the possible transformation rate that can be introduced without compromising the space’s specific value. That evaluation depends on the weighted sum of the previous assessments and is expressed in the following four scores:
Low: no changes are required or admitted.
Medium/Low: limited transformations are needed or different use without changes.
Medium/High: building works are required with or without a change of use.
High: significant intervention is required that affects the whole structure and entails substantial changes in the layout and function.
In the end, the significance evaluation prevails over the other assessments and determines the level of suitable change that can be deemed acceptable. When dealing with a low level of cultural significance, major transformations will be adequate, even if not motivated by strict functional or maintenance reasons but suggested by an overall functional reorganisation.
4. Discussion and Conclusions
The analysis completed and the system’s experimental application highlight three aspects of the research primarily related to the management process. Multi-disciplinarity and multi-scalarity is the first, as the ability to support different types of materials and scales of analysis to represent the various topics at a general or more detailed level in all the research fields. The overlap of these different thematic layers and levels of analysis is meant to overcome the challenge of describing a large complex that entails very different degrees of interest and requirements regarding conservation, refurbishment, reuse, and management. The tool is indeed conceived as a collector of all the data, documents, and other disciplinary contributions gathered or produced during the project. This aspect was fundamental in other contexts analysed, especially within the PlusCare system [
34]. In fact, the possibility of varying the level of detail or action allows the user to control the assets fully. This structuring has also brought the advantage of managing a considerable amount of data with adequate interoperability. This was crucial to match archive sources with the materials acquired during on-site inspections and, consequently, to implement targeted analyses. The system has also made it possible to filter the data through its organisation and its attribute forms, making them more homogeneous and comparable. This action facilitated the systematisation of the material, but above all, it likely increased the quality of information when performing a complex query.
The second point regards the reliability and ease of use to support the CMP’s drafting and the subsequent management phases. As said before, the tool collected the different data produced by the working groups (documents, maps, photographs, and information deriving from instrumental diagnostics) and many other systems [
31,
32,
34,
37]. The materials are recorded in specific forms and are linked as an attribute of each building or space. Such a designed tool allows the site managers to easily retrieve information that one can view directly on each floor plan. They can therefore highlight trends and priorities, unlike most management systems. Full interaction of data made objective and retraceable the process of analysis, evaluation, and planning even by providing a synoptic picture in drafting the schools’ CMP. One can consult all the categories, groups, and informative classes. It is also possible to vary the display parameters and overlay the available graphic outputs. The third aspect closely links to the ones mentioned above because the system should act as a unique workspace and common decision supporting tool for different stakeholders. This last aspect is common among GIS for Cultural Heritage [
37]. When the system is flexible to different levels of detail and is straightforward in its use, it provides greater strength and range to the actors.
The designed tool could be updated with the outcomes of the activities performed over time and the further studies’ data. The tool’s continuous update will lead to a better knowledge of opportunities and critical points and, therefore, to a review of the evaluation and a fine-tuned set of directions and maintenance schedules. The complexity of the system has led, on the other hand, to critical issues and limitations in the setting and development of the tools. The initial systematisation has undergone numerous changes in progress partly due to the Cuban partners’ difficult connectivity. Although the internet connection is widespread in Cuba, the lack of quality and speed has led to slowdowns in structuring activities and systems design. Only the meetings and on-site inspections allowed the working group to overcome these limits. Furthermore, the conspicuous and heterogeneous data amount was often difficult to use and interoperate by users with different backgrounds. The raw or semi-elaborated materials could not, in fact, be used immediately by the working group but had to be prepared or implemented. Some of these required very long calculation and processing times, not making the research phases coincide.
Many GISs designed to manage large heritage properties have highlighted structural criticalities [
31,
32]. The initial phase was often the most critical, which is where the system is straightforward and shared, but the tools have not yet been fully defined. This led to numerous refinements and updates that had repercussions on the projects’ progress [
20,
21,
23,
26,
37]. The interactions between data and products from different disciplines’ research also required numerous adjustments to allow for full interoperability.
Geographic Information Systems have proved to be fully applicable to different subject matters of the Heritage area. The GIS designed within the “Keeping It Modern” initiatives for the National Arts Schools of Cuba confirms this line by consolidating the experience in managing a large 20th-century architectural property. The potential expressed by this project and others previously exposed opens the positive use of this system with appropriate adaptations in intangible heritage and other sectors. Despite the difficulties encountered, the project involved different professionals with distinct backgrounds, skills, and working methods, and has benefited from the active cooperation with the local stakeholders. The sharing of goals and issues within the Cuban working group has been essential in the project, particularly defining the management tool and strategy. That teamwork has allowed the research group to understand the cultural significance of the National Schools from a “situated” perspective and get the critical issues, the needs but also the potential that wait to be developed for better use of the complex from the direct testimony of those who daily manage and use the spaces of the schools.


