Article

A Population Game Model for the Expansion of Airbnb in the City of Venice

by
Sophia Arbara
1,† and
Roberto D’Autilia
2,*,†
1
Dipartimento di Architettura, Università Roma Tre, 00184 Rome, Italy
2
Dipartimento di Matematica e Fisica, Università Roma Tre, 00146, Rome, Italy
*
Author to whom correspondence should be addressed.
These authors contributed equally to this work.
Sustainability 2021, 13(7), 3829; https://doi.org/10.3390/su13073829
Submission received: 20 January 2021 / Revised: 13 March 2021 / Accepted: 25 March 2021 / Published: 31 March 2021
(This article belongs to the Special Issue The Fourth Pillar: Culture in Sustainability)

Abstract

:
The emergence of Airbnb along with an increase in urban tourism has intensified the pressure on urban areas while adding a new dimension to the dynamics of housing distribution, especially in historic cities. These dynamics affect local economies and significantly alter the characteristics of urban spaces, hence the necessity to not only create policies that foster sustainable tourism development but also to advance urban models that explore the relation between Airbnb and the traditional rental and accommodation sector. Through the case of Venice, the present study sheds light on the potential evolution of Airbnb housing in comparison to the traditional rental and homeowner market. In particular, we sought to understand whether a potential equilibrium between these uses exists and if so, at which point in regard to this equilibrium the historic center of Venice is. To tackle this question, methods derived from the field of game theory and specifically evolutionary game theory were used. With the agents (players) being the housing units, the designed theoretical model explored the population dynamics of the housing units in Venice given the three options of homeownership or long-term renting (residential); short term renting or Airbnb (airbnb); and no use (vacant). The findings of our theoretical population game model were validated and discussed with a dataset describing the usage patterns in the city of Venice during the past 20 years. A verification of the outcome through further case studies could eventually provide insights into the future behavior of tourism’s pressure in historic urban areas.

1. Introduction

According to UNWTO, tourism is inherently linked to an urban area’s development [1]. Playing a key role in many cities’ agendas, tourism pressure is, in fact, capable of bringing new activities to cities, and reshaping their urban environments, particularly central areas of historic cities [2]. Additionally, albeit urban tourism represents a driving force in the development of many cities [1], the unregulated expansion of this industry during the past decades has given rise to several negative externalities [3] which reshape any city’s economic, social and spatial landscapes [3,4]. With overtourism principally occurring in urban areas [5], massive tourism flows put historic areas of cities at particularly great risk [6], resulting in crowding phenomena which test not only the resilience of the local housing market and the environmental assets but jeopardize the city’s heritage and the quality of life of its residents [7,8]. Amongst these urban areas, the historic centers of European Art Cities, which compose almost half of UNESCOs World Heritage Site list (https://whc.unesco.org/en/list/stat accessed on 30 March 2021), have been the epicenters of overtourism [9].
The aforementioned challenges of historic urban areas have been fueled by the emergence of new types of tourism accommodation offered by peer to peer home-sharing platforms which favor short stays and challenge the dynamics of the local housing markets [2]. By allowing owners of residential units to access the tourism accommodation sector [10], peer to peer accommodation platforms compete directly with the traditional rental market [11]. As a result, the numbers of long-term rentals in neighborhoods are reduced, changing the urban populations of highly affected areas, contributing to both overtourism and tourism-led gentrification processes [6,12,13]. The context of increasing pressure of overtourism in urban areas along with the international debate on assuring the cultural sustainability in cities demonstrate a growing demand for new, sustainable modes and policy agendas for tourism [8,14]. A recent literature review on overtourism [15] confirms the importance of measuring the impact of the tourism industry within the coming years and to study the intertwined relationship between sustainability and tourism development.
Thus arises the necessity to not only create policies that foster sustainable tourism development but also to advance models that explore the dynamics of the growing tourism sector and the impact on local communities [16], test the limits and carrying capacity [17,18,19] for sustainable tourism development and eventually predict its future evolution in urban spaces. Within this framework, this research focuses on understanding said dynamics by exploring the competition amongst the emergence in space of peer to peer accommodation rentals on one hand and the traditional rental and homeowner distribution on the other. A model is proposed to describe the tourism carrying capacities of urban areas to host peer to peer accommodation rentals and explore the potential existence of equilibria between housing units occupied by homeowners or long-term residents and temporary visitors. To do so, we exploit ideas and methods from the field of game theory, and in particular, population games and evolutionary dynamics [20].
Game theory has extensively been used to understand economic and biological systems [21,22], yet the literature in the field of urban management and planning is scarce, with the existing references focusing on the decision-making process amongst different actors in urban design [23]. In tourism studies, the concepts of carrying capacity and population dynamics have been explored in regard to tourism stakeholders and the interactions amongst tourist and resident populations [17,24], yet not through the lens of use patterns in historic urban areas and the expansion of Airbnb. Through a symmetric game given in normal form by a 3 × 3 payoff matrix, we explore the potential consequences of a population transforming their housing units to peer to peer accommodation platforms, or making them available for rent on a local rental platform (or ownership occupancy) or leaving them vacant, given the choices of the other players. It is important to stress at this point that while in evolutionary game models the agents range from biological organisms to economic institutions [25], in the given case the agents are the housing units per se. Additionally, as Airbnb is the leading marketplace of peer to peer accommodation for those seeking short-term housing options [26], the tourism pressure is measured in terms of houses transformed into Airbnb accommodation.
The proposed model focuses on three possible choices for each agent: to convert the housing unit into an Airbnb rental ( a ) , to either inhabit or rent it on the traditional rental market ( r ) or leave them vacant ( v ) . Options such as hotel accommodation and bed and breakfast are not taken under consideration. This is based on the hypothesis that Airbnb is an emerging sector that could follow the concept of disruptive innovation theory [11] and transform not only the tourism economy, but by sharing the same resources as the traditional rental market, it could significantly alter the attributes and qualities of urban space. The main goal of the article is to use a population game model to understand whether this new sector will reach a state of equilibrium (i.e., the carrying capacity in terms of urban payoff) or whether the expansion of the Airbnb sector will take over the other strategies, leading to drastic changes in the city’s socio-spatial profile.
To tackle these questions, a population game model is proposed [25] and discussed to understand if one or more Nash equilibrium states exist. If so, the current distribution pattern of housing units in the city of Venice is explored. Given a possible equilibrium, the question that follows is whether these could last over time without generating irreversible negative externalities for the area.
The case chosen for testing is the city of Venice, and particularly the historic center, the area most affected by the tourism industry. Venice was selected as the target of this study based on following two reasons; on one hand, the fact that it has been extensively impacted by the incoming number of visitors, showing an increased discrepancy between temporary visitors and residents’ socio-economic needs. On the other hand, the fact that it is concentrated in a limited geographical area makes it a particularly interesting and compact case study which can serve as a baseline for understanding urban tourism pressure in other cities [27].
The data for the city of Venice are self-explanatory: the residents registered during the year 2018–2019 in the historic city of Venice were 52,996 in number [28], a loss of 21.5% over the past 20 years [29]. At the same time, over the past 25 years, the number of visitor arrivals has increased 4-fold [30]. This was reflected in the housing accommodation sector, which showed impressive growth in tourism accommodation. The beds available escalated from 8249 in 2008 to 49,260 in 2019, showing a growth of 497% [27], with the emergence of the Airbnb rental accommodation platform playing an important role in this increase.
The main goal of this research is to understand the carrying capacity of a city (Venice) in hosting peer to peer accommodation platforms (Airbnb) by adopting the theoretical framework and methods of population games and evolutionary dynamics. Through the proposed urban population game the existence of one or more carrying capacities of the city (Nash equilibria) are identified. The carrying capacities are then compared with the empirical data, allowing us to understand how far the current distribution of uses in Venice is from reaching one of the maximum carrying capacity points—here, equilibria states. The proposed population game aims to introduce an urban model applicable in other cities where tourism is a core driver of socio-economic activity.
The paper is organized as follows; first, a brief introduction in regard to the concepts and methodology of evolutionary game theory is provided, and subsequently the specific characteristics of the urban population model for the city of Venice are described. In Section 2.3 the dataset used to elaborate the case study model is explained. In Section 3 the results of the urban model are analyzed and discussed in light of the dataset describing the use patterns in Venice during the past 20 years. Finally, we consider limitations and future prospects of game-theoretic approaches in urban planning.

2. Materials and Methods

2.1. The Evolutionary Game Theory

As introduced above, the article explores the possibility of exploiting the population game and the evolutionary dynamics approach in urban management and planning. In particular, a model based on the framework of evolutionary game theory is developed, a field of game theory that originated in biological contexts and has become of interest amongst a broader spectrum of social and economic sciences [31,32]. The choice derives from the fact that “evolution” is not limited to biological systems, but can be a powerful paradigm for understanding social systems [20] or complex systems such as the urban context. Moreover, evolutionary game theory has become an important tool for modeling the interactions amongst large populations of agents, where one individual agent is competing not against another individual agent, given the distribution of the strategies of the whole population [21].
Following the main results of population games and evolutionary dynamics [25], the theory is reinterpreted in urban terms by modeling the behavior of large stakeholders of strategically interacting agents who occasionally reevaluate their choices in light of current urban quality. The main difference from economic models of evolutionary games is that here the payoff of each strategy, and the urban quality, are not considered in mere economic terms, but are the results of synthetic elements which concern the morphological and environmental aspects of urban space, its intangible qualities (social and historic values) and the economic values of these.
The payoff is a quantity determined not only on the agent’s strategy, but it depends on the strategies chosen by the other agents. In other words, the game is between one agent and a population. In our case a housing unit (the agent) can adopt a strategy amongst “resident”, “vacant” and “airbnb” ( r , v , a ) , but the payoff of this decision depends on how the different strategies are distributed in the overall population. Once the sets of strategies and the payoffs of the agents are defined, we analyze the agents’ possible collective behaviors.
The dominant idea in game theory is the Nash equilibrium, a state in which no agent can change strategy without decreasing their payoff, and each currently selected strategy is the best response to the strategy of the other players [33,34]. In general, the Nash equilibrium is neither unique nor a Pareto optimum, and always exists for strategies played with a given probability (mixed strategies) [20].
While traditional game theory has been primarily occupied with identifying the equilibrium states, in evolutionary game theory with a large population of agents the focus is on the dynamics of the approach to equilibrium [35]. Nash proposed a “mass-action” interpretation of the equilibrium in 1949 [36], introducing for the fist time the concept of population games. This aspect, according to [37], remained unexplored for nearly 45 years.
In urban modeling, the need to switch from static models towards dynamic ones has often been stressed, and the population game approach can add to the exploration of dynamic urban models [23,38,39]. The decision to study a Word Heritage City through the point of view of population games derived from this necessity to generate models that would explore the carrying capacity of an urban area in a dynamic way [17,24,26]. Within such a dynamic framework, the concept of carrying capacity is not an absolute number but depends on the distribution of the strategies at any moment and the parameter of random choice. Neither it is necessarily unique, as the existence of more than one carrying capacity (equilibrium points) is possible. In the case of tourism-led gentrification, a dynamic evolutionary game approach where the housing units act as agents that choose amongst the three available strategies can become a useful way to understand the urban space’s reaction to pressing issues and obtain indicators for future scenarios.

2.2. The Urban Population Game

In order to describe the dynamic evolution of a system of agents in terms of a population game, it is necessary to have a large population and at the same time assume that the action of each individual agent has a very small impact on the distribution of strategies in the overall population. The participants in the game are in our case the proportions of inhabited, vacant and Airbnb housing units which form the total population of Venice’s units, here represented as x r ( t ) , x v ( t ) and x a ( t ) respectively. In general, these quantities tend to change over time, giving rise to state dynamics.
The state x ( t ) of the population of Venice’s housing units is therefore given by the distribution vector of the three possible uses of these units.
x ( t ) = x r ( t ) , x v ( t ) , x a ( t ) t [ t 0 , )
A population game is the set of functions that describe the temporal evolution of this state. In the given case these functions describe a housing unit’s transformation of use that adapts to the landscape generated by the distribution of other uses, and, unlike the “classic” formulation of game theory, they allow us to study the system far from the equilibrium. It is not known whether the pressure of Airbnb in Venice has reached a state of equilibrium or not, but we do know that understanding the dynamics beyond equilibrium is decisive from an urbanistic point of view, as it will allow us to design urban policy interventions which would shift the state of equilibrium.
The questions that can be answered by analyzing the population game are whether there are equilibrium states for our system based on the three urban uses ( r , v , a ) and what the current state of the city is in regard to these equilibria. This information is summarized by the vector field determined by the population game equations on the simplex
{ ( x r , x v , x a ) R 3 : x i 0 , i { r , v , a } , x r + x v + x a = 1 }
which represents the set of all possible states of the considered population.
Each agent has a finite strategy set S = ( r , v , a ) consisting of the following three options: renting the housing unit via the traditional rental market or leaving it available for homeowner accommodation (r); leaving it vacant (v); or renting it in the shared rental platform of Airbnb (a).
The payoff of an agent is given by the matrix
Π = π r r π r v π r a π v r π v v π v a π a r π a v π a a
where π i j is the payoff of the agent adopting the strategy i when the opponent plays j. The matrix Π represents a symmetrical game with two players and three strategies and describes the payoff of a strategy depending on the strategy chosen by its opponent. It is supposed that π j i is the payoff of the opponent so that the game is symmetric.
The payoff of a strategy depends on what other agents do, and every agent does not need to have a clear vision nor a global understanding of the game. In fact, it is assumed that an agent is chosen randomly from the population and plays with an opponent that is always chosen randomly as well. In other words, a housing unit decides to adopt a state ( r , v , a ) , but the payoff of its choice depends on how the states are distributed ( x r , x v , x a ) in the overall population.
The urban constraints of the matrix can be easily understood if we assume, according to Zeeman [40] that “the growth rate of those playing each strategy is proportional to the advantage of that strategy”, and therefore the prevalence of the strategy is the difference between the payoff from the strategy and the payoff of the population. An inhabited housing unit, being an important element in urban space, includes values from economic, social, environmental and intangible points of view [41]. For example, it might be economically convenient and feasible in the short term to rent all the houses over Airbnb yet not socially sustainable in the long term, as this would lead to museumization, putting at risk the viability of the city. The values of the elements of the matrix Π are therefore a balance between economic, social, environmental and intangible payoffs. It is important to mention that the current payoff matrix takes into account urban areas where tourism is considered to be one of the core activities of the city. If an agent is currently playing strategy i S and the opponent is also playing the same strategy, then it can be assumed that π r r = π v v = π a a = 0 , considering that when the agents are using the same strategy their behavior does not affect the evolution of the overall population. When the agent plays the strategy r against an agent playing v, the payoff π r v is positive because we assume that in a touristic urban area empty units stimulate the expansion of r, but if the opponent is a, then the π r a is negative, as in a touristic city where Airbnb is operating, the expansion of r is hindered and eventually decreased. As stated in [42], “While the total supply of housing is not affected by the entry of Airbnb, Airbnb listings increase the supply of short-term rental units and decrease the supplyof long-term rental units”.
If an agent adopts the strategy v and an opponent with strategy r, the payoff π v r is negative, but bigger than π r a . This is based on the assumption that the strategy of a population of Airbnbs compared an agent currently under residential use tends to take over residential uses in a more “aggressive” way than the residential uses tend to take over the vacant ones, hindering their expansion. However, if an agent is currently adopting the strategy v and the opponent chooses a, then the payoff π v a is again negative, but bigger than π v r and π r a .
π r a π v r π v a < 0
The hypothesis made here is that although use patterns of Airbnb would hinder the expansion of vacant units, it is less likely that a vacant unit would be directly transformed into an Airbnb, but more likely to shift to homeownership or a long-term rental before becoming an Airbnb. As per [18], it is more probable that Airbnbs will shift to long-term rentals than be sold as housing units, which could mean shifting to any of the three strategies. This is reflected in the payoff of our strategies, with π a r being the most “aggressive” one.
If the agent is playing a and the opponent plays r, π a r is negative, as in a population of r an expansion of Airbnb can be hindered, but if the opponent plays v the payoff is positive; in a touristic city, Airbnbs tend to expand when there are empty housing units. However, not with the same convenience that residential units will take over vacant ones. It is assumed that Airbnb units do not emerge in cities without services and vitality, but rather in places which provide a series of services and are characterized by vibrant public life.
Overall, the positive numbers on the matrix represent a strategy where it is convenient for the opponent to change its strategy and adopt that of the agent. Negative numbers, on the other hand, represent strategies where an agent benefits from changing its strategy and adopting the one of the opponent. The payoff of each couple of strategies refers to the advantage/growth rate obtained by adopting one of the three strategies given the current condition. For example, the advantage in urban space of having a unit inhabited by residents over a vacant one π r v is the most significant one, as social, economic and environmental value is being added by this move.
Since the agents are the housing units of Venice distributed in the three classes of strategies S = { r , v , a } and the total number of houses is large enough, x i 0 , with i S , can be considered in an equivalent way as the proportion of houses that adopts a given strategy or the probability that the strategy is adopted and therefore x r ( t ) + x v ( t ) + x a ( t ) = 1 for all t. If this point of view is considered, then, by making time dependence implicit for notational simplicity, the i strategy adopted by the population in the state x has the average payoff
Π i = j = r , v , a π i j x j = ( A x ) i i { r , v , a }
and if its average value is taken over all the strategies, the result is the average payoff of the entire population
Π ¯ = i = r , v , a ( A x ) i = x A x
If it is assumed that a strategy spreads proportionally to its convenience Π i Π ¯ , the replication equation can be written [43]
d x i d t ( t ) = x i ( t ) Π i Π ¯ = x i ( t ) ( A x ) i ( t ) x ( t ) A x ( t ) i S = { r , v , a }
which describes the evolution over time of the state of the population.
In other words, Equation (7) describes the distributions of the three uses (residential, vacant, Airbnb) in the overall population during a given time period. The difference between the average payoff of all housing units adopting strategy i and the global payoff of all the city’s housing units is indicative of the expansion or decrease of strategy i. If this difference is positive, meaning that the average payoff of the housing units adopting strategy i is greater to the average of the overall population, the corresponding population of housing units will tend to increase, while in the opposite case (negative difference) a decrease will happen. The points where the two trends converge and are in equilibrium indicate distributions of strategies that correspond to carrying capacities.
Therefore, it can be assumed that the dynamics of this distribution are determined by the social and economic dynamics defined by the behavior of the inhabitants. This dynamic is complex and is conditioned by individual choices, local needs, irrationality or chance, but the result is only the change in the use of housing, which in our model is a kind of revision protocol [25]. If we assume this point of view, we can adopt the theoretical framework of population games in which the interaction between agents is repeated over and over again. Thus, unlike game theory, which is focused on determining the possible Nash equilibria, the dynamics of the three populations can be studied ( r , v , a ) in the configurational landscape determined by these equilibria.
Finally, the research introduces a coefficient of randomness μ [ 0 , 1 ] which represents the probability that an agent will choose his strategy randomly.
Equation (7) then becomes [25,44]
d x i d t ( t ) = ( 1 μ ) x i ( t ) Π i Π ¯ = x i ( t ) ( A x ) i ( t ) x ( t ) A x ( t ) μ 1 3 x i ( t ) i S = { r , v , a }
so that we have dynamics simultaneously determined by the maximization of a payoff and by random elements. Equation (8) is almost identical to the former one (7), with the only substantial difference being that the probability of the agents choosing the same randomly is introduced. The assumption is made that agents can decide to change their strategies independent of what is more convenient and maximizes payoff, but choices are dependent on external, unanticipated choices that the individuals make. The model explored below demonstrates that this factor of randomness is determinant in defining the carrying capacities of a city. The solutions of this system of differential equations describe the possible behaviors of the city, and as demonstrated, the probability μ of choosing a random strategy is a control element for the possible states of equilibrium of the system and the Airbnb carrying capacity of the city.

2.3. The Venice Data
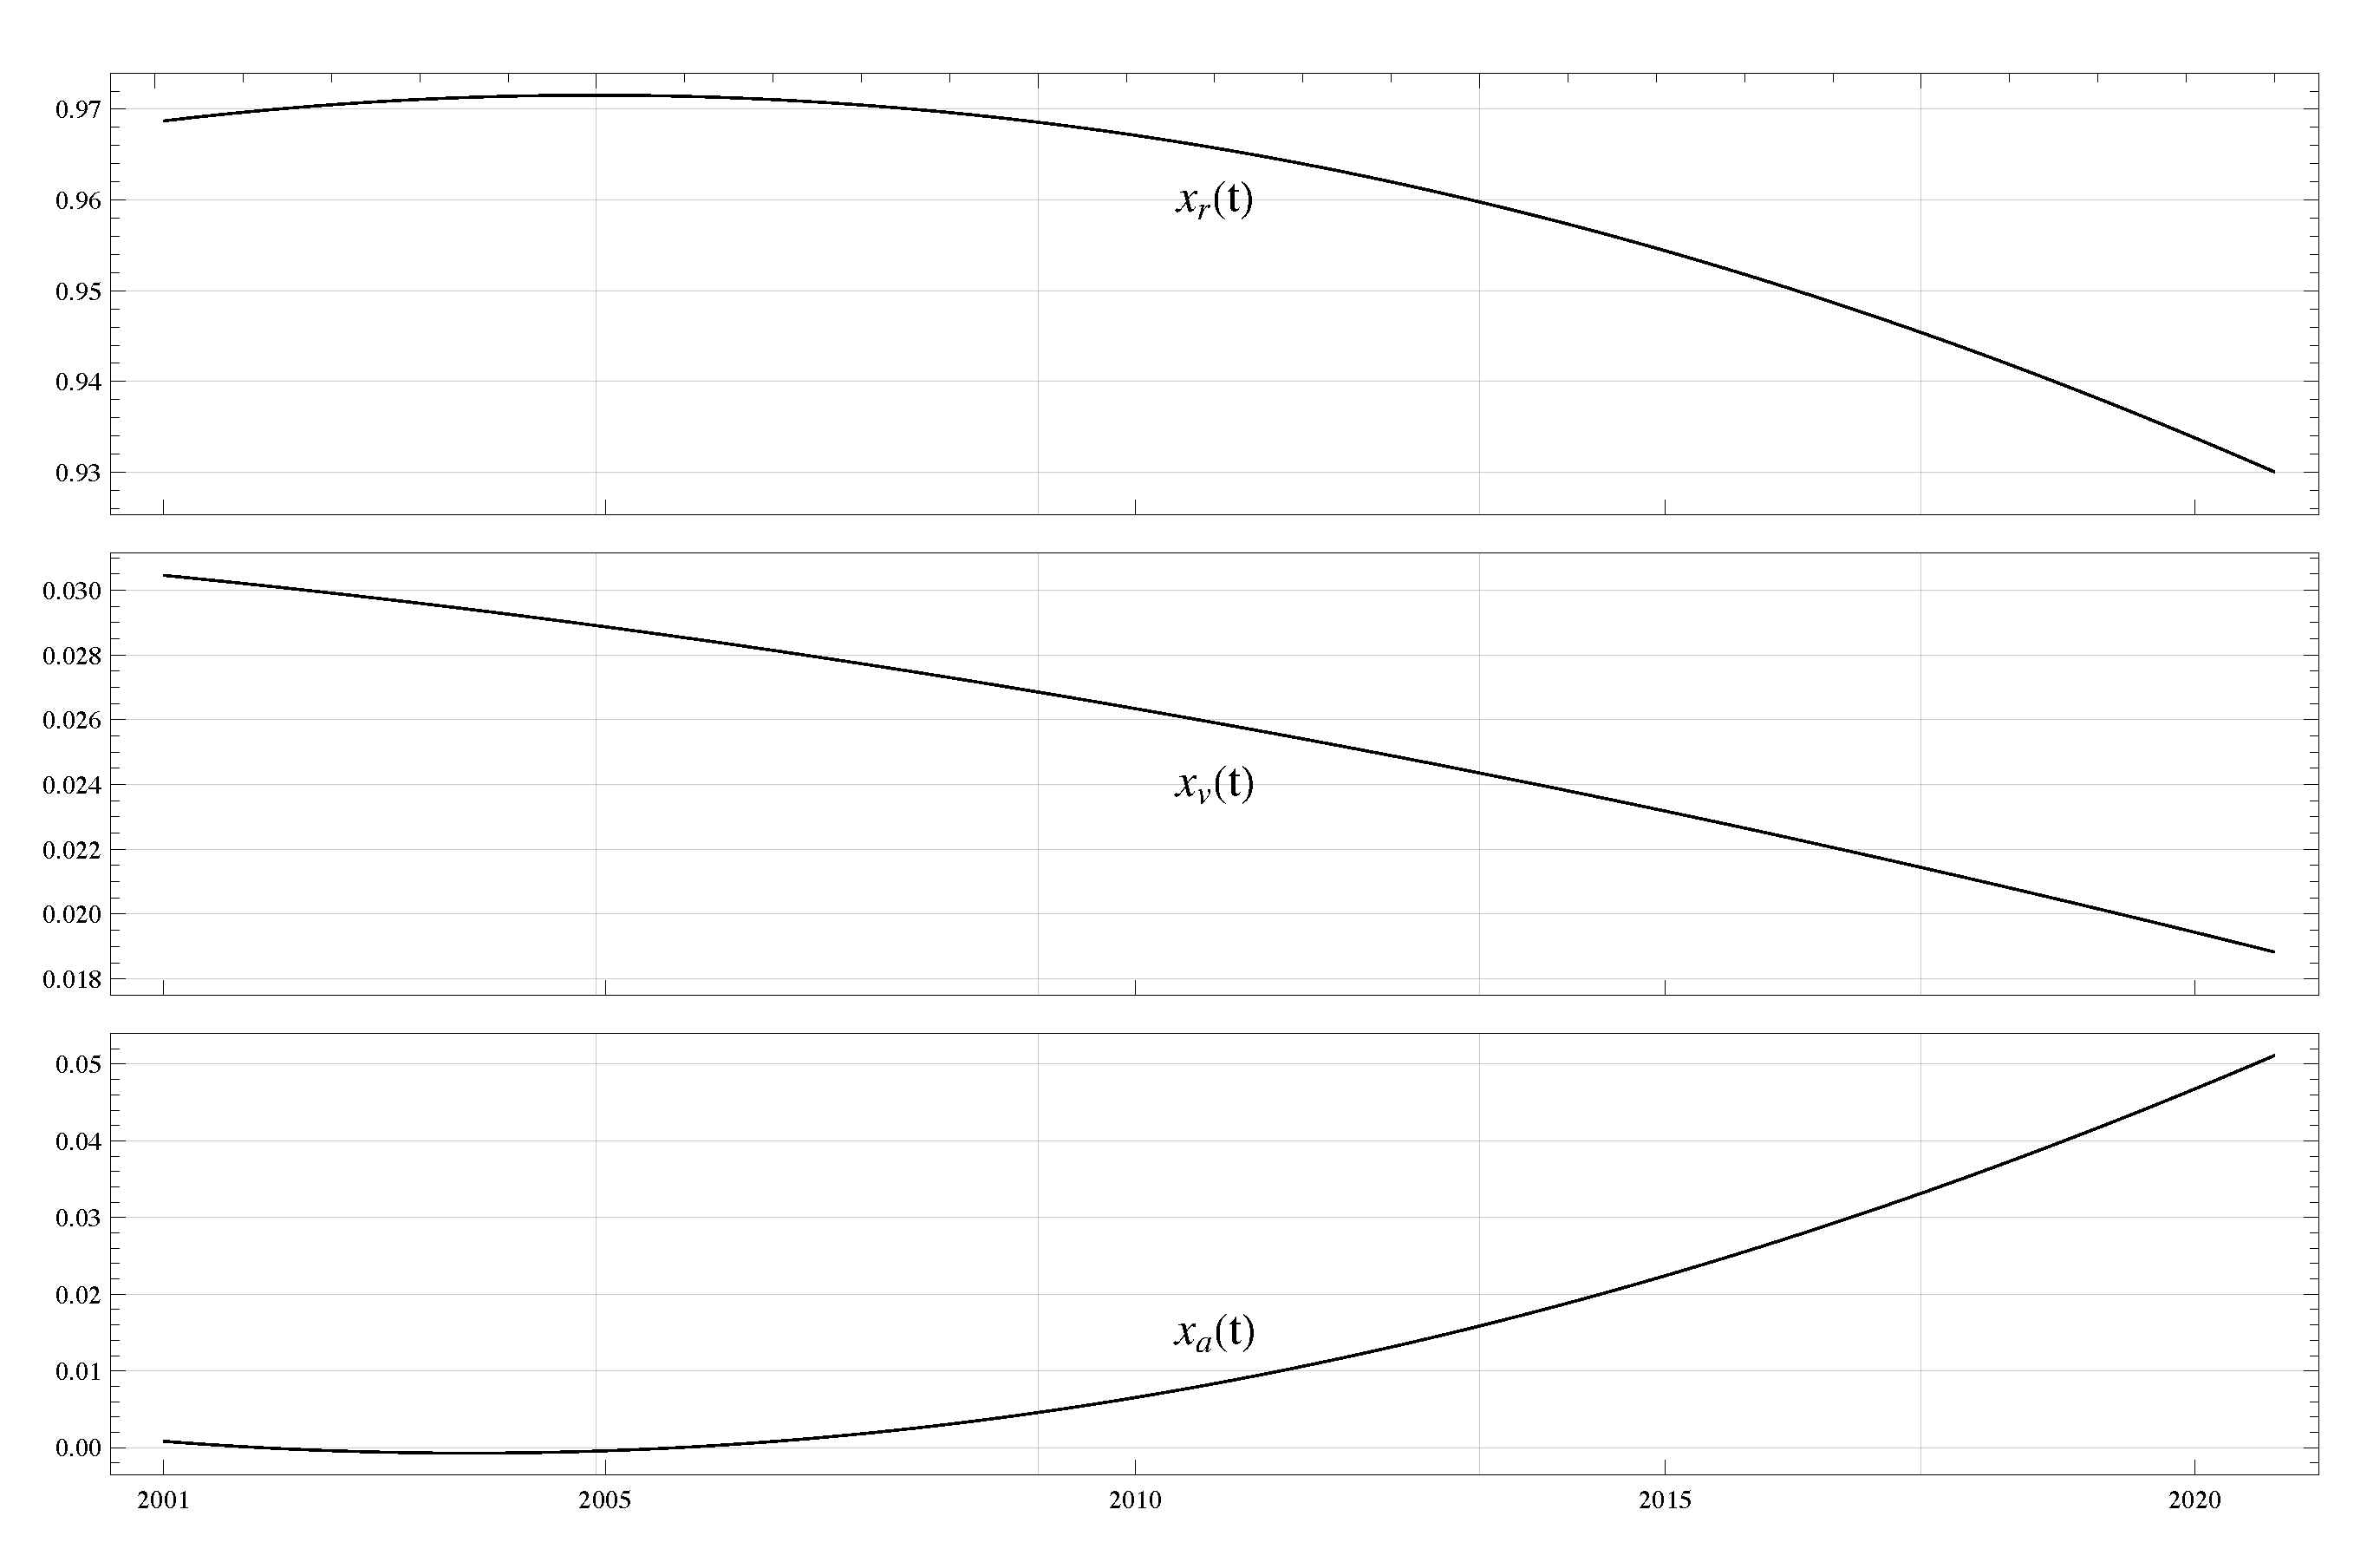
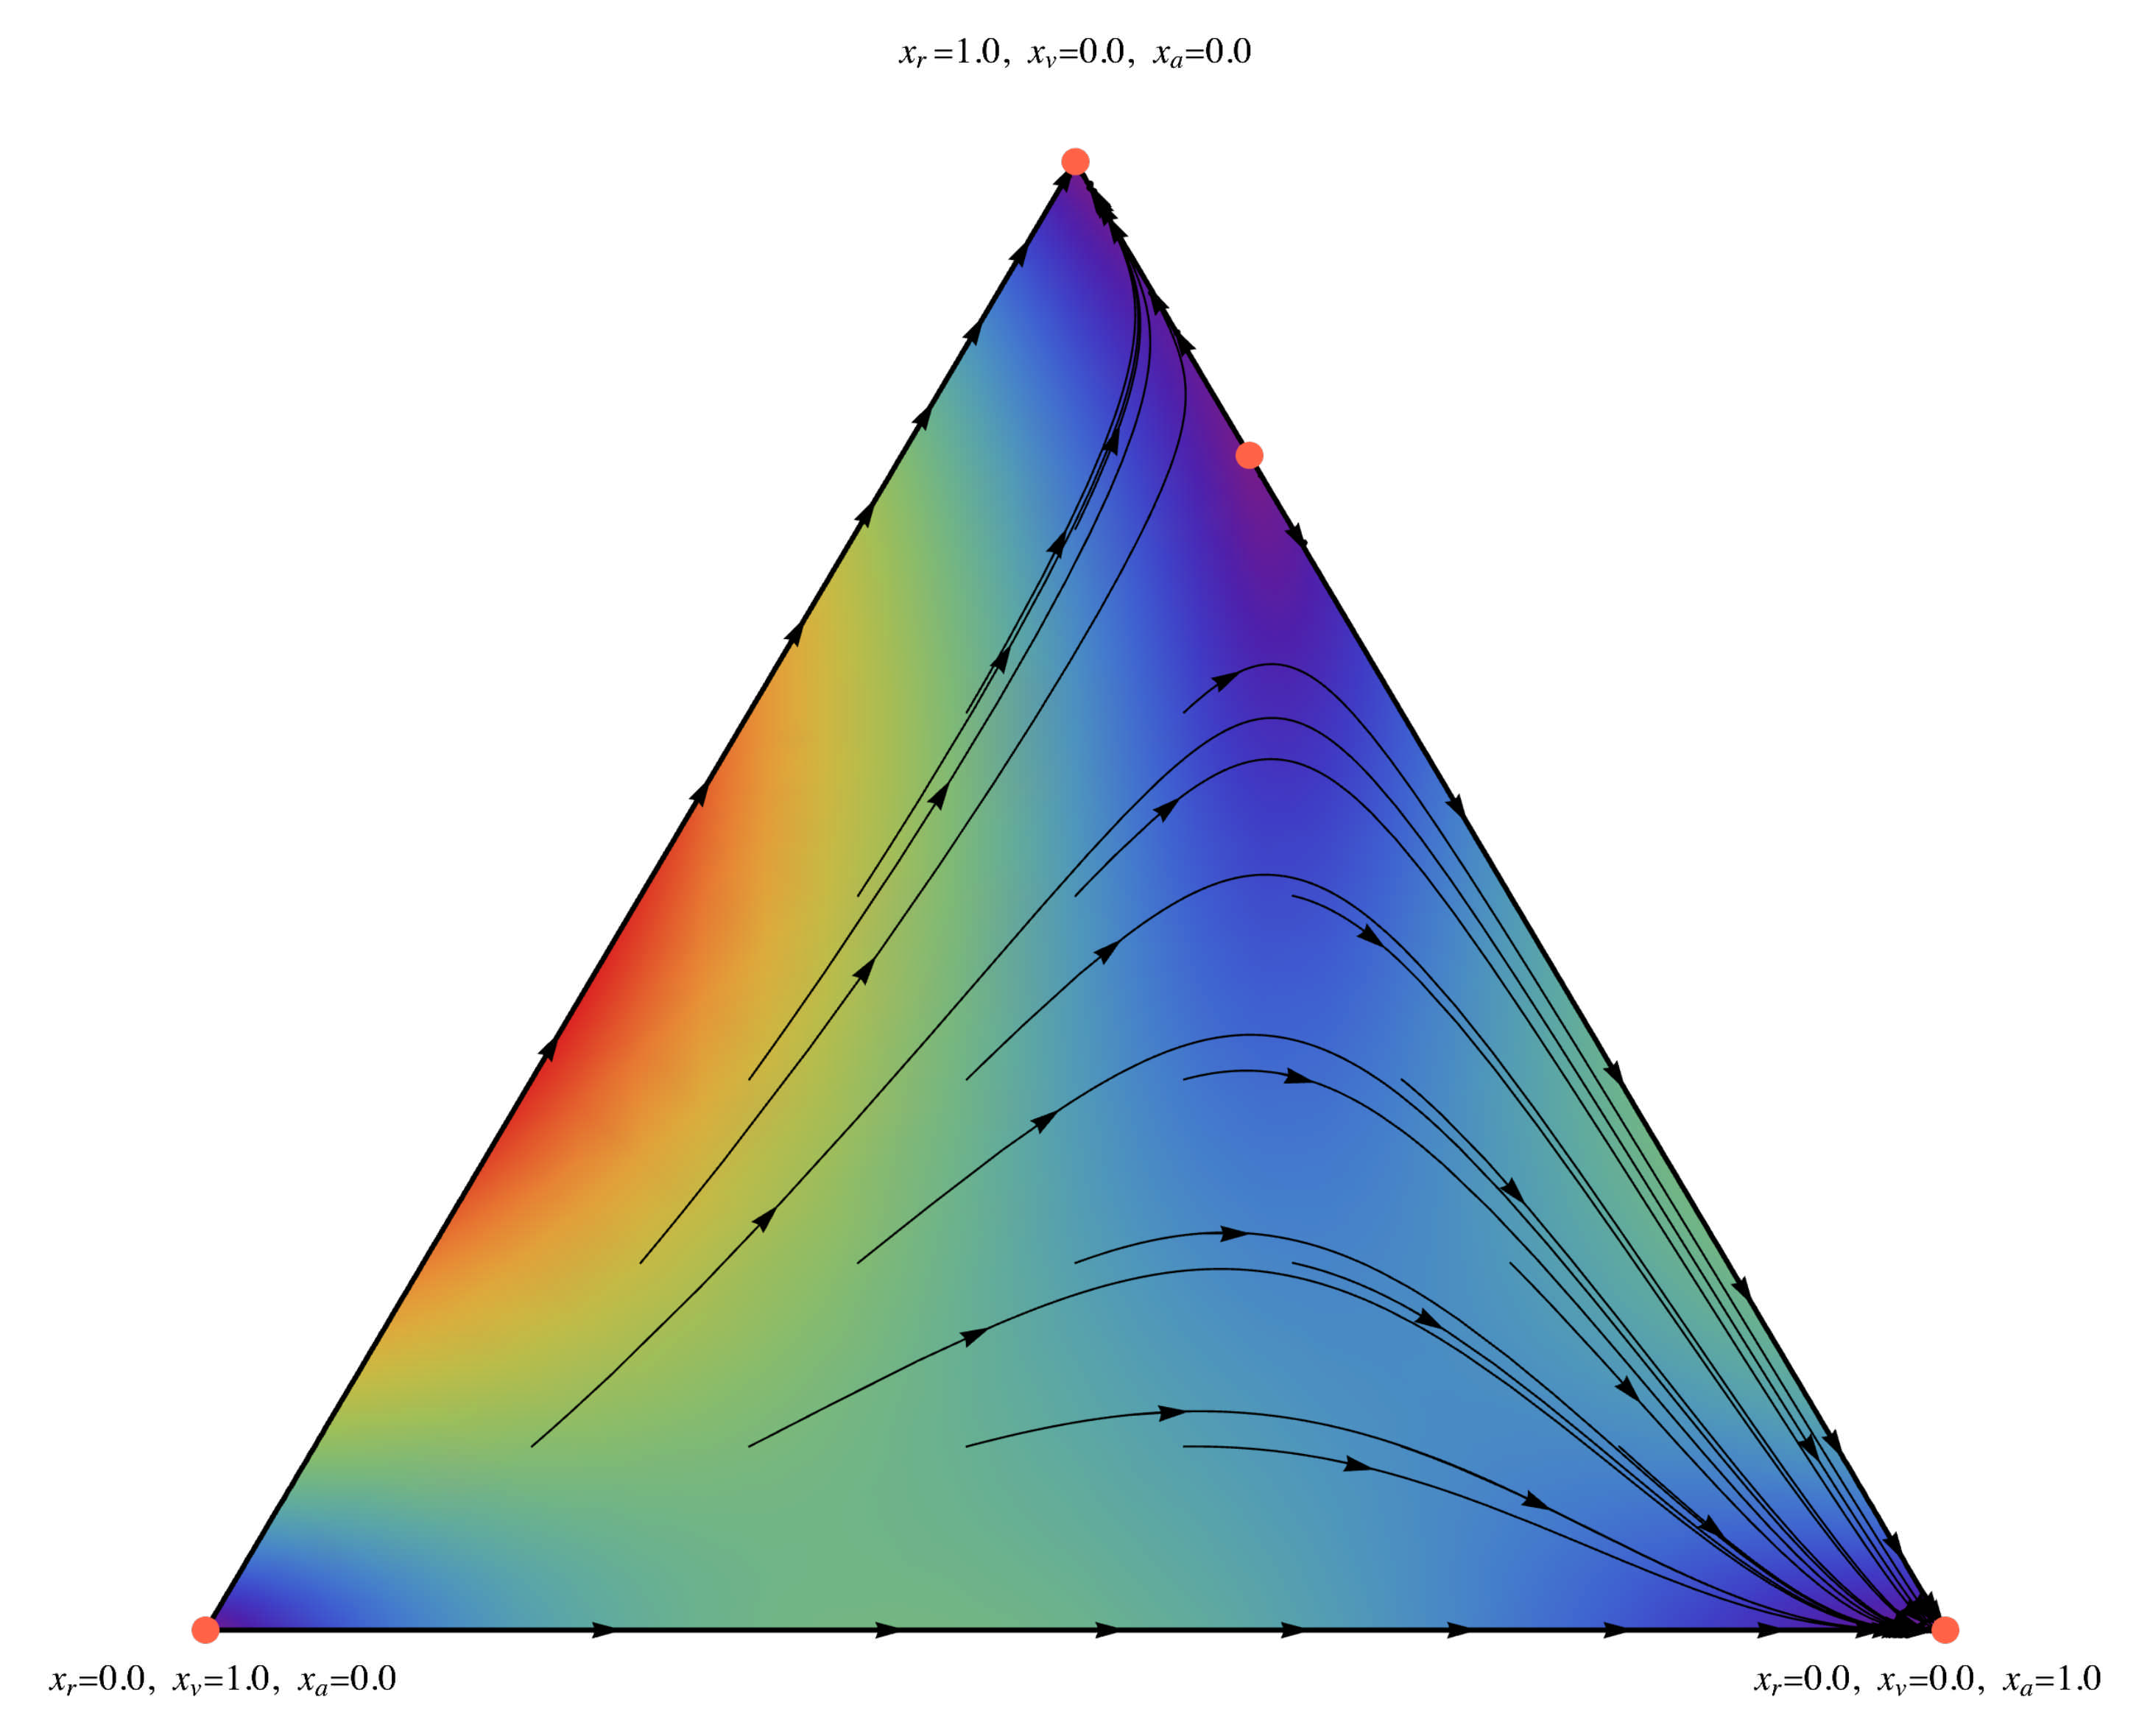
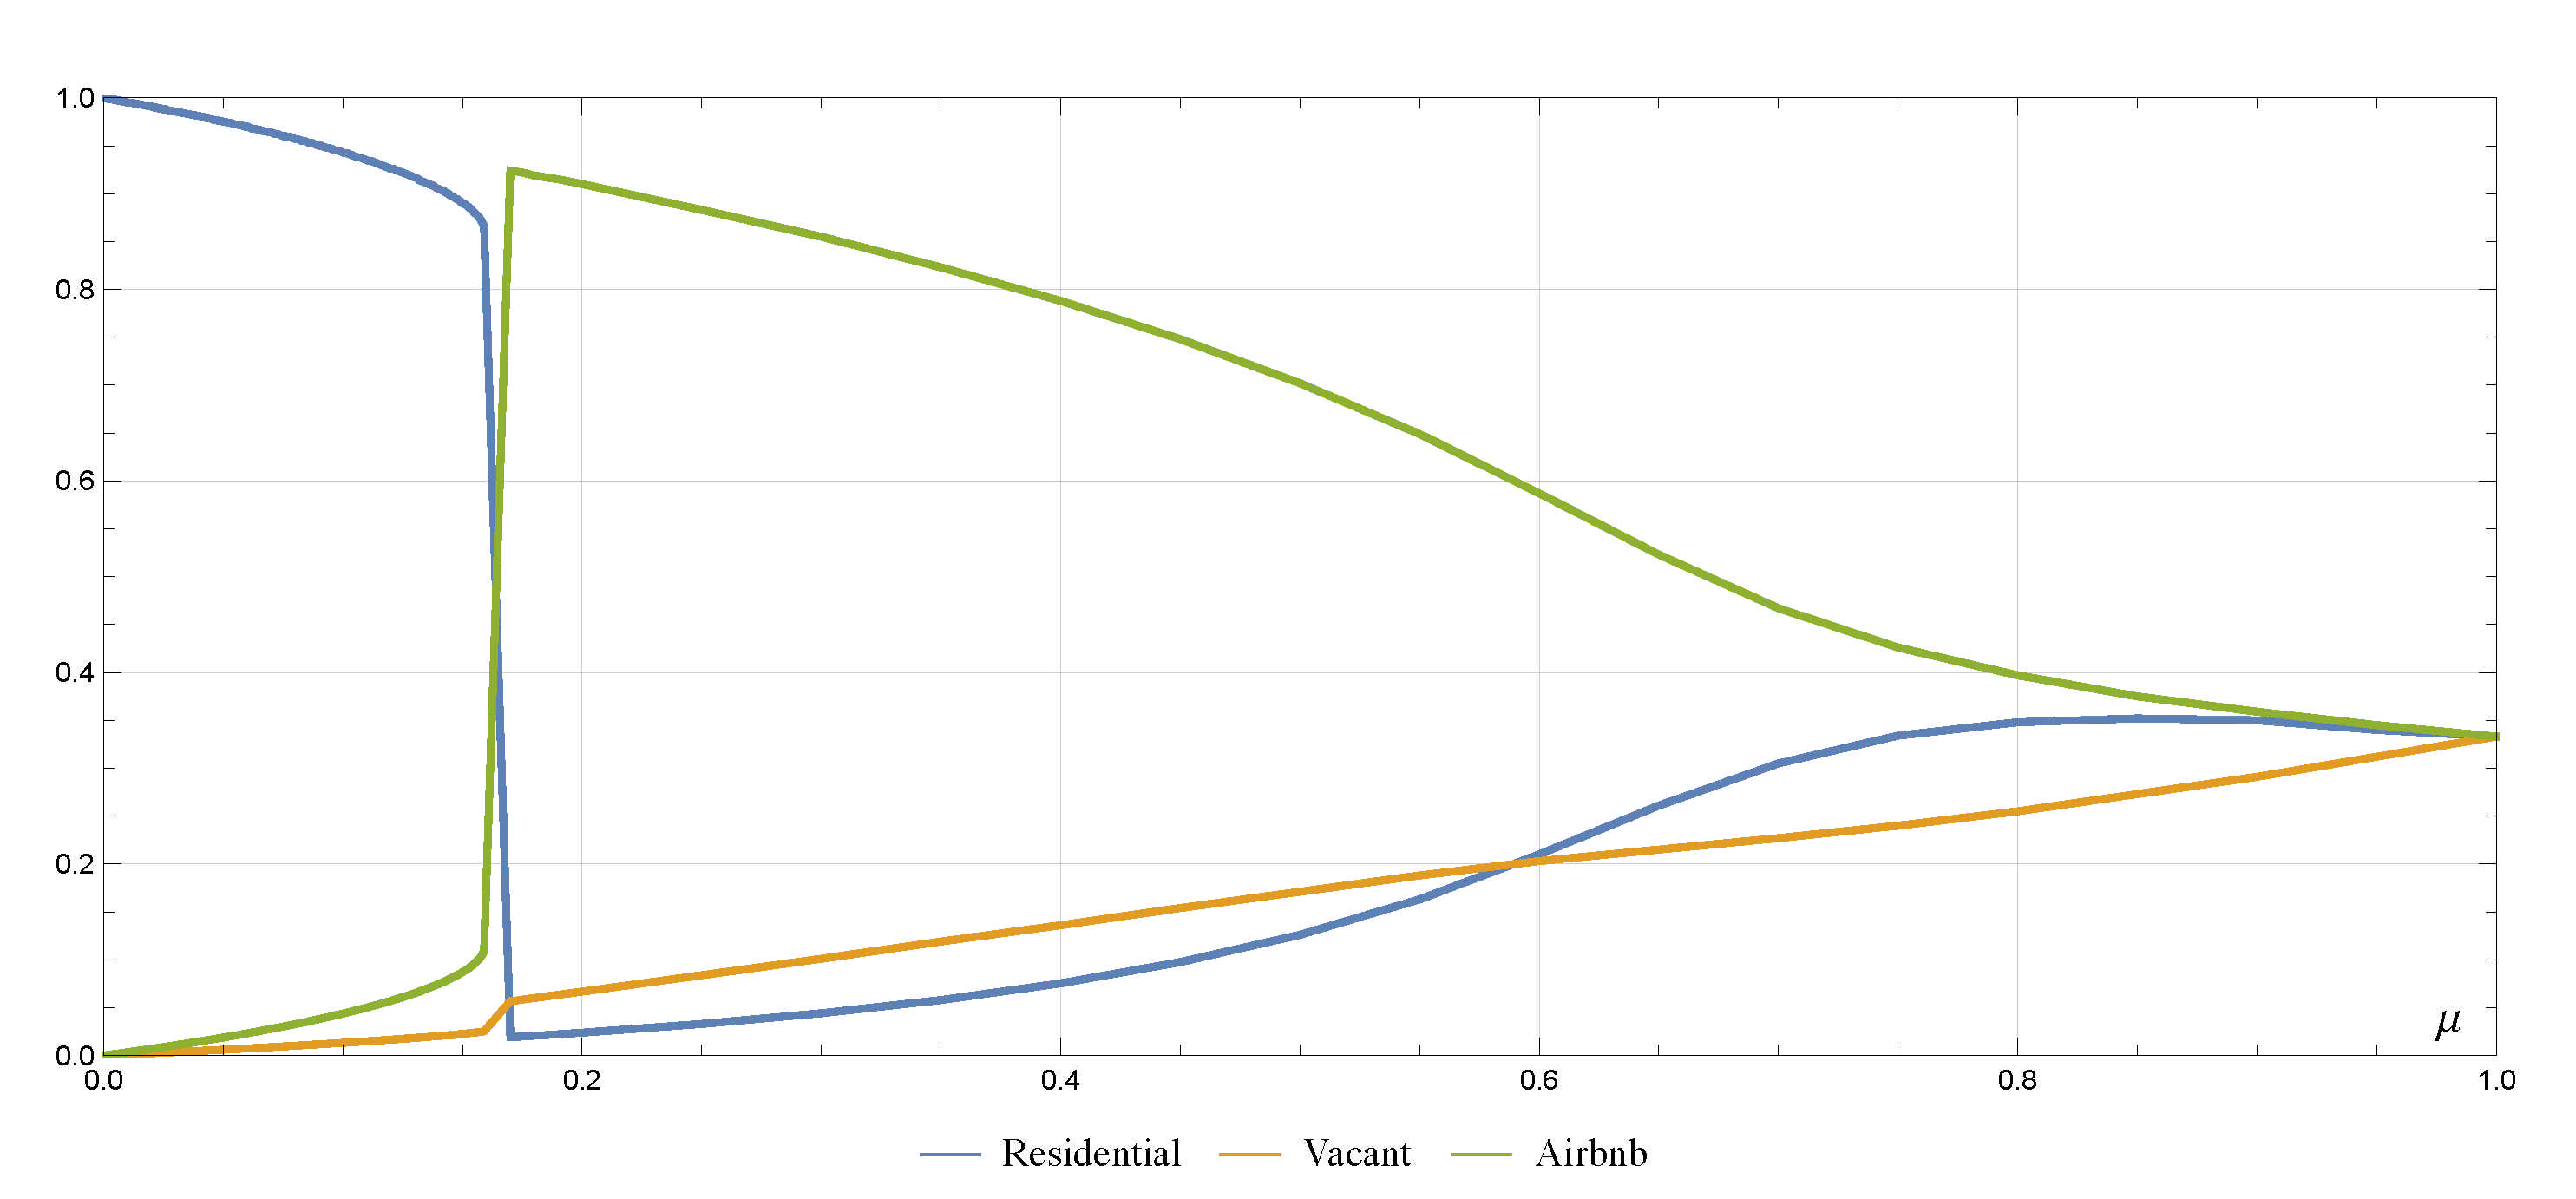
The dataset considered in our analysis focuses on the timeframe of the past 20 years. This makes it possible to observe the impacts and evolution pattern of the Airbnb shared accommodation in the city of Venice as the platform started operating only after 2008 [45]. In order to study the model and the population’s selections in regard to the three strategies ( r , v , a ) , the number r u of housing units inhabited by residents (homeowners or tenants), the vacant housing units v u and the housing units rented over the Airbnb platform a u should be measured. The number N u represents the non-vacant housing units, which include units occupied by both residents r u and Airbnb tenants a u .
T u refers to the total number of available housing units in the historic center of Venice:
T u = r u + v u + a u
The non-vacant housing units N u is the sum of residentially occupied ones and Airbnb ones N u = a u + r u so that we have
T u v u = N u = a u + r u
Data from two sources were used to estimate the populations of agents choosing among the three different strategies for the time period 2001–2020. The datasets regarding the total available housing units T u and the vacant units v u were obtained from the independent research studio “Scenari Immobiliari” for the years 2001, 2010 and 2019 (https://www.scenari-immobiliari.it accessed on 30 March 2021). For the units rented over the platform of Airbnb a u , the data for each area were obtained from the independent online platform “Inside Airbnb” (http://insideairbnb.com accessed on 30 March 2021) available for the city of Venice from 2015 and onwards.
The initial datasets provided partial information for the period 2001–2020 to measure the behavior of agents choosing one of the three main strategies ( r , v , a ) . In order to estimate the missing data for each month of these years, the datasets of the vacant housing units v u , the Airbnb a u and the total available housing units T u were interpolated by means of polynomial functions. The polynomial interpolation for the Airbnb data from 2015 allowed us to complete the curve of the missing data between 2008 and 2015; before 2008, only the other two strategies existed, as Airbnb emerged only after 2008 in Venice.
Based on the known and estimated data, the non-vacant units N u = T u v u and the residential ones r u = N u a u were computed. Once we completed the dataset, the normalized data x r , x v and x a for the whole historic center for each month, i.e., the proportions of the city’s population playing the strategies, i S , were computed.
The normalization process made it possible to, on one hand, bring all the values on a common scale, and on the other, obtain the distribution of the population’s subgroups according to the three strategies over time as shown in Figure 1 below.
When elaborating the data, the following assumption was made: the housing units offering a room and not an entire unit over Airbnb were calculated under the Airbnb category a u and not under the category of residential units r u . This assumption was made on the basis of “testing” the scenario where a maximum number of Airbnb rentals is considered. If a housing unit appeared more than once in Airbnb, meaning that the owner would rent the rooms into different visitors, these duplicates were removed. That way every housing unit in Airbnb appeared only once in our dataset, independent of the various rooms that might be available to different groups of visitors.

3. Results

Equation (8) determines the time evolution of the urban state vector x ( t ) . The dynamics we used was replication dynamics, which is a sort of “survival of the fittest” [43,46]. Replication dynamics does not allow for new strategies to emerge. However, in the given case, a strategy appeared for the first time in 2008. Therefore, it can be assumed that the replication dynamic is valid from 2008 and onward, when analyzing how the a strategy invaded the population previously formed only by r and v.
A possible form of the payoff matrix (3) is given by
Π = 0 6 4 3 0 1 1 3 0
which is a modified version of Zeeman’s game, introduced to prove the existence of equilibria which are not evolutionarily stable strategies [40] and belong to a class of models studied in biology in order to model collective behaviors ranging from prebiotic evolution to animal behavior. The numeric values are only indicative because the matrix represents a whole class of games [20]. An agent playing one of the three strategies ( r , v , a ) is being matched with a population of agents playing strategies with distribution ( x r , x v , x a ) .
The dynamics of Airbnbs in Venice seem to be well described by this class of models, as can be observed below. Based on the interactions amongst the agent and the population and the probability of random choice, the agents are able to reevaluate their strategy. To test the evolutionary game model, the notebook EvoDyn-3s, designed to analyze the dynamics and equilibria of 3 × 3 matrix games, was used [44].

3.1. The Case μ = 0 .

When μ = 0 the system has four equilibrium states, three pure states composed of only residents, vacant or Airbnb (the three vertices of the triangle in Figure 2), and a non-stable one, consisting of 80% of resident homes and 20% of Airbnbs. The equilibrium represented by x v = 1 is not stable and the state of the “empty” city tends to move towards a city of residents or Airbnbs.
The two states x r = 1 and x a = 1 are the only two equilibria based on which the urban dynamics can converge, because the point ( 0.8 , 0.0 , 0.2 ) of Figure 2 is non-stable. This means that replication dynamics with the payoff matrix given by (11) can only lead to a city of residents or Airbnb. This is the general landscape from which one can move by increasing the value of μ , that is, introducing the factor of randomness in the choice of the housing unit’s use.

3.2. The Case μ 0 .

Starting from μ = 0 , the value of μ is progressively increased until obtaining the minimum distance between the theoretical curves and the data. The meaning of μ is that behind the dynamics of the strategies ( r , v , a ) there is a complex social and urban dynamic that can give rise to non-rational, or at least non-optimal behaviors.
We found that for μ = 0.154 , the solution starting on the segment r v with initial condition ( x r ( t 0 ) = 0.971 , x v ( t 0 ) = 0.029 , x a ( t 0 ) = 0.0 ) minimizes the total variation distance [47] between the theoretical curve and the data, with mean 0.005 and variance 4.3 × 10 6 . These dynamics, represented in Figure 3, correspond to the 15.4% of the population choosing a random strategy, or rather a strategy determined by aspects extraneous to the dynamics of the population game.
This dynamic shows the three equilibrium points reported in the Table 1 together with the corresponding eigenvalues.
The point ( x r = 0.839 , x v = 0.0259 , x a = 0.135 ) has the second eigenvalue with a positive real part, and it is not stable. The closest theoretical equilibrium to the state of the population in 2020, which is x 2020 = ( x r = 0.935 , x v = 0.018 , x a = 0.045 ) , is the point ( x r = 0.883 , x v = 0.0236 , x a = 0.0938 ) . Therefore it seems that, in this model, the state of the housing units in Venice is converging towards an equilibrium where almost 10% of the houses will be transformed into Airbnb and 2.3% will be uninhabited, as can be seen in Figure 4, which is an enlargement of Figure 3. A further equilibrium is at the state ( x r = 0.0167 , x v = 0.0512 , x a = 0.932 ) which corresponds to the city being transformed almost entirely into Airbnb.
The stationary points establish the topology of the space in which the population x evolves, but the trajectories in this space are also the objects of urban interest.
The equilibrium points depend on μ . If μ [ 0.0 , 0.16 ) , the system has two stable equilibria, separated by a non-stable which gradually approaches the upper stable one as μ increases. When μ = 0.16 the system collapses and the only equilibrium given by the point ( x r = 0.0176 , x v = 0.0532 , x a = 0.929 ) is a city made up of almost only Airbnbs where residents nearly disappear. By increasing the value of μ , this unique equilibrium moves towards the center of the symplex, and with μ = 1 , the strategies become entirely random and the system has a unique equilibrium state ( 0.333 , 0.333 , 0.333 ) . The upper equilibrium state x ¯ ( μ ) as a function of μ is plotted in Figure 5 where the collapse of the state x r for μ = 0.16 is evident.
These equilibria can be interpreted as the tourism carrying capacity of the city, i.e., the number of Airbnbs that Venice can sustain given μ and the payoff (11). In this framework, if the payoffs of the matrix Π represent a balance between costs and benefits in terms of quality of life and economics, then if μ < 0.16 the city can “contain” the expansion of Airbnb.
The parameter of random choice μ could be controlled by an urban planning policy that reduces the randomness rate in strategic choices. This means that although random choice is based on individual conditions and can lead to non-optimal choices, urban policies and recommendations that “stabilize” the quality of life of the inhabitants of Venice could reduce the value of μ below critical points and consequently alleviate tourism pressure. It might thus not be necessary to impede such activities in urban areas but to provide incentives that would both support local inhabitants and find ways to mantain the factor of uncertainty below μ < 0.16 , mitigating phenomena such as the uncontrolled expansion of Airbnb.
In conclusion, the empirical data overlap with our theoretical model well, and seem to converge towards an equilibrium point where Airbnb usage will increase approximately twofold, going from the current 4.5% of housing units to an occupation rate of 9.38%. This will be the case only if the parameter of random choice μ remains below the critical point of nearly 16%. However, in times of increased uncertainty fueled by the ongoing Covid-19 pandemic, it becomes even more challenging to predict how the random choice parameter μ will be affected. Thus, the risk of Venice turning into a city composed almost entirely of Airbnbs still exists, as the equilibrium point could shift from the closest one described before to the one where Airbnbs take over 93.2% of the housing units. This means that there is not one absolute number which indicates the carrying capacity for the city, but more than one equilibrium point which depend on the distribution of the strategies among the overall population and the level of random choice.

4. Conclusions

The main purpose of this work was to explore the possibility of using some of the ideas of population dynamics and game theory to model the urban dynamics in regard to the Airbnb pressure. Using the houses as agents, it is possible to determine a dynamic that reproduces the qualitative behavior of the real data and offers an overall picture of the possible states of equilibrium.
The model remains rather abstract and cannot be considered realistic in the sense that the μ parameter of random choice should be calculated through a much more detailed dataset than the one we had the opportunity to examine. However, the theoretical implications of this simple model are important, as they represent possible consequences of a competitive mechanism in urban dynamics that takes into account not only the economic value of the housing units but also their urban use.
In order to further explore its capacity, the proposed class of models could be compared with the dynamics of other cities of tourist interest to verify whether it captures the essential characteristics of tourism pressure in urban space. Furthermore, the model can be extended to include other forms of tourism pressure, such as the purchasing of houses by the non-resident population, although this would require a very detailed dataset.
An analysis regarding the kind of stability of the equilibrium points, which involves the use of techniques deriving from the theory of differential equations, goes beyond the scope of this work; so does the possibility of an evolutionarily stable strategy that can be introduced in urban planning.
These could become subjects for future exploration along with the possibility of a correlated game, according to which external policy interventions such as possible incentives for residents, could modify the equilibrium points of the system by reducing the parameter of random choice μ . Major touristic cities such as Barcelona, Amsterdam and San Francisco have already taken measures to contain the unregulated expansion of Airbnb with policies ranging from permit requirements to limited rental periods and the introduction of rental taxes [10]. Furthermore, functional forms for the payoff values which make explicit the possibly non-linear functional relationships between the economic aspects and the urban payoff are subjects to be explored. Finally, the possibility of having more detailed and exhaustive datasets regarding the use of the housing units could allow us to compare the present model with the urban dynamics of other touristic cities.

Author Contributions

Conceptualization: S.A. and R.D.; data curation: S.A.; investigation: S.A. and R.D.; methodology: S.A. and R.D.; software: R.D.; visualization: S.A. and R.D.; writing—review and editing: S.A. and R.D. All authors have read and agreed to the published version of the manuscript.

Funding

This research was partially supported by the European Union’s Horizon 2020 research and innovation programme HERILAND (Marie Sklodowska-Curie grant agreement number 813883).

Institutional Review Board Statement

Not applicable.

Informed Consent Statement

Not applicable.

Data Availability Statement

The Airbnb datasets are available on the website http://insideairbnb.com (accessed on 30 March 2021). The datasets containing information about vacant and occupied housing units are available upon request through the website https://www.scenari-immobiliari.it (accessed on 30 March 2021).

Acknowledgments

The authors would like to thank Chiara Mocenni and Tinatin Meparishvili for their insightful comments and feedback. Additionally, we thank Paolo Desideri and Mario Breglia for kindly providing us with the necessary quantitative information to carry out this study.

Conflicts of Interest

The authors declare no conflict of interest.

References

  1. UNWTO United Nations World Tourism Organization. Available online: https://www.unwto.org (accessed on 30 March 2021).
  2. Gutiérrez, J.; García-Palomares, J.C.; Romanillos, G.; Salas-Olmedo, M.H. The eruption of Airbnb in tourist cities: Comparing spatial patterns of hotels and peer-to-peer accommodation in Barcelona. Tour. Manag. 2017, 62, 278–291. [Google Scholar] [CrossRef] [Green Version]
  3. Pasquinelli, C.; Trunfio, M. Overtouristified cities: An online news media narrative analysis. J. Sustain. Tour. 2020, 28, 1805–1824. [Google Scholar] [CrossRef]
  4. Poczta, J.; Dąbrowska, A.; Kazimierczak, M.; Gravelle, F.; Malchrowicz-Mośko, E. Overtourism and Medium Scale Sporting Events Organisations—The Perception of Negative Externalities by Host Residents. Sustainability 2020, 12, 2827. [Google Scholar] [CrossRef] [Green Version]
  5. Fedyk, W.; Sołtysik, M.; Olearnik, J.; Barwicka, K.; Mucha, A. How Overtourism Threatens Large Urban Areas: A Case Study of the City of Wrocław, Poland. Sustainability 2020, 12, 1783. [Google Scholar] [CrossRef] [Green Version]
  6. De la Calle-Vaquero, M.; García-hernández, M.; de Miguel, S.M. Urban planning regulations for tourism in the context of overtourism. Applications in historic centres. Sustainability 2021, 13, 70. [Google Scholar] [CrossRef]
  7. Van der Borg, J.; Costa, P.; Gotti, G. Tourism in European heritage cities. Ann. Tour. Res. 1996, 23, 306–321. [Google Scholar] [CrossRef]
  8. Neuts, B.; Nijkamp, P. Tourist crowding perception and acceptability in cities: An Applied Modelling Study on Bruges. Ann. Tour. Res. 2012, 39, 2133–2153. [Google Scholar] [CrossRef]
  9. De Luca, G.; Dastgerdi, A.S.; Francini, C.; Liberatore, G. Sustainable cultural heritage planning and management of overtourism in art cities: Lessons from atlas world heritage. Sustainability 2020, 12, 3929. [Google Scholar] [CrossRef]
  10. Garcia-Lépez, M.A.; Jofre-Monseny, J.; Martí­nez-Mazza, R.; Segú, M. Do short-term rental platforms affect housing markets? Evidence from Airbnb in Barcelona. J. Urban Econ. 2020, 119, 103278. [Google Scholar] [CrossRef]
  11. Guttentag, D. Airbnb: Disruptive innovation and the rise of an informal tourism accommodation sector. Curr. Issues Tour. 2015, 18, 1192–1217. [Google Scholar] [CrossRef]
  12. Amore, A.; Falk, M.; Adie, B. One visitor too many: Assessing the degree of overtourism in established European urban destinations. Int. J. Tour. Cities 2020, 6, 117–137. [Google Scholar] [CrossRef]
  13. Zmyślony, P.; Leszczyński, G.; Waligóra, A.; Alejziak, W. The Sharing Economy and Sustainability of Urban Destinations in the (Over)tourism Context: The Social Capital Theory Perspective. Sustainability 2020, 12, 2310. [Google Scholar] [CrossRef] [Green Version]
  14. Hall, C.M. Constructing sustainable tourism development: The 2030 agenda and the managerial ecology of sustainable tourism. J. Sustain. Tour. 2019, 27, 1044–1060. [Google Scholar] [CrossRef]
  15. Capocchi, A.; Vallone, C.; Pierotti, M.; Amaduzzi, A. Overtourism: A Literature Review to Assess Implications and Future Perspectives. Sustainability 2019, 11, 3303. [Google Scholar] [CrossRef] [Green Version]
  16. Fan, D.X.; Liu, A.; Qiu, R.T. Revisiting the relationship between host attitudes and tourism development: A utility maximization approach. Tour. Econ. 2019, 25, 171–188. [Google Scholar] [CrossRef]
  17. Bimonte, S.; Punzo, L.F. The evolutionary game between tourist and resident populations and Tourist Carrying Capacity. Int. J. Technol. Glob. 2007, 3, 73. [Google Scholar] [CrossRef]
  18. Vinogradov, E.; Leick, B.; Kivedal, B.K. An agent-based modelling approach to housing market regulations and Airbnb-induced tourism. Tour. Manag. 2020, 77, 104004. [Google Scholar] [CrossRef]
  19. Cheng, F.; Su, F.; Chen, M.; Wang, Q.; Jiang, H.; Wang, X. An evolving assessment model for environmental carrying capacity: A case study of coral reef islands. J. Environ. Manag. 2019, 233, 543–552. [Google Scholar] [CrossRef]
  20. Weibull, J.W. Evolutionary Game Theory; MIT Press: Cambridge, MA, USA, 1997. [Google Scholar]
  21. Smith, J.M. Evolution and the Theory of Games; Cambridge University Press: Cambridge, UK, 1982. [Google Scholar] [CrossRef] [Green Version]
  22. Kreps, D.; Press, O.U. Game Theory and Economic Modelling; Clarendon Lectures in Economics; Oxford University Press: Oxford, UK, 1990. [Google Scholar]
  23. Batty, S.E. Game-Theoretic Approaches to Urban Planning and Design. Environ. Plan. B Plan. Des. 1977, 4, 211–239. [Google Scholar] [CrossRef]
  24. He, P.; He, Y.; Xu, F. Evolutionary analysis of sustainable tourism. Ann. Tour. Res. 2018, 69, 76–89. [Google Scholar] [CrossRef]
  25. Sandholm, W.H. Population Games and Evolutionary Dynamics; MIT Press: Cambridge, MA, USA, 2010. [Google Scholar]
  26. Volgger, M.; Taplin, R.; Pforr, C. The evolution of “Airbnb-tourism”: Demand-side dynamics around international use of peer-to-peer accommodation in Australia. Ann. Tour. Res. 2019, 75, 322–337. [Google Scholar] [CrossRef]
  27. Bertocchi, D.; Visentin, F. ‘The Overwhelmed City’: Physical and Social Over-Capacities of Global Tourism in Venice. Sustainability 2019, 11, 6937. [Google Scholar] [CrossRef] [Green Version]
  28. Città di Venezia–Servizio Statistica e Ricerca: Popolazione: Dati e Studi. 2020. Available online: https://www.comune.venezia.it/it/content/statistica-statistiche-popolazione-0 (accessed on 31 March 2021).
  29. Cristiano, S.; Gonella, F. ‘Kill Venice’: A systems thinking conceptualisation of urban life, economy, and resilience in tourist cities. Palgrave Commun. 2020, 7, 1–13. [Google Scholar] [CrossRef]
  30. Bertocchi, D.; Camatti, N.; Giove, S.; van der Borg, J. Venice and Overtourism: Simulating Sustainable Development Scenarios through a Tourism Carrying Capacity Model. Sustainability 2020, 12, 512. [Google Scholar] [CrossRef] [Green Version]
  31. Maynard Smith, J.; Price, G.R. The Logic of Animal Conflict. Nature 1973, 246, 15–18. [Google Scholar] [CrossRef]
  32. Friedman, D. On economic applications of evolutionary game theory. J. Evol. Econ. 1998, 8, 15–43. [Google Scholar] [CrossRef] [Green Version]
  33. Nash, J.F. Equilibrium points in n-person games. Proc. Natl. Acad. Sci. USA 1950, 36, 48–49. [Google Scholar] [CrossRef] [Green Version]
  34. Nash, J. Non-Cooperative Games. Ann. Math. 1951, 54, 286–295. [Google Scholar] [CrossRef]
  35. Simmonds, D.; Waddell, P.; Wegener, M. Equilibrium versus Dynamics in Urban Modelling. Environ. Plan. Plan. B Des. 2013, 40, 1051–1070. [Google Scholar] [CrossRef]
  36. Nash, J. Non-Cooperative Games. Unpublished Ph.D. Thesis, University of Princeton, Princeton, NJ, USA, 1950. [Google Scholar]
  37. Sandholm, W.H.; Dokumaci, E.; Franchetti, F. Dynamo: Diagrams for Evolutionary Game Dynamics. Available online: https://www.ssc.wisc.edu/~whs/dynamo/ (accessed on 30 March 2021).
  38. Batty, M. Modelling Cities as Dynamic Systems. Nature 1971, 231, 425–428. [Google Scholar] [CrossRef]
  39. Batty, M. Classifying urban models. Environ. Plan. Plan. Des. 2016, 43, 251–256. [Google Scholar] [CrossRef] [Green Version]
  40. Zeeman, E.C. Population dynamics from game theory. In Global Theory of Dynamical Systems; Nitecki, Z., Robinson, C., Eds.; Springer: Berlin/Heidelberg, Germany, 1980; pp. 471–497. [Google Scholar]
  41. Programme, U.N.H.S. Unpacking the Value of Sustainable Urbanization. In World Cities Report 2020; United Nations: New York, NY, USA, 2020; pp. 43–74. Available online: https://www.un-ilibrary.org/content/books/9789210054386c006 (accessed on 30 March 2021).
  42. Barron, K.; Kung, E.; Proserpio, D. The Sharing Economy and Housing Affordability: Evidence from Airbnb. In Proceedings of the 2018 ACM Conference on Economics and Computation, Ithaca, NY, USA, 18–22 June 2018; Association for Computing Machinery: New York, NY, USA, 2018; p. 5. [Google Scholar] [CrossRef]
  43. Taylor, P.D.; Jonker, L.B. Evolutionary stable strategies and game dynamics. Math. Biosci. 1978, 40, 145–156. [Google Scholar] [CrossRef]
  44. Izquierdo, L.R.; Izquierdo, S.S.; Sandholm, W.H. EvoDyn-3s: A Mathematica computable document to analyze evolutionary dynamics in 3-strategy games. SoftwareX 2018, 7, 226–233. [Google Scholar] [CrossRef]
  45. Núñez-Tabales, J.M.; Solano-Sánchez, M.Á.; y-López-del Río, L.C. Ten Years of Airbnb Phenomenon Research: A Bibliometric Approach (2010–2019). Sustainability 2020, 12, 6205. [Google Scholar] [CrossRef]
  46. Hofbauer, J.; Sigmund, K. Evolutionary Games and Population Dynamics; Cambridge University Press: Cambridge, UK, 1998. [Google Scholar] [CrossRef] [Green Version]
  47. Häggström, O. Finite Markov Chains and Algorithmic Applications; London Mathematical Society Student Texts, Cambridge University Press: Cambridge, UK, 2002. [Google Scholar]
Figure 1. The evolution of ( x r ( t ) , x v ( t ) , x a ( t ) ) for the historic center of Venice with t [ 2001 , 2020 ] . The three graphical scales are different and represent the interpolated data. While both uses–residential and vacant–decreased, the number of units transformed into Airbnb grew, as residential and vacant units were being transformed into tourist accommodation.
Sustainability 13 03829 g001
Figure 2. The geometrical representation of dynamics and the equilibrium states without random choice probability μ = 0.0 . The three vertices represent pure populations, composed only by one type of use. The center of the triangle represents a population composed equally by residential, vacant and Airbnb housing units. The arrows indicate the direction towards which the distribution of the three populations is evolving till reaching an equilibrium point. The gradient blue–red color scale specifies the speed according to which the populations approximate the equilibrium points.
Sustainability 13 03829 g002
Figure 3. The dynamics on the simplex when the probability of random choice is μ = 0.154 . This figure is indicative of the fact that the probability of random choice is a determinant of including the strategy of vacancy in the configuration of the equilibrium; otherwise this strategy tends to disappear.
Sustainability 13 03829 g003
Figure 4. The μ = 0.154 dynamics for the simplex subset x r 0.85 . The real trajectory of the ( x r ( t ) , x v ( t ) , x a ( t ) ) dynamics for the city of Venice from 2008 to 2020 is represented in red and the theoretical curves are represented in black. This is the scaled up version of the upper part of the triangle in Figure 3. The real trajectory, based on the data represented in Figure 1, corresponds well to the one of the model. According to the model, the process of transformation of housing units into Airbnbs has not been yet completed and these will continue to occur till representing nearly the 10% of the housing units in Venice.
Sustainability 13 03829 g004
Figure 5. The population distribution ( x ¯ r , x ¯ v , x ¯ a ) according to different values of the μ random choice parameter. The x-axis indicates the randomness rate affecting the choice of the agents to transform the units. In case the choice is based on merely rational choices; the randomness rate is zero. It is important to stress that when this rate overcomes the value of 0.16, nearly all residential units are being transformed into Airbnbs. When the randomness rate reaches 1 (100% of the population choosing based on random criteria) the distribution shows a city equally occupied by residential, vacant and Airbnb uses.
Sustainability 13 03829 g005
Table 1. The three equilibrium points for μ = 0.154 together with the corresponding eigenvalues.
x r x v x a λ 1 λ 2
0.01670.05120.932−2.95−1.03
0.8390.02590.135−1.990.142
0.8830.02360.0938−2.19−0.149
Publisher’s Note: MDPI stays neutral with regard to jurisdictional claims in published maps and institutional affiliations.

