Abstract
Due to recent industrial developments and the COVID-19 pandemic, people are spending more time indoors. Consequently, many researchers have focused on the indoor environment, and indoor air quality is considered more important for human health. Improving indoor air quality depends on effective ventilation and reasonable air distribution. In an air-conditioned room, the form of airflow organization affects air quality, so air distribution is an important aspect of air-conditioning system design. In this study, we used Airpak software by Fluent to perform numerical calculations on the indoor humidity calculation model and study the effects of different ventilation methods on indoor temperature and humidity distribution. The Reynolds averaged Navier–Stokes equation and the RNG (Re-Normalisation Group) k-epsilon model were used to predict the airflow pattern in a room, the effects of ventilation on the dew rate, the effects of different ventilation methods, and the effect of indoor wall condensation. The results of the simulation showed that the ventilation mode significantly affected the distribution of condensation on the indoor wall surface.
1. Introduction
Nowadays, people spend most of their time (70–90%) indoors [1] and indoor air quality (IAQ) directly affects people’s lives and health. As a result, IAQ has attracted increased research attention. With the development of air-conditioning technology, research on the indoor air environment is shifting from comfort-focused to health-focused air conditioning. Human comfort can be enhanced by air-conditioning systems that regulate indoor environmental parameters or exploit the potential of natural energy sources [2]. In particular, telecommuting has recently increased due to the COVID-19 pandemic, and this trend is expected to continue for some time. The ability of the virus to survive in the air depends on environmental conditions, the most important parameters being ambient temperature and relative humidity. A series of studies have shown that a dry environment creates an excellent environment for the growth and spread of influenza viruses [3].
Since the 1940s, many scholars around the world have studied the characteristics of jets in mechanically ventilated rooms, both experimentally and theoretically, and over the course of a decade, a series of jet formulas were established to predict indoor air distribution, which became the simplest method of predicting indoor air distribution at the time [4]. The zonal model, which stemmed from a study of the analysis of temperature stratification in heated rooms, was formally proposed in 1970 [5]. Since then, researchers have used the model to study various room configurations and airflow patterns to predict the natural ventilation and temperature distribution in a room. At that time, the model was proposed to be restricted to natural ventilation, but later it was suggested that the method could also be used for mechanical ventilation [6]. Computational fluid dynamics (CFD) offers the advantages of being low cost, fast speed, and providing complete data when simulating working conditions. Since 1974, when CFD techniques were first applied to the simulation of air flow in ventilated rooms by Nielsen in Denmark [7], Markatos carried out a CFD numerical simulation of a large television broadcast room to derive three-dimensional indoor flow and heat transfer characteristics to provide a basis for improving the design of air conditioning in large spaces [8], the application of CFD in heating, ventilation, and air conditioning (HVAC) research has developed continuously, with modifications to the methods [9,10,11,12,13,14,15]. Lee et al. used CFD to discuss the effects of different factors (air outlet type and space type) on the effectiveness of split-level air-conditioning systems [16]. A comparison of the energy efficiency and temperature fields of different air supplies for a large stadium was carried out by Huang [17], who concluded that downward supply return air upward mode is better than the upward air supply and downward air return mode. The main factors affecting the indoor temperature field and temperature drop in the side and bottom return air supply methods were identified by Wu [18]. In addition, Li conducted numerical simulations of three air supply angles for indoor cabinet air conditioners and obtained the characteristics of the flow fields and temperature distribution [19]. Tang simulated the temperature fields of three different air velocities under a fixed air supply method and showed that the air supply velocity affects the indoor thermal environment [20]. In addition, Liu used CFD software to simulate the change of airflow organization in an air-conditioned office with the door open and then closed to show that airflow organization affects the indoor thermal environment [21]. In another study, Qu discussed the numerical simulation analysis of the indoor thermal environment under four air supply methods [22]. Di and Wang used Airpak simulations to analyze errors in indoor airflow organization [23]. Jiang and Wang carried out a numerical simulation of an indoor environment with natural ventilation [24]. The natural ventilation of the indoor environment for a public building in Changzhou was simulated by the Phoenix software (https://www.phoenixs.co.uk/, accessed on 15 February 2021). The distribution of the velocity field and air age were obtained. Prediction and evaluation of the indoor field distribution were based on the velocity field and air age. The indoor air distribution under natural ventilation was described and the indoor air quality was predicted, which provided a basis for the evaluation of natural ventilation in buildings. Yu ran a simulation to optimize the thermal comfort of a classroom based on Airpak [25]. Zhang analyzed the ventilation airflow organization of an air-conditioned office based on CFD [26]. In previous research, CFD simulation techniques were used to simulate various large spaces and types of airflow organization with the goal of providing a basis to improve the thermal environment and airflow organization in large spaces [27,28,29].
Humidity is an important parameter to consider when evaluating indoor air quality, which not only affects the thermal comfort of the human body but also impacts the functioning of the building [30,31]. In terms of the comfort of the human living environment, high humidity promotes the propagation of mold and the growth of pathogens, which in turn induces symptoms such as asthma and allergies, which seriously threaten the health of occupants, potentially causing discomfort in the respiratory tract and can even leading to the generation of static electricity, causing potential safety hazards [32]. For some special buildings, such as operating rooms, intensive care units, swimming pools, and plant greenhouses, temperature and humidity control are critical. In addition, dew condensation on walls, floors, and roofs is also a serious problem for buildings. When the moisture content of the air near walls exceeds the corresponding saturation moisture content of the wall temperature, it will cause dew condensation to form on the walls and leads to the wall surface peeling off, mildew, corrosion of the enclosure structure, and reduction of the lifespan of the building [33,34]. At present, two methods are often used in the engineering field to reduce the condensation risk in an enclosed structure: First, in ordinary rooms, insulation materials are attached to walls to increase the dew point temperature of the inner surface of the enclosed structure; and second, ventilation and air-conditioning of rooms reduces the possibility of the condensation of wet air on the wall by controlling the temperature and humidity of the room. The use of mechanical ventilation can not only reduce the risk of condensation in the building but also regulates the indoor temperature and humidity, so ventilation is more widely used in engineering. As the indoor humidity distribution of a building is related to the moisture production characteristics of the source, it varies depending on the ventilation conditions. Studying the influence of ventilation on the distribution of indoor wall condensation is valuable for the theoretical research of building moisture resistance and condensation prevention, as well as the design of ventilation engineering. For compact spaces, such as offices, the impact of different air supply methods on the indoor thermal environment has been rarely studied. CFD simulation techniques can be used to simulate the indoor thermal environment created by air conditioning in small spaces, revealing the impact of different air supply speeds and angles on the indoor thermal environment under fixed air supply methods. We used Airpak software to numerically simulate three common air supply methods in offices, namely, top air supply and return, side down air supply and side up air return, and side up air supply and side down air return, and we analyzed the results to select the optimal airflow organization for the air supply method, providing a theoretical basis for improving the thermal environment design of air-conditioned rooms. Thermal comfort is the condition of mind that expresses satisfaction with the thermal environment and is assessed by subjective evaluation (ANSI(American National Skyline, Inc.)/ASHRAE(American Society of Heating and Air-Conditioning Engineers) Standard 55) [35]. Maintaining high levels of thermal comfort for occupants of buildings or other enclosed spaces is one of the main goals for HVAC (heating, ventilation, and air conditioning) design engineers. The age of air mass (hereafter age of air) refers to the time since the air mass entered the room and reflects the freshness of indoor air. It can be a comprehensive measure of the room’s ventilation effectiveness and is an important indicator used to evaluate indoor air quality. The concept of air age was first introduced by Sandberg in the 1980s [36]. When pollutants are evenly distributed in a room and the air supply is fresh, the air quality is considered good. When the average air age is low it also indicates that the room has a good ability to remove pollutants. Due to the obvious physical significance of air age, it is widely used as an indicator of air freshness in air-conditioned rooms and in relation to the ability to replace air [37]. Traditionally, the air age concept has only been considered in the interior of the room, with the air age at the room inlet considered to be 0 (100% fresh air). To consider the effect of the entire ventilation system (i.e., return air, mixed air, and flow in the ducts), researchers at Tsinghua University proposed the “full air age” concept [38]. The air age at the entrance of the room is taken as 0 and the resulting air age is called the room air age. Compared to the room air age, the full air age can be seen as an absolute parameter and the full air age in different rooms can be compared.
2. Methods
Airpak software was developed and produced by Fluent in the United States and is now widely used to simulate indoor and airflow organization distribution [39]. Airpak has many advantages: It can automatically perform meshing and check sparseness, length to thinness ratio, and quality of the mesh and can locally encrypt specific parts of the mesh; it has powerful post-processing functions and comprehensive numerical reports, and a single calculation can provide images and data concerning indoor air quality technical indicators such as indoor airflow organization, PMV (predicted mean vote), and PPD, (predicted percentage of dissatisfied) among others; the use of Airpak allows design risks to be predicted, thus reducing design costs. Airpak 3.0 software was used for this project, based on CFD simulation methods and using standard k-models. Briefly, this involved the following steps: (1) collecting data and ensuring its accuracy; (2) establishing the model required for airflow organization analysis according to the preliminary data and the requirements of the analysis software; (3) setting reasonable control equations, initial conditions and boundary conditions, dividing the mesh, and solving the equations; (4) simulating and analyzing the velocity, temperature, and humidity fields of the airflow organization; (5) assessing whether the air-conditioning and ventilation solutions for the room or area were reasonable. The air-conditioning system was the simulation method used for the verification of the cases, and the research model used to establish the simulation is shown in Figure 1. The model was equipped with an air inlet and outlet with three different types, and the dimensions of the simulated model established were 3.5 m × 3 m × 2.6 m (length × width × height). The thickness of the wall surface and under the ground was not considered because it does not have any influence on the flow field. To investigate the effect of the air supply and air outlet position on the indoor environment and humidity distribution, three different combinations of air supply and outlets were set up and simulated. The simulation was established to examine the effect of different outlet positions on the internal humidity of the model and to evaluate the advantages and disadvantages of natural ventilation convection. The selected analysis space had three different changes. We simulated the effects of three different ventilation methods and air supply parameters on condensation in four cases. Case 1 had an upper supply and upper back mode, Case 2 had an upper supply and lower back mode, and Case 3 had a lower supply and upper back mode. The walls in Case 4 were adiabatic and dehumidified. The walls of Case 1, Case 2, and Case 3 were made of concrete and had an overall heat transfer coefficient of 1.86 W/m2 K [40]. A humidifier with a capacity of 300 mL per hour and dimensions of 0.4 × 0.3 × 0.4 m was placed in the center of the room (Figure 1). The model boundary conditions are shown in Table 1, while the parameter settings of the simulation calculation condition are shown in Table 2. The inlet boundary had an air velocity of 1 m/s, air temperature of 29 °C, and air humidity of 40% at the air conditioning outlet. The outlet boundary was considered a local unidirectional treatment using ambient values and default outflow. The walls were moisture-insulated boundaries with a thermal conductivity of 1.86 W/ m2 K. The outdoor temperature was 5 °C, and the ceilings and floors had insulated walls. We focused on the distribution of indoor humidity under different supply and return air modes, and the simulation results are expressed by steady-state calculation results. We also studied the formation rate of indoor condensation under different supply and return air modes and selected the state of condensation under transient typical moments.
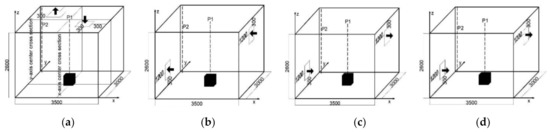
Figure 1.
Physical model of each ventilation condition: (a) Case 1, (b) Case 2, (c) Case 3, and (d) Case 4.

Table 1.
Model boundary conditions.
Table 2.
Simulation calculation conditions.
Before building the mathematical model, it is necessary to recognize the five simplified assumptions we made [41]:
- We ignored the influence of the gravity field on air and water vapor.
- Both air and water vapor were considered incompressible fluids with a constant density.
- We assumed that when steam evaporates from the water surface, only latent heat exchange is performed—sensible heat exchange was not considered.
- The heat release of the phase transition process when water vapor condenses on the wall was ignored.
- The moisture absorption capacity of the wall was not considered during the condensation on the wall.
In the building indoor environment, the water vapor in the humid air is generally in a superheated state and the content is very low; so, to a certain extent it can be approximated as the ideal gas. The basic laws describing the conservation of heat and mass transfer between the fluid and the fluid, and between the fluid and the solid interface are the mass conservation law, momentum conservation law, and energy conservation law. The mathematical models that generally describe these conservation laws are the corresponding governing equations, namely, the mass continuity equation, the momentum equation, and the energy equation, respectively.
There is no chemical reaction in the numerical simulation process of this subject, and the transport equation of the unreacted material is as follows:
where is the mass fraction of each substance predicted by FLUENT using the convective diffusion equation of the ith substance, and is the diffusion flux of substance i, which is produced by the concentration gradient.
When the moving fluid is laminar,
where is the diffusion coefficient of the first species in the mixture.
When the moving fluid is turbulent,
where is the turbulent Schmidt number.
Absolute humidity (or moisture content) is the ratio of the mass of water vapor to the total mass of the air parcel. Absolute humidity is normally expressed in kilograms of water vapor per kilogram of dry air. The absolute humidity can be expressed by
where d is the absolute humidity, is the mass of water vapor (kg), and is the mass of dry air (kg).
The FLUENT 14.0 turbulence module (Standard k-ε) was used to analyze the flow field characteristics. The component transport module (Species Transport) and the multiphase flow module (Multiphase) simulated the mass transfer phase transition of water vapor in the air. The governing equation is as follows:
where ϕ is a general variable, Γ is a generalized diffusion coefficient, and s is a generalized source term.
The wall condensation conditions were as follows: when the absolute humidity, of the air node around the wall surface was higher than the saturated absolute humidity, corresponding to the wall temperature, the wall surface was considered to be coated with condensation.
The conditions for no condensation on the wall were as follows: any time, τ, when the absolute humidity, of the air node around the wall was less than the saturated absolute humidity, , corresponding to the wall temperature, the wall was not considered to be coated with condensation.
The unstructured grid was used to divide the three-dimensional model, and the regions with large temperature and humidity gradient changes at the inlet and the fan outlet were grid-encrypted. To ensure that the number of meshes used in the simulation was not related to the corresponding simulation results, a mesh independence verification test was performed. Models with three grids (A, B, and C), with numbers of 2,500,984, 2,700,880, and 3,000,980, respectively, were selected for simulation. In Case 1, we selected a total of ten simulation points for the air inlet, air outlet, humidifier outlet, and configuration as reference. The average humidity values at various measurement points were compared and models A, B, and C showed values of less than 5%. Figure 2 shows that the grid refinement based on model A had little effect on the simulation results. Considering the calculation rate, model A was selected for simulation analysis. The maximum plane twist rate of the grid was 0.6, and 97.3% of the grid twist rates were less than 0.5. The grid quality was good and met the simulation requirement.
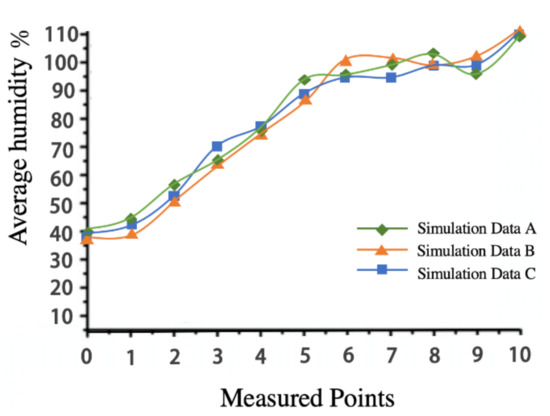
Figure 2.
Independence of results within grid meshes.
The main discretization methods for control equations include the finite difference method, finite element method, finite volume method, boundary element method, and spectral method, among others. In this study we used the finite volume method (FVM), which is characterized by high computational efficiency. It has been widely used in the field of CFD. It functions by dividing the computational area into a grid and surrounding grid points with a non-repeating control volume; the differential equations (control equations) to be solved are divided for each control volume, thus giving a set of discrete equations. The unknowns are the dependent variables at the grid points, and to find the integral of the control volume, it must be assumed that the values of the dependent variables vary regularly between grid points. The discrete format of the equations for momentum, pressure, energy turbulence kinetic energy, and its diffusivity conservation during the simulation is chosen as the second-order windward format. Table 3 shows the discretization scheme settings.
Table 3.
The set of relevant parameters of discrete solution.
In 2011, Huang, Y. [17] simulated the indoor thermal environment of an air-conditioned room in summer using Airpak software and conducted experiments to verify the accuracy of the numerical simulation results. The experimental results were basically consistent with the variation pattern of the numerical simulation results. The corresponding point errors were in the acceptable range [11]. In 2012, Luo carried out a numerical simulation of the indoor thermal environment under four different air supply methods. The CFD technique was used to adopt several models from Airpak software for different air supply methods, and the simulation was used to evaluate the indoor temperature field, air age, PMV, and PPD. The effect of different forms of airflow organization on indoor air quality and human comfort were studied. The simulation results were consistent with the experimental data, which demonstrated the accuracy and reliability of the Airpak software for simulating indoor thermal environments. We used a similar model and discretization scheme, so the accuracy and reliability of our results can be assumed to a certain extent [22].
3. Post-Processing and Analysis of Simulation Results
3.1. Velocity Field Analysis (Air Flow Analysis)
The main objective of this simulation was to study the indoor humidity distribution, so the x- and y-axis cross-section and the ground height (0.2 m cross-section) and human standing height (1.5 m cross-section) at the humidifier were analyzed. Case 1 was that the air return is in the ceiling. It can be seen from Figure 3 that the airflow enters the model from the ceiling, which affects the indoor humidity distribution and forms a vortex around the humidifier. The velocity field diagram of the central cross-section of the x-axis shows that some of the water vapor emitted from the generating source rises due to its initial velocity and forms a vortex with the airflow entering the air supply port, and the other part is discharged outside the room through the exhaust port.
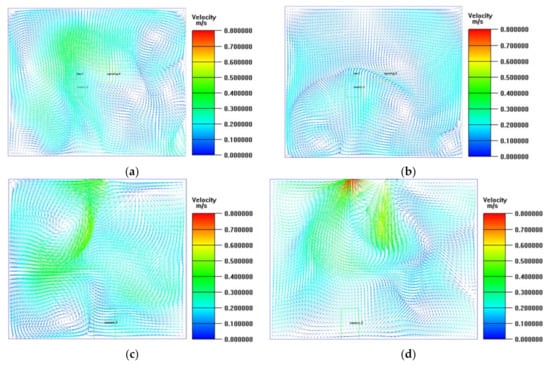
Figure 3.
Velocity field of axial section of Case 1: (a) air velocity field of horizontal cross-section of Case 1 (Z = 1.5 m); (b) air velocity field of horizontal cross-section of Case 1 (Z = 0.2 m); (c) x-axial center cross-section velocity field; (d) y-axial center cross-section velocity field.
After the dilution effect, the supply air is discharged outside the room, and the other part is directly taken out of the laboratory by the exhaust port due to the jet induction effect of the exhaust port. The naturally ventilated window and the exhaust port are located on the same side of the laboratory. Due to this jet-induced effect of the exhaust port, the window exhaust port forms a backflow and the air entering from the window is mostly free of water vapor. The air is diluted and discharged directly out of the room. Figure 4 shows the velocity field diagram for Case 2. In terms of the flow field, Case 2 is very different to Case 1. As the supply and return air vents are on both sides of the room, there is good air circulation in the room, and there are no jet vortices. With the air vents injecting fresh air at a higher level than the return air vents on the other side of the room, which were near floor level, the fresh air was well mixed and distributed within the room.
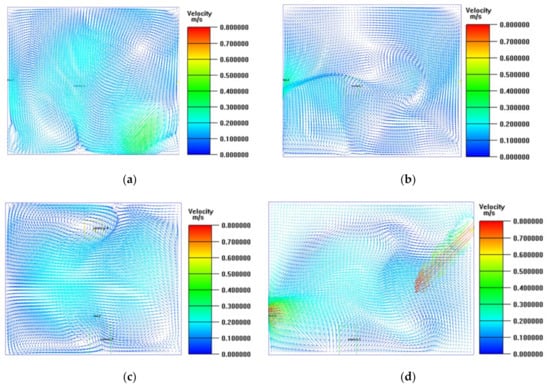
Figure 4.
Velocity field of axial section of Case 2: (a) air velocity field of horizontal cross-section of Case 2 (Z = 1.5 m); (b) air velocity field of horizontal cross-section of Case 2 (Z = 0.2 m); (c) x-axial center cross-section velocity field; (d) y-axial center cross-section velocity field.
Figure 5 shows the velocity flow field analysis for Case 3. As can be seen from the diagram, the air flow in the room is still good, with a small eddy of air near floor level due to the humidifier setting. The air is better mixed in the room from below, but because of the dust on the floor, the air from below tends to circulate the dust around the room, making it easier for humans to come into contact with contaminants. Thus, although the downdraft method has a better effect on indoor air mixing, it is rarely used in daily life. Based on the above analysis, it can be concluded that the general distribution of the entire indoor fluid flow field is basically a part of the air sent from the air supply port to form two large vortices between the humidifier and the end of the exhaust port. Due to the jet induction of the exhaust port, it is directly discharged outside. The general jet formula is not capable of providing the position of the vortex and does not consider the influence of the boundary, but the CFD software can clearly show the specific characteristics such as position and shape. The influence between jets can be considered in CFD, and the CFD results can reflect these influences, which is an advantage of CFD in the analysis of airflow organization.
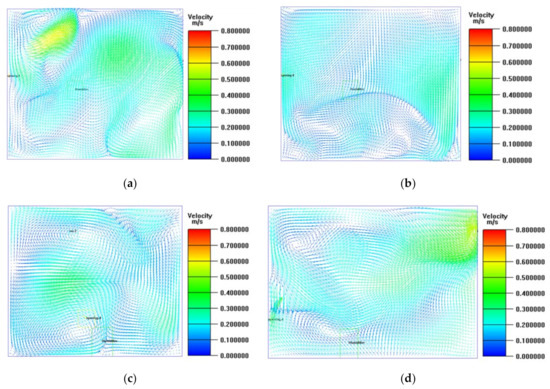
Figure 5.
Velocity field of axial section of Case 3: (a) air velocity field of horizontal cross-section of Case 3 (Z = 1.5 m); (b) air velocity field of horizontal cross-section of Case 3 (Z = 0.2 m); (c) x-axial center cross-section velocity field; (d) y-axial center cross-section velocity field.
3.2. Humidity Analysis
Figure 6 shows the relative humidity distribution of the central section under the same ventilation and different ventilation modes. The range of relative humidity at RH ≥ 100% in the figure characterizes the formation of water mist. It can be seen from Figure 6 that the relative humidity distribution of the central section is related to the air supply mode, and the condensation state by different air supply modes is different. Comparing the cases, the relative humidity value of Case 1 was generally low, while Case 2 had a high humidity area in the lower space, and Case 3 had a high humidity area in the upper space. Due to the wall insulation included in Case 4, almost no condensation appeared near the wall space, and the condensation space was concentrated in the upper space of the humidifier.
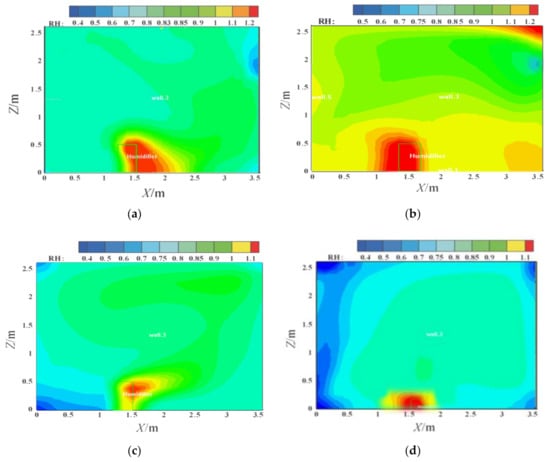
Figure 6.
The sectional humidity distribution for (a) Case 1, (b) Case 2, (c) Case 3, and (d) Case 4.
The results of the analysis of the water mist formed near the wet source outlet showed that the water vapor formed in Case 1 was concentrated at 0.5–0.7 m above the wet source outlet; the water mist formed in Case 2 was concentrated in the upper right of the wet source outlet at 0.5–1.1 m, and the quantity of water mist was greater for Case 2. Case 3 formed the smallest volume of water mist, which was concentrated 0.5 m above the wet source outlet. Comparing Case 4 with Case 3, since Case 4 increased the amount of humidification in the humidifier, the condensation area in the area above the humidifier was larger than in Case 3. There were obvious differences in humidity distribution between Case 2 and Case 3.
Figure 7 shows the temperature distribution of Case 2 and Case 3. It can be seen that when the air is supplied from the lower part of the room, the hot air filled the whole area.
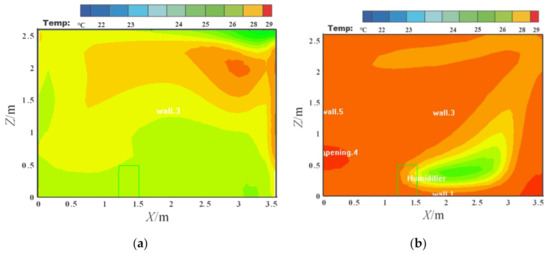
Figure 7.
Sectional temperature distribution in (a) Case 2 and (b) Case 3.
To study the effects of ventilation on space and wall condensation, the intersection of the wet source exit position from the ceiling (recorded as P1 line), the wall at X = 0, and the wall at Y = 3 m (referred to as P2 line) were examined. The spatial variation of the condensation rate under different ventilation modes was analyzed. The position of the P1 and P2 lines are shown in Figure 1a. From Figure 8, in the case of the same ventilation, the ventilation method used in Case 3 had the best effect on the condensation in the space above the wet source outlet, albeit there was a small amount of condensation. The ventilation method of Case 2 was the least favorable, for control and condensation occurred in the upper area. The highest condensation rate means that the formation of water mist in the space above the wet source occurred over a short time, and the amount of condensed water was large. It can be seen from Figure 8 that in Case 1, the wall condensation rate increased with increasing wall height, meaning that the condensation at the top position occurred quickly and there was a large amount, while condensation formation at the bottom of the room was late to occur and there was less condensation. The condensation rate curves are similar for Case 2 and Case 3, and the condensation rate of the wall decreased with increased height—the closer to the wall foot position, the faster the condensation formed and the more condensation there was. Comparing the three working conditions, it can be seen that the space and wall condensation rate of Case 3 was the lowest when the same amount of ventilation was used. Therefore, the ventilation of Case 3 is optimal from the viewpoint of reducing the condensation rate of the wall. Comparing Case 4 with Case 3, since Case 4 increases the humidifier’s humidification amount, the condensation area in the area above the humidifier is larger than that of Case 3. Figure 5 shows that because the walls of Case 4 were adiabatic and dehumidified, there was almost no condensation on the intersecting line of the wall.
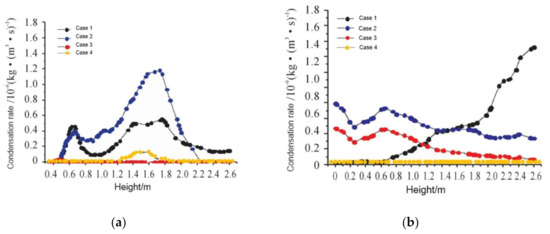
Figure 8.
Condensation rate changes along the P1 line (a) and P2 line (b) under different air supply modes.
Figure 9 shows the simulations of wall condensation distributional changes at typical times under different operating conditions. It can be seen from Figure 9 that, for Case 1, the time at which the wall surface starts to condense is 8 min, and the initial position of the condensation is the corner of the ceiling near the side of the air outlet, while the wall surface is stable from the occurrence of condensation to the condensation area. After 30 min, the maximum condensation on the wall was 0.33 g. For Case 2, the initial time of condensation was 10 min, and the initial location of condensation was in the ceiling corner and on the two side walls near the air supply. In the middle area, the wall surface lasted for 30 min from the time when condensation occurred, and the condensation area was stable; the maximum condensation on the wall was 1.14 g. For Case 3, the initial time of condensation was 15 min, and it initially occurred in the corner of the floor near the side of the air supply opening. The time from the occurrence of dew condensation to the stable condensation area was 40 min, and the maximum condensation on the wall was 0.299 g. From the distribution of the condensation on the wall, considering the ventilation mode of the roof to the roof, the condensation formed at the corner of the ceiling near the side of the exhaust, and then appeared at the intersection of the ceiling and the surrounding walls and corners. With the continuous generation of hot steam, the condensation area began to gradually extend from the ceiling to the bottom of the wall until the condensation area stabilized. When the ventilation was in a row, the condensation formed initially at the side of the ceiling wall near the air supply opening and the middle area of the left and right wall surfaces, and then the condensation spread to the surrounding corner of the floor and the side wall surface of the air supply opening. In the ventilation mode of the upper row on the lower side of the delivery side, the condensation initially formed at the sides of the bottom corner of the air supply opening, and then condensation occurred on the left and right side wall surfaces of the air supply opening and the corner of the ceiling wall on the side of the air outlet. Comparing the condensation conditions under various ventilation modes, we found that when the amount of ventilation was the same but the ventilation mode was different, the condensation on each wall surface was very different. It can be seen from Figure 9 that the condensation area of Case 3 was the smallest, while Case 2 had the largest area of condensation. Therefore, from the perspective of reducing the risk of wall condensation, the ventilation mode used in Case 3 is optimal.
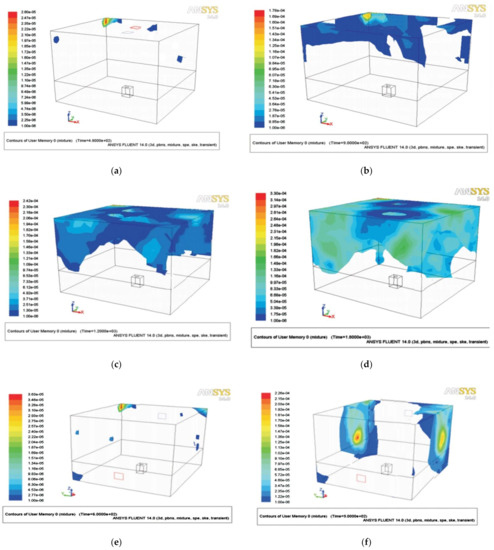
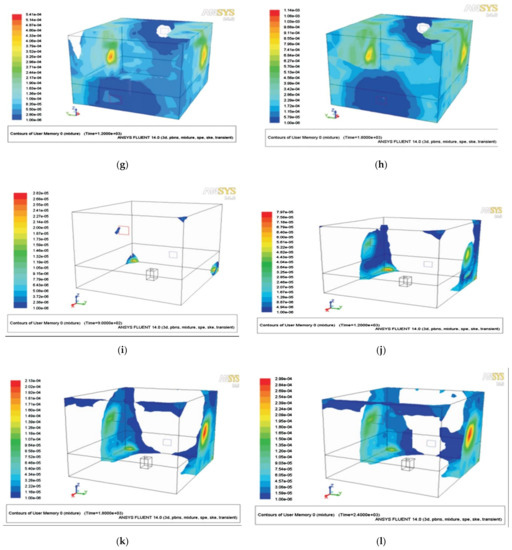
Figure 9.
Wall condensation changes after various durations: (a) 8 min of Case 1. (b) 15 min of Case 1; (c) 20 min of Case 1; (d) 30 min of Case 1; (e) 10 min of Case 2; (f) 15 min of Case 2; (g) 20 min of Case 2; (h) 30 min of Case 2; (i) 15 min of Case 3; (j) 20 min of Case 3; (k) 30 min of Case 3; and (l) 40 min of Case 3.
3.3. Mean Age of Air Analysis
A plot of the air age distribution in the room at a height of 1.5 m was obtained by the Airpak simulation for different air supply methods (Figure 10). Case 3 had a better air replacement effect than the other cases. The air age in Case 1 was about 400–640 s, with an average of 585 s. For Case 2, the air age was about 190–380 s, with an average value of 331 s. For Case 3, the air age ranged between 120–290 s, with an average value of 261 s. Nine points on the 1.5 m height section were selected for comparison and are shown in Figure 11a.
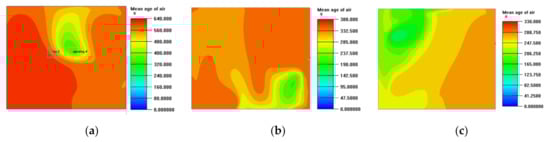
Figure 10.
Air mean age at Z = 1.5 m for (a) Case 1, (b) Case 2, and (c) Case 3.
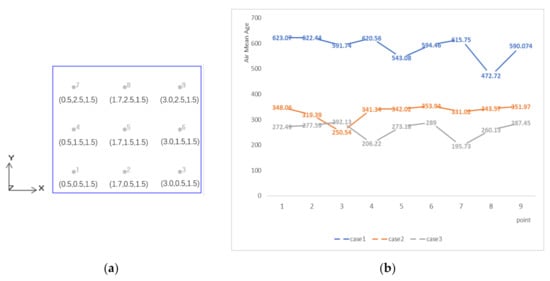
Figure 11.
Air mean age at Z = 1.5 m for Case 1, Case 2, and Case3. (a) Location of the nine points measured on the 1.5 m wall; (b) comparison of air mean age at Z = 1.5 m for Case 1, Case 2, and Case 3.
Figure 11b shows a comparison of the air ages at selected points. It can be seen that the average air age for Case 3 was relatively small, while Case 1 had a much higher air age than the other two cases. According to the definition of air age, the lower the air age, the fresher the air in the room, so the side down and up approach was better than the other two methods.
4. Conclusions
In this paper, we established a mathematical model and used FLUENT software to simulate the effect of ventilation on indoor humidity and wall condensation. The simulation indicated that ventilation configuration has a large influence on the distribution of condensation on wall surfaces. We reached the following conclusions:
- The model realistically simulated the effect of ventilation on condensation distribution. The ventilation method used affects the distribution of condensation on wall surfaces, so the wall condensation can be effectively controlled by properly arranging the position of the outlets.
- For buildings affected by moisture sources, ventilation with a lower supply and upper back mode is better than other methods. The Case 3 ventilation configuration provided better air flow in the room and a better air replacement rate, which prevented condensation from occurring inside the room.
- It can be inferred that when a wall of the ventilated room has insulation installed, ensuring the material has good heat insulation and moisture resistance properties can also reduce the occurrence of condensation.
However, there are still some important issues that need to be discussed in the future:
- The conclusions of this paper are based on small rooms, and it remains to be seen whether similar conclusions can be drawn for other buildings, for example, with split-level air conditioning in tall spaces.
- For a split-type air-conditioned room, airflow organization distribution—the installation position of the air conditioner, indoor equipment placement and indoor personnel distribution—will affect velocity and temperature fields.
- For office buildings, which are now mostly controlled by central air conditioning, the VRV (Variable Refrigerant Volume) plus fresh-air-conditioning system and primary-return air-conditioning system are also worth discussing with regard to the distribution of indoor temperature and humidity, as well as indoor air quality.
Author Contributions
Conceptualization, F.Z.; methodology, F.Z. and Y.R.; software, F.Z.; formal analysis, F.Z.; writing—original draft preparation, F.Z.; writing—review and editing, F.Z. and Y.R.; supervision, Y.R. All authors have read and agreed to the published version of the manuscript.
Funding
This research received no external funding.
Institutional Review Board Statement
Not applicable.
Informed Consent Statement
Not applicable.
Data Availability Statement
The data presented in this study are available in the main manuscript.
Acknowledgments
The authors thank the professors and students at the University of Kitakyushu for their generous help with the production of this paper, from investigation to the review process.
Conflicts of Interest
The authors declare no conflict of interest.
References
- Joyce, W. Solutions for Energy Security & Facility Management Challenges, 1st ed.; Fairmont Press: Atlanta, GA, USA, 2003; p. 460. [Google Scholar]
- Zhao, J.; Liu, S.; Tang, Y. Multidisciplinary approach to integrated design of bioclimatic architecture. J. Shandong Univ. Constr. 2011, 1, 71–75. [Google Scholar]
- Ma, Y.; Zhao, Y.; Liu, J.; He, X.; Wang, B.; Fu, S.; Yan, J.; Niu, J.; Zhou, J.; Luo, B. Effects of temperature variation and humidity on the death of COVID-19 in Wuhan, China. Sci Total Environ. 2020, 724, 138226. [Google Scholar] [CrossRef] [PubMed]
- Tuve, G.L. Air Velocities in Ventilating Jets. ASHVE J. Sect. Heat. Pip. Air Cond. 1953, 25, 181–191. [Google Scholar]
- Howarth, A. Temperature Distributions and Air Movements in Rooms with a Convective Heat Source. Ph.D. Thesis, University of Manchester Institute of Science & Technology, Manchester, UK, 1983. [Google Scholar]
- Zhang, G.; Yang, L.; Haghighat, F. Indoor airflow simulation methods comparison and a new Zonal model approach study. Appl. J. Basic Eng. Sci. 2000, 8, 291–300. [Google Scholar]
- Nielsen, P.V. Flow in Air Conditioned Rooms. Ph.D. Thesis, Technical University of Denmark, Copenhagen, Denmark, 1974. [Google Scholar]
- Markatos, N.C.; Kirkcaldy, D. Analysis and computation of three-dimensional, transient flow and combustion through granulated propellants. Int. J. Heat Mass Transf. 1983, 26, 1037–1053. [Google Scholar] [CrossRef]
- King, A.R.; Kronfalt, M.; Clements, R.F. Stratified air conditioning of large spaces with high heat loads. Aust. Refrig. Air Cond. Heat. 1993, 47, 24–29. [Google Scholar]
- Zítek, P.; Vyhlídal, T.; Simeunović, G.; Nováková, L.; Čížek, J. Novel personalized and humidified air supply for airliner passengers. Build. Environ. 2010, 45, 2345–2353. [Google Scholar] [CrossRef]
- Huang, S.; Zhao, F.; Li, G. Airpak-based summer air conditioning indoor thermal environment based on Airpak. J. Hunan Univ. Sci. Technol. 2011, 26, 11–17. [Google Scholar]
- Baker, A.J.; Richard, M.K.; Eliiott, B.G. Computational fluid dynamics at wo—Edged sword. ASHRAE J. 1997, 39, 51–59. [Google Scholar]
- Martin, P. CFD in the real world. ASHRAE J. 1999, 41, 2–20. [Google Scholar]
- Chen, Q.; Srebric, J. A Procedure for Verification, Validation and Reporting of Indoor Environment CFD Analyses. HVAC Res. 2002, 8, 201–216. [Google Scholar] [CrossRef]
- Srebric, J.; Chen, Q. An Example of Verification, Validation and Reporting of Indoor Environment CFD Analyses. ASHRAE Trans. 2002, 108, 185–194. [Google Scholar]
- Lee, K.; Jiang, Z.; Chen, Q. Air distribution effectiveness with stratified air distribution systems. ASHRAE Trans. 2009, 115, 322–333. [Google Scholar]
- Huang, Y. Airpak-Based Airflow Organization of Large Stadiums for Energy-Saving Design and Design and Energy-Saving Operation of Large Stadiums Based on Airpak. Ph.D. Thesis, Jilin University of Architecture, Changchun, China, 2016. [Google Scholar]
- Wu, D.; Chen, W.; Liang, J.C. Experimental study of indoor temperature field and temperature drop rate during cooling operation of air conditioners. Build. Sci. 2006, 5, 53–58. [Google Scholar]
- Li, Y.; Yu, W.H.; Wang, F.L. Numerical simulation analysis of thermal environment in the office of a cabinet air conditioner in summer based on Airpak. J. North. Univ. Technol. J. 2017, 29, 122–130. [Google Scholar]
- Tang, Q.; Hu, X. Numerical simulation of indoor air environment based on Airpak software. J. Jingdezhen Coll. 2017, 32, 30–33. [Google Scholar]
- Liu, C.; Zou, S.; Yang, R. Airpak-based indoor air quality analysis. Refrig. Air Cond. 2012, 4, 381–384. [Google Scholar]
- Luo, W.; Qu, Y.; Cao, H. Numerical simulation and analysis of indoor thermal environment in four kinds of air supply mode. J. Shandong Jianzhu Univ. 2012, 27, 505–508. [Google Scholar]
- Di, Y.; Wang, S. Error analysis of simulation of indoor airflow organizations with Airpak. J. Xian Univ. Archit. Technol. 2013, 45, 73–78. [Google Scholar]
- Jiang, L.; Wang, C. Numerical Prediction and Evaluation of the Natural Ventilation of Indoor Environment. J. Changzhou Univ. 2016, 28, 54–59. [Google Scholar]
- Yu, C.; Shen, D. Optimized simulation study of classroom thermal comfort based on Airpak. J. Chihshu Coll. 2017, 3, 30–38. [Google Scholar]
- Zhang, Y. CFD-based analysis of airflow characteristics of air conditioning office ventilation. Sci. Technol. Innov. Product. 2019, 11, 38–40. [Google Scholar]
- Launder, B.E.; Rodi, W. The turbulent wall jet-measurements and modeling. Annu. Rev. Fluid Mech. 1983, 15, 429–459. [Google Scholar] [CrossRef]
- Yaghoubi, M.A.; Knappmiller, K.D.; Kirkpatrick, A.T. Three-dimensional numerical simulation of air contamination dispersal in a room. ASHRAE Trans. 1995, 101, 1517. [Google Scholar]
- Ma, Z. Investigation and measurement of residential winter wet environment in Shanghai area. Cool. Air Cond. 2017, 1, 32–37. [Google Scholar]
- Lin, L. Analysis of condensation on the roof of large space buildings caused by the migration of humid air in hot and humid areas. HVAC 2012, 42, 109–113. [Google Scholar]
- Guo, X.; Chen, Y. Hot and humid climate Condensation analysis of internal walls. Civ. Eng. Environ. Eng. 2015, 3, 121–124. [Google Scholar]
- Wang, Y. Numerical model of air distribution in air-conditioned rooms under different air supply speeds Proposed. Build. Energy Conserv. 2017, 5, 33–36. [Google Scholar]
- Yu, S. Analysis of the heat and moisture characteristics of the inner wall of the underground outdoor wall in severe cold areas. Build. Energy Conserv. 2016, 1, 48–52. [Google Scholar]
- Fang, T.; Feng, H.; Wu, B. Indoor ventilation simulation in green building based on Airpak. International conference on computer distributed control and intelligent environmental monitoring. In Proceedings of the 2011 International Conference on Computer Distributed Control and Intelligent Environmental Monitoring, Changsha, China, 19–20 February 2011. [Google Scholar]
- Yu, S. Numerical Simulation Analysis of Heat and Moisture Coupling in Envelope. Build. Energy Conserv. 2010, 7, 68–71. [Google Scholar]
- Yin, J. Research on the influence of different turbulence models and difference schemes on numerical simulation and prediction of typical flow field at low Reynolds number. Refrig. Air Cond. 2017, 5, 11–17. [Google Scholar]
- Chao, L.; Hong, L.; Li, B. Seasonal effect of humidity on human comfort in a hot summer/cold winter zone in China. Indoor Built Environ. 2018, 28, 264–277. [Google Scholar]
- Yokasta, G.F.; Letzai, R.V.; Jesús, C.R. Indoor temperature and relative humidity assessment of three construction systems for Dominican social housing in different micro-climates: A modelling study. Indoor Built Environ. 2018, 28, 693–710. [Google Scholar]
- Li, H.; Gong, G.; Xu, C.; Su, H.; Cao, Z.; Zhou, M.; Yu, C.W.F. Thermal and humid environment and moisture condensation characteristics of cold surfaces. Indoor Built Environ. 2013, 23, 474–484. [Google Scholar] [CrossRef]
- Yamano, D.; Ueda, K.; Sato, M. Grade Architect Department Exam Essentials Check, 1st ed.; SOGO SHIKAKU Co., Ltd.: Tokyo, Japan, 2019; p. 71. [Google Scholar]
- Ma, X. Distribution and Application of Temperature, Humidity and Pollutants in Ventilated and Air-Conditioned Rooms. Ph.D. Thesis, Tsinghua University, Beijing, China, 2012. [Google Scholar]
Publisher’s Note: MDPI stays neutral with regard to jurisdictional claims in published maps and institutional affiliations. |
© 2021 by the authors. Licensee MDPI, Basel, Switzerland. This article is an open access article distributed under the terms and conditions of the Creative Commons Attribution (CC BY) license (http://creativecommons.org/licenses/by/4.0/).