
Fish Stock Assessment for Data-Poor Fisheries, with a Case Study of Tropical Hilsa Shad (Tenualosa ilisha) in the Water of Bangladesh


Abstract
1. Introduction
2. Materials and Methods
2.1. Study Area
2.2. Data Collection
2.3. Stock Assessment Indicators
- (a)
- Two biological reference points, fishing mortality (F) and exploitation rate (E), estimated from the linearized catch curves analysis and the yield per recruit (YPR) model, as described by Sparre and Venema (1998) [44].
- (b)
- The length-based indicators (LBIs) were proposed by Froese (2004) for sustainable fishing [2].
- (c)
- Fisheries reference points from catch and resilience, as describe by Froese et al. (2017), using an R-package CMSY [47].
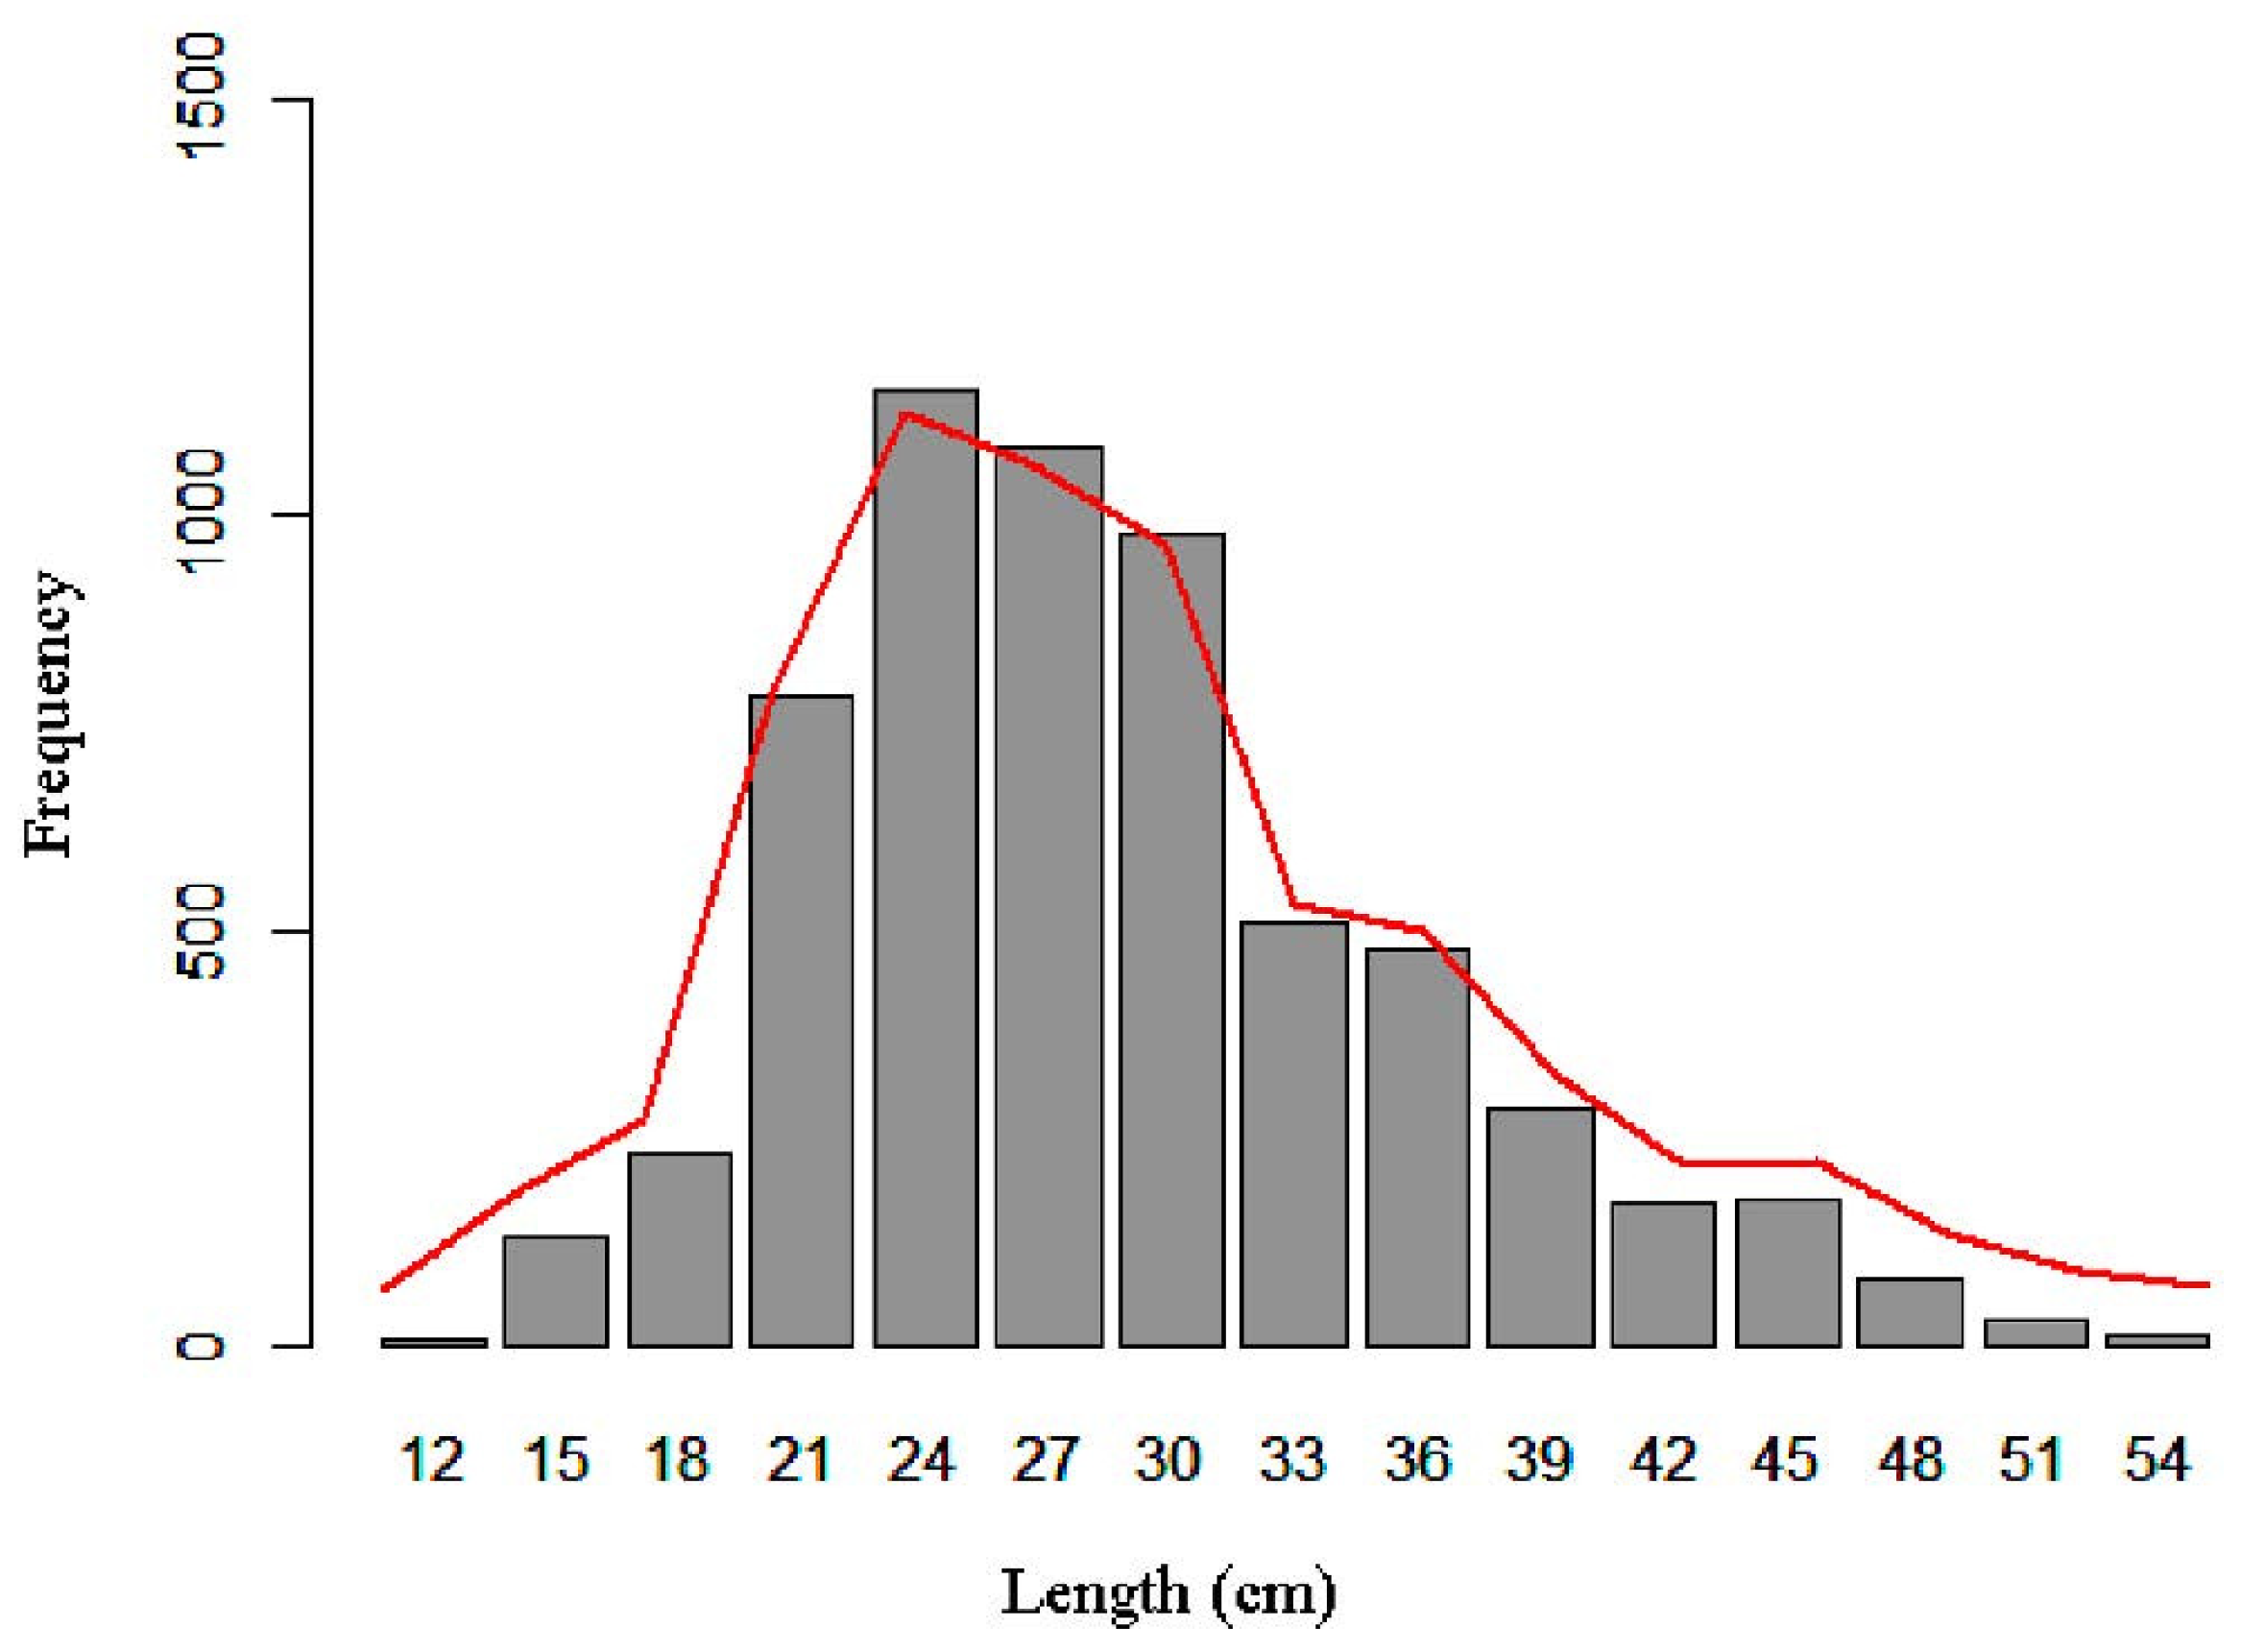
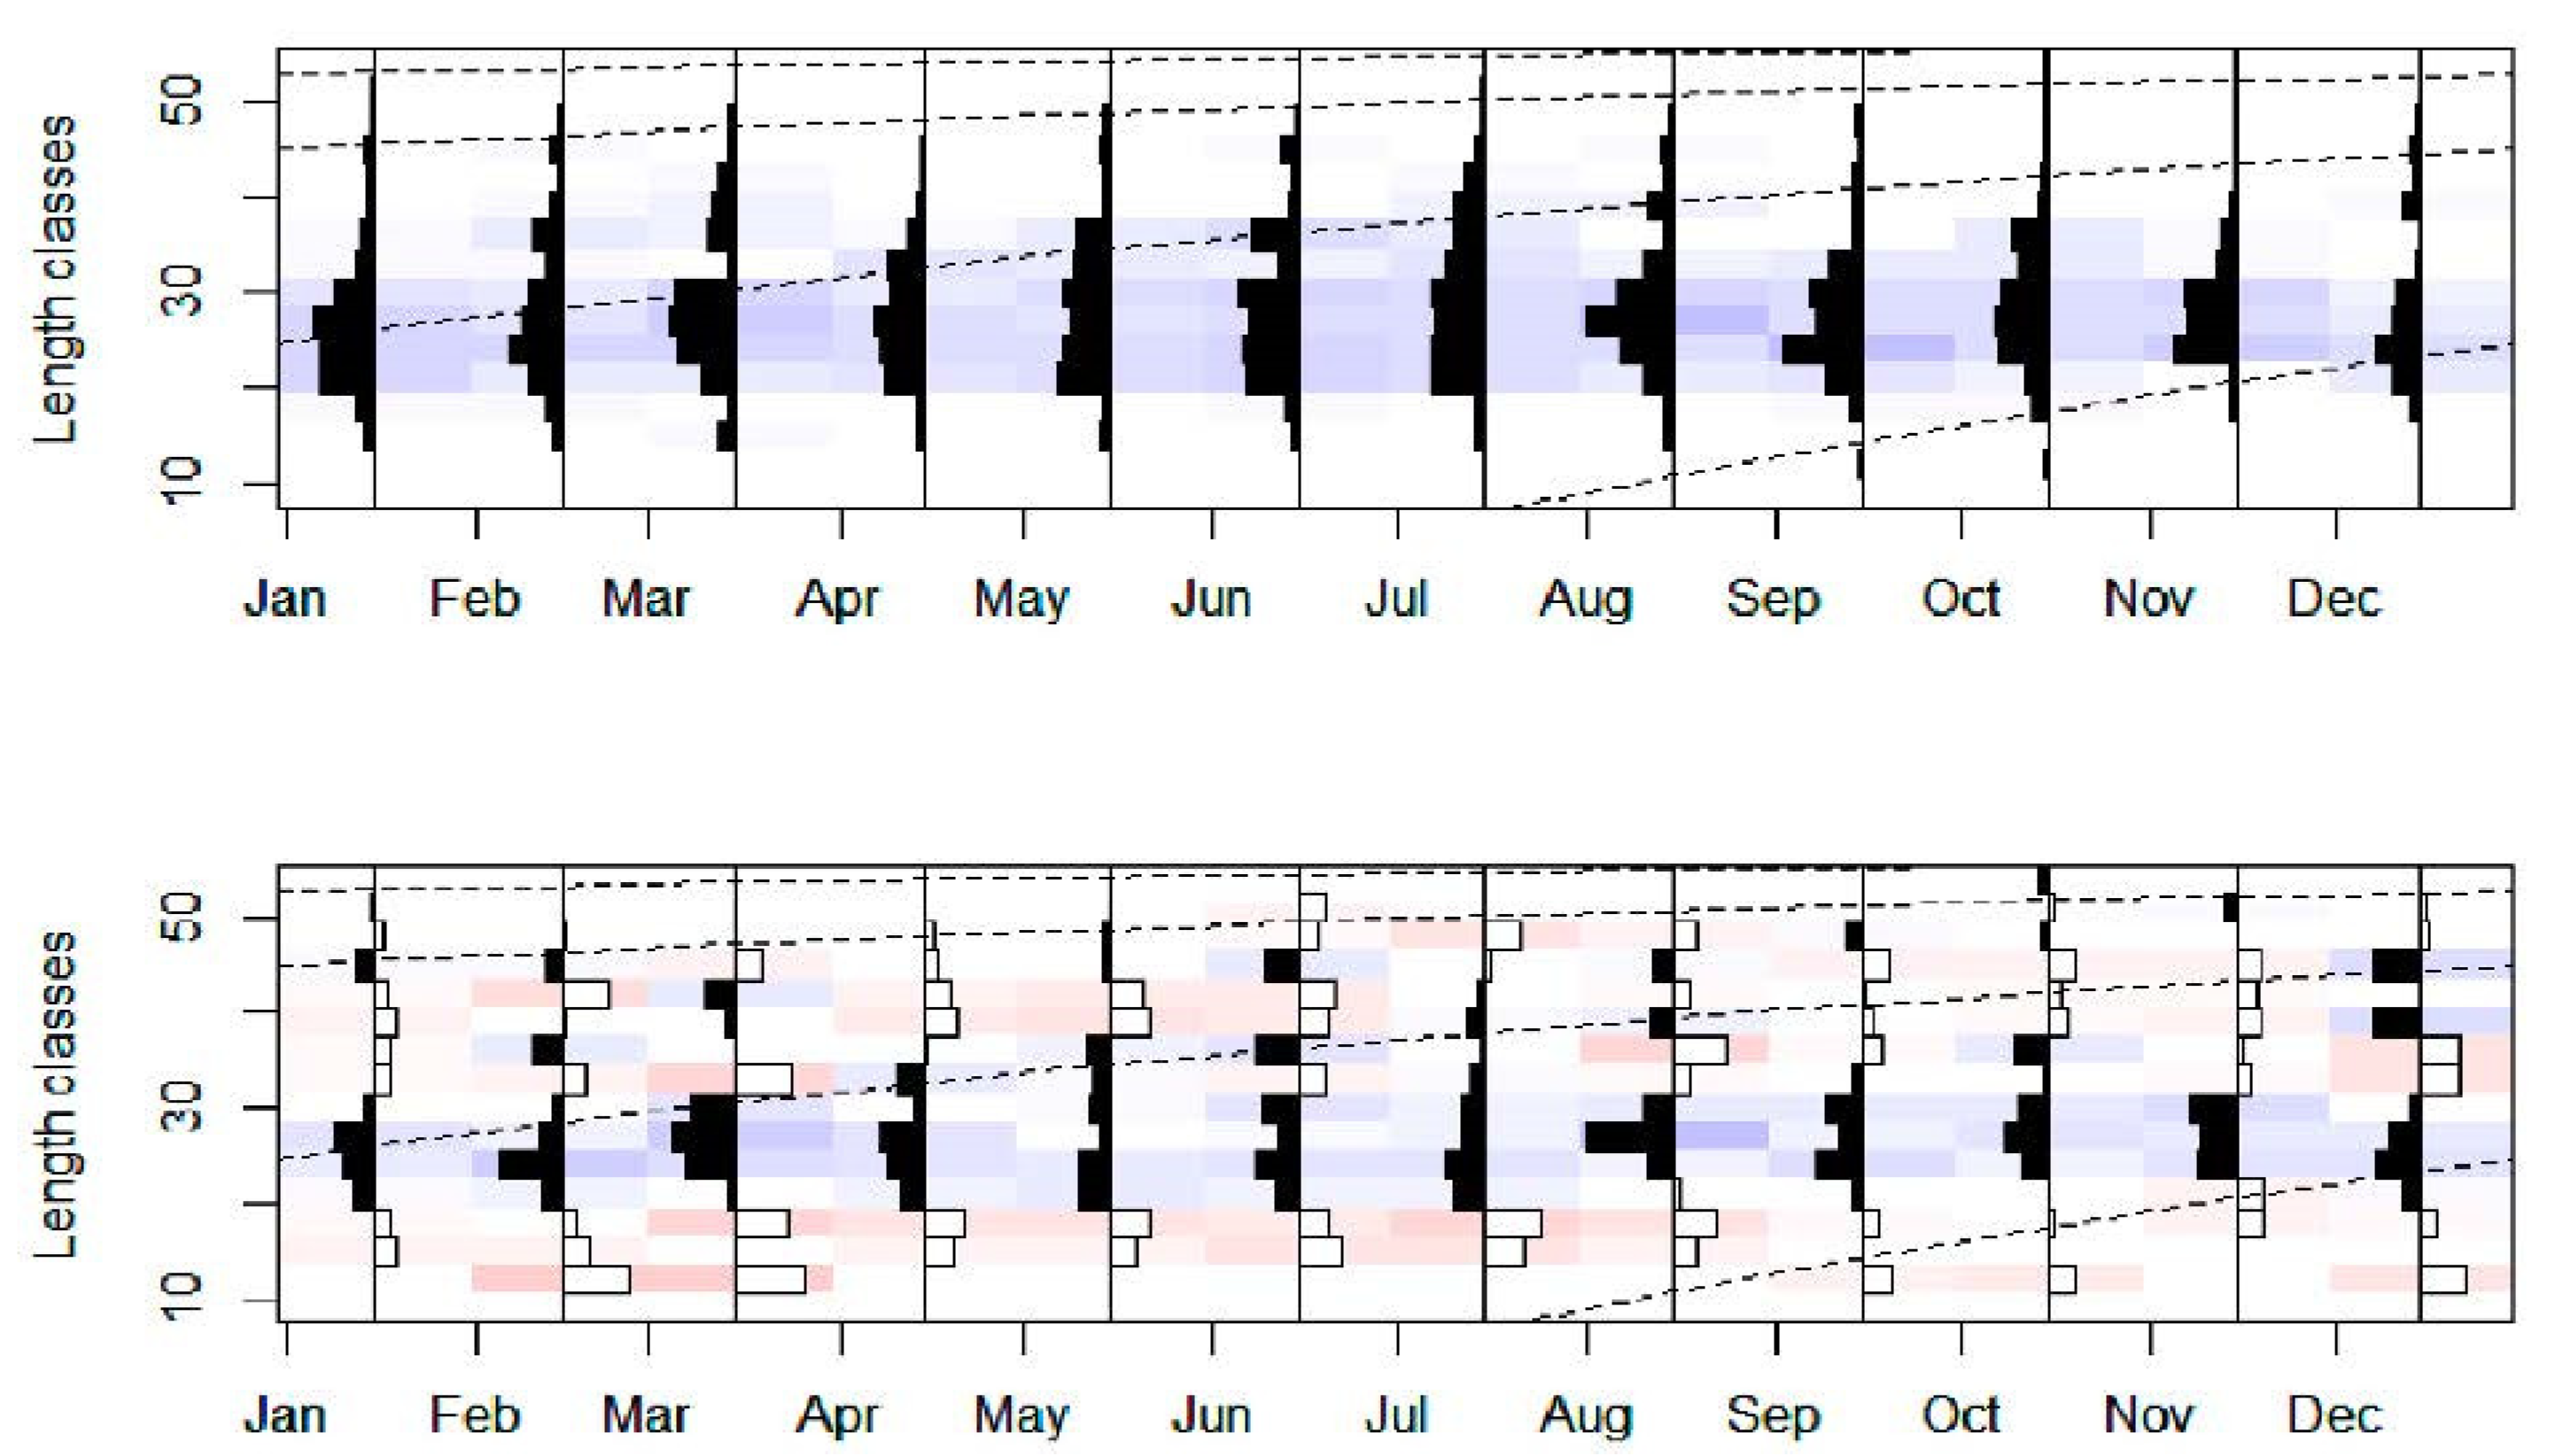
2.3.1. Estimation of Growth Parameters
2.3.2. Fishing Mortality and Exploitation
2.3.3. Length-Based Indicators (LBIs)
2.3.4. Fisheries Reference Points from Catch and Resilience
CMSY Analysis
- (i)
- Prior r-k Range Determination
- (ii)
- Estimation of Prior Biomass Ranges
- (iii)
- Estimation of Probable Reference Points from Viable r-k Pairs
Bayesian Schaefer Model (BSM)
3. Results
3.1. Growth Parameters
3.2. Fishing Mortality and Exploitation Rate
3.3. Length-Based Indicators (LBIs)
3.4. Stock Status and Exploitation from Catch and Resilience
4. Discussion
4.1. Stock Condition Analysis Based on TropFishR

| Regions | L∞ (cm) | K | Φ | M | Z | F | E | Emax | Lc | Year | Reference |
|---|---|---|---|---|---|---|---|---|---|---|---|
| Bangladesh waters | 58.70 | 0.90 | 3.50 | 1.36 | 4.19 | 2.83 | 0.68 | 0.66 | 27.00 | 2015 | [11] |
| 53.70 | 0.86 | 3.40 | 1.36 | 3.51 | 2.16 | 0.61 | 0.58 | 19.87 | 2002 | [20] | |
| 61.10 | 0.74 | - | 1.16 | 2.41 | 1.25 | 0.52 | - | 35.00 | 1992 | [25] | |
| 58.30 | 0.74 | 3.40 | 1.18 | 2.61 | 1.43 | 0.55 | - | 30.00 | 1995 | ||
| 61.50 | 0.83 | 3.50 | 1.28 | 3.29 | 2.01 | 0.61 | 0.69 | 30.30 | 1997 | ||
| 66.00 | 0.67 | 3.46 | 1.25 | 3.43 | 2.18 | 0.63 | 0.60 | 27.06 | 1998 | ||
| 60.00 | 0.82 | 3.47 | 1.28 | 3.77 | 2.49 | 0.66 | 0.59 | 22.80 | 1999 | ||
| 62.50 | 0.72 | 3.45 | 1.17 | 2.79 | 1.62 | 0.58 | 0.46 | 13.12 | 2000 | ||
| 52.00 | 0.71 | 3.28 | 1.22 | 2.61 | 1.39 | 0.53 | - | - | 2006 | [31] | |
| 53.55 | 0.61 | 3.24 | 1.10 | 2.83 | 1.73 | 0.61 | - | - | 2003 | [78] | |
| 57.84 | 0.94 | 3.50 | 1.03 | 3.05 | 2.02 | 0.66 | 0.62 | 20.48 | 2018 | Present study | |
| North Arabian Gulf, Kuwait | 52.50 | 0.36 | 3.00 | 0.40 | 1.20 | 0.80 | 0.67 | - | - | 1992 | [8] |
| Bay of Bengal, India | 47.80 | 1.90 | 3.64 | 1.25 | 1.98 | 0.73 | 0.37 | 0.56 | 26.56 | 2010 | [32] |
| Indus River, Pakistan | 31.50 | 1.50 | 2.13 | 2.21 | 2.89 | 0.67 | 0.23 | 1.00 | - | 2012 | [79] |
| North-west Arabian Gulf, Iraq | 61.5 | 0.28 | 3.02 | 0.55 | 1.66 | 1.11 | 0.67 | 0.72 | 27.80 | 2013 | [80] |
| North-west Arabian Gulf, Iran | 42.20 | 0.78 | 3.16 | 1.29 | 4.53 | 3.24 | 0.72 | - | 22.30 | 2008 | [81] |
4.2. Stock Condition Analysis Based on Length Based Indicators (LBIs)
4.3. Stock Status Analysis Based on CMSY
4.4. Management Recommendations
4.5. Recommendations for Future Research
5. Conclusions
Author Contributions
Funding
Informed Consent Statement
Data Availability Statement
Acknowledgments
Conflicts of Interest
References
- Mora, C.; Myers, R.A.; Coll, M.; Libralato, S.; Pitcher, T.J.; Sumaila, R.U.; Zeller, D.; Watson, R.; Gaston, K.J.; Worm, B. Management Effectiveness of the World’s Marine Fisheries. PLoS Biol. 2009, 7, e1000131. [Google Scholar] [CrossRef]
- Froese, R. Keep it simple: Three indicators to deal with overfishing. Fish Fish. 2004, 5, 86–91. [Google Scholar] [CrossRef]
- Spaet, J.L.Y.; Thorrold, S.R.; Berumen, M.L. A review of elasmobranch research in the Red Sea. J. Fish Biol. 2012, 80, 952–965. [Google Scholar] [CrossRef]
- Jabado, R.W.; Spaet, J.L.Y. Elasmobranch fisheries in the Arabian Seas Region: Characteristics, trade and management. Fish Fish. 2017, 18, 1096–1118. [Google Scholar] [CrossRef]
- Jabado, R.W.; Al Ghais, S.M.; Hamza, W.; Shivji, M.S.; Henderson, A.C. Shark diversity in the Arabian/Persian Gulf higher than previously thought: Insights based on species composition of shark landings in the United Arab Emirates. Mar. Biodivers. 2015, 45, 719–731. [Google Scholar] [CrossRef]
- Ye, Y.; Cochrane, K.; Bianchi, G.; Willmann, R.; Majkowski, J.; Tandstad, M.; Carocci, F. Rebuilding global fisheries: The World Summit goal, costs and benefits. Fish Fish. 2013, 14, 174–185. [Google Scholar] [CrossRef]
- Bell, J.D.; Watson, R.A.; Ye, Y. Global fishing capacity and fishing effort from 1950 to 2012. Fish Fish. 2017, 18, 489–505. [Google Scholar] [CrossRef]
- AL-Baz, A.F.; Grove, D.J. Population biology of Sobour, Tenualosa ilisha (Hamilton- Buchanan) in Kuwait. Asian Fish. Soc. 1995, 8, 239–254. [Google Scholar]
- Arai, T.; Amalina, R. New record of a tropical shad Tenualosa ilisha (Teleostei: Clupeidae) in Malaysian waters. Mar. Biodivers. Rec. 2014, 7, 1–4. [Google Scholar] [CrossRef]
- Islam, M.M.; Essam, Y.M.; Ali, L. Economic incentives for sustainable Hilsa fishing in Bangladesh: An analysis of the legal and institutional framework. Mar. Policy 2016, 68, 8–22. [Google Scholar] [CrossRef]
- Rahman, M.J.; Wahab, M.A.; Amin, S.M.N.; Nahiduzzaman, M.; Romano, N. Catch Trend and Stock Assessment of Hilsa Tenualosa ilisha Using Digital Image Measured Length-Frequency Data. Mar. Coast. Fish. 2018, 10, 386–401. [Google Scholar] [CrossRef]
- Hossain, M.S.; Sharifuzzaman, S.M.; Rouf, M.A.; Pomeroy, R.S.; Hossain, M.D.; Chowdhury, S.R.; Uddin, S.A. Tropical Hilsa shad (Tenualosa ilisha): Biology, fishery and management. Fish Fish. 2018, 20, 1–22. [Google Scholar] [CrossRef]
- Pillay, S.R.; Rosa, H. Synopsis of Biological Data on Hilsa, Hilsa ilisha (Ham.1822). In Fisheries Synopsis 25; FAO (Food and Agriculture Organization of the United Nations): Rome, Italy, 1963. [Google Scholar]
- Ahsan, D.A.; Naser, M.N.; Bhaumik, U.; Hazra, S.; Bhattacharya, S.B. Migration, Spawning Patterns and Conservation of Hilsa Shad (Tenualosa ilisha) in Bangladesh and India. Ecosystems for Life: A Bangladesh-India Initiative; Academic Foundation: New Delhi, India, 2014. [Google Scholar]
- Hossain, M.S.; Sarker, S.; Sharifuzzaman, S.M.; Chowdhury, S.R. Discovering spawning ground of Hilsa Shad (Tenualosa ilisha) in the coastal waters of Bangladesh. Ecol. Model. 2014, 282, 59–68. [Google Scholar] [CrossRef]
- Dutton, I.M.; Hossain, M.S.; Kabir, H. Enhanced Coastal Fisheries in Bangladesh Midterm Performance Evaluation Report; USAID/ACME Contract No. AID-388-C-14-00001; International Business & Technical Consultants, Inc.: Vienna, VA, USA, 2018; p. 99. [Google Scholar]
- Department of Fisheries (DoF). National Fish Week 2017 Compendium; Department of Fisheries, Ministry of Fisheries and Livestock: Dhaka, Bangladesh, 2017; p. 160. (In Bengali)
- Wahab, M.A.; Golder, M.I. Hilsa Fisheries Management Action Plan (Updated Short Edition). In ECOFISH-Bangladesh Project; World Fish (Bangladesh and South Asia Office and Department of Fisheries): Dhaka, Bangladesh, 2016. [Google Scholar]
- Mohammed, E.Y.; Ali, L.; Ali, S.; Hussein, B.; Wahab, M.A.; Sage, N. Hilsa’s Non-Consumptive Value in Bangladesh: Estimating the Non-Consumptive Value of the Hilsa Fishery in Bangladesh Using the Contingent Valuation Method; Working Paper; International Institute for Environment and Development: London, UK, 2016. [Google Scholar]
- Haldar, G.C.; Amin, S.M.N. Population dynamics of male and female Hilsa, Tenualosa ilisha of Bangladesh. Pak. J. Biol. Sci. 2005, 8, 307–313. [Google Scholar]
- Cope, J.; Punt, A.E. Length-based reference points for data-limited situations: Applications and restrictions. Mar. Coast. Fish. Dyn. Manag. Ecosyst. Sci. 2009, 1, 169–186. [Google Scholar] [CrossRef]
- Haddon, M. Modelling and Quantitative Methods in Fisheries, 2nd ed.; Taylor & Francis: Boca Raton, FL, USA, 2010. [Google Scholar]
- Martell, S.; Froese, R. A simple method for estimating MSY from catch and resilience. Fish Fish. 2012, 14, 504–514. [Google Scholar] [CrossRef]
- Punt, A.E.; Smith, A.D.M.; Smith, D.C.; Tuck, G.N.; Klaer, N.L. Selecting relative abundance proxies for BMSY and BMEY. ICES J. Mar. Sci. 2013, 71, 469–483. [Google Scholar] [CrossRef]
- BoBLME (Bay of Bengal Large Marine Ecosystem Project). Status of Hilsa (Tenualosa ilisha) Management in the Bay of Bengal—An Assessment of Population Risk and Data Gaps for More Effective Regional Management; BOBLME: Phuket, Thailand, 2010; p. 70. [Google Scholar]
- Miah, M.S.; Shafi, M. Stock assessment and management of Hilsa (In Bengali). In Seminar on Sustainable Fish and Shrimp Culture in Bangladesh; BFRI: Mymensingh, Bangladesh, 1995; pp. 101–105. [Google Scholar]
- Miah, M.S.; Rahman, M.A.; Haldar, G.C.; Mazid, M.A. Estimation of maximum sustainable yield (MSY) of Hilsa (Tenualosa ilisha Ham.) in the Meghna River of Bangladesh. J. Fish. Res. 1998, 2, 177–182. [Google Scholar]
- Rahman, M.J.; Cowx, I.G. Population dynamics of Hilsa shad in Bangladesh waters. Asian Fish. Sci. 2008, 1, 85–100. [Google Scholar]
- Amin, S.M.N.; Rahman, M.A.; Haldar, G.C.; Mazid, M.A.; Milton, D.A. Population dynamics and stock assessment of Hilsa shad, Tenualosa ilisha in Bangladesh. Asian Fish. Sci. 2002, 15, 123–128. [Google Scholar]
- Mome, M.A. The Potential of the Artisanal Hilsa Fishery in Bangladesh: An Economically Efficient Fisheries Policy. In Final Project Report, Fisheries Training Program; The United Nations University: Reykjavik, Iceland, 2007; p. 57. [Google Scholar]
- Ahmed, M.S.; Sharif, A.S.M.; Latifa, G.A. Age, growth and mortality of Hilsa shad, Tenualosa ilisha in the river Meghna, Bangladesh. Asian J. Biol. Sci. 2008, 1, 69–76. [Google Scholar] [CrossRef]
- Dutta, S.; Maity, S.; Chanda, A.; Hazra, S. Population structure, mortality rate and exploitation rate of Hilsa Shad (Tenualosa ilisha) in West Bengal Coast of Northern Bay of Bengal, India. World J. Fish Mar. Sci. 2012, 4, 54–59. [Google Scholar]
- Bala, B.K.; Arshad, F.M.; Alias, E.F.; Sidique, S.F.; Noh, K.M.; Rowshon, M.K.; Islam, Q.M.M.; Islam, M.M. Sustainable exploitation of Hilsa fish (Tenualosa ilisha) population in Bangladesh: Modeling and policy implications. Ecol. Model. 2014, 283, 19–30. [Google Scholar] [CrossRef]
- Fernandes, J.A.; Kay, S.; Hossain, M.A.R.; Ahmed, M.; Cheung, W.W.L.; Lazar, A.N.; Barange, M. Projecting marine fish production and catch potential in Bangladesh in the 21st century under long-term environmental change and management scenarios. ICES J. Mar. Sci. 2016, 73, 1357–1369. [Google Scholar] [CrossRef]
- Das, I.; Hazra, S.; Das, S.; Giri, S.; Maity, S.; Ghosh, S. Present Status of the Sustainable Fishing Limits for Hilsa Shad in the northern Bay of Bengal, India. Proc. Natl. Acad. Sci. India B Biol. Sci. 2019, 89, 525–532. [Google Scholar] [CrossRef]
- Babcock, E.A.; Coleman, R.; Karnauskas, M.; Gibson, J. Length-based indicators of fishery and ecosystem status: Glover’s Reef Marine Reserve, Belize. Fish. Res. 2013, 147, 434–445. [Google Scholar] [CrossRef]
- Nadon, M.O.; Ault, J.S.; Williams, I.D.; Smith, S.G.; DiNardo, G.T. Length-Based Assessment of Coral Reef Fish Populations in the Main and Northwestern Hawaiian Islands. PLoS ONE 2015, 10, e0133960. [Google Scholar] [CrossRef] [PubMed]
- Herrón, P.; Mildenberger, T.K.; Diaz, J.M.; Wolff, M. Assessment of the stock status of small-scale and multi-gear fisheries resources in the tropical Eastern Pacific region. Reg. Stud. Mar. Sci. 2018, 24, 311–323. [Google Scholar] [CrossRef]
- Huq, K.A.; Ferdous, K.S.; Basak, B.K.; Ali, M.Y. Status of Hilsa fishery in the Meghna River adjacent to Bhola district, Bangladesh. J. Life Sci. 2006, 18, 97–105. [Google Scholar]
- Hilsa Fisheries Conservation, Development and Management Technique; Department of Fisheries: Dhaka, Bangladesh, 2008; p. 42. (In Bengali)
- Management Advisory for the Bay of Bengal Hilsa Fishery; BoBLME (Bay of Bengal Large Marine Ecosystem): Dhaka, Bangladesh, 2012; p. 6.
- Islam, M.; Mohammed, E.Y.; Ali, L. Economic Incentives for Sustainable Hilsa Fish Management in Bangladesh: An Analysis of the Legal and Institutional Framework; IIED Working Paper; IIED: London, UK, 2014; p. 36. [Google Scholar]
- Cadima, E.L. Fish Stock Assessment Manual; FAO Fisheries Technical Paper 393; DANIDA: Rome, Italy, 2003. [Google Scholar]
- Sparre, P.; Venema, S.C. Introduction to Tropical Fish Stock Assessment—Part 1: Manual; FAO Fisheries Technical Paper 306/1 Rev. 2; FAO: Rome, Italy, 1998; pp. 185–214. [Google Scholar]
- Mildenberger, T.K.; Taylor, M.; Wolff, M. TropFish: An R package for fisheries analysis with length-frequency data. Methods Ecol. Evol. 2017, 8, 1520–1527. [Google Scholar] [CrossRef]
- R-Core-Team. A Language and Environment for Statistical Computing; R Foundation for Statistical Computing: Vienna, Austria, 2017. [Google Scholar]
- Froese, R.; Demirel, N.; Coro, G.; Kleisner, K.M.; Winker, H. Estimating fisheries reference points from catch and resilience. Fish Fish. 2017, 18, 506–526. [Google Scholar] [CrossRef]
- Winker, H.; Carvalho, F.; Sharma, R.; Parker, D.; Kerwath, S. Initial results for north and south Atlantic shortfin Mako (Isurus oxyrinchus) stock assessments using the Bayesian surplus production model JABBA and the catch-resilience method CMSY. ICCAT 2017, 74, 1836–1866. [Google Scholar]
- Milton, D.A.; Chenery, S.R. Movement patterns of the tropical shad hilsa (Tenualosa ilisha) inferred from transects of 87Sr/86Sr isotope ratios in their otoliths. Can. J. Fish. Aquat. Sci. 2001, 60, 1376–1385. [Google Scholar] [CrossRef]
- Salini, J.P.; Milton, D.A.; Rahman, M.J.; Hussain, M.G. Allozyme and morphological variation throughout the geographic range of the tropical shad, hilsa Tenualosa ilisha. Fish Res. 2004, 66, 53–69. [Google Scholar] [CrossRef]
- Bhaumik, U. Stock Profile of Hilsa Shad Population in Bay of Bengal Region—A Review. Int. J. Curr. Res. Acad. Rev. 2016, 4, 22–38. [Google Scholar] [CrossRef]
- DoF (Department of Fisheries). Yearbook of Fisheries Statistics of Bangladesh 2017–18; Department of Fisheries, Ministry of Fisheries and Livestock: Dhaka, Bangladesh, 2018.
- FAO (Food and Agricultural Organization of the United Nations). FAO Fisheries and Aquaculture–Online Query Panel. Available online: http://www.fao.org/fishery/statistics/global-capture-production/query/ (accessed on 23 January 2019).
- von Bertalanffy, L. A quantitative theory of organic growth (in- quiries on growth laws. II.). Hum. Biol. 1938, 10, 181–213. [Google Scholar]
- Pauly, D.; David, N. An objective method for determining fish growth from length-frequency data. ICLARM News Lett. 1980, 3, 13–15. [Google Scholar]
- Pauly, D.; David, N. ELEFAN I, a basic program for the objective extraction of growth parameters from length-frequency data. Ber. Dtsch. Wiss. Kommissuib Meeresforsch. 1981, 28, 205–211. [Google Scholar]
- Pauly, D. Studying single-species dynamics in a tropical multispecies context. In Theory and Management of Tropical Fisheries, Proceedings of the ICLARM/CSIRO Workshop on the Theory and Management of Tropical Multispecies Stocks, Cronulla, Australia, 12–21 January 1981; Pauly, D., Murphy, G.I., Eds.; International Centre for Living Aquatic Resources: Manila, Philippines, 1982; Volume 9, pp. 33–70. [Google Scholar]
- Schwamborn, R.; Mildenberger, T.K.; Taylor, M.H. Assessing source of uncertainty in length-based estimates of body growth in populations of fishes and macro-invertebrates with bootstrapped ELEFAN. Ecol. Model. 2019, 293, 37–51. [Google Scholar] [CrossRef]
- Taylor, M.; Mildenberger, T.K. Extending electronic length frequency analysis in R. Fish. Manag. Ecol. 2017, 24, 330–338. [Google Scholar] [CrossRef]
- Pauly, D.; Munro, J.L. Once more, on the composition of growth in fish and invertebrates. Fishbyte 1984, 2, 21. [Google Scholar]
- Pauly, D. Fish population dynamics in tropical waters: A manual for use with programmable calculator. ICLARM Stud. Rev. 1984, 8, 325. [Google Scholar]
- Then, A.Y.; Hoenig, J.M.; Hall, N.G.; Hewitt, D.A. Evaluating the predictive performance of empirical estimators of natural mortality rate using information on over 200 fish species. ICES J. Mar. Sci. 2015, 72, 82–92. [Google Scholar] [CrossRef]
- Gulland, J.A. The Fish Resources of the Ocean; Fishing News (Books): Surrey, UK, 1971. [Google Scholar]
- Beverton, R.J.H.; Holt, S.J. A review of methods for estimating mortality rates in fish populations, with special references to sources of bias in catch sampling. Rapports et Proces-Verbaux des Reunions 1956, 140, 67–83. [Google Scholar]
- Le Cren, E.D. The length-weight relationships and seasonal cycle in gonad weight and condition in the perch (Perca fluviatilis). J. Anim. Ecol. 1951, 20, 201–219. [Google Scholar] [CrossRef]
- Froese, R.; Binohlan, C. Empirical relationships to estimate asymptotic length, length at first maturity and length at maximum yield per recruit in fishes, with a simple method to evaluate length frequency data. J. Fish Biol. 2000, 56, 758–773. [Google Scholar] [CrossRef]
- Froese, R.; Pauly, D. FishBase. World Wide Web Electronic Publication. Available online: www.fishbase.org (accessed on 1 December 2019).
- Ricker, W.E. Computation and Interpretation of Bio-Logical Statistics of Fish Populations; Bulletin of the Fisheries Research Board of Canada: Ottawa, ON, Canada, 1975; p. 382. [Google Scholar]
- Schaefer, M. Some aspects of the dynamics of populations important to the management of the commercial marine fisheries. Inter.-Am. Trop. Tuna Comm. Bull. 1954, 1, 27–56. [Google Scholar]
- Islam, M.S.; Huq, Q.M.; Hossain, M.; Azad, S.A.; Das, N.N. Hilsa fishery in Bangladesh in 1985–1986. In Hilsa Investigations in Bangladesh; FAO-UNDP Project on Marine Fisheries Resources Management: Colombo, Sri Lanka, 1987. [Google Scholar]
- Barneche, D.R.; Robertson, D.R.; White, C.R.; Marshall, D.J. Fish reproductive energy output increases disproportionately with body size. Science 2018, 360, 642–645. [Google Scholar] [CrossRef]
- Annual Report on Hilsa Fisheries Development and Management; BFRI/RS: Mymensingh, Bangladesh, 1994; p. 21.
- Anderson, C.N.K.; Hsieh, C.; Sandin, S.A.; Hewitt, R.; Hollowed, A.; Beddington, J.; May, R.M.; Sugihara, G. Why fishing magnifies fluctuations in fish abundance. Nature 2018, 452, 835–839. [Google Scholar] [CrossRef]
- Hilborn, R.; Walters, C.J. Quantitative Fisheries Stock Assessment: Choice, Dynamics and Uncertainty, 2nd ed.; Chapman and Hall Inc.: New York, NY, USA, 1992; p. 570. [Google Scholar]
- Beverton, R.; Holt, S.J. On the Dynamics of Exploited Fish Populations; Fishery Investigations Series II; Chapman & Hall: London, UK, 1957; Volume 19. [Google Scholar]
- Hunter, A.; Speirs, D.C.; Heath, M.R. Fishery-induced changes to age and length dependent maturation schedules of three demersal fish species in the Firth of Clyde. Fish. Res. 2015, 170, 14–23. [Google Scholar] [CrossRef]
- Ault, J.S.; Smith, S.G.; Luo, J.G.; Monaco, M.E.; Appeldoorn, R.S. Length-based assessment of sustainability benchmarks for coral reef fishes in Puerto Rico. Environ. Conserv. 2008, 35, 221–231. [Google Scholar] [CrossRef]
- Amin, S.M.N.; Rahman, M.A.; Haldar, G.C.; Mazid, M.A.; Milton, D.A. Catch per unit effort, exploitation level and production of Hilsa shad in Bangladesh waters. Asian Fish. Sci. 2008, 21, 175–187. [Google Scholar]
- Panhwar, S.K.; Liu, Q. Population statistics of the migratory Hilsa shad, Tenualosa ilisha, in Sindh, Pakistan. J. Appl. Ichthyol. 2013, 29, 1091–1096. [Google Scholar] [CrossRef]
- Mohamed, A.M.; Qasim, A.M.H. Stock assessment and management of hilsa shad (Tenualosa ilisha) in Iraqi marine waters, northwest Arabian Gulf. Int. J. Fish. Aquat. Stud. 2014, 1, 1–7. [Google Scholar]
- Hashemi, S.; Mohammadi, G.; Eskandary, G. Population dynamics and stock assessment of hilsa shad, (Tenualosa ilisha, Hamilton- Buchanan, 1822) in coastal waters of Iran (Northwest of Persian Gulf). Aust. J. Basic Appl. Sci. 2010, 4, 5780–5786. [Google Scholar]
- Rochet, M.J.; Trenkel, V.M. Why and how could indicators be used in an ecosystem approach to fisheries management? In The Future of Fishery Science in North America; Springer Nature BV: Dordrecht, The Netherlands, 2009; pp. 209–226. [Google Scholar]
- Craig, J.F. Aging in fish. Can. J. Zool. 1985, 63, 1–8. [Google Scholar] [CrossRef]
- Beverton, R.J.H. Longevity in fish: Some ecological and evolutionary considerations. Basic Life Sci. 1987, 42, 161–185. [Google Scholar]
- Ottersen, G.; Hjermann, D.O.; Stenseth, N.C. Changes in spawning stock structure strengthen the link between climate and recruitment in a heavily fished cod (Gadus morhua) stock. Fish Oceanogr. 2006, 15, 230–243. [Google Scholar] [CrossRef]
- ICES. Report of the Workshop on the Development of Quantitative Assessment Methodologies Based on Life-history Traits, Exploitation Characteristics, and Other Relevant Parameters for Data-Limited Stocks (WKLIFE IV). Proceedings of International Council for the Exploration of the Sea Conseil International pour l’Exploration de la Mer, Lisbon, Portugal, 27–31 October 2014; p. 243. [Google Scholar]
- Rosenberg, A.A.; Fogarty, M.J.; Cooper, A.B. Developing New Approaches to Global Stock Status Assessment and Fishery Production Potential of the Seas; FAO Fisheries and Aquaculture Circular No. 1086; FAO: Rome, Italy, 2014. [Google Scholar]


| Parameters | Value | Comments |
|---|---|---|
| Growth parameters | ||
| Asymptotic Length (L∞) | 57.84 cm | If there was no fishing pressure/predation/starvation/disease, Hilsa would reach this length. |
| Growth Coefficient (K) | 0.94 year−1 | Moderately higher growth rate. |
| tanchor | 0.40 | Yearly repeating growth curves cross length equal to zero on 07 June. |
| Growth Performance Index (Φ) | 3.50 | High |
| Mortality and Exploitation | ||
| Natural Mortality (M) | 1.03 year−1 | Natural mortality is moderately high. |
| Total Mortality (Z) | 3.05 year−1 | Comparatively high. |
| Fishing Mortality (Fcurr) | 2.02 year−1 | Significantly higher than natural mortality. |
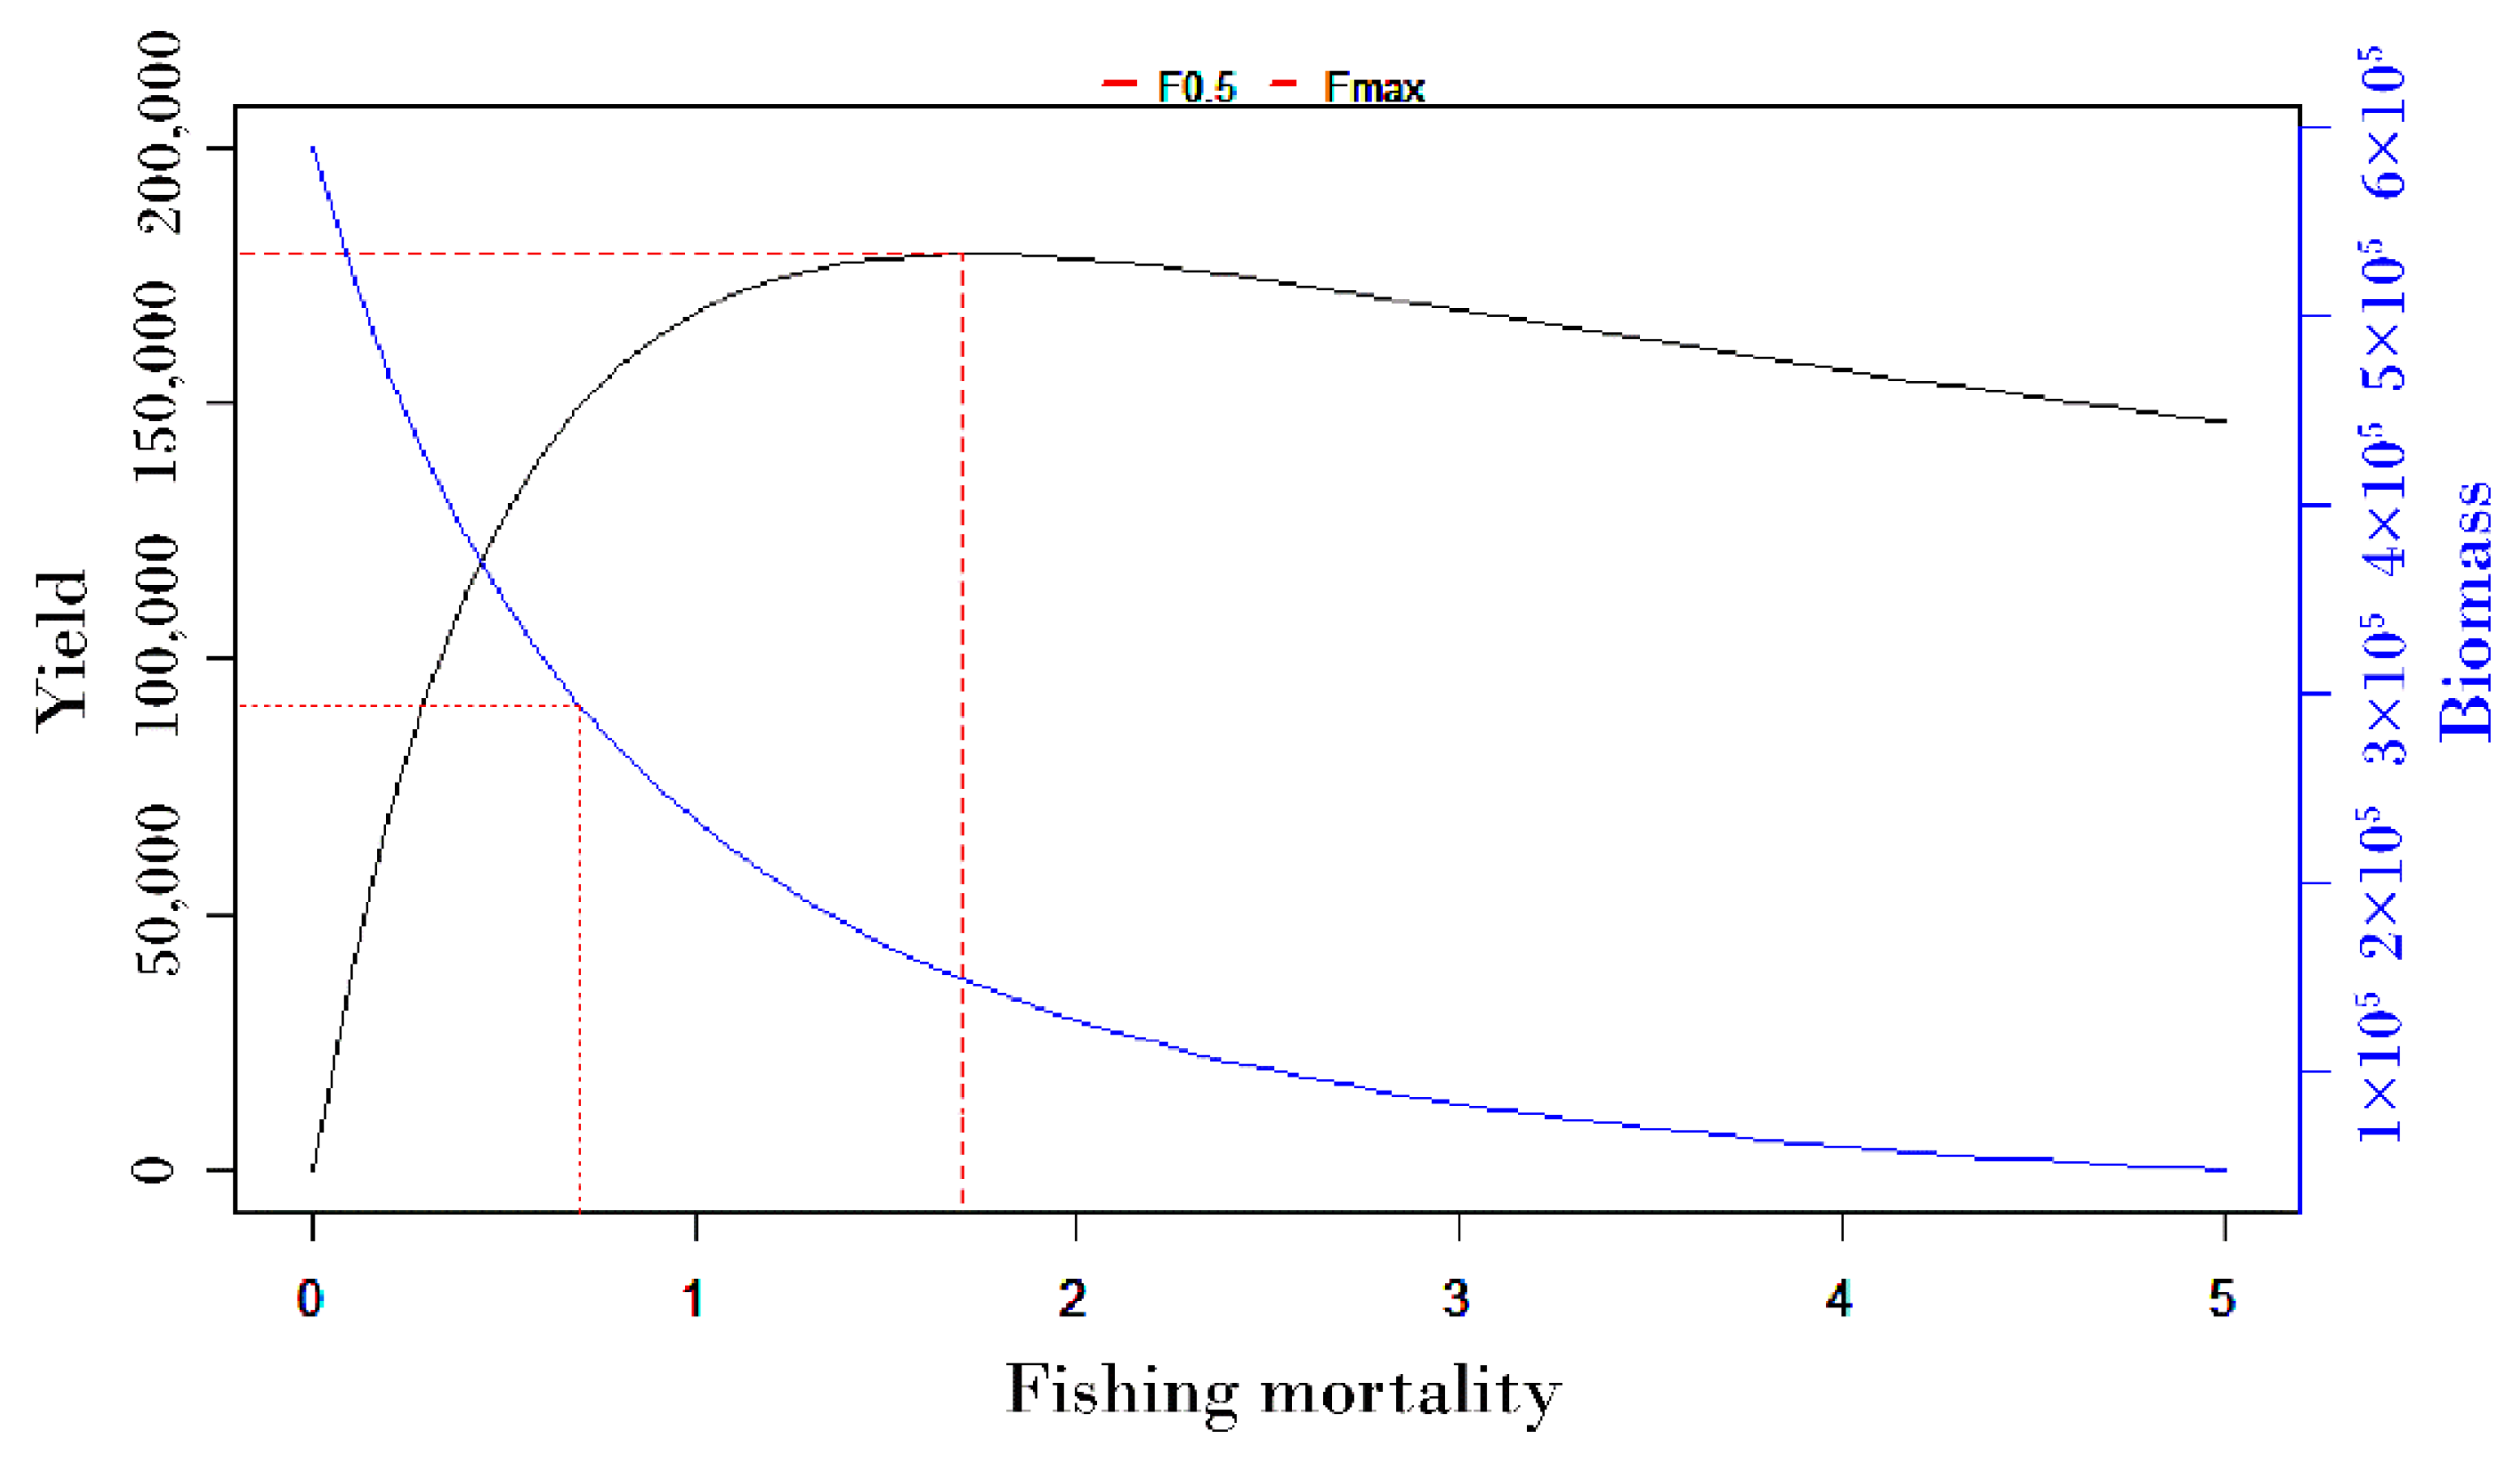
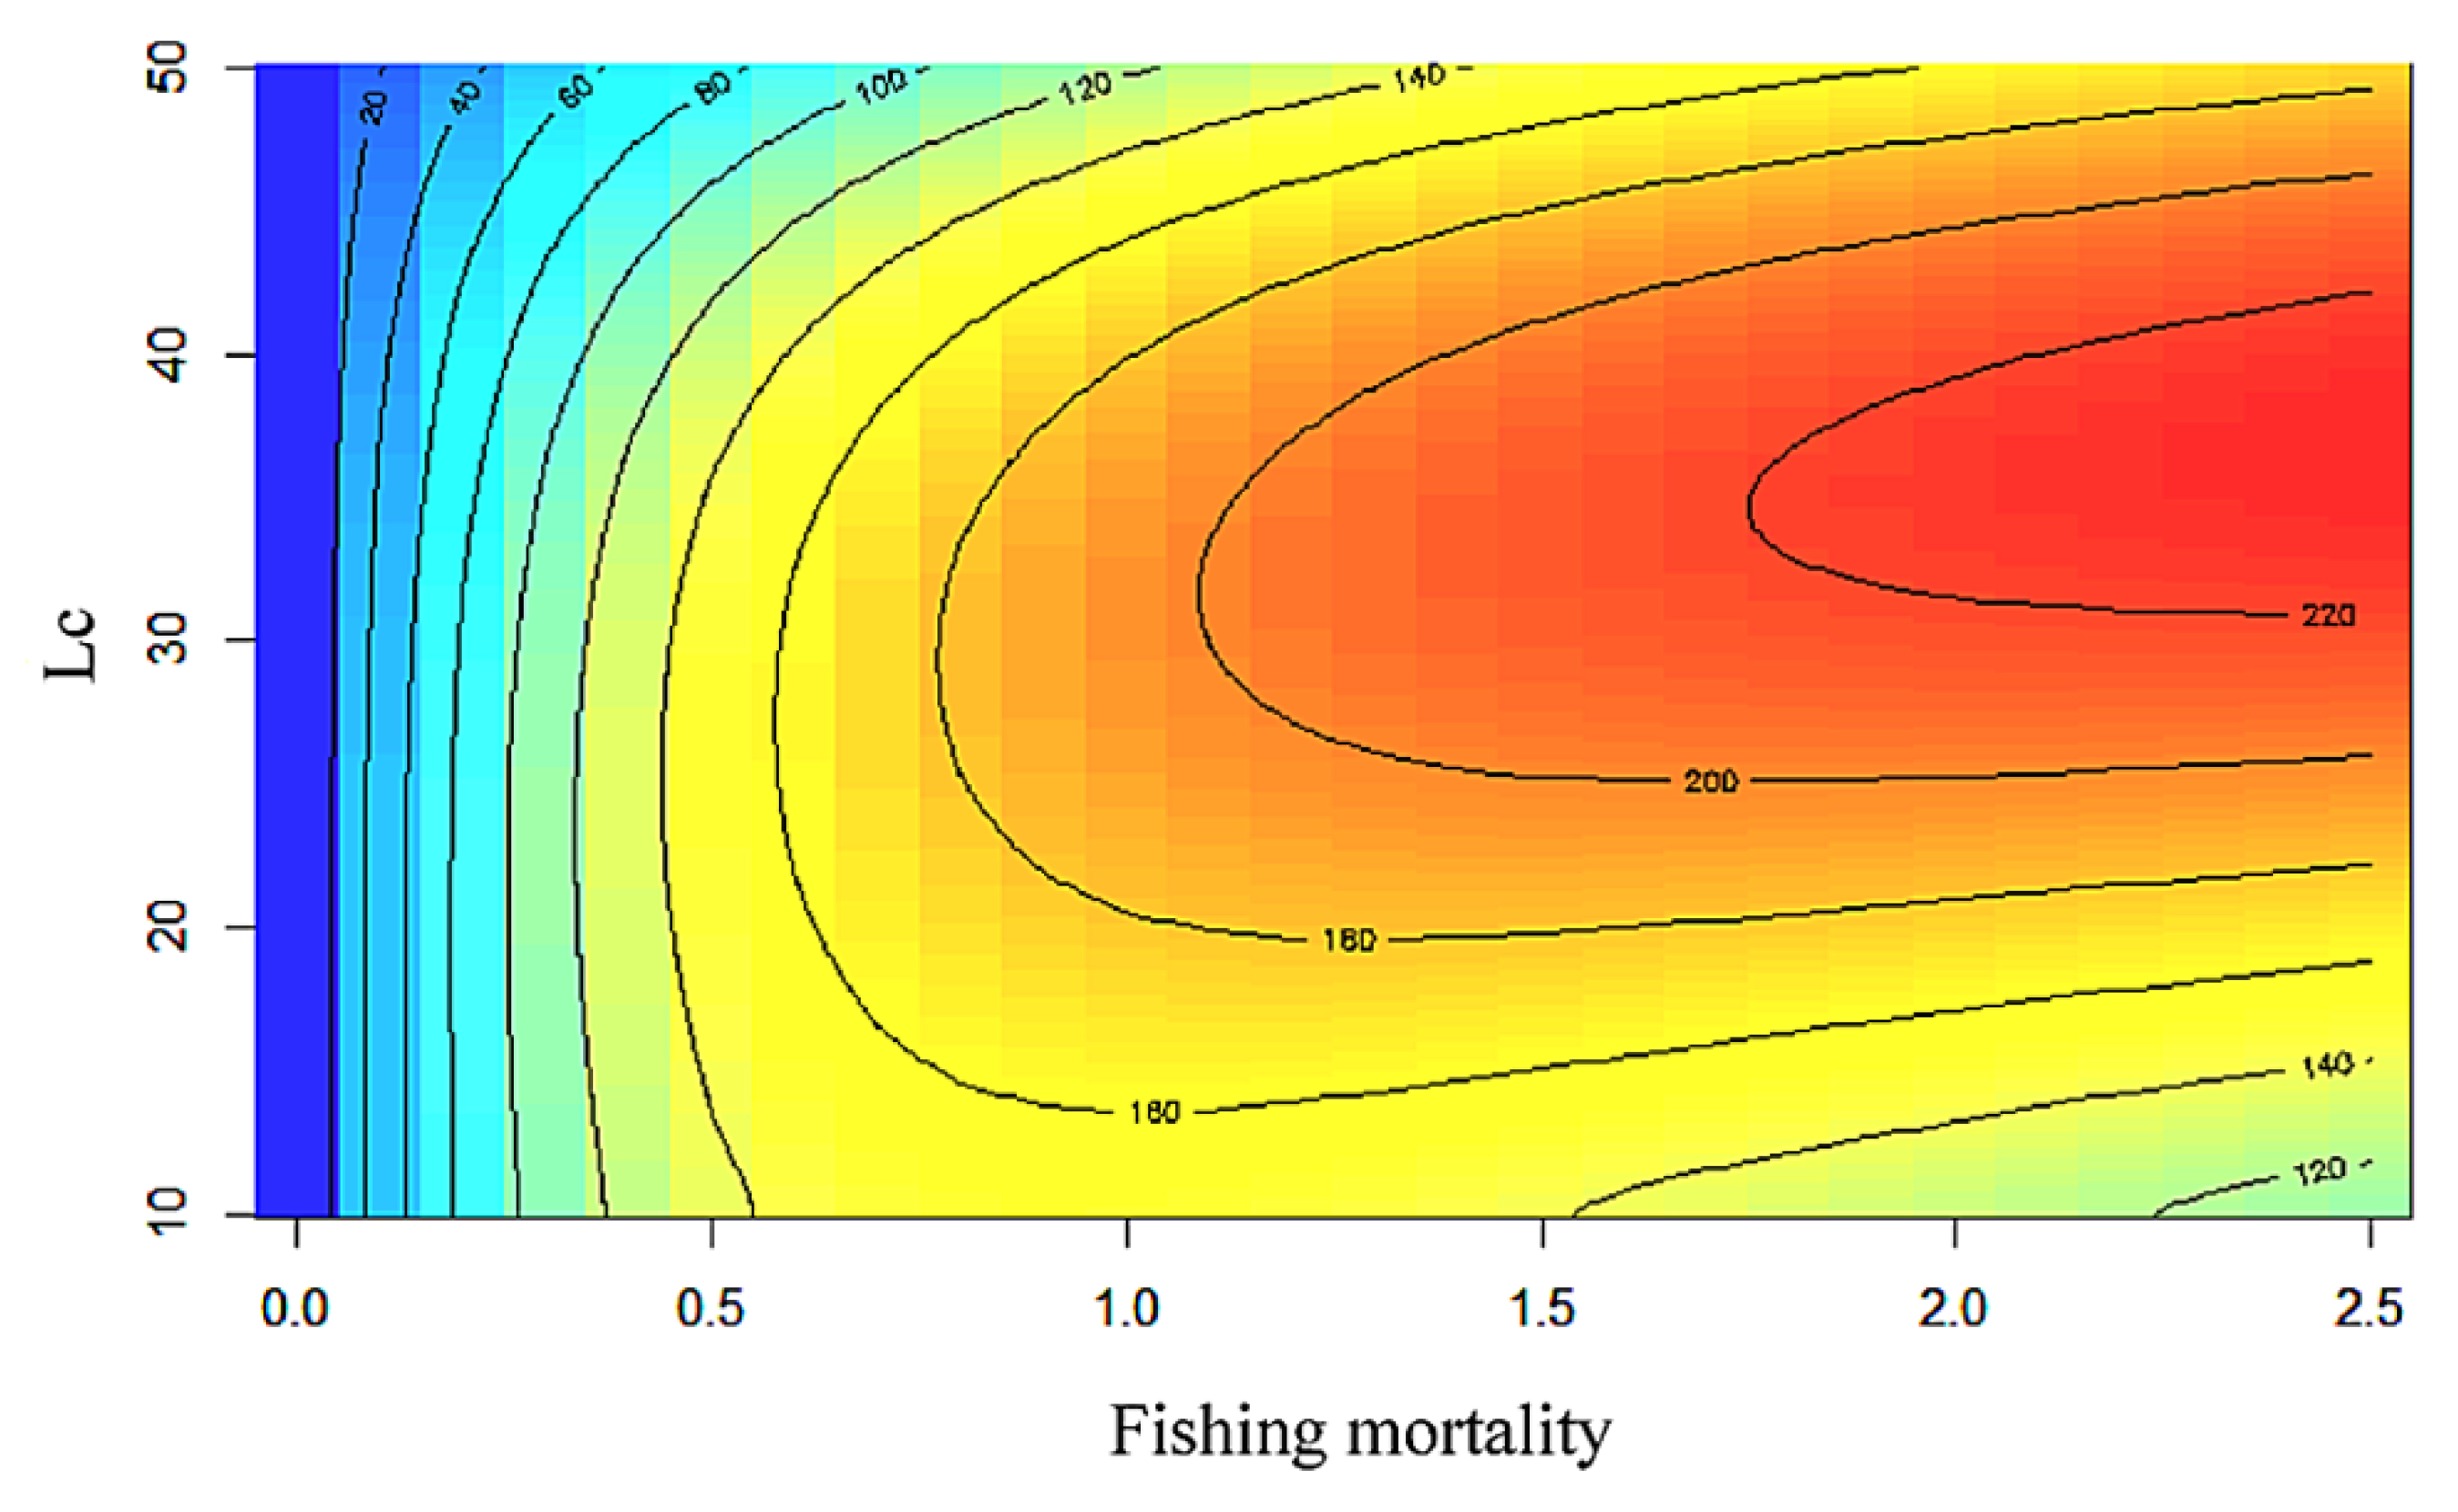
| Fmax | 1.70 year−1 | Fishing mortality at maximum yield per recruit. |
| F0.1 | 1.00 year−1 | Fishing mortality at which the marginal gain in yield per recruit decreases to an arbitrary 10% from that at F = 0. |
| F0.5 | 0.70 year−1 | Fishing mortality reduces the population to 50% of unfished spawning biomass. |
| Current Exploitation (Ecurr) | 0.66 | 32% higher than the threshold level, indicating overexploitation. |
| Emax | 0.62 | Maximum exploitation level to obtain optimum yield. |
| E0.1 | 0.49 | Maximum exploitation level to obtain biologically optimum yield. |
| E0.5 | 0.40 | Maximum exploitation level to obtain 50% of the biomass as annual yield. |
| Length at First Capture (Lc) | 20.48 cm | The length class in the population has a 50% probability of being captured. |
| Lm | Lopt | Pmat | Popt | Pmega | Pobj | Stock Condition Interpretation | Probability |
|---|---|---|---|---|---|---|---|
| 26 | 27.13 | 0.56 | 0.41 | 0.33 | 1.30 | SB < RP | 100% |
| 27 | 28.23 | 0.50 | 0.39 | 0.29 | 1.18 | SB < RP | 100% |
| 28 | 29.33 | 0.45 | 0.37 | 0.27 | 1.09 | SB < RP | 100% |
| 29 | 30.44 | 0.40 | 0.32 | 0.25 | 1.00 | SB < RP | 100% |
| 30 | 31.54 | 0.32 | 0.31 | 0.18 | 0.83 | SB < RP | 7% |
| 31 | 32.65 | 0.29 | 0.29 | 0.15 | 0.73 | SB < RP | 7% |
| 32 | 33.76 | 0.26 | 0.26 | 0.13 | 0.65 | SB < RP | 19% |
| 33 | 34.87 | 0.25 | 0.23 | 0.09 | 0.57 | SB < RP | 19% |
| Models Output in CMSY | r (1/Year) | k/103 MT | MSY/103 MT |
|---|---|---|---|
| CMSY | 0.566 0.407–0.785 | 2230 1357–3665 | 315 226–439 |
| BSM | 0.464 0.326–0.662 | 2264 1650–3107 | 263 227–305 |
| Parameters | Value | 95% CI |
|---|---|---|
| FMSY | 0.232 | 0.163–0.331 |
| MSY | 263 | 227–305 |
| BMSY | 1132 | 825–1554 |
| 2.5th–97.5th percentile | ||
| Biomass in the last year | 1088 | 834–1354 |
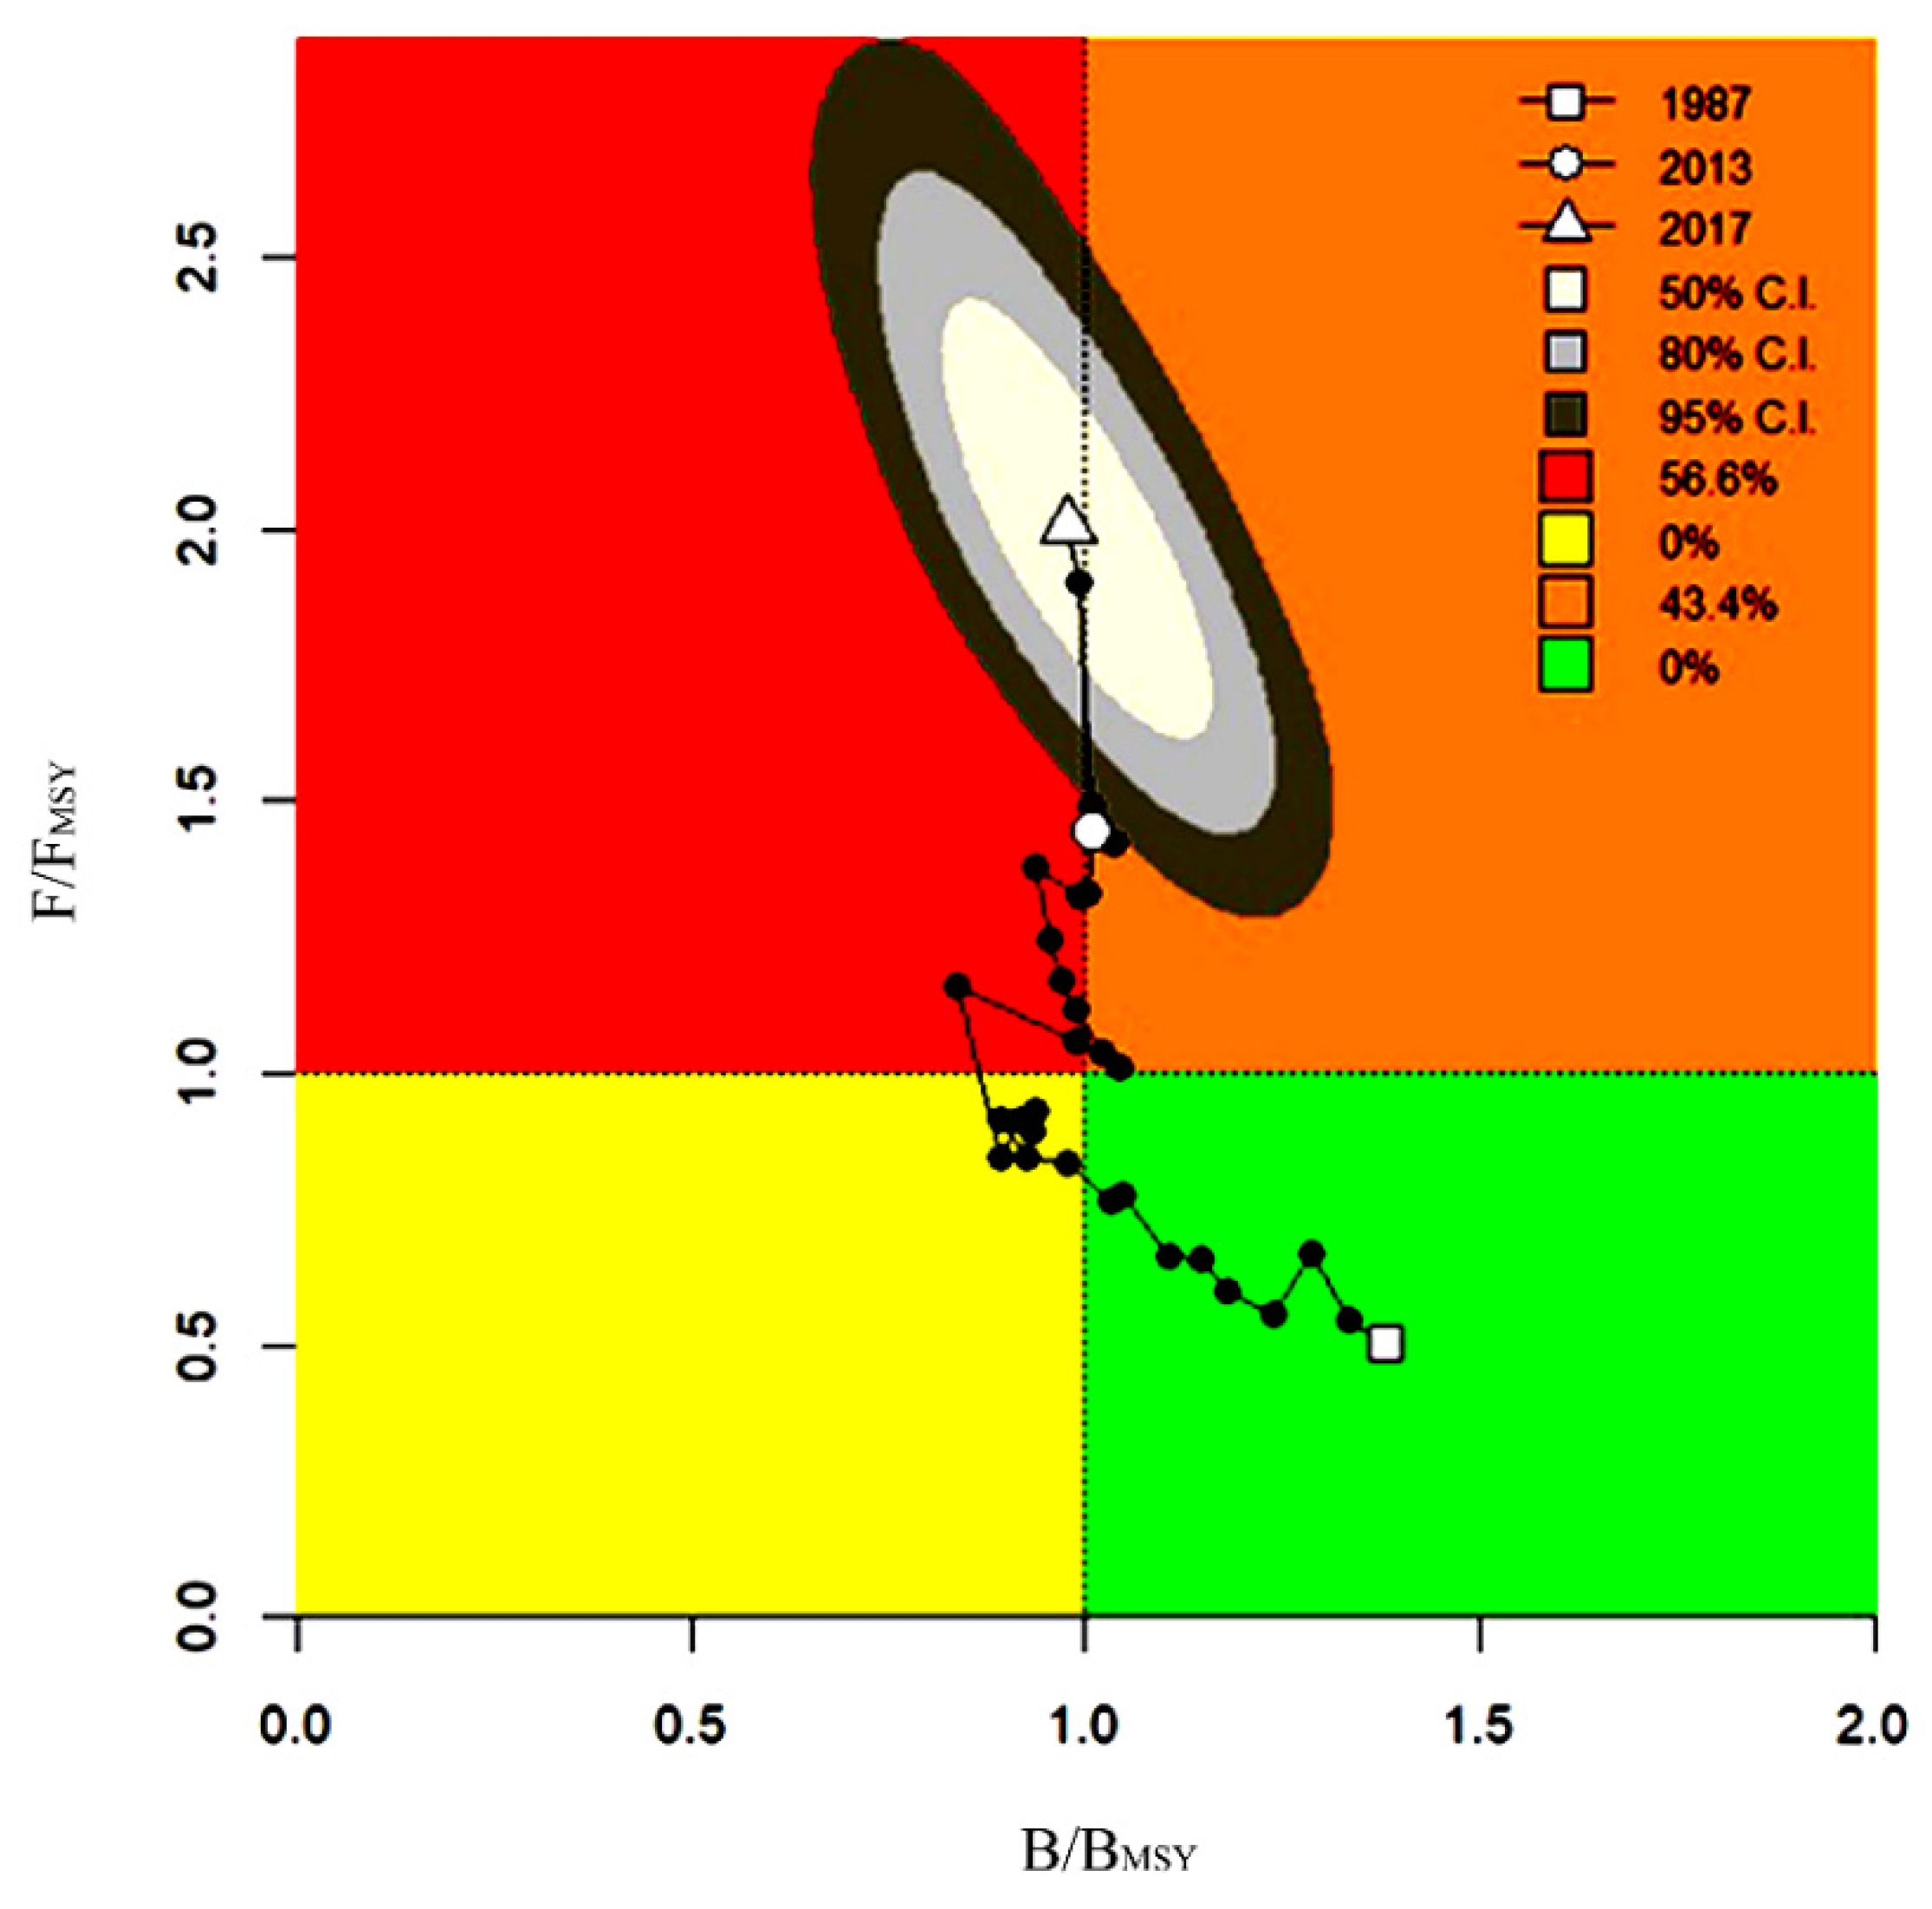
| B/BMSY in the last year | 0.961 | 0.736–1.20 |
| Fishing mortality in the last year | 0.476 | 0.382–0.620 |
| Exploitation F/FMSY | 2.05 | 1.95–2.67 |
| Methods | Application |
|---|---|
| TropFishR | Estimation of growth and mortality from length-frequency distribution data. |
| LBIs | Examine the current status of stock biomass (SB) in relation to the target and limit reference points (TRPs and LRPs). |
| CMSY | Estimation of exploitation and biological reference points from catch and resilience. |
| Studies | Methods | Year | Data Type | MSY (Tons) |
|---|---|---|---|---|
| Rahman et al. (2018) [11] | Gulland method | 2015–2016 | Length-frequency | 526,000 |
| Amin et al. (2002) [29] | Gulland method † | 1999 | Length-frequency | 162,396 |
| Halder & Amin (2005) [84] | Gulland method | 2002 | Length-frequency | 235,130 |
| Amin et al. (2008) [85] | Gulland method | 1980–2000 | Length-frequency | 210,125 |
| Present Study | CMSY | 2017–2018 | Catch and resilience | 315,000 |
| BSM | Catch and effort | 263,000 |
Publisher’s Note: MDPI stays neutral with regard to jurisdictional claims in published maps and institutional affiliations. |
© 2021 by the authors. Licensee MDPI, Basel, Switzerland. This article is an open access article distributed under the terms and conditions of the Creative Commons Attribution (CC BY) license (http://creativecommons.org/licenses/by/4.0/).
Share and Cite
Alam, M.S.; Liu, Q.; Nabi, M.R.-U.-; Al-Mamun, M.A. Fish Stock Assessment for Data-Poor Fisheries, with a Case Study of Tropical Hilsa Shad (Tenualosa ilisha) in the Water of Bangladesh. Sustainability 2021, 13, 3604. https://doi.org/10.3390/su13073604
Alam MS, Liu Q, Nabi MR-U-, Al-Mamun MA. Fish Stock Assessment for Data-Poor Fisheries, with a Case Study of Tropical Hilsa Shad (Tenualosa ilisha) in the Water of Bangladesh. Sustainability. 2021; 13(7):3604. https://doi.org/10.3390/su13073604
Chicago/Turabian StyleAlam, Mohammed Shahidul, Qun Liu, Md. Rashed-Un- Nabi, and Md. Abdullah Al-Mamun. 2021. "Fish Stock Assessment for Data-Poor Fisheries, with a Case Study of Tropical Hilsa Shad (Tenualosa ilisha) in the Water of Bangladesh" Sustainability 13, no. 7: 3604. https://doi.org/10.3390/su13073604
APA StyleAlam, M. S., Liu, Q., Nabi, M. R.-U.-, & Al-Mamun, M. A. (2021). Fish Stock Assessment for Data-Poor Fisheries, with a Case Study of Tropical Hilsa Shad (Tenualosa ilisha) in the Water of Bangladesh. Sustainability, 13(7), 3604. https://doi.org/10.3390/su13073604