Article

Long-Term Dynamic Behaviour of Human Resource Needs in Ghana’s Oil Sector: System Dynamics Approach

1
Scott Sutherland School of Architecture and Built Environment, Robert Gordon University, Aberdeen AB 10 7JQ, UK
2
School of Built Environment, Engineering and Computing, Leeds Beckett University, City Campus, Leeds LS2 8AG, UK
3
Faculty of Built and Natural Environment, Koforidua Technical University, Koforidua, Ghana
*
Author to whom correspondence should be addressed.
Sustainability 2021, 13(6), 3546; https://doi.org/10.3390/su13063546
Submission received: 23 February 2021 / Revised: 16 March 2021 / Accepted: 19 March 2021 / Published: 23 March 2021

Abstract

:
This study espouses a multi-strategy method comprising of a qualitative study and system dynamics (SD) to deliver the long-term dynamic behaviour of human resource development (HRD) in Ghana’s oil and gas sector. The adoption of the SD differed from previous studies addressing the local content implementation challenge of human resources, thereby allowing HRD to be considered a ‘system’ which, in turn, aided in comprehensively identifying and analysing the interrelationships among the dominant variables. Focal articles were reviewed to develop a causal loop diagram (CLD) for human resource and subsequently validated qualitatively. The CLD was used for analysing interconnections among the variables in the HRD and as a basis for developing the stock and flow diagram for projections. The study found that local content investment is projected to increase from $799 million to $3.0807 billion in 50 years, with a corresponding revenue increase from $29 billion to $44 billion in 50 years. Subsequent sensitivity analysis compared the local content model results under varying situations, which indicated the possibility of a demand for 20,000 local staff. The study further uncovered two critical issues affecting HRD, namely policy coordination and harmonisation and sustainable funding. These issues are exacerbated by the pervasive political interference in the administrative and operational functions of state oil and gas institutions.

1. Introduction

The continent of Africa is endowed with strategic natural resources crucial to the running of the world economy. These resources have resulted in great power rivalry and a new scramble for the control of resources in the post-independence era on the continent. Accordingly, the region has assumed geopolitical significance within the global economy due to its relative stability and easy access to North American, European, and Asia markets compared to the volatile Middle East. Out of the world energy demand, Africa produces 12% of the world’s oil, consumes 3.9%, and has about 8% of proven oil reserves worldwide. The African Wealth Cheque Report estimated that the value of oil, gas, coal, and uranium are between $13–14.5trn [1]. That is about 13 times the Sub-Saharan GDP for 2011. Despite these resources’ strategic nature, African countries have not been able to capitalise on them to accelerate economic development, which is attributed to poor management, corruption, and a lack of the right policy framework. Conversely, natural resources have been a significant catalyst of economic growth and development in Norway, Australia, the U.K., the U.S., and the United Arab Emirates, often cited for the efficient management of natural resources [2]. Consequently, there have been attempts to improve Africa’s resource paradox by investing the resource revenue in sustainable development and deepening accountability and transparency along the extractive value chain. The latter involves adopting the extractive industries transparency initiative (EITI) global standard intended to promote the open and accountable management of oil, gas, and mineral resources. All the above have coincided with China’s burgeoning economy, making the country assume greater control of resources through resource-backed loans. The resource-backed loans mainly from China constitute another strategy (loans provided to the nation-state or its entities whereby the loan is paid back through natural resources or future income stream from the resources) to diversify the economy via improving local infrastructure for the thriving of local businesses. A recent study by the natural resource governance institute identified sub-Saharan Africa as the most prevalent in resource-backed loans (RBLs) in the world [3]. However, the scheme’s success is hampered by weak resource governance and a lack of debt sustainability strategy among others [3].
In addition to the above strategies, African countries have adopted local content (LC) policies and regulations to diversify their economies. Since its introduction in the North Sea, the LC policy has become the preferred go-to-strategy of host countries wanting to speed up economic development. This new study focuses on the latter strategy because of the policy adoption’s pervasiveness in almost all African countries without assessing the potential gaps and impediments to the policy. As a result, countries set over-ambitious targets and plans in the LC policy that are not commensurate with the country’s developmental state. Accordingly, the study focusses on human resource development (HRD) as one of the implementation challenges of LC policy in resource-rich countries [4,5,6,7,8,9,10,11,12,13,14]. Resource-rich countries are bedeviled with either a short supply of skilled and experienced workforce or a lack thereof, which is a prerequisite for developing linkages in the oil industry. To that end, the study adopts system dynamics (SD) to forecast the long-term dynamic behaviour of human resource development and local content investment in the Ghanaian oil industry over the next 50 years. Two objectives are set out to study the long-term dynamic behaviour:
  • What is the projected oil industry workforce needs in the next 50 years?
  • What are the policy options to develop local human resource needs for the industry?
This, in turn, is expected to provide policymakers and industrial players with future projections and requirements and the strategies for addressing the projections. Consequently, the system dynamics-based method is used to identify factors likely to affect HRD and subsequently modelled it. More importantly, the system dynamics (SD) concept is adopted to build a set of cause-and-effect diagrams for a human resource which is markedly different from previous studies on local content development that focused on local content regulations, enforcement and compliance, etc. [4,6,8,9,11,15,16,17]. The essence of adopting SD is to consider HRD as a ‘system’ with independent interrelated elements and multiple stakeholders, all interreacting in non-linear relationships. The SD, therefore, provides a comprehensive approach to understanding the factors that can influence HRD.
Using Ghana’s oil industry as a case area, the study intends:
  • To develop a causal loop diagram (CLD) based on a cause–effect diagram for human resource development (HRD) with the explicit purpose to illustrate the various factors influencing HRD and, in turn, depict the causal relationship in the CLD. The CLD has the advantage of aiding the research participants in understanding the root causes of an issue and its interrelationships. Therefore, the participants will be able to proffer better policy. This forms the first stage of the study covered by Obiri et al. [13] and summarised in Section 3.1.
  • Based on the validated causal loop diagram in point 1, the system dynamics concept will transform the CLD into a stock and flow diagram for stimulation. This section constitutes the second stage of the study, which begins from Section 3.2 onwards.
Broadly, the study tries to change the narrative on LC literature on resource-rich countries, which mostly focus on LC legislations and enforcement etc., to a sustainable approach, thus shifting the responsibility in addressing the deficit in local capacity from oil companies to the central government and local authority. In that light, the study argued that whatever the oil companies do regarding LC legislation must complement the government’s overall programmes and policies but not vice versa. The rest of the paper is divided into several sections. Section 2 briefly reviews the literature on the topic in the context of the oil industry. Section 3 discusses the methodology with subsections on CLD, a stock and flow diagram, and sensitivity analysis. Section 4 discusses the findings of the study and the last section concludes the paper.

2. Literature Review

LC policies and regulations have been promulgated in almost all oil-producing countries to stimulate resource-based development by linking the oil sector to the broader economy through four pillars: employment creation, procurement of local goods and services, technology transfer and skills development [14]. Their adoption and implementation are premised on the belief that it will lead to the building of local companies and suppliers’ capacity and capability, and in turn, spill-over to the wilder economy for diversification. Furthermore, the above is supposed to lead to local content development, which deals with developing domestic industries and suppliers’ capabilities and competencies and promoting innovation, technology and value addition to goods and services to stimulate economic growth. In 2010, when Ghana developed its Local Content and Participation Framework Policy, it identified inter alia human resource capacity as a potential impediment to the success. The Ghanaian government’s anticipated challenge was based on the country’s neighbours’ (Nigeria and Angola) experience in implementing LC policy in the oil industry. The Ghanaian government argued that a skilled and experienced workforce would be a prerequisite for developing production linkages in the oil and gas (O&G) industry. Over the years, human resources capacity (HRC) has been defined and interpreted in varied ways. The concept is closely related to education, training and human resource development [15]. HRC can be defined as “the development of knowledge, skills, and attitudes in individuals and groups of people relevant in the design, development, management, and maintenance of institutional and operational infrastructures and processes that are locally meaningful” [18,19].
Developing countries, especially those in Africa, lack the requisite skills, experience and competencies for the petroleum industry and in general insufficient human resource capacity are considered one of the foremost challenges curtailing local content implementation [6,11,15,16,17,20,21,22,23]. To that end, the resource-rich country has the sole responsibility to increase local skills, business know-how, and technology transfer and development [12]. For technology transfer to be effective in developing countries, it is argued that the availability of skilled labour plays a vital role in receiving technology and its eventual transfer to the host country [13]. Similarly, skilled labour employment is critical in diffusing technology but not only through formal research and development (R&D) [24]. In other words, the availability of skilled human resource will facilitate technology adoption and transfer. Furthermore, human capital development creates a significant contribution to organisational competencies, which enhance innovation. Studies show that business performance is positively impacted by human capital practices [25,26], and human capital development is a prerequisite to sustainable business performance [27]. All of the above help build the capability and competencies of local suppliers to the industry’s standard, thereby allowing local suppliers to venture into international markets.

3. Methodology

Qualitative data and system dynamics were adopted in the conduct of the study. The study sources data from Ghanaian government policy statements and regulations on local content (see Section 2 for more references), academic publications, and international organizations’ statistical records and publications [11,12,13,20,21,22,23]. The study’s selection of data was based on references that are important to the study’s central theme. Also, stakeholders and experts on the subject matter (Ghanaian oil industry players) were purposively sampled to form a focus group to validate the causal loop diagram (CLD) and elicit their opinions of the phenomenon under consideration. The respondents were chosen based on their perceived understanding of the research topic and their ability to answer the research questions. System dynamics (SD) is a modelling technique for modelling systems with complex and dynamic features. It has different frameworks for a system dynamic-based modelling, and this study intends to adopt Sterman’s SD modelling process for its simplicity. The modelling process consists of five stages: problem identification, dynamic hypothesis, stimulating model, formulation testing, policy formulation and evolution [28]. Broadly, system dynamics can be divided into qualitative system dynamics and quantitative system dynamics. The qualitative system dynamics constitutes the first two stages of Sterman’s modelling process, whiles the other three stages constitute quantitative system dynamics [29]. Qualitative system dynamics (QSD) involves developing the causal loop diagram (CLD) for local content development and subsequent validation. Similarly, quantitative system dynamics (QSD) uses the developed causal loop diagram for computer stimulation. The above distinctions in system dynamics constitute the two broad phases in the study. The next section summarises the first stage of the study (see detail at [13]), which involves variable identification and justification, the CLD development, and the qualitative data validation process.

3.1. The Causal Loop Diagram

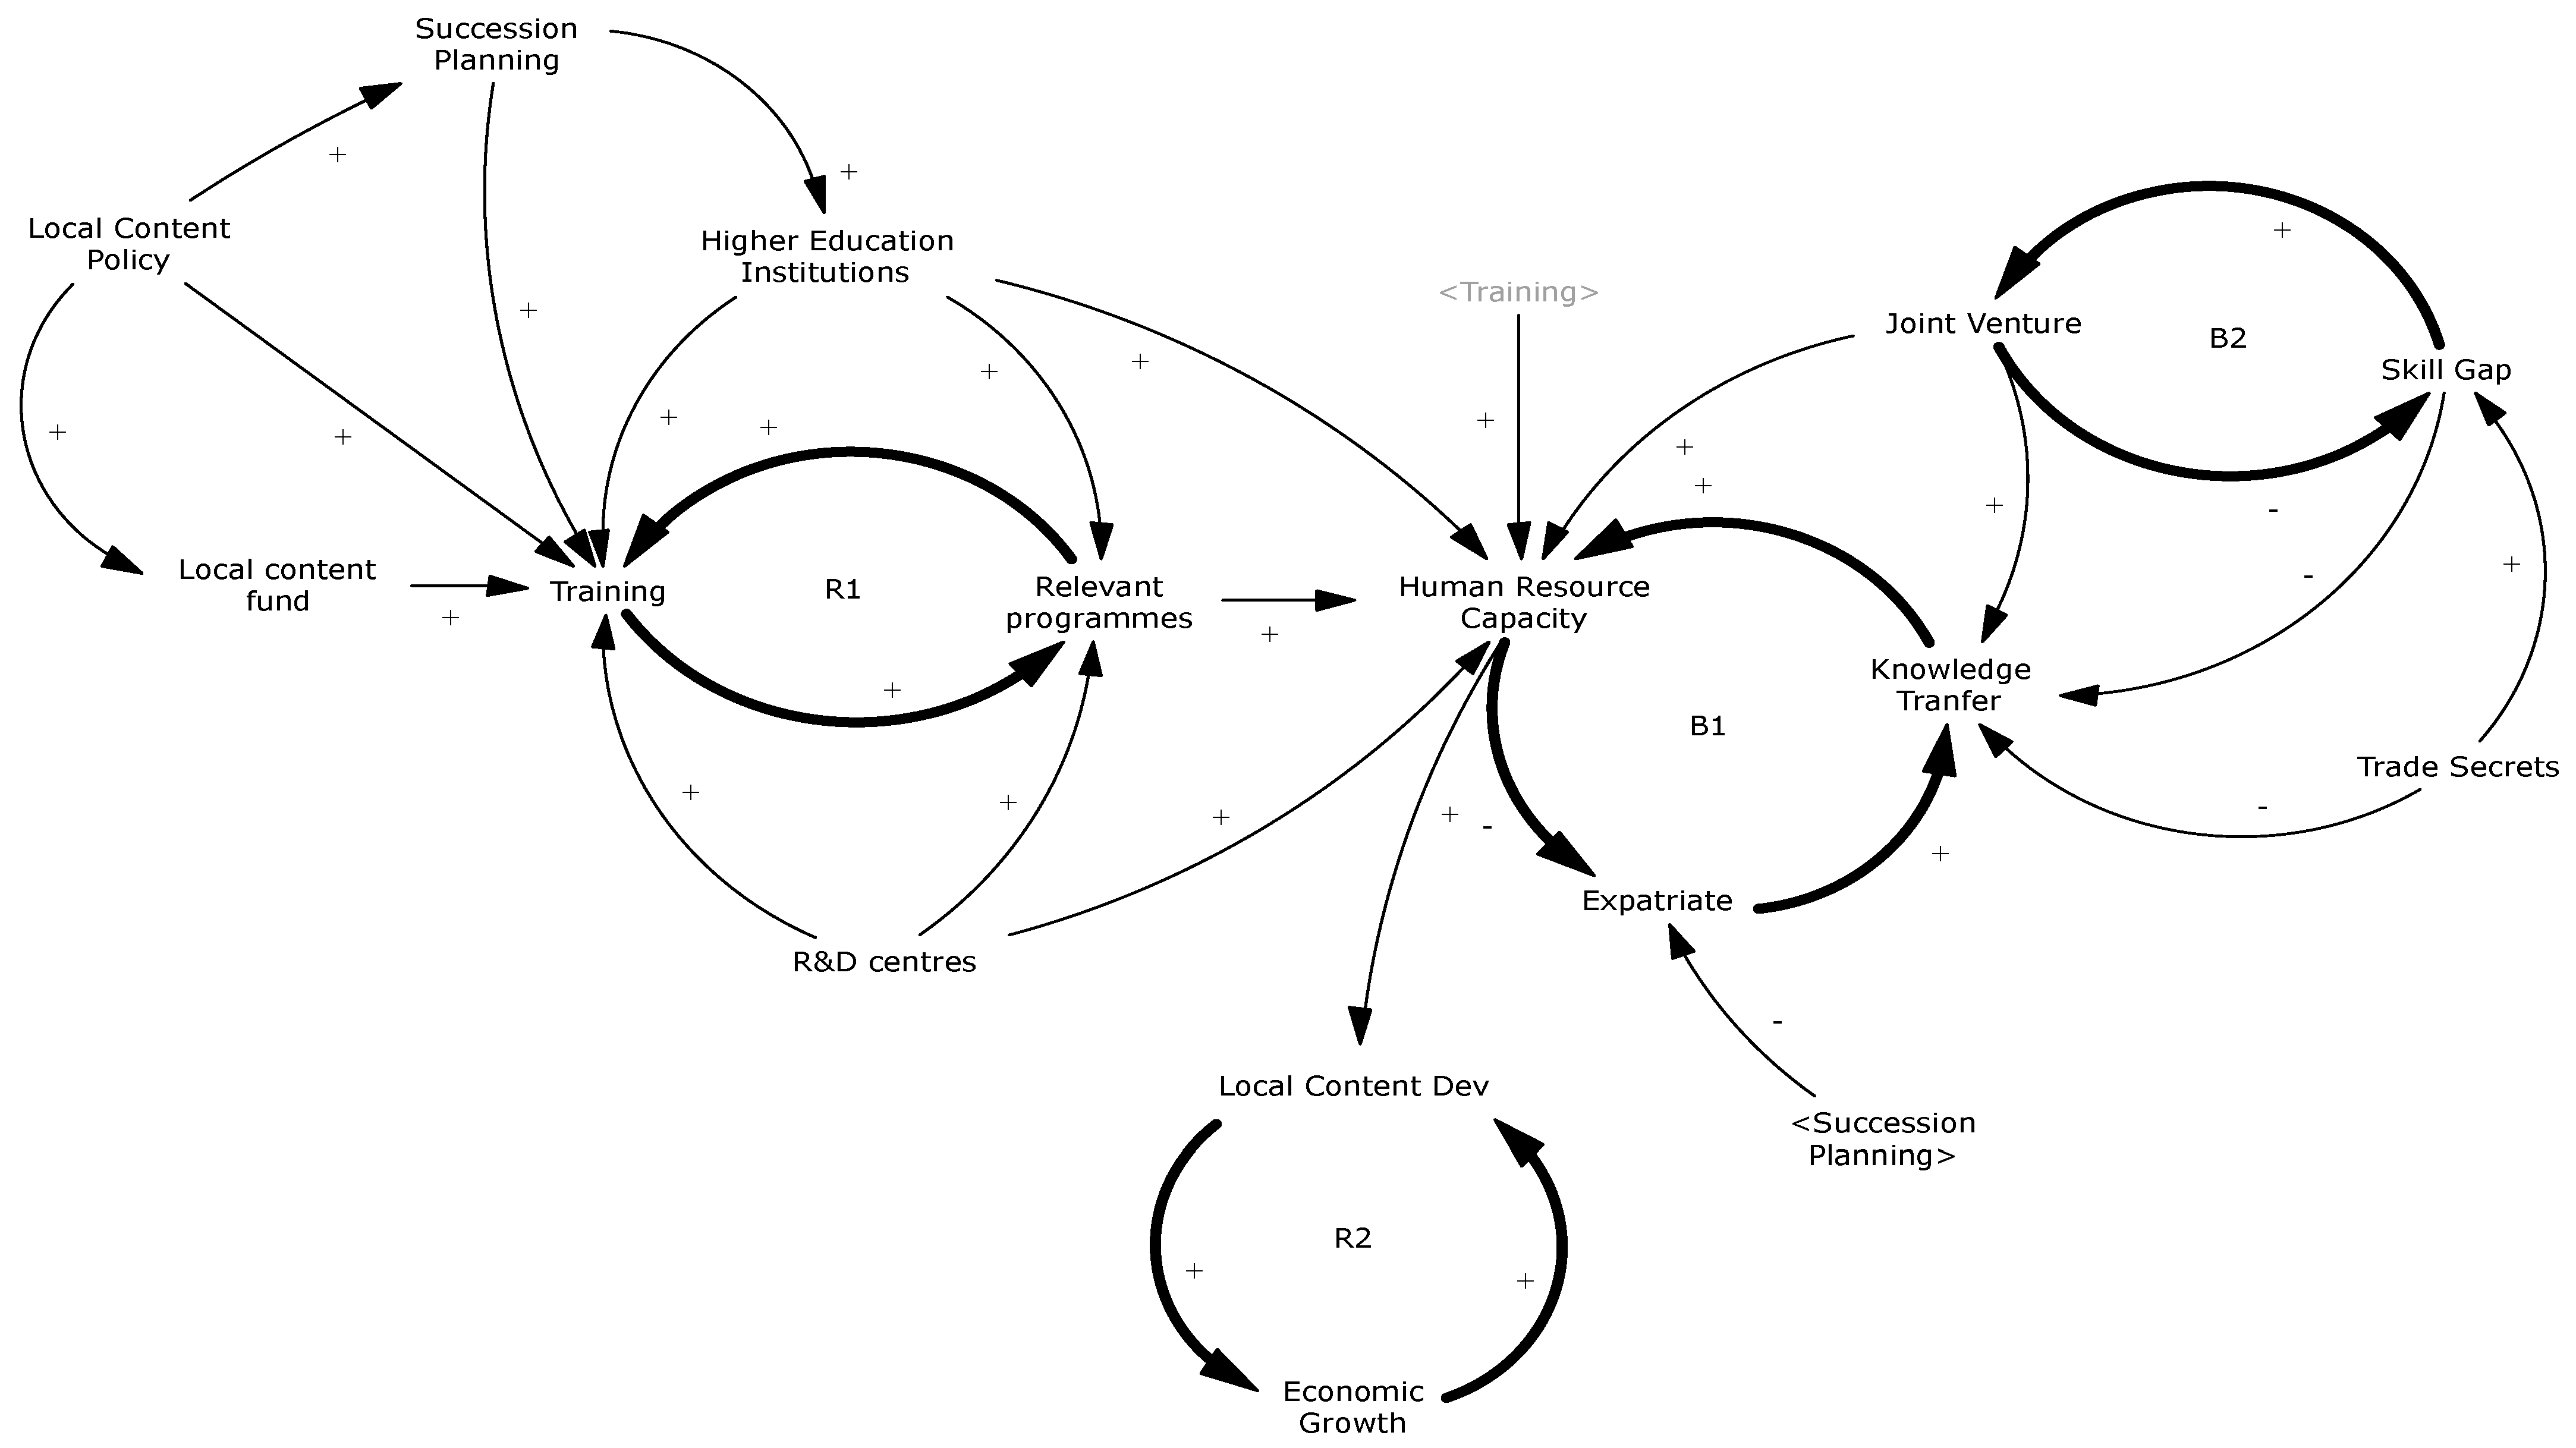
The study’s first stage focused on model conceptualisation and its validation using the system thinking tool of causal loop diagram (CLD) (see [13]). System thinking is defined as the “art and science of making reliable inferences about behaviour by developing an increasingly deep understanding of underlying structure” [30]. It aids in understanding the whole system and its interconnections from multiple perspectives [31]. Understanding the whole system means considering all the subsystems and their relationships and interdependencies. In a nutshell, system thinking helps identify the root cause of a problem systematically and challenge preconceived ideas from a non-linear perspective. This underpinning philosophy is in-line with the study’s aim to analyse human resource development under local content development in resource-rich countries. The purpose of this section is to briefly summarise the processes used in modelling the CLD and its validation. The causal loop diagram explored the cause-and-effect relationship between exogenous and endogenous variables [32]. A causal loop diagram (CLD) was used to model the various factors likely to impact human resource development in the oil industry. Simply put, the CLD is primarily used to represent interrelationships in a system based on a cause-and-effect scenario. Furthermore, the CLD is premised on the feedback loop concept that sees issues as a set circular relationship, not from the linear perspective. These circular relationships give a better explanation of all the factors likely to influence a phenomenon under consideration, and therefore both the researcher and research participants are in a pole position to proffer solutions [33]. The variables for the CLD were decided by listing those factors that have a significant influence on the output [29], by ignoring variables deemed not critical to the problem under consideration [33], and with the assumption of a small and manageable model size. The above-mentioned guidelines were followed in extracting the variables from literature to form the system boundary (shown in Table 1) for the modelling. The arrows in the diagram represent causal relations. Negative (-) indicates that the values of the variables change in the opposite direction, while plus (+) indicates the variables change in the same direction, not necessarily that the values increase. VENSIM software was then used to model the CLD as indicated in Figure 1.
In Section 3.2, the study emphasises the foundational blocks of CLD, reinforcing loop (R1-R2) and balancing loop (B) and the system as a whole, as indicated in Figure 1. The study intends to elicit policy intervention from research participants to the following:
  • How do you effectively deal with the loops in Figure 1?
  • What are the policy options for this scenario in the diagram?

3.2. Validation of the Causal Loop Diagram

The causal loop diagram (CLD) in Figure 1 was validated by Ghanaian industry players in the form of a focus group who were asked to review the diagram to: (1) add or drop variables (cause, effect); (2) identify any missing relationship; (3) confirm the existence of a relationship or otherwise [23]. These guidelines were followed in validating the model in-line with Goldrate’s theory of constraints that identify criteria that determine the validity of models [34]. Figure 2 depicts the validated model with the new variables of skill gap, succession planning, and trade secrets, thereby creating two reinforcing loops, R1 and R2, and two balancing loops, B1 and B2. The model disentangles the various factors that can affect human resource development in the oil industry. The reinforcing loops keep the system running efficiently by producing growth or desirable results. The best strategy for reinforcing loops in such a scenario is to devise a strategy that keeps the system performing efficiently and at the same time anticipating potential limit to growth. On the other hand, balancing loops focus on stabilising the system. The best strategy for addressing balancing loops is setting clear objectives, planning, and anticipating potential side effects. Research participants suggested policy interventions in line with the loops, which are discussed in Section 4.
Furthermore, the high leverage points—R&D, knowledge transfer, training, joint venture, relevant programmes and higher education institutions and the loops in the model demonstrates the key areas government can focus on building domestic skills, manpower and capability. In other words, a well-crafted policy in the said areas will have the potential to build local skills and capacity, thereby increasing domestic employment and participation in the industry, and on the other hand, reduces expatriates’ involvement in the industry. This summarises the first stage of the study, and the next section discusses the simulation of the CLD.

3.3. The Stock Flow Diagram

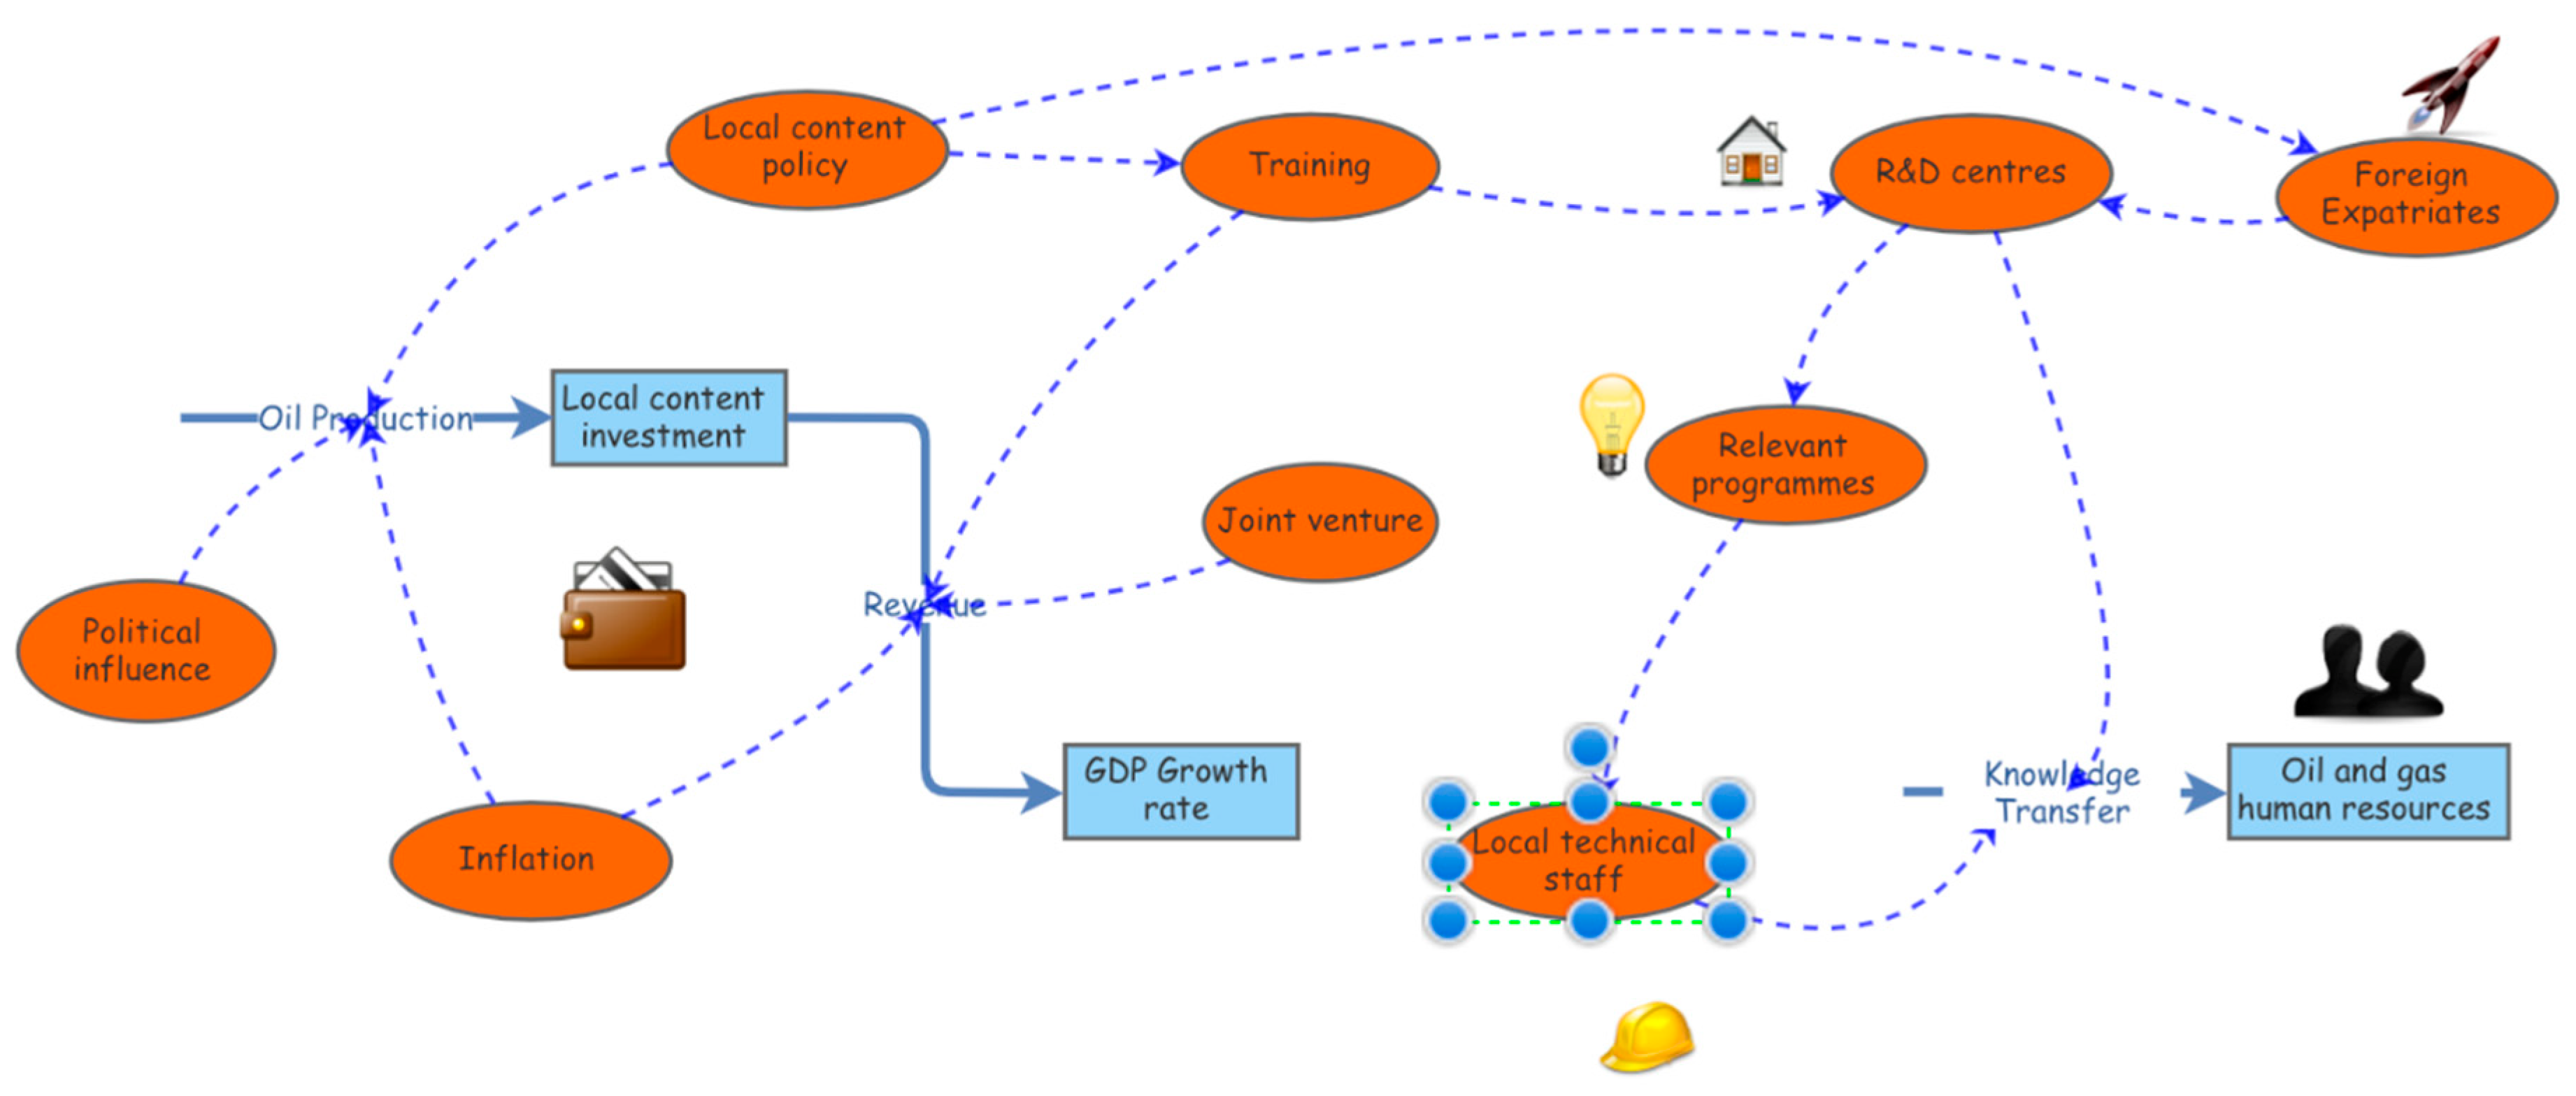
Systems dynamics represents a non-linear relationship between two variables with a causal relationship [35,36]. In most cases, the stock-flow diagram represents one variable’s impact on a larger stock of variables, thereby leading to a corresponding final impact. The stock-flow diagram may be constructed from qualitative or quantitative data emanating from either positive or negative causal loop diagram [37]. In this study, the validated causal loop diagrams were used to develop the stock-flow diagram in Figure 3. The stock-flow diagram in Figure 3 utilises the parameters, values, and equations in Table A1 (in Appendix A) for understanding the dynamics behind local content investment and human resourcing in Ghana. From references sources, the local content oil and gas investment in Ghana in $779 m at a GDP growth rate of 6.7% with an average inflation rate of 7.8% [16,38]. There are 13 research and development (R&D) centres in Ghana and 5590 local technical staff [38,39]. The annual tenure of the presidency is four years, which may influence the local content investment in oil and gas production. The assumed value of 1000 was given as the number of staff in Ghana’s oil and gas human resources industry. The training programmes depend on the local content policy, and thus, an assumed value of 10 (for training) is used against the local content policy. Oil production in Ghana will drive the stock of local content investment and thus the revenue. Oil production is also determined by political influence, inflation rate, and the existing local content policy. Hence, oil production indirectly affects the GDP growth rate and training of manpower in the oil and gas industry (Please see Appendix A for Table A1).
Oil and gas human resources are affected by knowledge transfer generated by local technical staff and relevant programmes from the R&D centres. The number of foreign expatriates in Ghana depends on the local content policy and associated R&D centres. Human resources in Ghana’s oil and gas sector will expand or contract in response to the variables mentioned above.
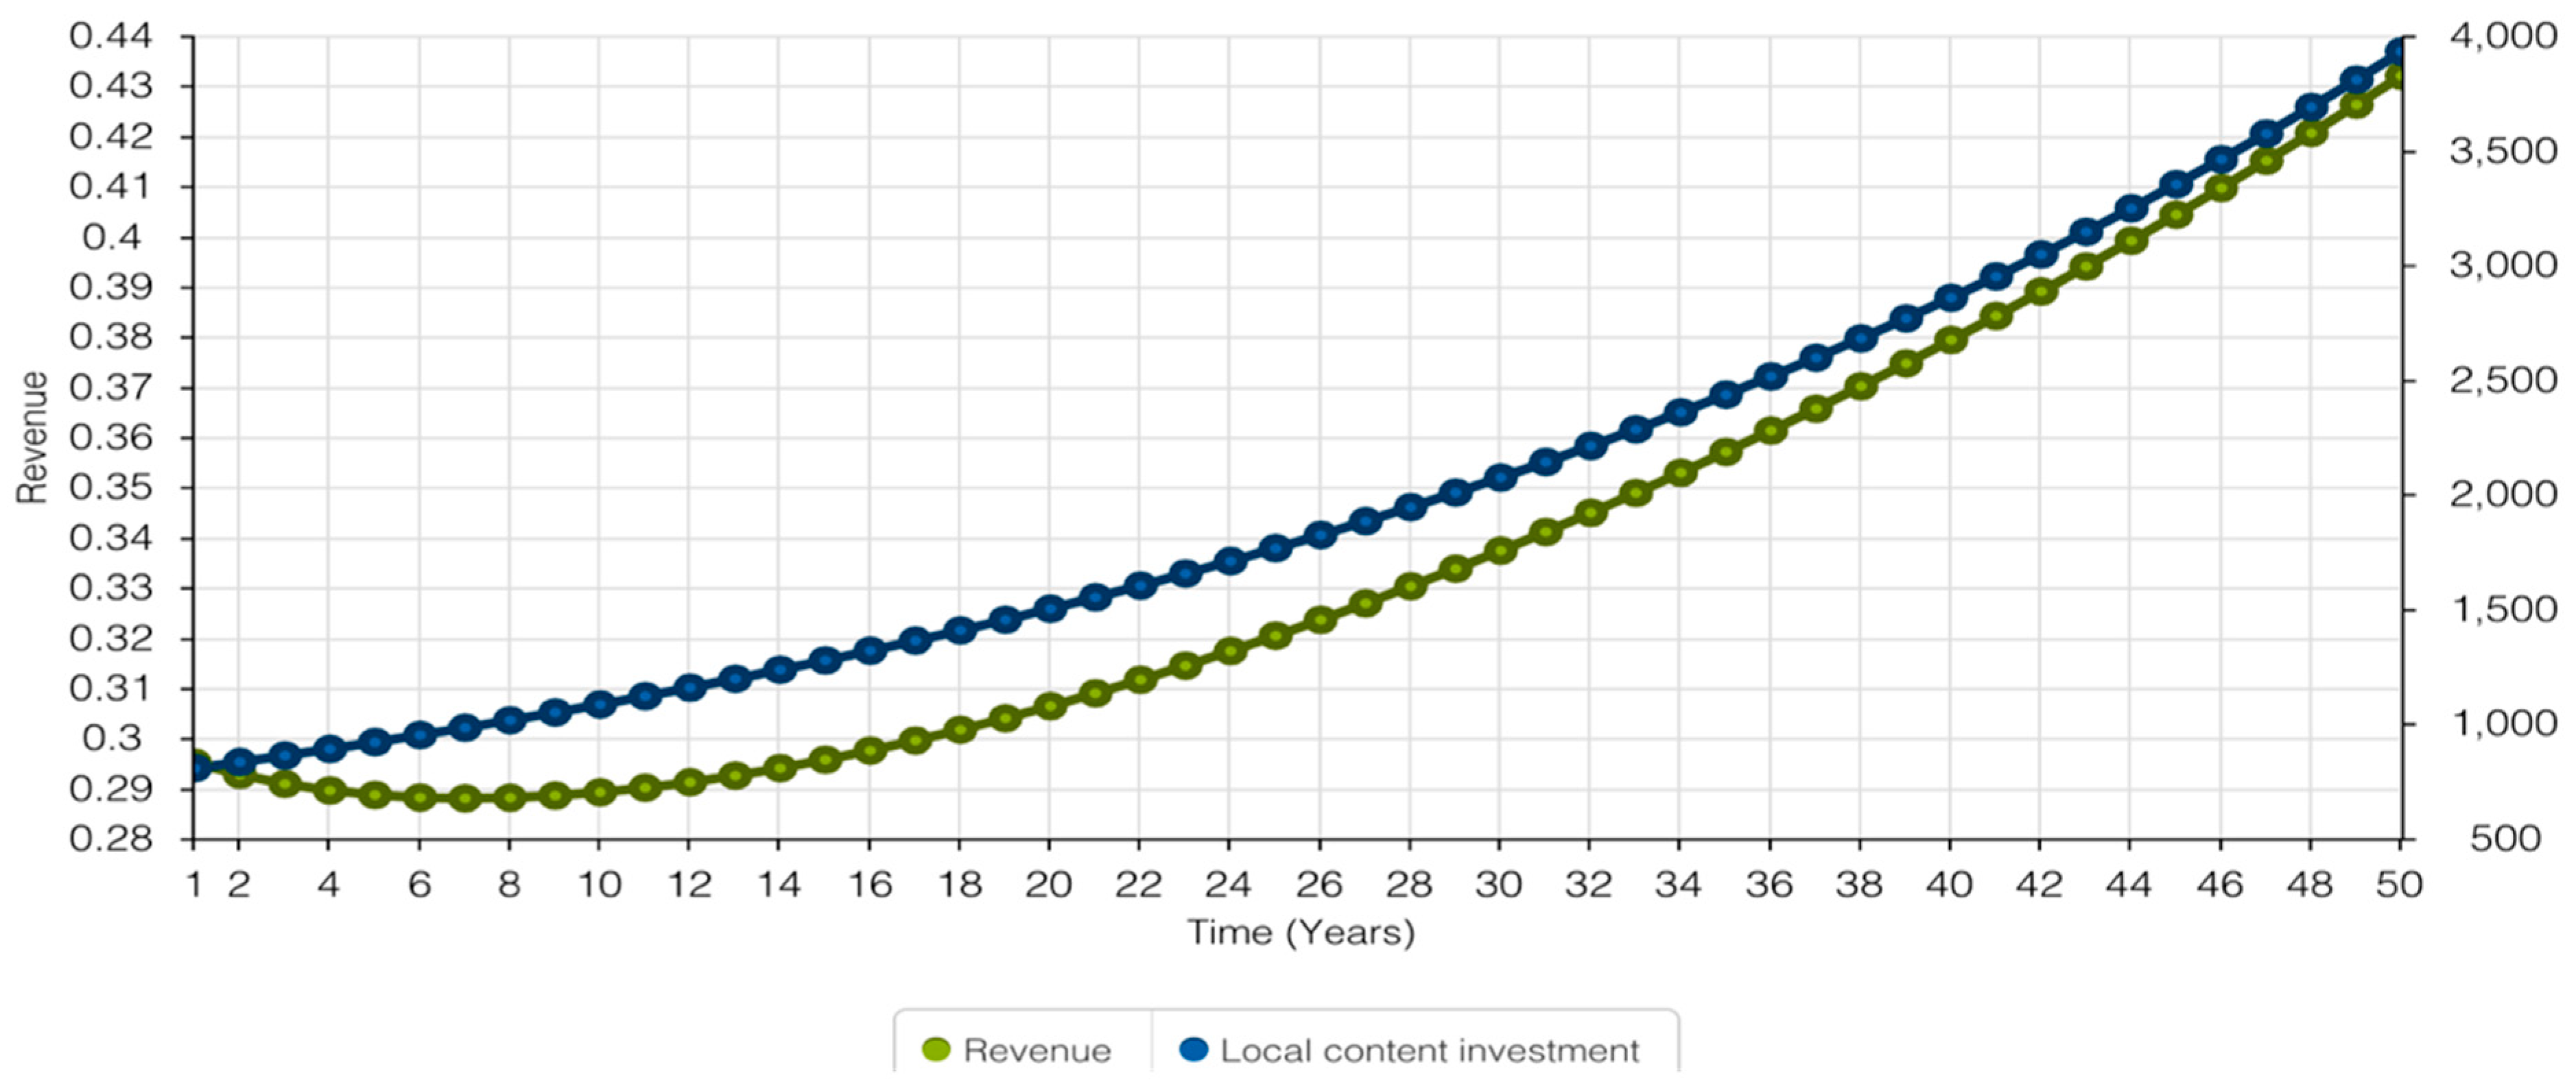
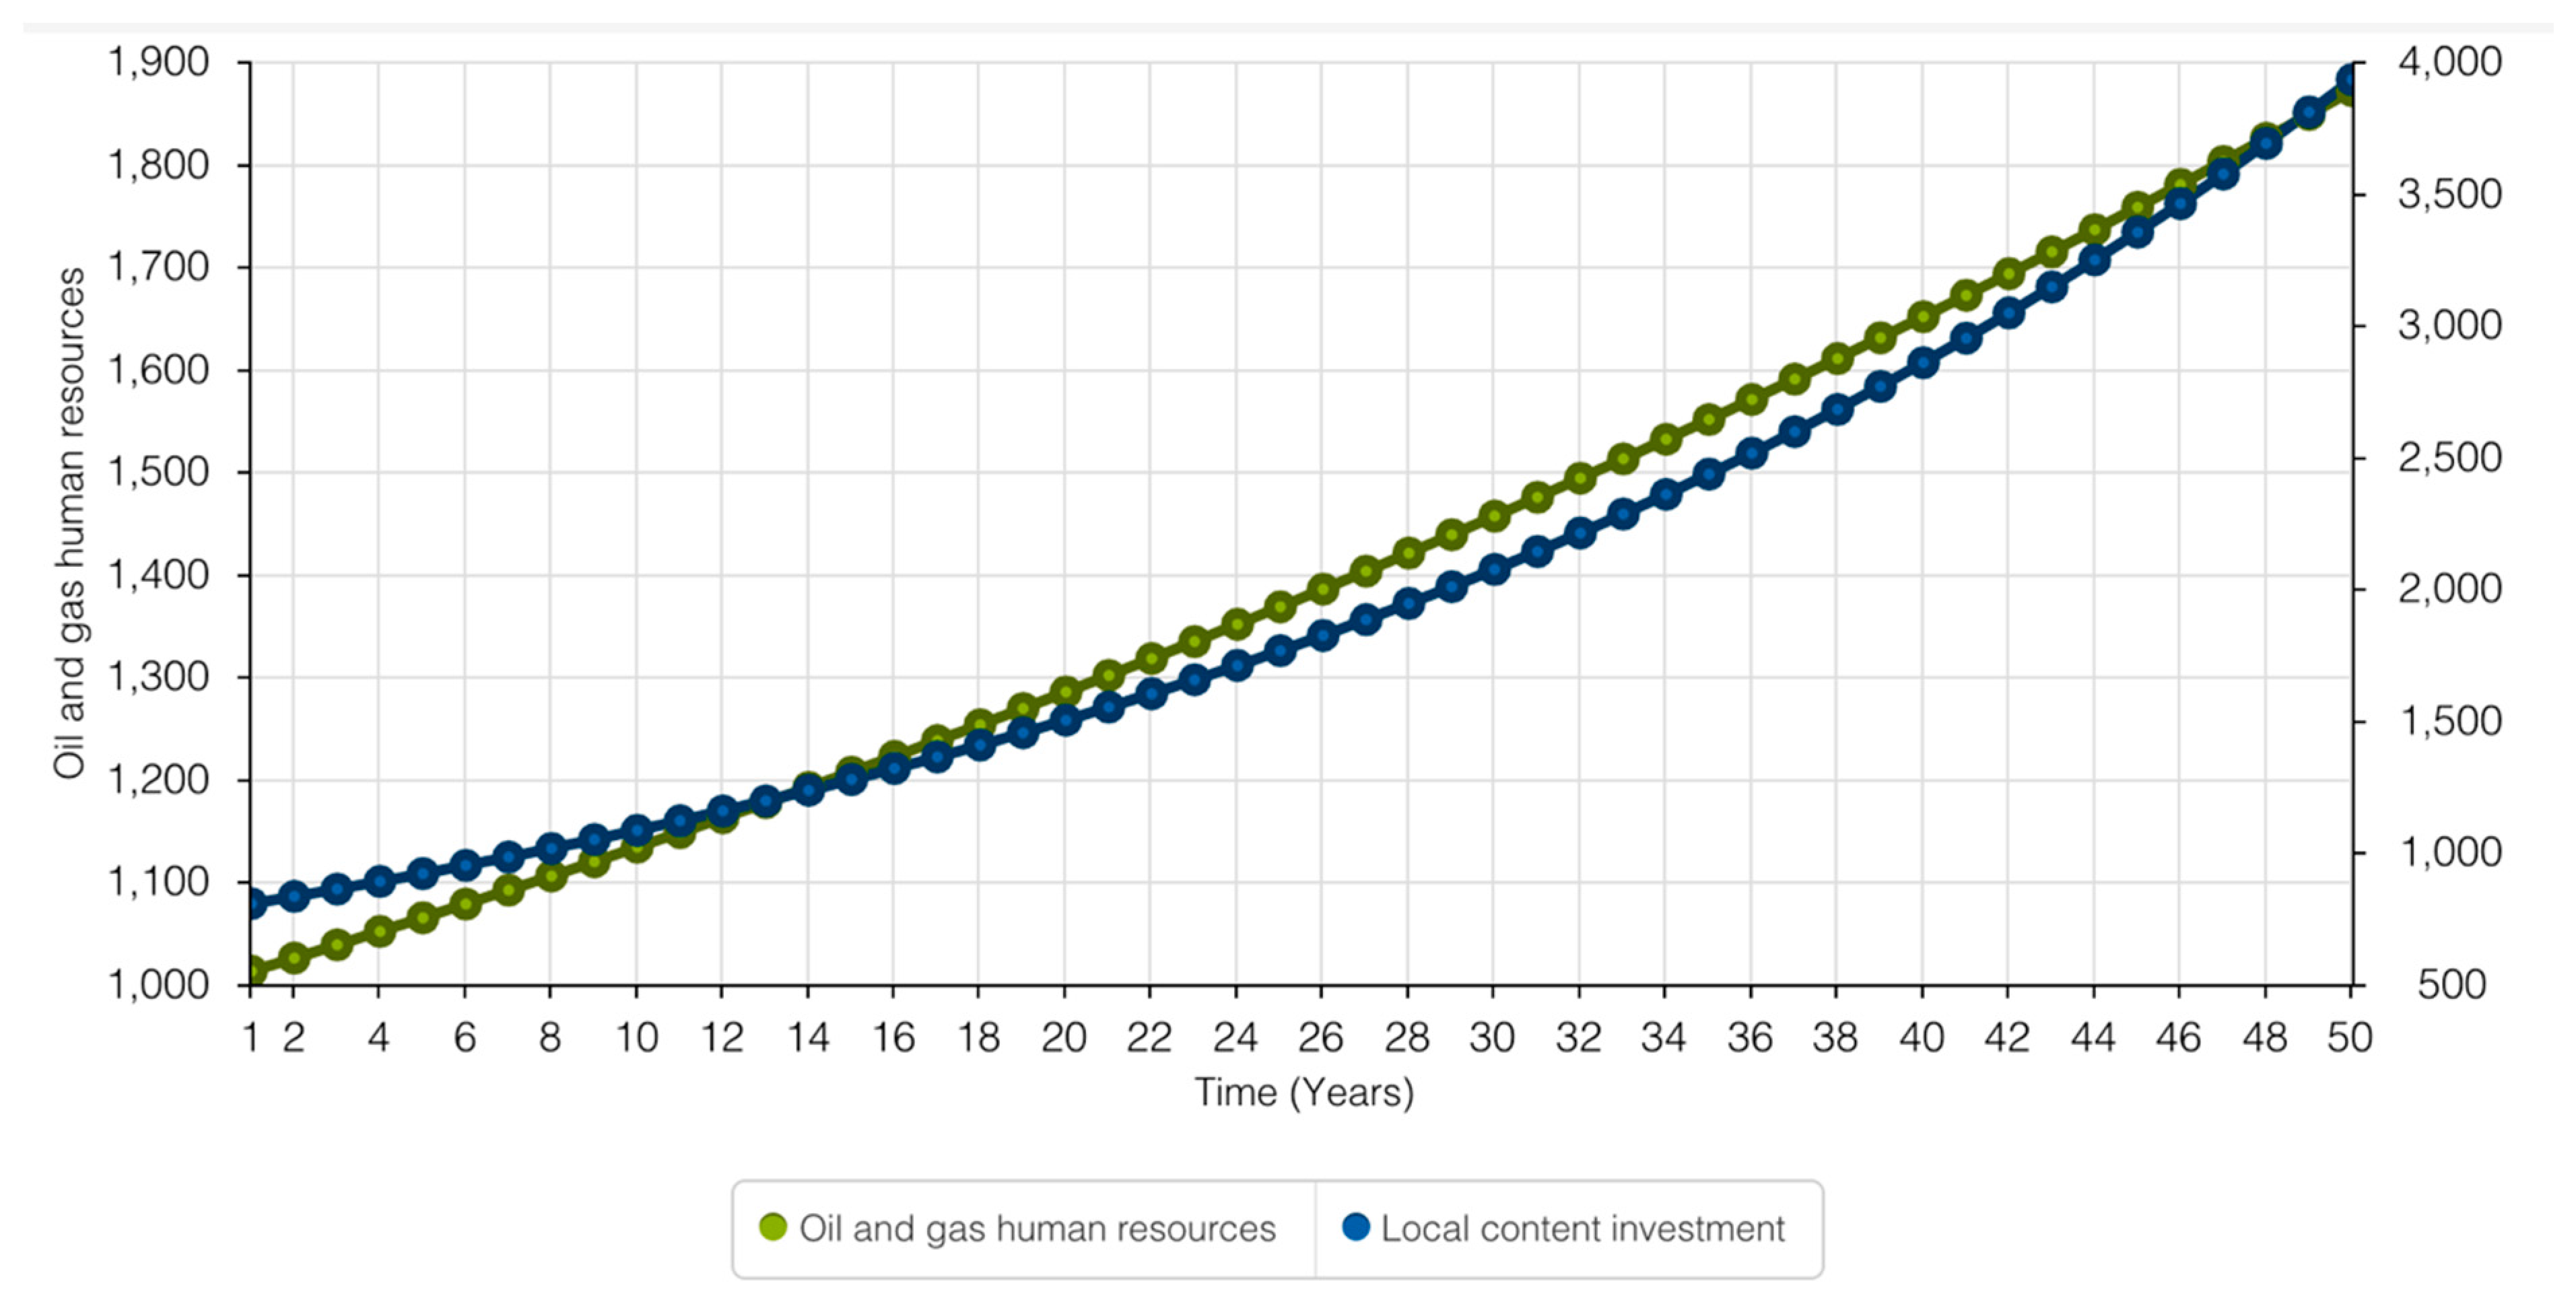
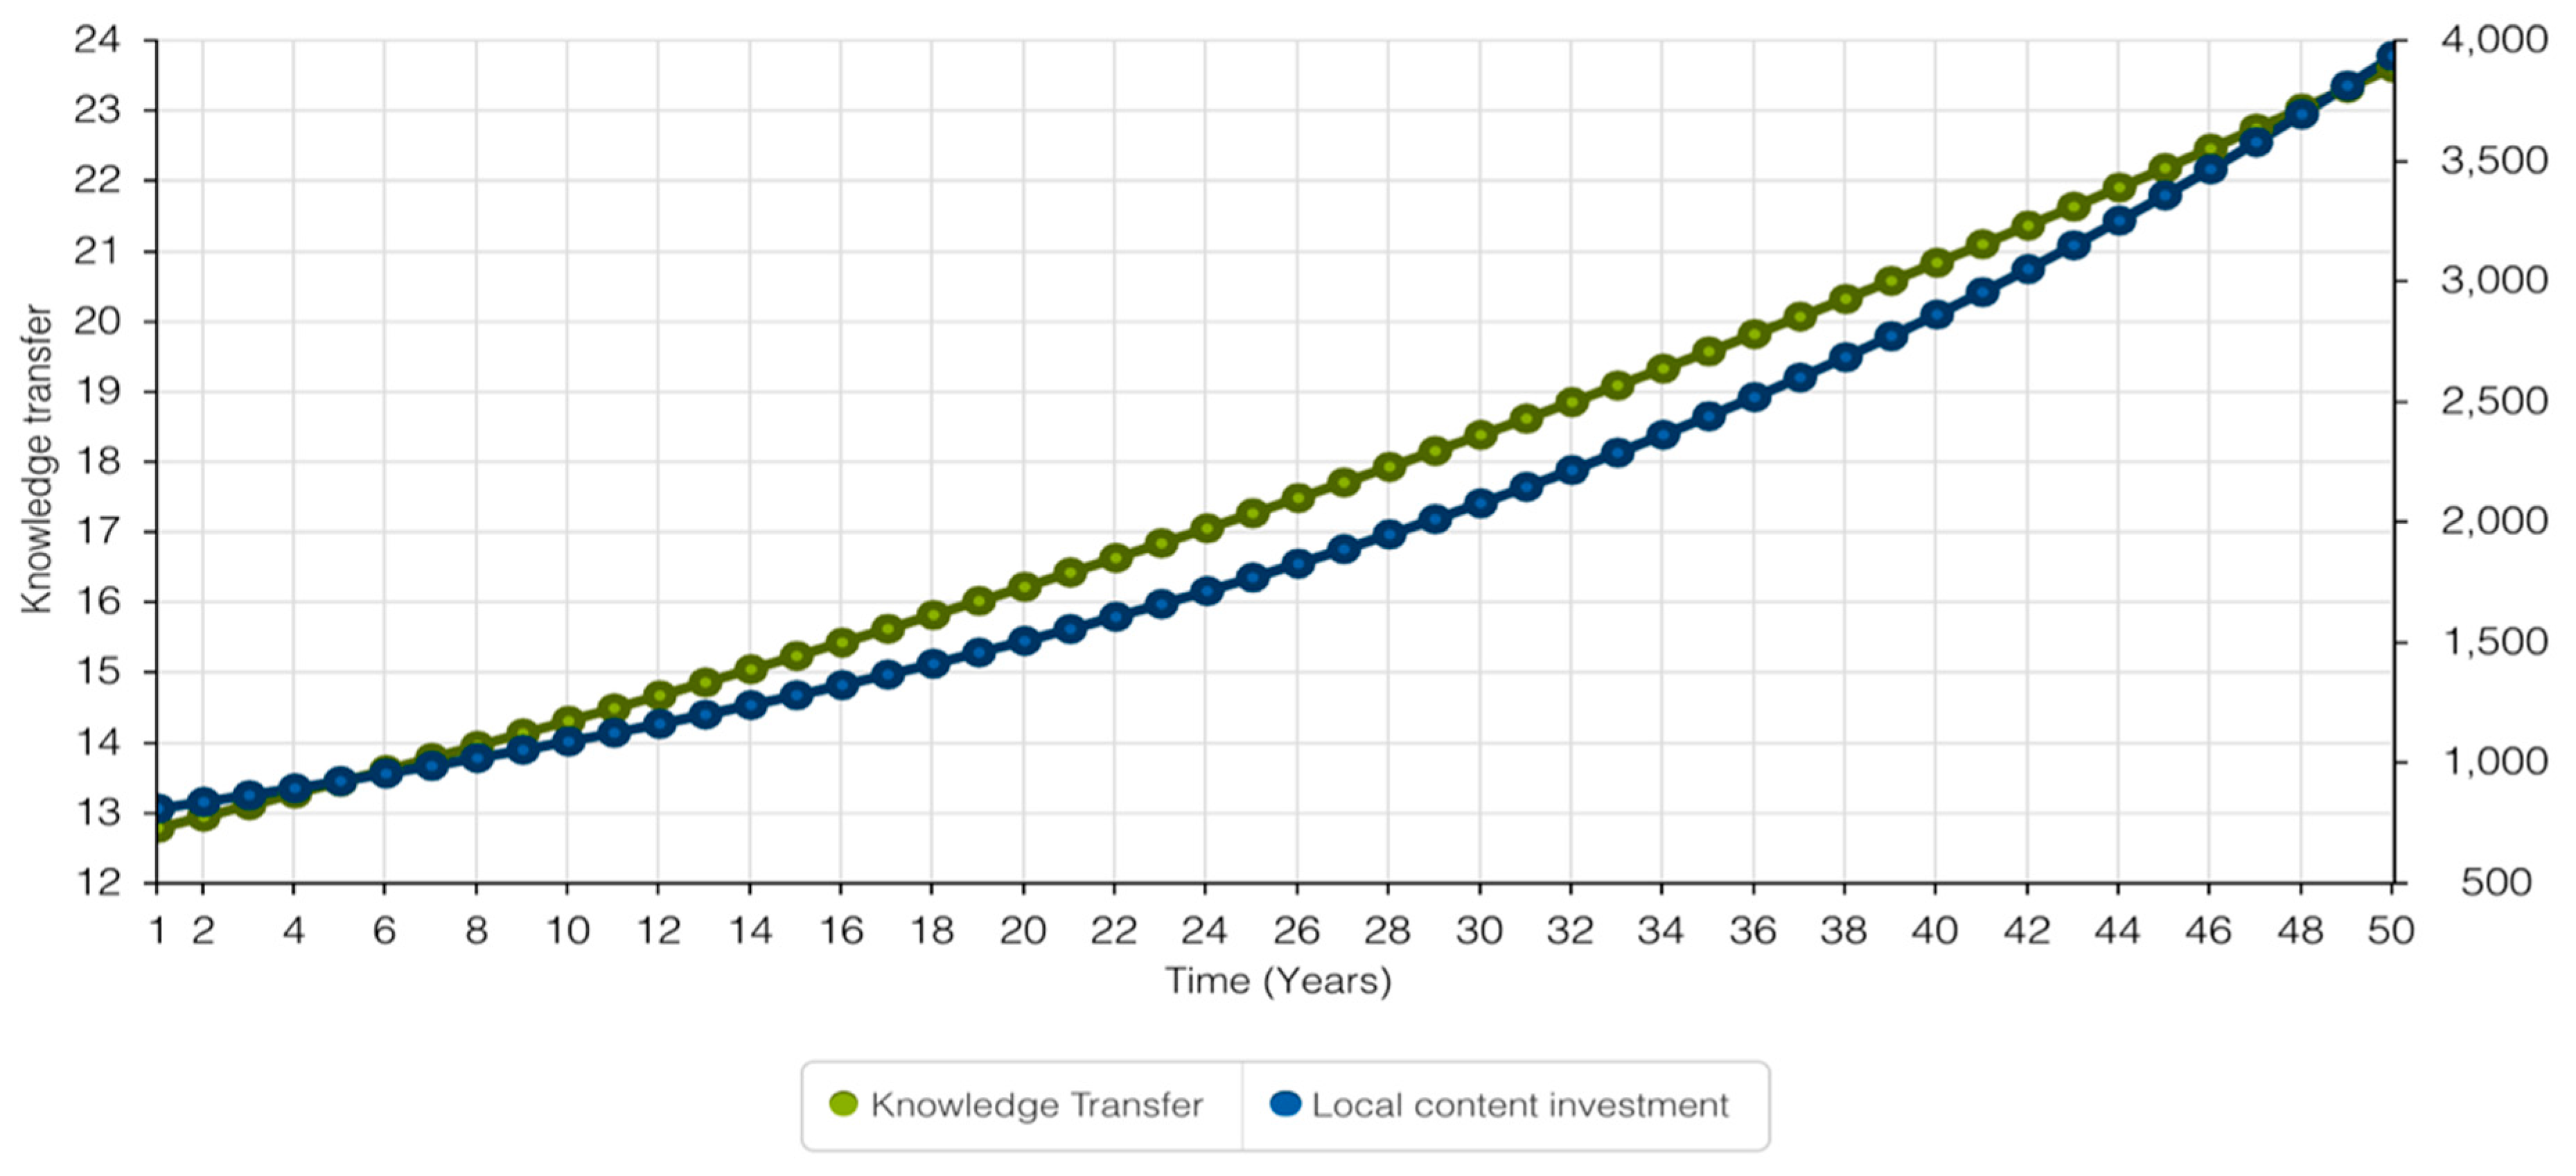
In systems dynamics, the figures associated with each variable matter. Table A2 in the Appendix A provides a 50-year overview of how knowledge transfer, local content investment, human resources, oil production, and revenue increases in Ghana. The time series charts in Figure 4, Figure 5, Figure 6, Figure 7 and Figure 8 illustrate the increments of the variables against local content investment. The Figures presents the years from a simulated year 1 (2020) to year 50 (2070). In Figure 4, local content investment is projected to increase from $779 million to $1.048 billion in 10 years and $3.0807 billion in 50 years. The increment in local content investment will yield a corresponding revenue increase through oil and gas revenue to $29 billion to $44 in 50 years. However, the revenue in the green line in Figure 4 shows a slight depression between years 2 and 7.
The above represents a period of investment in oil and gas revenue that has a downward trend even though there is a corresponding investment. This period of depression in revenue denotes the initial phases of the investment. This implies that oil and gas revenue will not yield the desired profit at the initial stages of investment, but within a period of 7–8 years, there will be an upward trend.
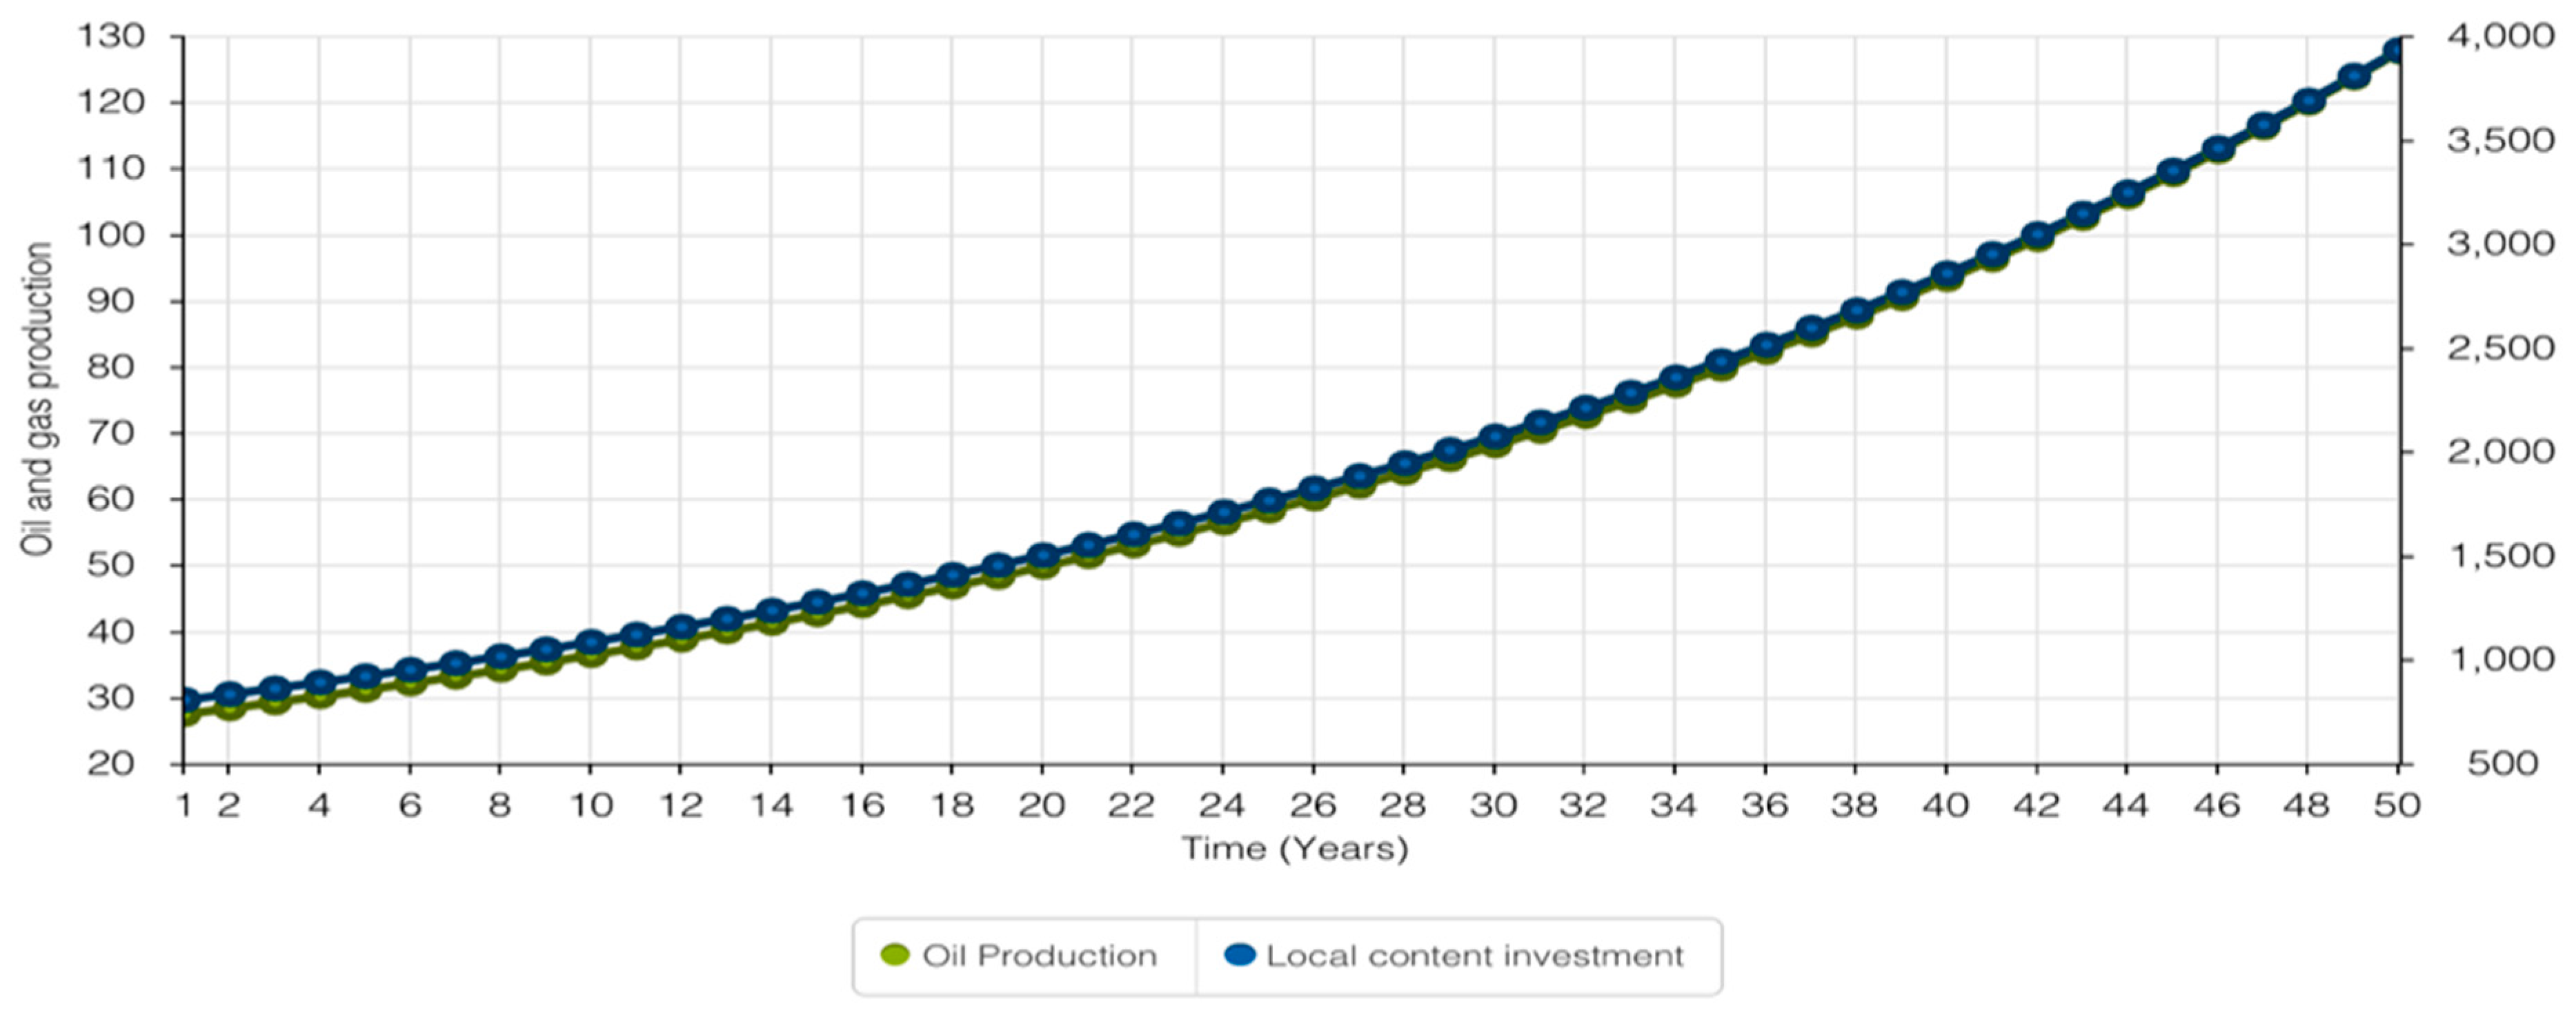
The revenue generated from oil and gas production is all connected with oil production. Hence, in Figure 5, oil production increases as the local content investment increases. There is a similarity between revenue generation and oil production in Ghana. Oil production rises from 28 (BPD 280,000) to 130 (BPD 1.3 million) in 50 years. The direct proportionality between revenue, oil production, and local content investment reveals an increase in local content policy that will drive the aforementioned variables.
Similarly, Figure 6 indicates that oil and gas human resources increase from 1000 to 1900 staff in 50 years. Although this value is low compared to the range of increment for oil revenue and production, there is a need to encourage oil and gas related courses in Ghana.
Oil and gas human resources depend on knowledge transfer from R&D centres and foreign expatriates. Although knowledge transfer has no dimension or unit of measurement, the indices start from just above 11 and increase to 24 within 50 years, as indicated in Figure 7. Knowledge transfer indices increase more rapidly when accompanied by positive local content policy and investment.
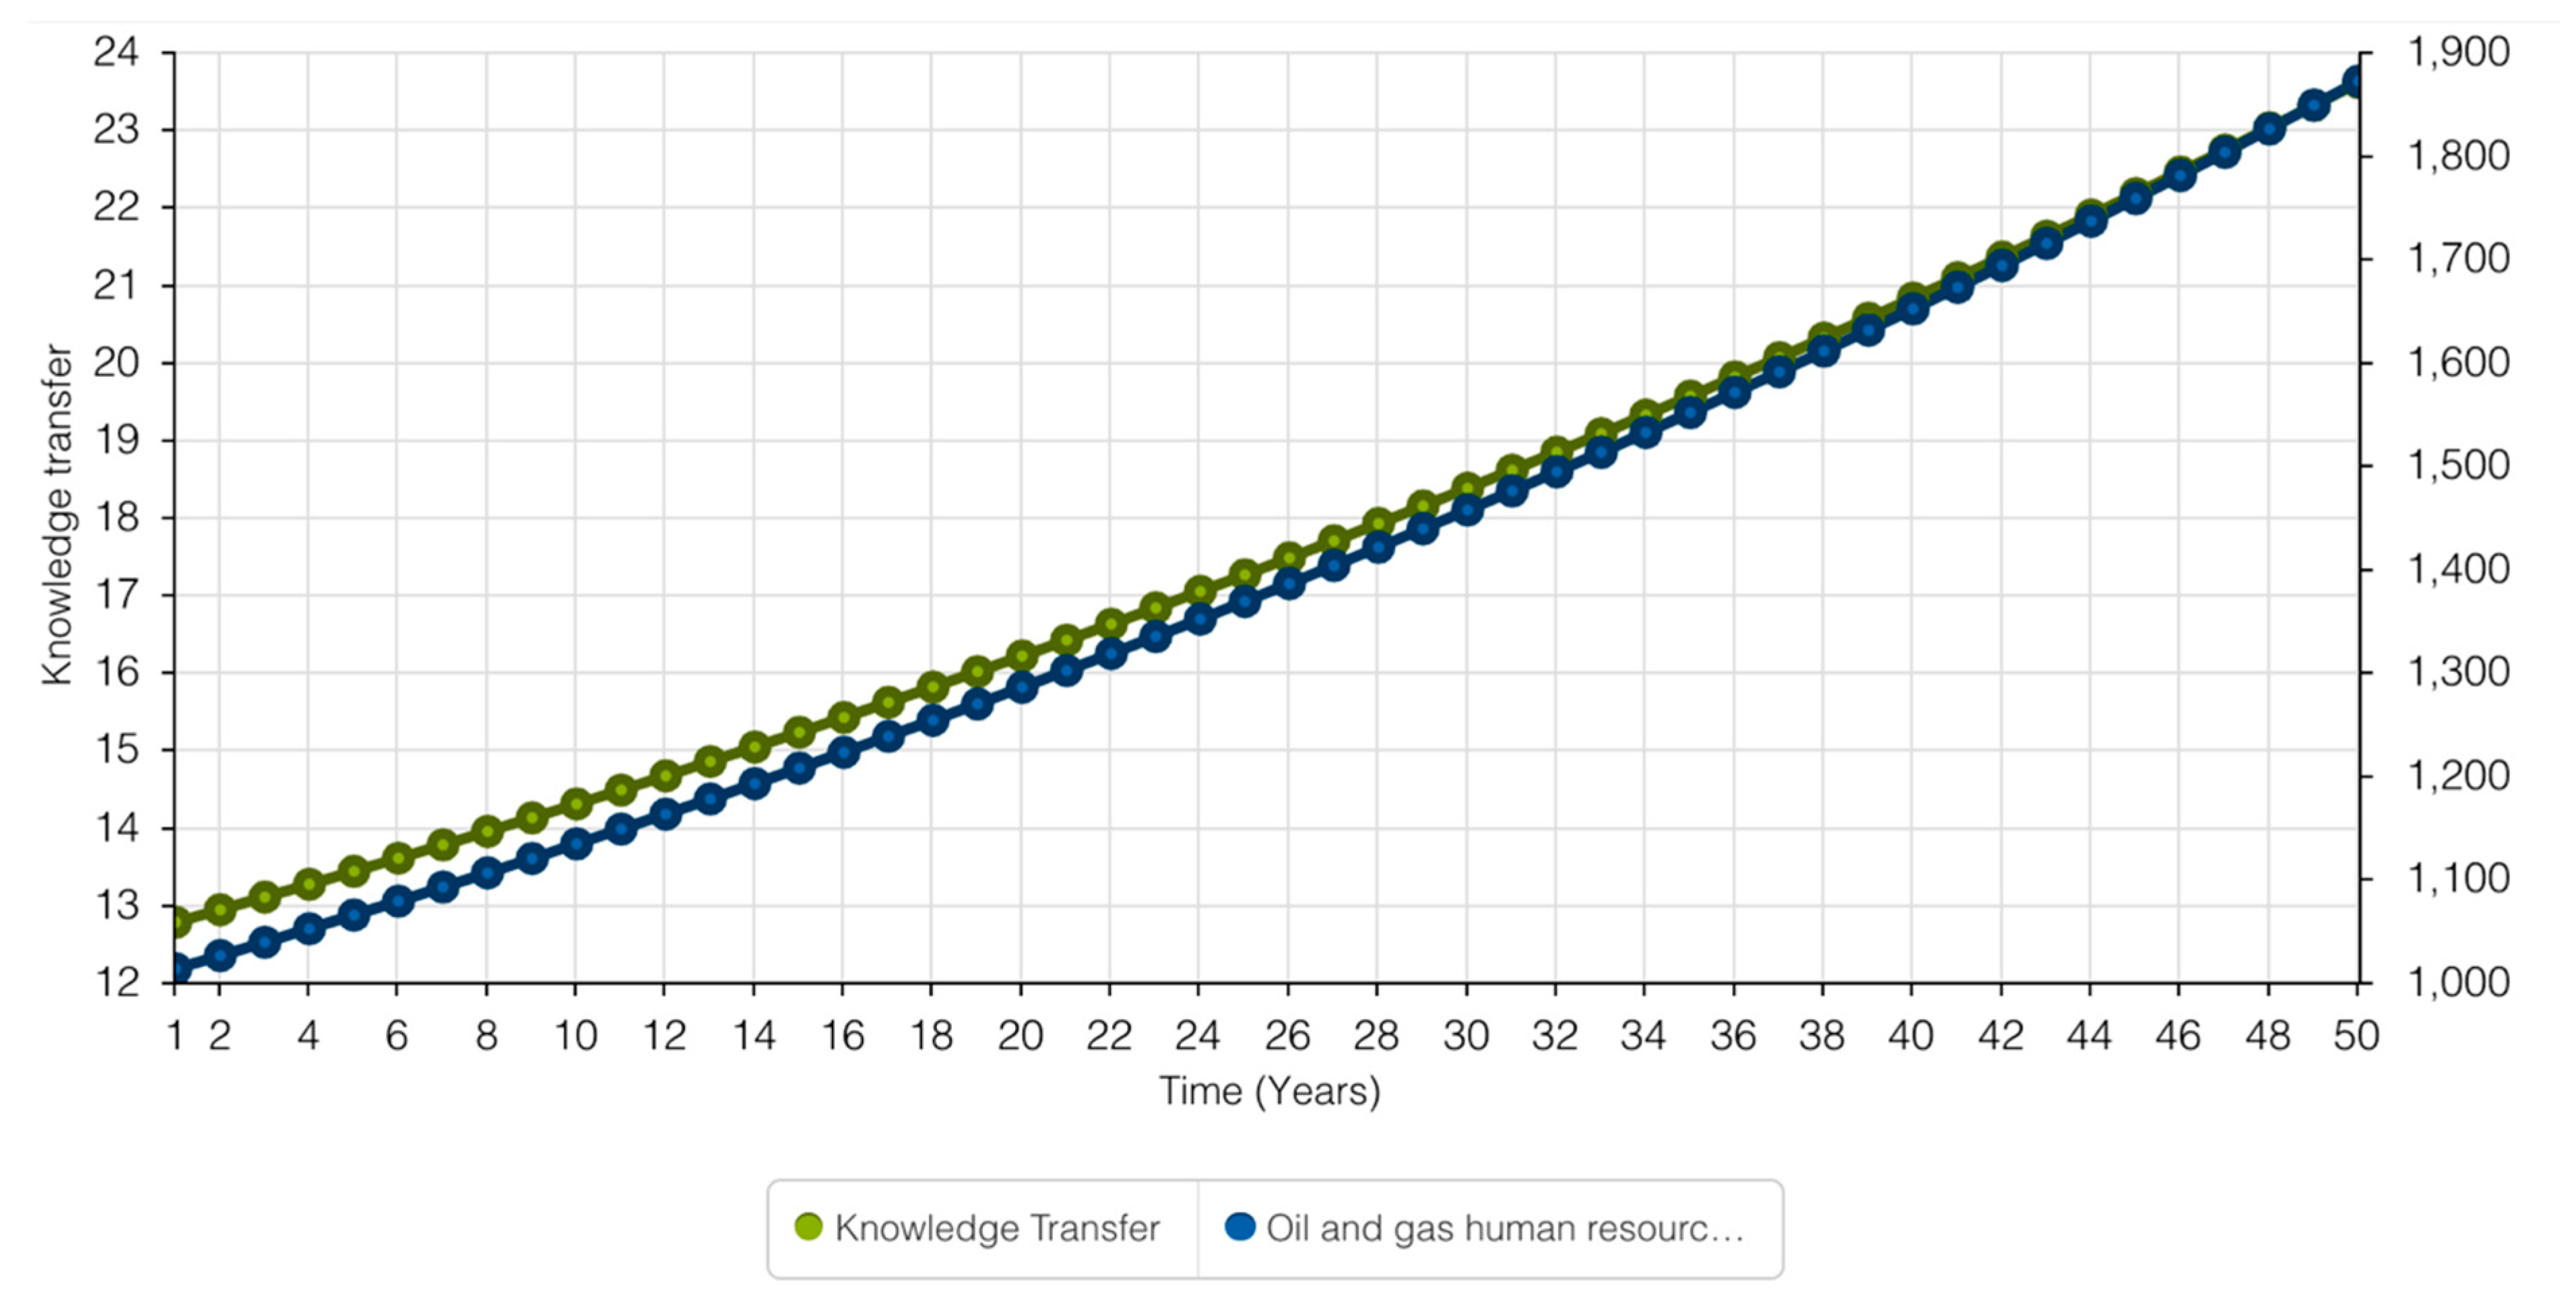
A comparison of knowledge transfer and oil and gas human resources in Figure 8 also shows a directly proportional relationship, thus creating a linear model for knowledge transfer and human resources development over 50 years.
In summary, there is linearity between revenue, oil and gas local content investment, oil production, and human resources. The validation of the models mentioned above with a sensitivity analysis under different scenarios will be subsequently produced.

3.4. Sensitivity Analysis

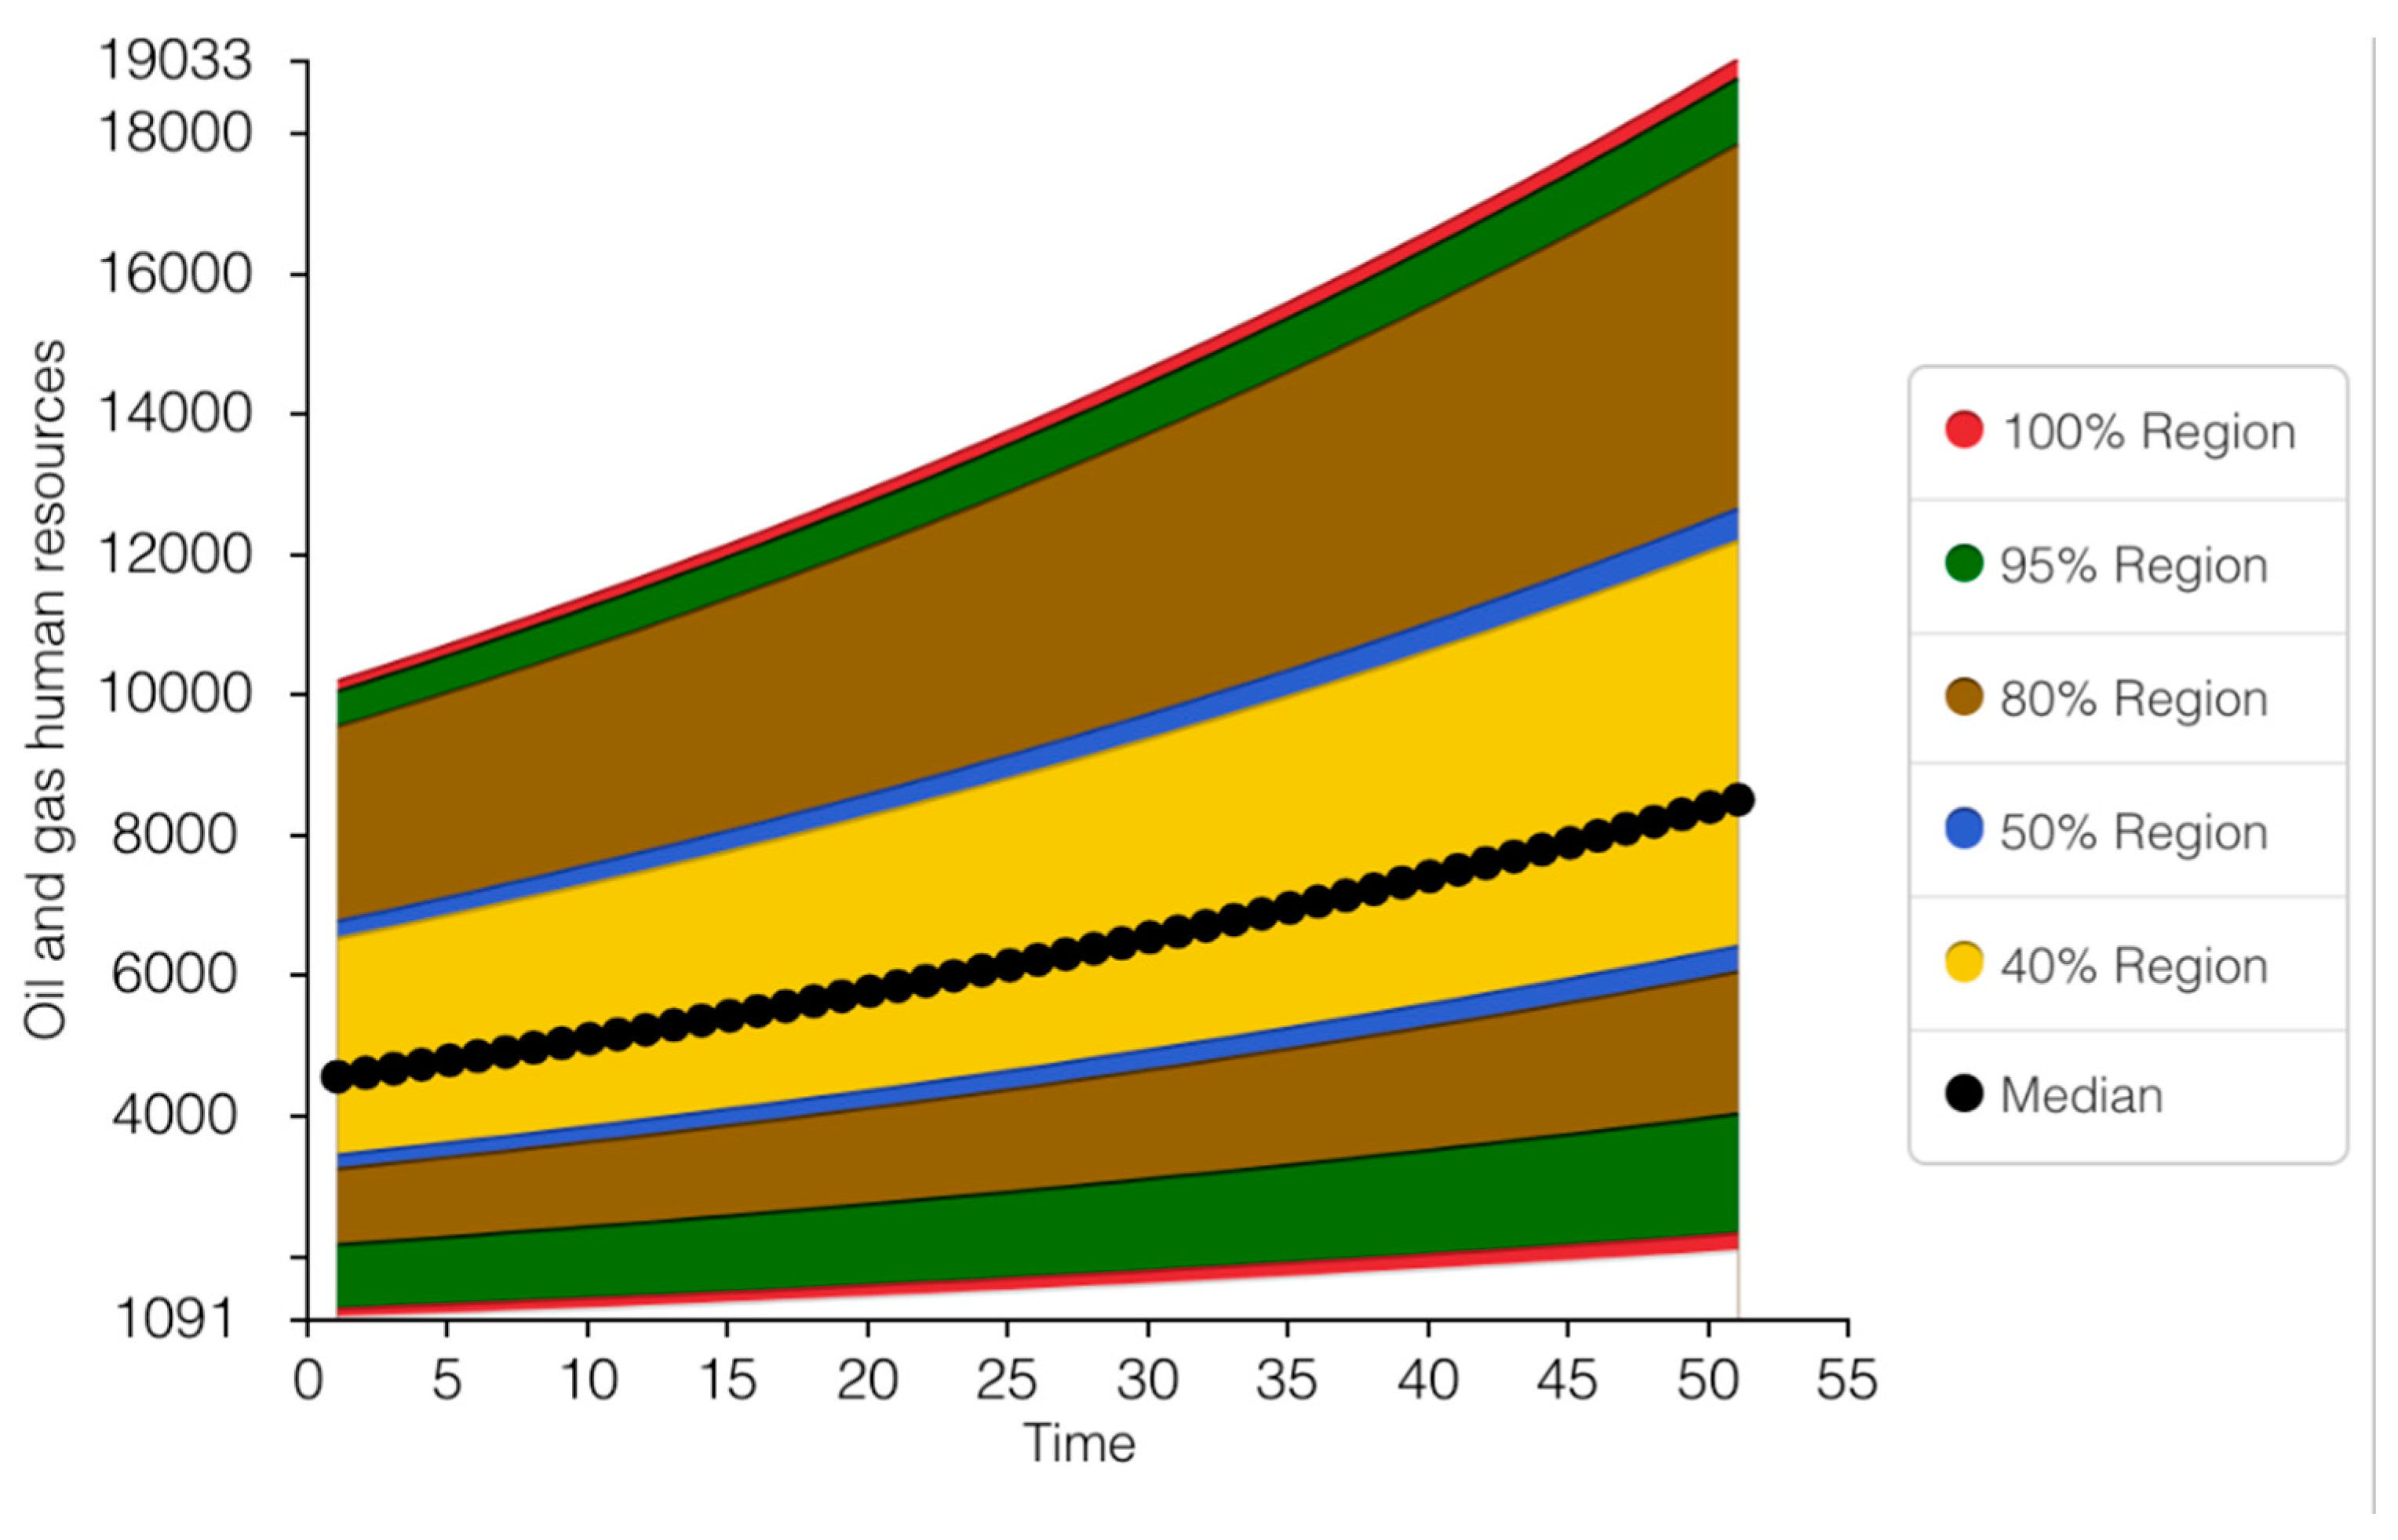
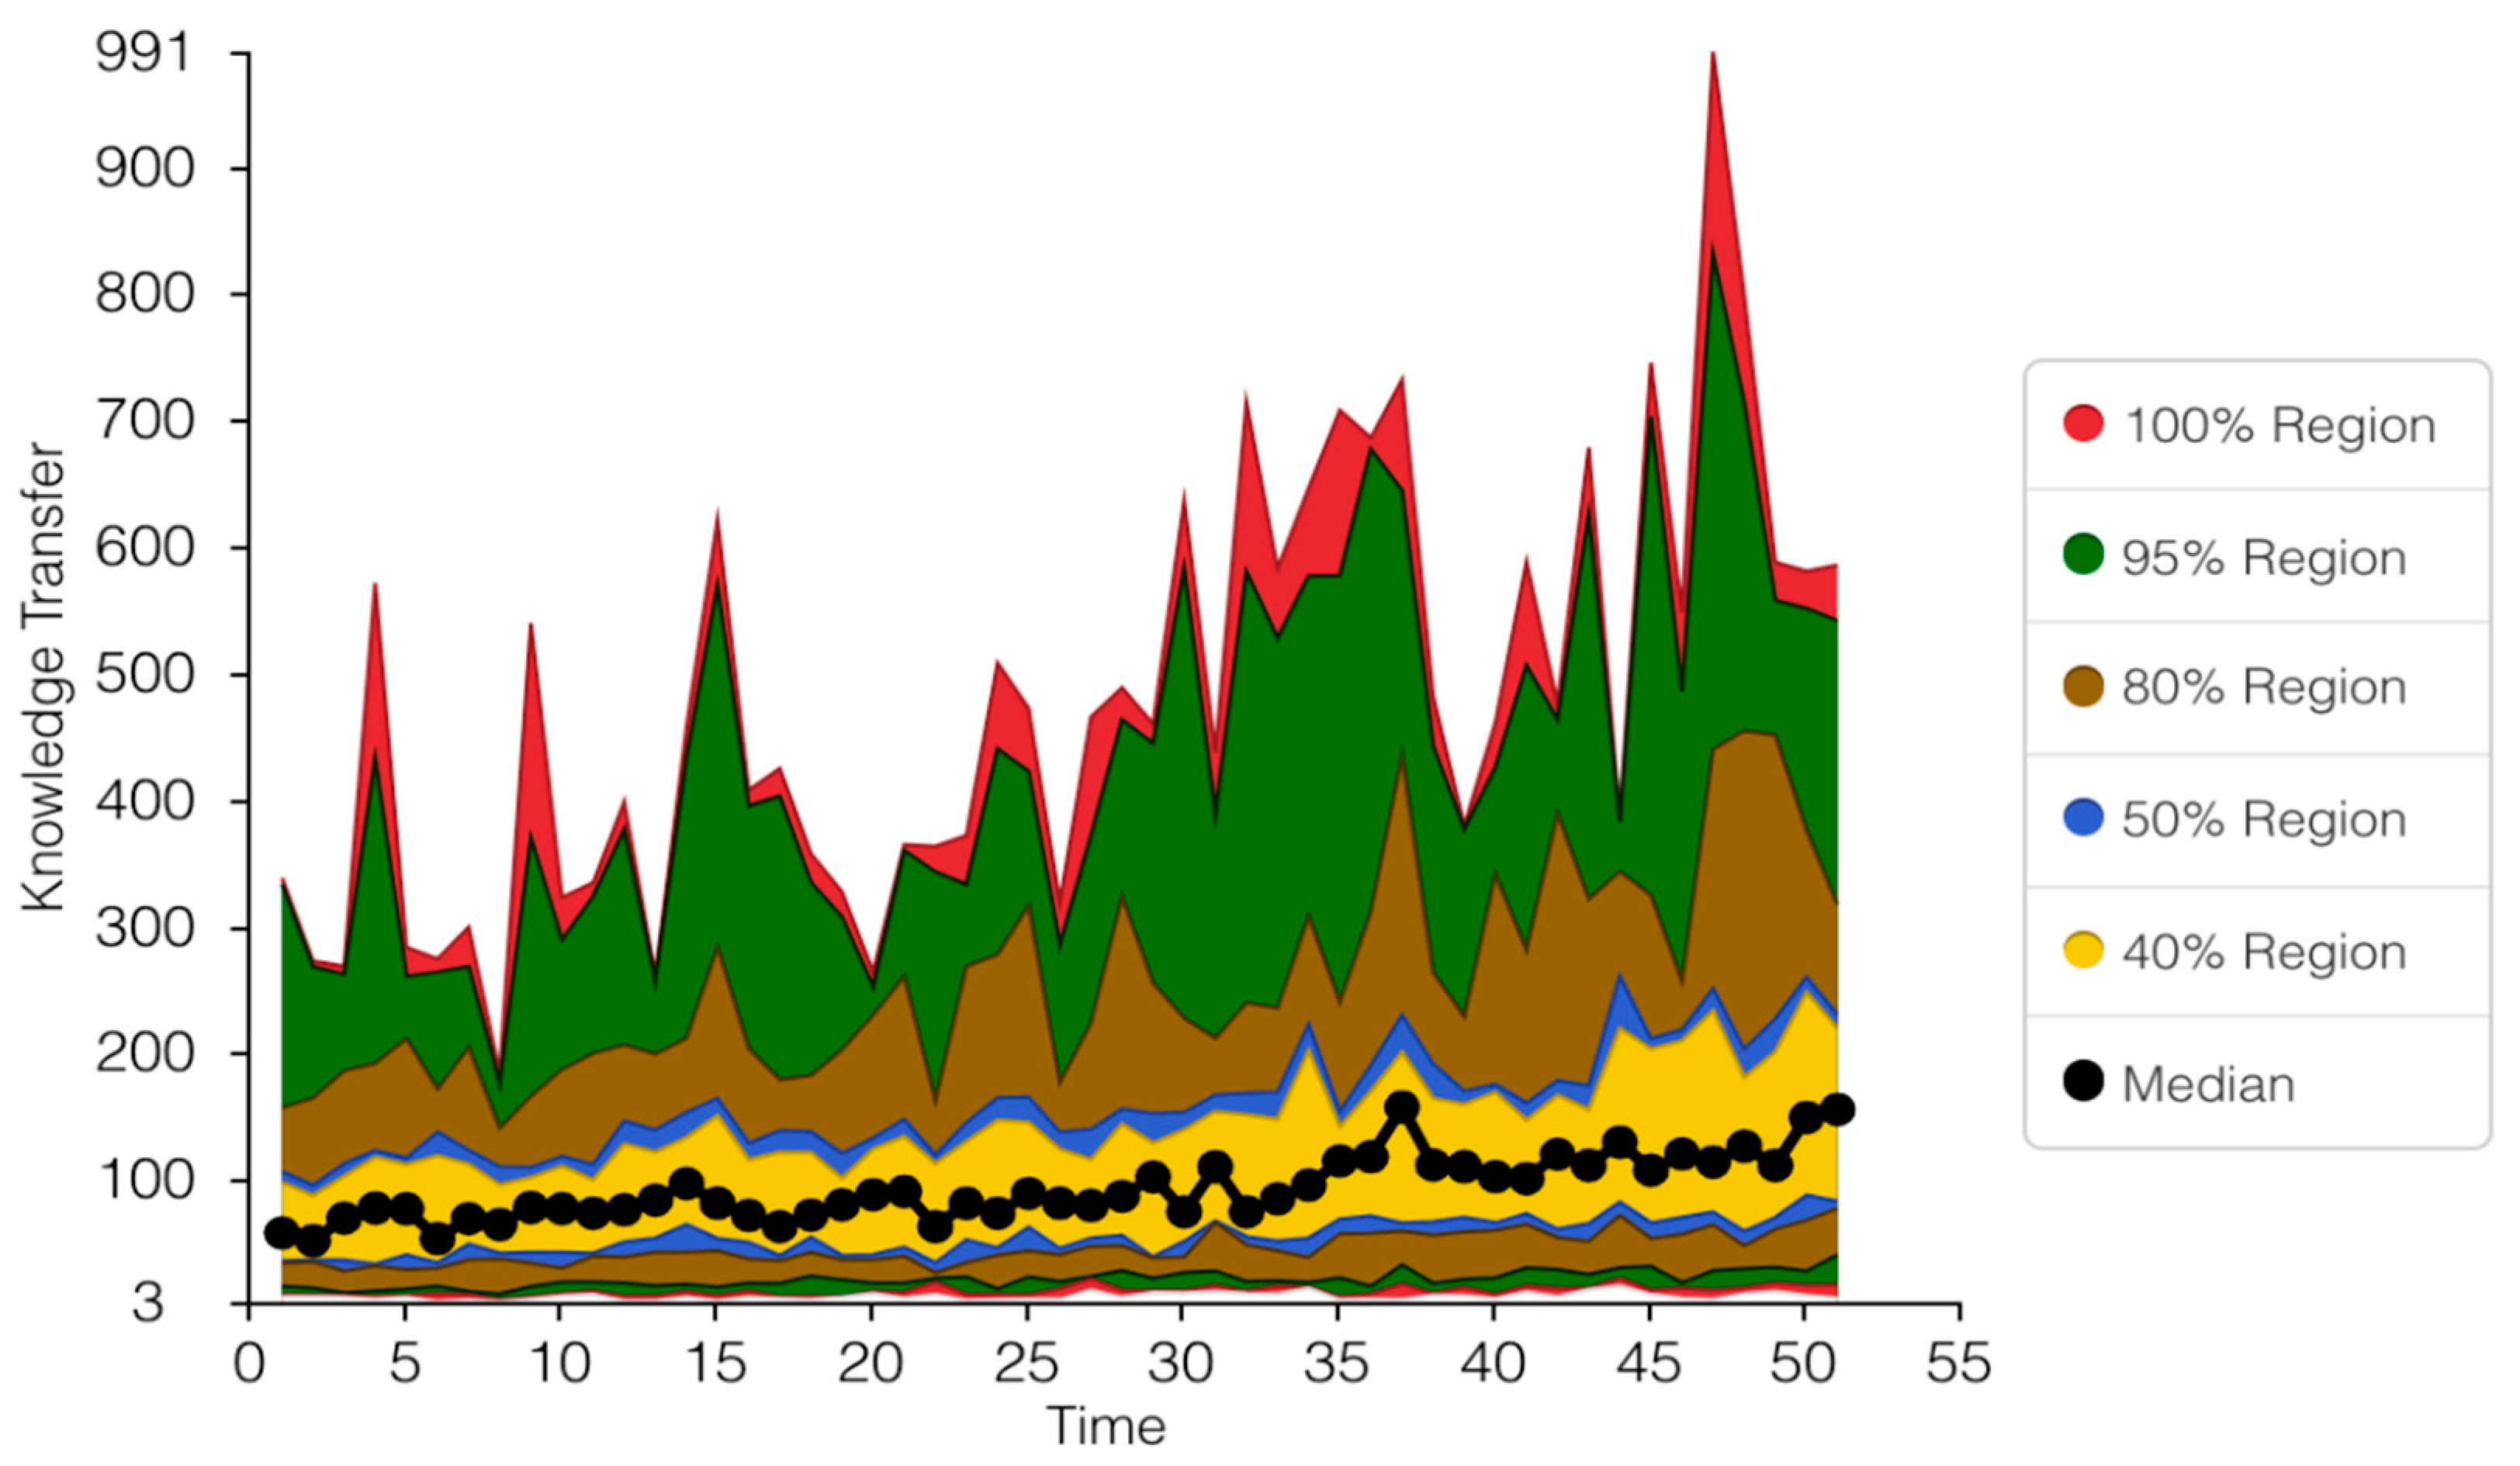
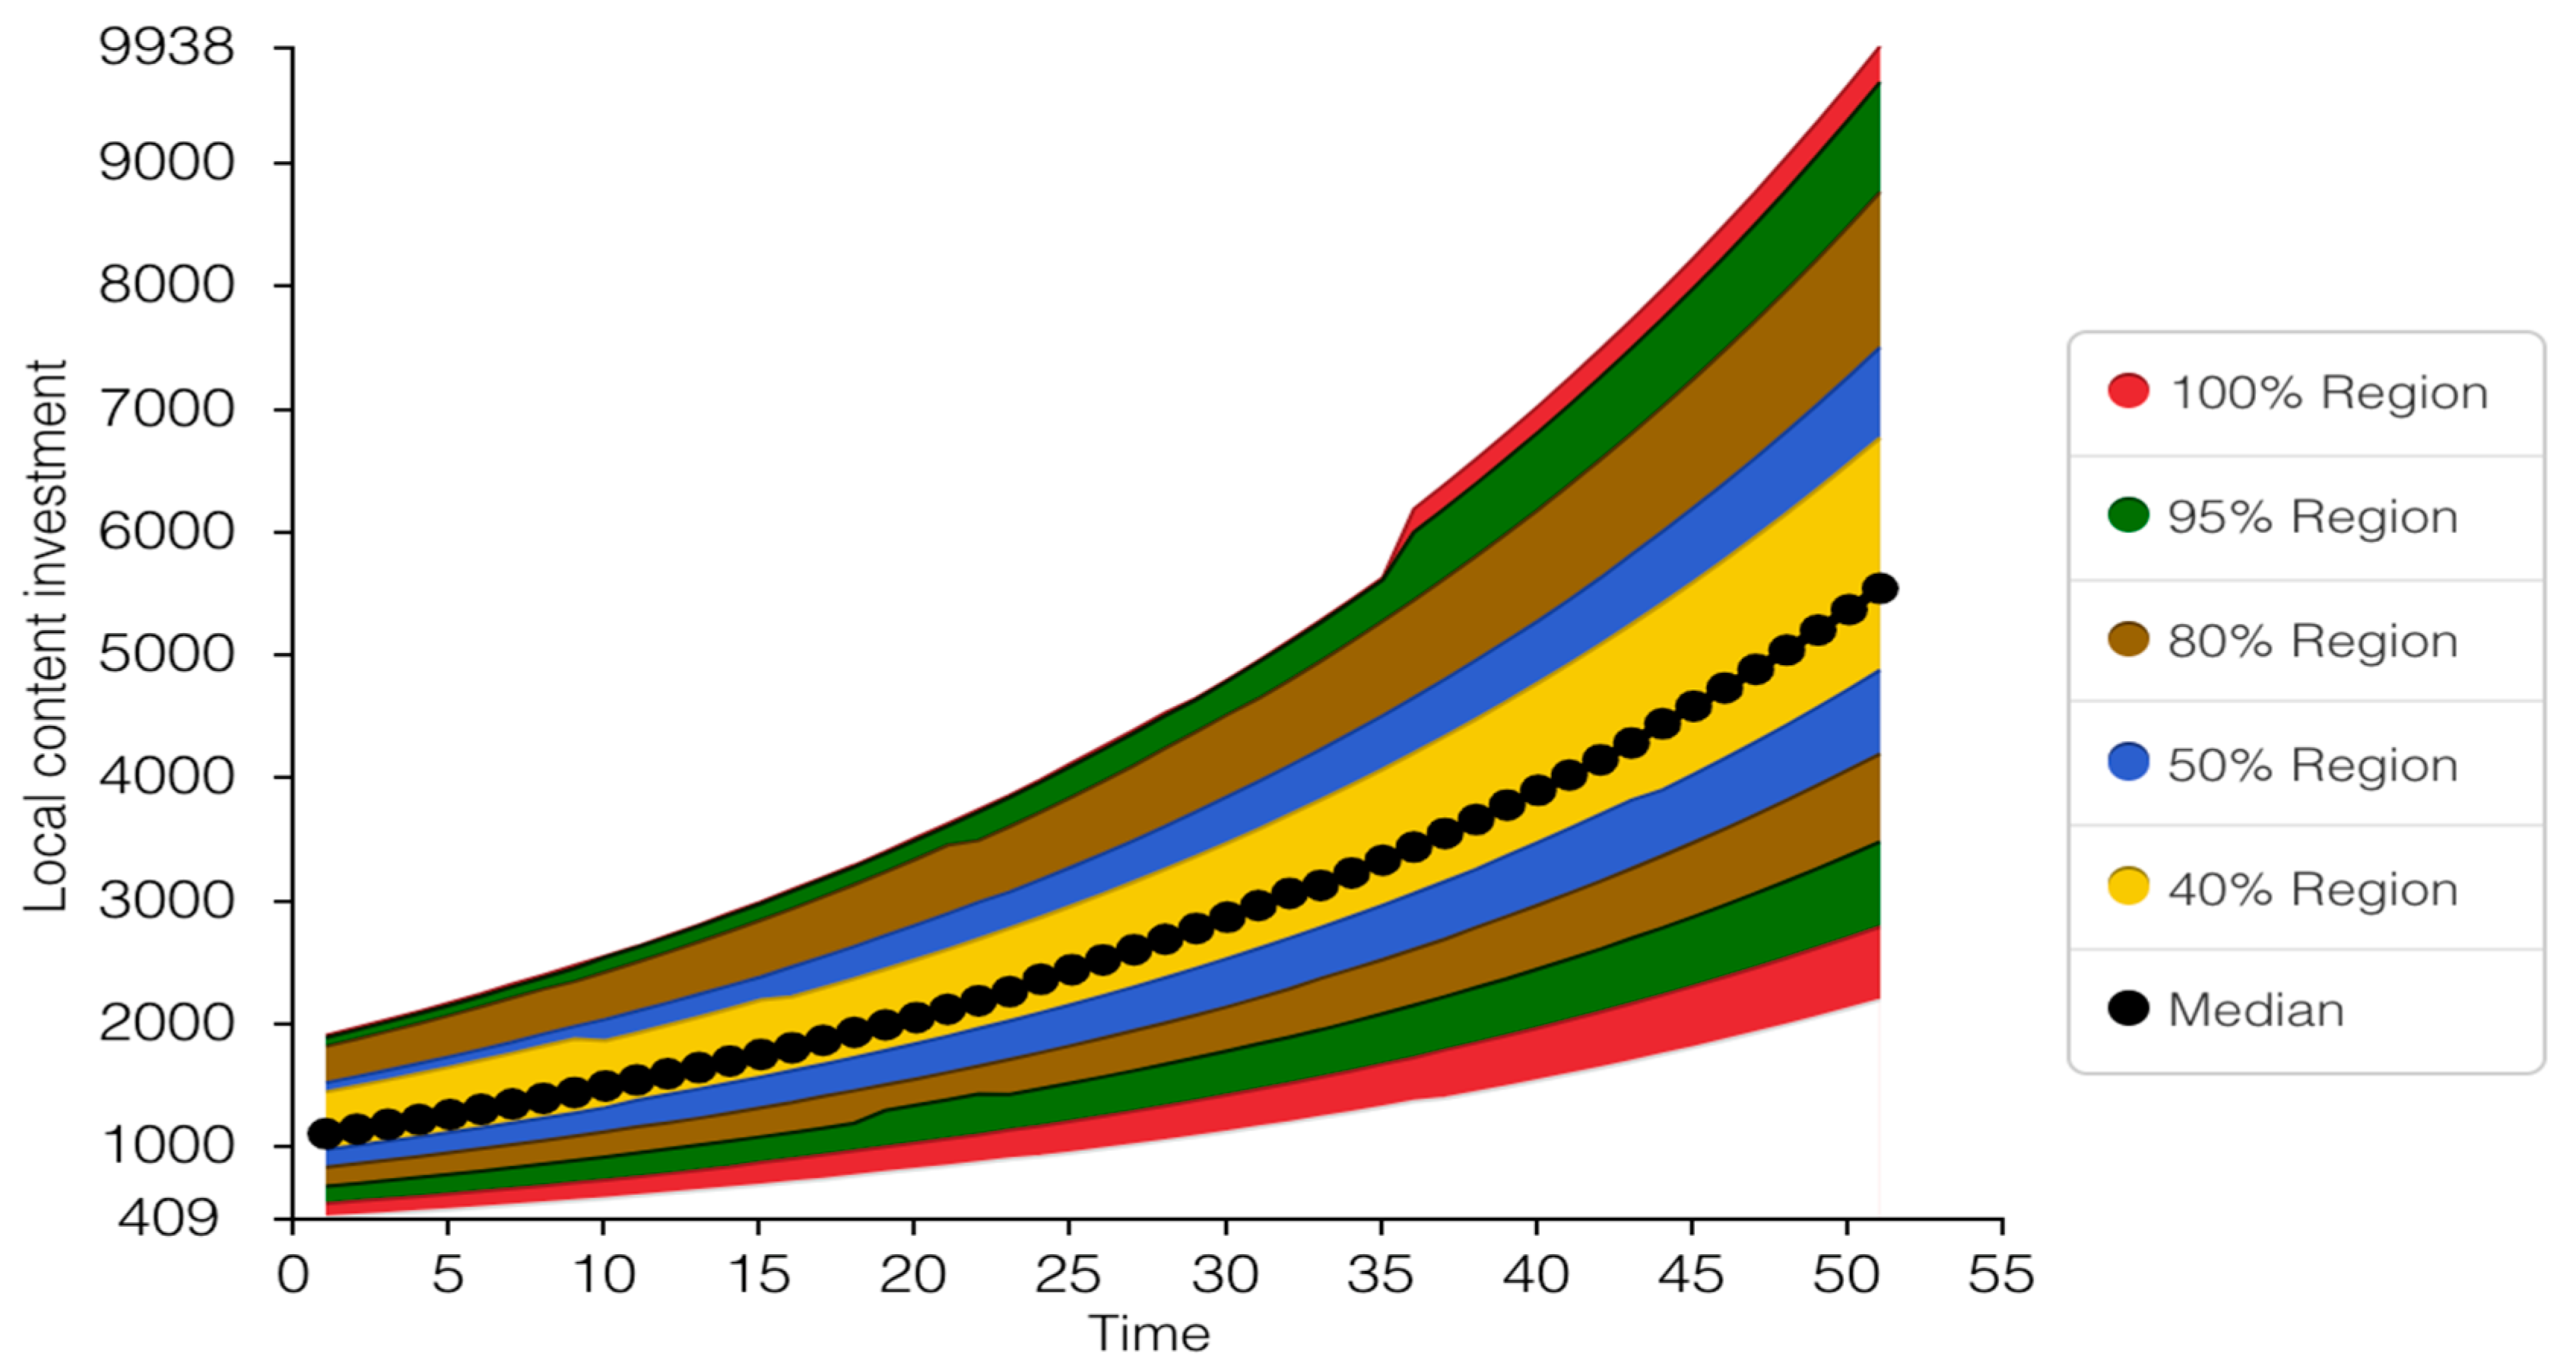
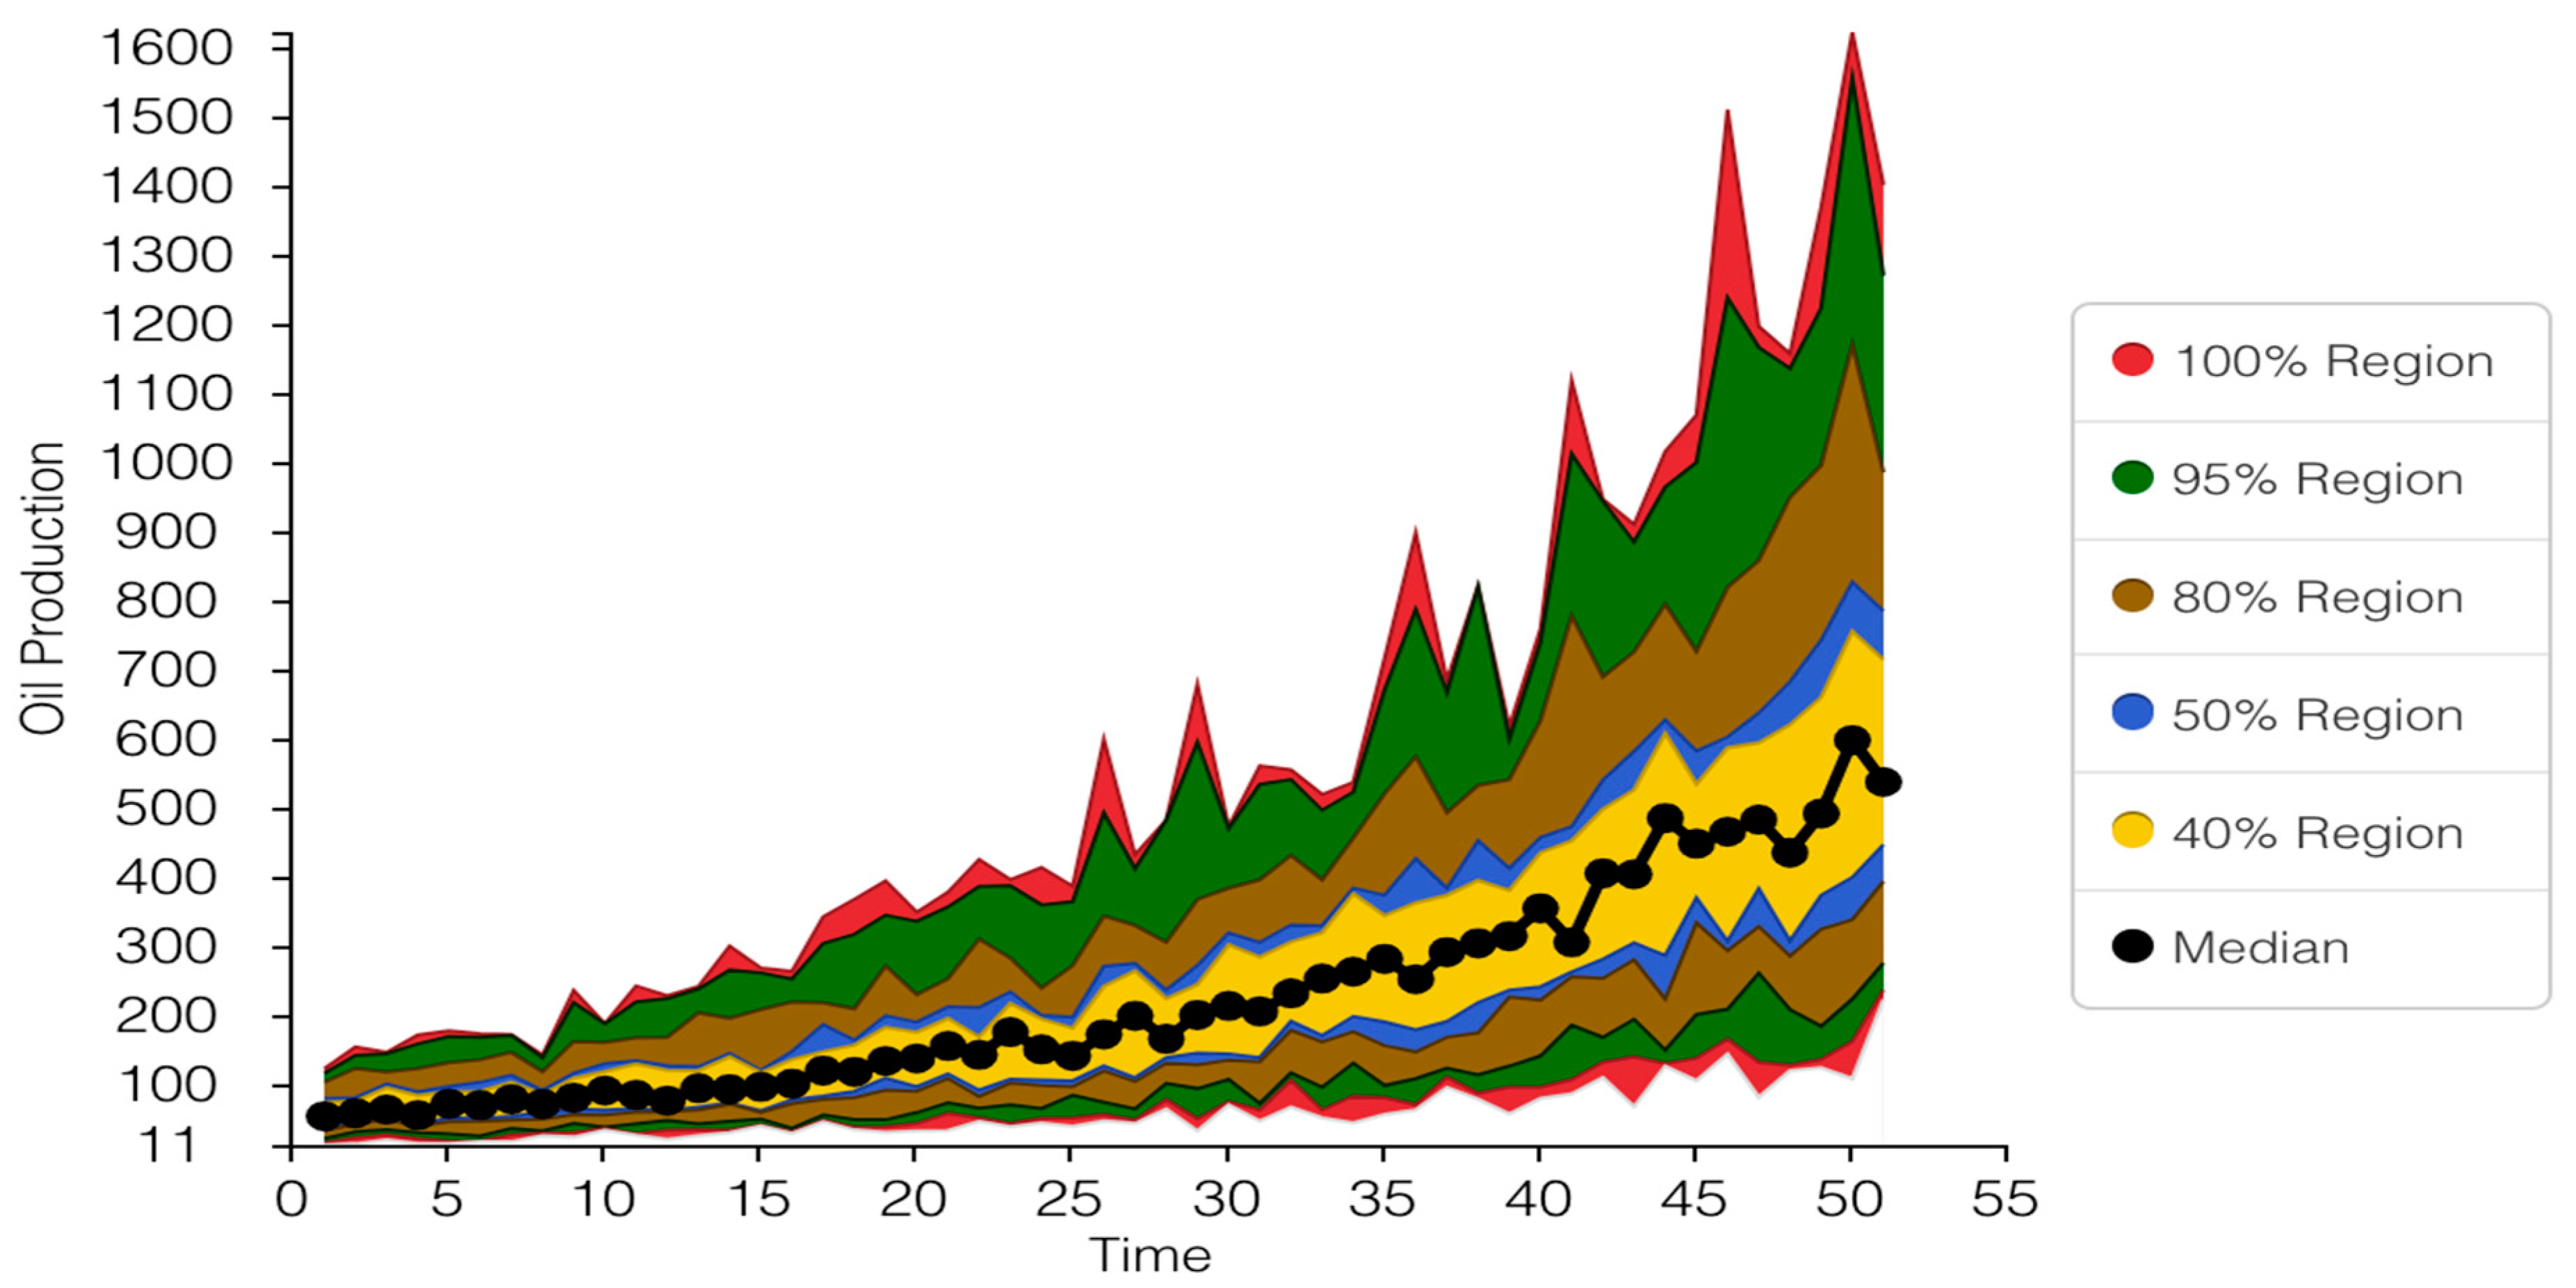
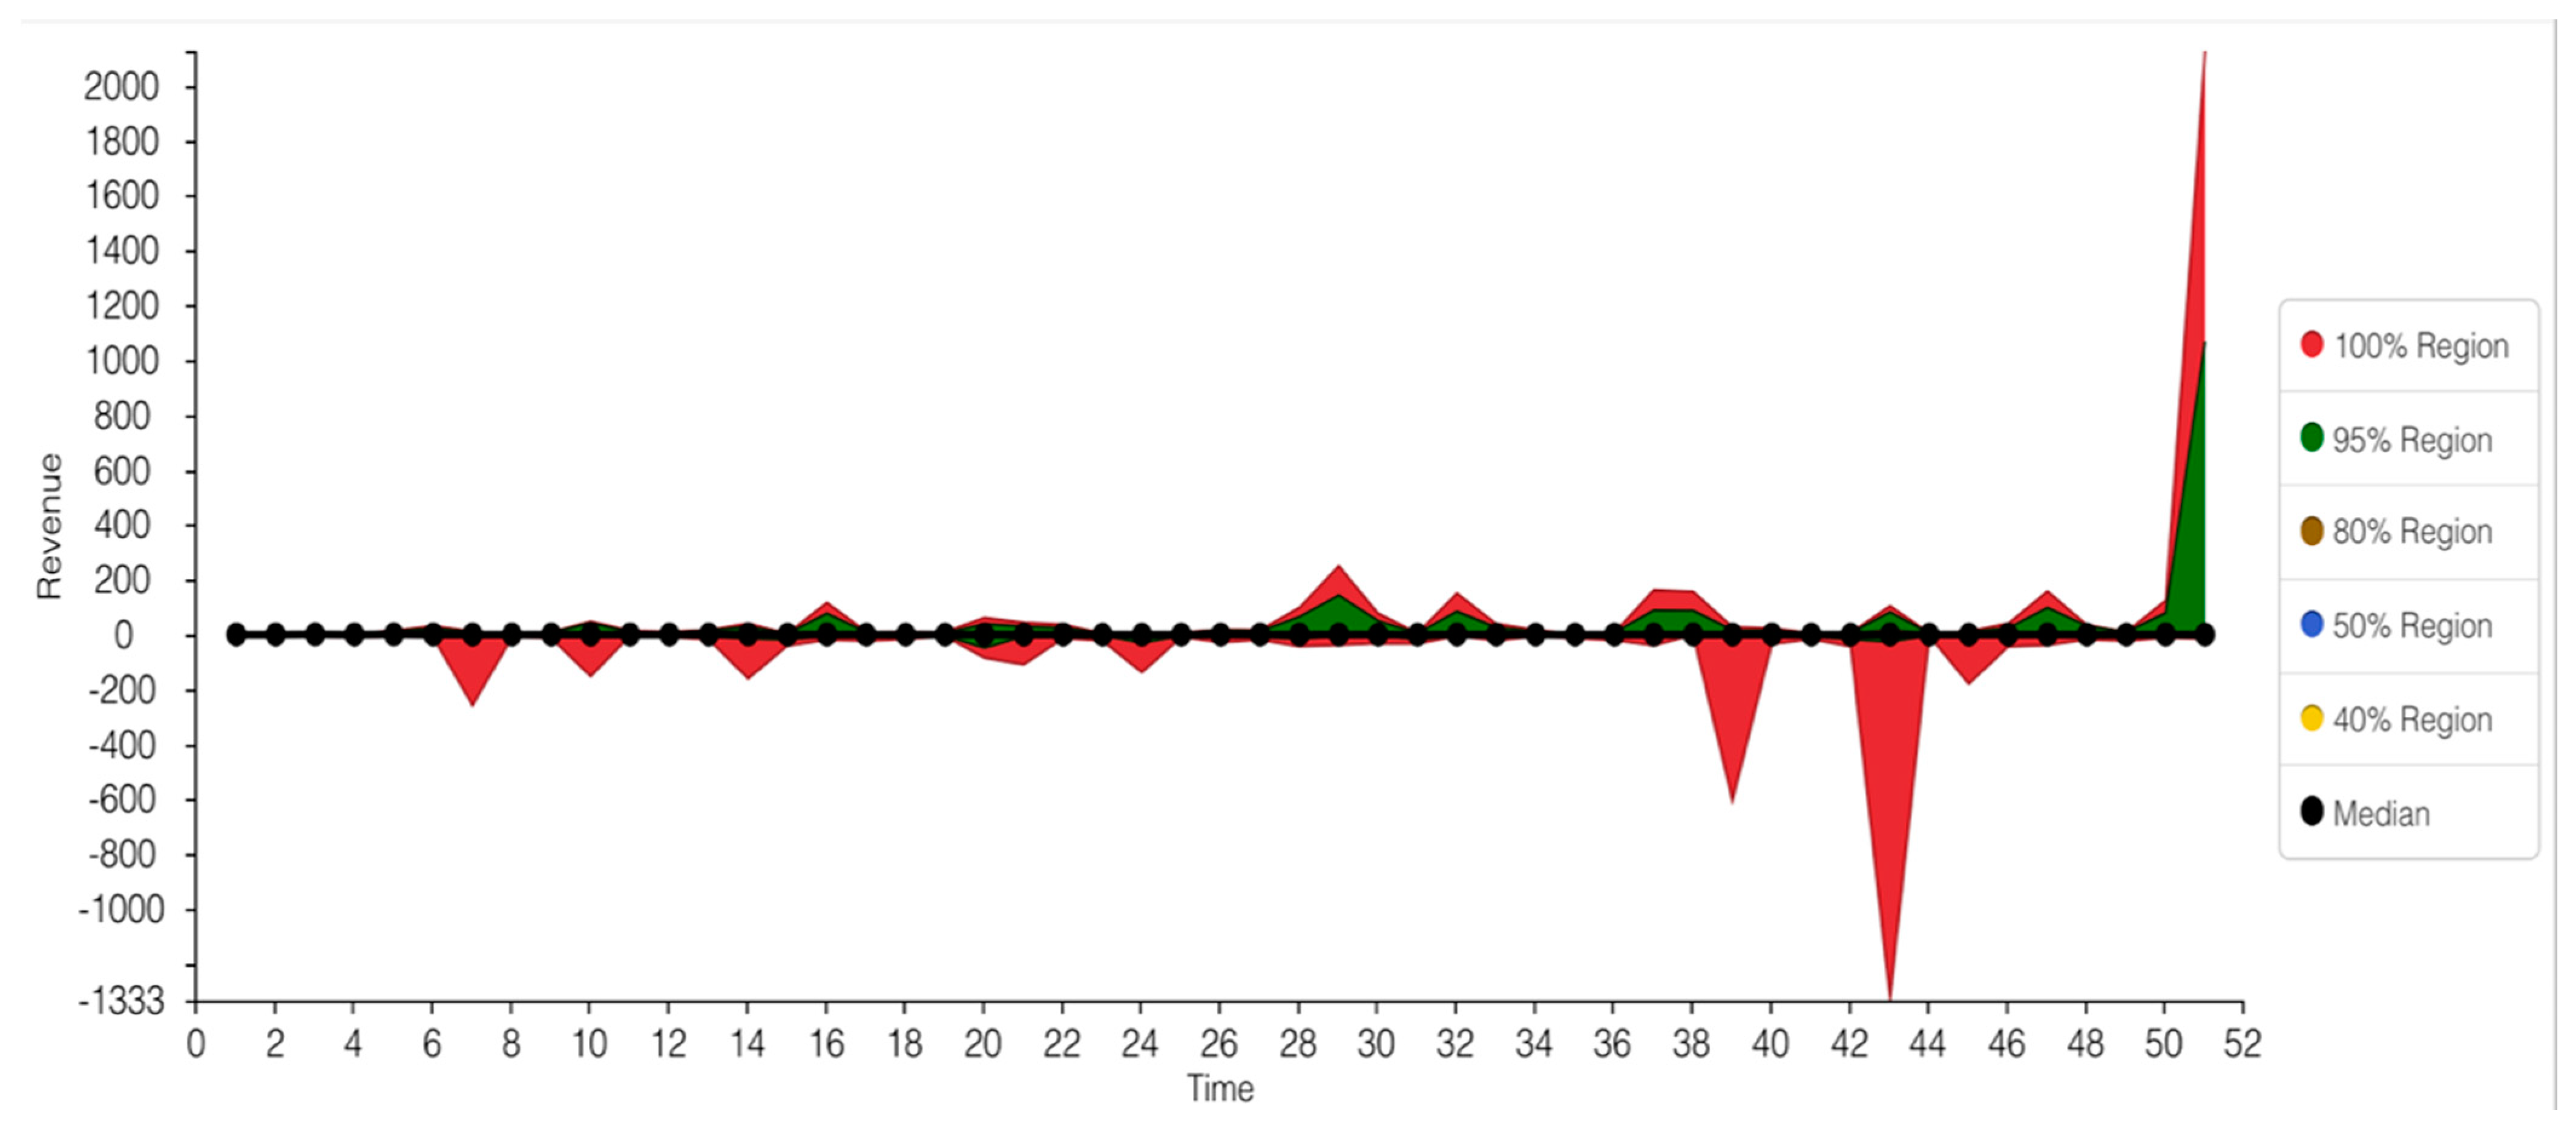
The sensitivity analysis was conducted to compare the results of the local content models under varying situations. The sensitivity analysis of oil and gas human resources, knowledge transfer, local content investment, oil production, and revenue was simulated over a range of confidence regions. These confidence regions range from 40%, 50%, 80%, 95%, to 100% under a uniform normal distribution. The sensitivity analysis in this investigation ran the simulation 50 times with random inputs to see the varying changes under a period of uncertainty. For an effective sensitivity simulation, the Rand () function was used against the existing equations for the cogent variables simulated over 50 years in Figure 9, Figure 10, Figure 11, Figure 12 and Figure 13. It is important to note that the values in the region sensitivity charts in Figure 9, Figure 10, Figure 11, Figure 12 and Figure 13 should not be taken directly as the actual values, but rather represent probable changes in the original real-life scenarios.

3.4.1. Oil and Gas Human Resources

The oil and gas human resources sensitivity analysis adopted the formula 1000*Rand (0.5, 10.5). The assumed number of oil and gas staff is 1000, and the simulated human resources only rise to 1900 staff in the stock-flow diagram. Under uncertainties and in a different situation, the number of staff may rise or fall over the next 50 years. The lower uniform random distributional minimum interval of 0.5 was used again as 10X of the minimum for the maximum distribution. The results provided a median range of 5946 staff in the first year to a maximum of 12,725 staff in the 50th year. Confidence regions show lines below and above the median values, which is linear across the years. The upper and lower intervals of 40% and 80% are more dominant in this region of the graph in Figure 9.
The lower 40% intervals provide a range of 4470 to 10,465 staff, while the upper interval is 7937 staff to a maximum of 16,608 staff. The in 80% region, the lower intervals have a minimum and maximum staff of 2131 and 4851. While the upper region of 80% provides is 1023 and 21,912 staff. These findings imply that for there to be a 10× increase in the number of oil and gas staff, it is likely that in the next 50 years, there is an 80% probability that there will be up to 21,912 staff in the oil sector. However, if there are problems in the oil section and there is a reduction of staff under 0.5 distribution, there is an 80% chance that there will be 2131 oil and gas staff in Ghana. A 100% region is very unlikely.

3.4.2. Knowledge Transfer

The knowledge transfer used the formula (Oil and gas human resources)/(R&D centres) *Rand (0.5, 2.5). The random uniform distribution of 0.5 and 2.5 was used in this sensitivity simulation. The findings provided an index with a minimum median value in the first year as 64 and a maximum of 12,725 in the 50th year. The median values slumps and rise gently throughout the 50 years. However, there most crucial confidence region is the upper 95%. The upper 95% region has an index of 183 in the first year and rises to 824 in the 47th year. The patter of the regions graph in Figure 10 reveals a higher probability of knowledge transfer over the years in Ghana with a 95% certainty. The periods of uncertainty are below the median confidence lines, and the lower 95% confidence indicates that there will likely be a lower index of 32 in the 1st year to 54 in the final year.
As compared with the stock-flow diagram simulation, knowledge transfer only has a maximum index of 24. In the best-case scenario with a 100% confidence region, there will be a maximum of 991 indices. Overall, there is a 95% probability that knowledge transfer will reach its peak in 47 years.

3.4.3. Local Content Investment

The formula 779*Rand (0.5, 2.5) was used for this sensitivity confidence analysis. The initial value of $779 million for local content investment is taken against a random uniform distribution over a period of 50 years. A median range of $1.002 billion in the 1st year rises exponentially to $5.025 billion in the 50th year, as shown in Figure 11. Across the regions, there is a 40% and 80% chance that this value will rise over the next 50 years to a maximum of $6.03 billion and $8.12 billion, respectively. On the contrary, if there is a fall in investment below the median line, this drop will still be below $1.7 billion under the 100% region in 50 years.
Comparing the regions to the simulated graph in Figure 11, local content investment rises to $4.0 billion under the present normal situation. In periods of uncertainty, which is lower than the median line, the worst-case scenario of local content investment is $409 million under a lower 10% region and a $4.0 billion investment in local content can be attained in 45 years.

3.4.4. Oil Production

Oil production in Ghana used the initial formula with a multiplication of uniform random variables of 0.5 and 2.5 interval which is stated as ((Local content investment) + (Local content policy))/((Inflation)*(Political influence)) *Rand (0.5, 2.5)
The initial value from the stock-flow diagram simulation for oil production shows that a maximum of 1.3 million BPD will be produced annually in 50 years. Under the confidence regions in Figure 12, the minimum median production value of BPD 230,000 and a maximum of 5 million BPD can be produced in 49 years. Under the upper regions of 80% and 95% confidence, there is a potential to produce a maximum of 1.1 billion BPD and over 1.5 billion BPD, respectively. These values are unrealistic because of the oil reserves in Ghana. On the contrary, a closer look at the lower boundaries reveals a 40% and 80% chance of having a maximum of a million BPD and 1.3 million BPD of crude oil production in Ghana in 50 years. The worst-case scenario will provide just 110,000 BPD in year 1.
At the moment, there Ghana has a crude oil production capacity of 196,000 BPD and it is expected to rise to 500,000 BPD by 2024 [40]. Under the confidence interval region for oil production, Ghana is currently in the lower 80% region, and the 2024 projection will be the median.

3.4.5. Revenue from Oil and Gas Production

Oil revenue sensitivity analysis is given as:
((Local content investment)/((GDP Growth rate) *(Inflation)))/(Joint venture) *Rand (0.5, 2.5))
Revenue from crude oil in Ghana reached $1.1 billion [36]. When compared with sensitivity analysis, the median value of 0.424 drops to 0.0528. This is a simulation is a period of uncertainty and thus, provides a factor for change in the existing revenue. In reality, as simulated in the stock-flow diagram of Figure 13, revenue dips between years 2 to 7, but in this sensitivity simulation, there is a 100% probability that this value will rise to almost $20 billion in 50 years. In the worst-case scenario, there will be a loss in oil revenue in 43 years.
From this analysis, it is very difficult to predict crude oil revenue over a period because of other vagaries of the global oil and gas industry and economy. Notwithstanding, this analysis is focused on human resources and local content investment in Ghana. The discussion of findings will be provided against similar projects in other oil and gas producing countries.

4. Discussion of Findings

The stock-flow diagram’s simulated findings reveal that local content human resources development in Ghana increases with local content investment, oil production, revenue generated and knowledge transfer. Local content is used to promote local business participation and involvement in production and value-added activities [41]. The stock-flow diagram simulation in Figure 8 shows that the growth rate of local content human resources in Ghana’s oil and gas sector is very low. It is projected that in 50 years, there will be adding more staff. However, in the sensitivity simulation, with ten times the effort in local content creation, there is a chance of having 20,000 more local staff in Ghana’s oil and gas sector. As studies have found, the availability of skilled human resources facilitates technology adoption and transfer and contributes significantly to improving organisational competencies and capacity, enhancing innovation. Juxtaposing the above projections with the loops indicated in Figure 2, research participants emphasised that the changing dynamics of the O&G industry amidst the call to transition to renewable energy will require strategic investments in transferrable skills that be employed in other sectors of the economy. In other words, the projected workforce feasibility will be influenced by factors such as the future trends of the global oil industry. Additionally, research participants underscored two critical issues affecting Ghana’s human resource development: policy coordination and harmonisation between the industry key stakeholders, and sustainable funding. The former means is that there should be policy harmonisation among the industry regulator, oil companies, and academia to identify areas in the oil industry for skill development and improvement. Additionally, collaboration among the stakeholders will develop a suitable curriculum in line with the industry requirements to stem what a respondent termed “unemployable graduates” coming from the local institutions. Most respondents attributed the lack of policy coordination to the lack of proactiveness on the industry regulator’s part to institute a platform for collaboration. However, a representative of the industry regulator, the Petroleum Commission, had this to say:
“Many people point their fingers at the PC … PC is just one institution. Indeed, we are the ones to enforce the law … implementation is not PC but three-fold. You have industry, PC and the academia or civil society … so it is a three-fold activity, and all of them must be seen to play their role.”
It is self-evident from the above quote that the regulator has failed to play the role of facilitation. Facilitation will create the forum for policy discussion affecting the LC and the possible solutions thereof. Accordingly, the effective implementation of LC strategies in Ghana will depend on concerted engagement between the PC, academia and the oil companies. Delineating the above stakeholders’ roles and creating a shared platform for policy discussion and coordination are essential for implementing the LC policy. The regulator as the lead-implementor of the policy, must not only enforce it but also facilitate and coordinate policy discussion regularly between the interested parties. The local academia must lead in research and development, train and develop local capacity, and develop a curriculum pertinent to the oil industry’s requirements. Research participants emphasised the need for developing a curriculum that builds skills that are transferrable to other sectors of the economy. This collaborates the argument that the sustainable way of building capacity in skills and training that will create value is to focus on skills transferrable to other sectors of the economy [42]. Similarly, the oil companies must comply with the necessary laws and assist in training and transferring the know-how to the locals. The other issue affecting HRD is the lack of sustainable and dedicated funding either from the government or the oil companies to support local skills development via supporting local institutions. The establishment of a special fund can be channelled into what a research participant termed …” three-way partnerships: technical institute, universities and R&D centres …”. The oil companies can create a pool of resources either solely or in collaboration with the government to support the “three-way partnership” for skills development. The oil companies can be compensated with reduced taxes for contributing financially to the special fund and must jointly administer the fund with the government. The oil companies’ assistance enhances cordial relations with the government and local authorities thereby giving the oil companies ‘social license to operate. Creating a fund presents its challenges as summarized by a respondent:
“… government has several credit facilities … the challenge is that these are not well coordinated and often politicized …”
Political interference is pervasive in the administrative and operational functions of state institutions, thereby curtailing their effectiveness. Therefore, the fund must come with enforceable guidelines that specifically curtail interference in their activities. Additionally, political leadership must strengthen state institutions to act independently of government interference and rent-seekers, and depoliticise appointments into state institutions. It must be stated strongly that whatever the oil companies do in supporting the purported fund or complying with the LC regulations should be seen as a complement to the overall government’s strategy in developing its human resource base. Therefore, governments of host countries must be at the centre stage in devising strategies and taking responsibility in addressing potential industry demand. Consequently, the study argues that, with the mere enactment and enforcement of LC regulations (requiring oil companies to employ locals etc.) without a grand strategy that invests in building a human resource base, the intended purpose of the LC, to develop local capability and transfer know-how among others, will fail.
The sensitivity analysis projected local content investment to increase from $799 million to $3.0807 billion in 50 years, with a corresponding revenue increase from $29 billion to $44 billion in 50 years. Consequently, an urgent need to invest part of the oil revenue in developing additional educational infrastructure and R&D centres. More importantly, a local content strategy for developing domestic skills and capacity should be aligned with national development plans. This would allow deep introspection concerning the opportunities and future challenges in the oil industry (i.e., energy transition), what gaps need to be addressed, and the role the oil enclave plays in the broader economy. Other studies identified the disparity in salaries between foreign expatriates and local Ghanaian oil and gas staff attributed to corruption and undercutting by local recruitment agencies [43]. Corruption is a significant obstacle to local content development in Ghana. In most African countries with very low local content involvement in the oil and gas sector, the oil revenue has not contributed to local content development because of corruption. It has been suggested a retrospective analytical tool in identifying strategies for local content development [44]. One of the strategies identified is behavioural change. Behavioural change in local content development goes beyond investment. The attitude of oil and gas recruitment agencies towards local staff in Ghana must change for equity and equality. Local staff must be treated fairly and with equity by local recruitment agencies. Furthermore, the local content law in the oil and gas sector must set salary standards that are not too far apart from foreign expatriates’ salaries.

5. Conclusion and Limitations of the Study

The study was performed to recommend policy options to Ghanaian policymakers and industry players in developing human resources for the local oil industry. Consequently, the study adopted system dynamics aided in systematically analysing the long-term dynamic behaviour of human resource development in the oil industry in Ghana. The study found that two critical issues affecting HRD: policy coordination and harmonisation, and sustainable funding. The former stresses a lack of policy coordination among the industry stakeholders and the latter is exacerbated by the pervasive political interference in the administrative and operational functions of state institutions. Accordingly, developing sustainable human resources for the industry will require a concerted engagement between the key industry players comprising the regulator, oil companies and academia. Additionally, the changing dynamics of the oil industry will require a thoughtful investment in transferrable skills thereby making it sustainable. Establishing a dedicated fund for capacity-building must be predicated on an independent institution that curtails political interference and rent-seeking behaviour. Strong institutions are important to reduce the current phenomenon in Ghana whereby accessing credit is based on political connections and affiliations.
The sensitivity analysis projected a potential labour demand of 20,000. Addressing this labour demand will require a comprehensive government strategy that deals with overlapping policies among different industry stakeholders. The study also found that local content investment is projected to increase from $799 million to $3.0807 billion in 50 years, with a corresponding revenue increase from $29 billion to $44 billion in 50 years. To meet the industry’s projected demand, the government will have to invest in the high leverage points of educational infrastructure—higher educational institutions, R&D centres, training, increasing joint ventures to build local skills and capacity, and aligning local training courses to meet industry’s requirements. Moreover, the study found that there is a local content stifling constraint that can also be attributed to behaviour rather than strategy. Government strategy is essential in local content development, whereby investments and revenue are crucial.
It is important to underscore the limitation of the study. First, the study focused on the peculiar challenges of local content implementation in Ghana’s O&G industry which presupposes that caution must be taken in generalising the findings to different industry sectors and geographic areas. More importantly, the selection of the variables for the modelling was based on the need for manageable model size and the study’s participants understanding of variables important to the phenomenon under deliberation. In using the sensitivity analysis for the projections, the formula selected has only addressed the projections from one perspective. This was done to create a focal direction for the audience of this research. Further studies will produce a more comprehensive sensitivity analysis under varying circumstances. These assumptions are based on the fact that the shift towards renewable energy and cleaner energy would be gradual, and oil will still play important role in world energy over the next three decades. This study recommends further research addressing the impact analysis of rent-seeking and political interference in Africa’s parastatal oil companies.
Managerial implication: Addressing the human resource needs of the Ghanaian oil industry must involve all the key players in the oil industry. The industry regulator cannot be the sole initiator of strategies without inputs from other players.

Author Contributions

Conceptualisation, K.A.O. and T.S.O.; formal analysis. K.A.O. and T.S.O.; methodology, K.A.O., T.S.O. and P.B.; project administration, K.A.O., T.S.O., P.B.; data curation, K.A.O. and T.S.O.; resources, T.S.O. and K.A.O.; software, T.S.O. and K.A.O.; supervision, T.S.O., P.B. and B.B.; validation, T.S.O. and K.A.O.; writing—original draft, K.A.O. and T.S.O.; writing—review and editing, K.A.O. and T.S.O. and P.B. All authors have read and agreed to the published version of the manuscript.

Funding

This research was self-funded by the authors.

Institutional Review Board Statement

Not applicable.

Informed Consent Statement

Informed consent was obtained from all subjects involved in the study.

Data Availability Statement

Not applicable.

Conflicts of Interest

The authors declare no conflict of interest.

Appendix A

Table A1. Parameters for the systems dynamics model.
ParametersTypeUnitValueEquation
Local content investment Stock$779 mValue
GDP growth rateStock%6.7Value
Oil and gas human resourcesStockPeople1000Value
Local content policyAuxiliary%51Value
Training AuxiliaryUnitless10[Local content policy]/10
Inflation rateAuxiliary%7.8Value
Joint ventureAuxiliaryUnitless50Value
Knowledge transferFlowUnitlessNil[Oil and gas human resources]/[R&D centres]
Oil productionFlowBpdNil([Local content investment] + [Local content policy])/([Inflation]*[Political influence])
R&D centresAuxiliaryUnitless13[Training]*[Foreign Expatriates] + 13
Relevant programmesAuxiliaryUnitlessNil[R&D centres]/13
Foreign expatriatesFlowUnitlessNilIfThenElse ([Local content policy], 13, 12)
Political influenceAuxiliaryYears4Value
Local technical staffAuxiliaryPeople55905590/[Relevant programmes]
Table A2. Incremental values of local content investment for 50 years.
YearsKnowledge TransferLocal Content Investment ($m)Oil and Gas Human ResourcesOil ProductionRevenue
112.61034048779100026.60256410.298124761
212.76936117805.30443931012.6103427.445655110.295062356
312.93038716832.45503211025.37970228.315866410.292670413
413.09344374860.47822811038.31008929.214045770.290851024
513.25855653889.40142281051.40353330.141071240.289526577
613.42575144919.25296751064.66208931.097851520.288634708
713.59505474950.06218431078.08784132.085326420.288124706
813.766493981.8593861091.68289533.10446750.287954906
913.940093171014.6758991105.44938834.15627880.288090758
1014.115882491048.5440871119.38948135.241797650.288503378
1114.293888571083.4973811133.50536436.362095540.289168442
1214.474139381119.5703081147.79925237.51827910.290065336
1314.65666321156.7985221162.27339238.711491080.291176488
1414.841488711195.2188361176.93005539.942911420.292486847
1515.028644941234.8692611191.77154441.213758370.293983461
1615.218161271275.7890361206.80018942.525289610.295655146
1715.410067471318.018671222.0183543.878803540.297492206
1815.604393661361.5999821237.42841745.275640440.299486218
1915.801170381406.5761361253.03281146.717183840.301629846
2016.000428521452.991691268.83398148.204861860.303916687
2116.202199371500.8926351284.8344149.740148560.306341151
2216.406514621550.3264421301.03660951.324565460.30889835
2316.613406361601.342111317.44312452.9596830.31158401
2416.822907071653.9902091334.0565354.647122070.314394399
2517.035049651708.3229361350.87943756.388555650.317326257
2617.249867431764.3941661367.91448758.185710440.320376747
2717.467394131822.2594991385.16435560.040368570.323543407
2817.687663921881.9763251402.63174961.954369380.326824105
2917.910711381943.603871420.31941363.929611210.330217009
3018.136571552007.2032641438.23012465.968053330.333720557
3118.365279892072.8375971456.36669568.071717840.337333426
3218.596872332140.5719811474.73197570.24269170.341054513
3318.831385222210.4736181493.32884872.483128790.344882915
3419.06885542282.6118641512.16023374.795252060.348817907
3519.309320162357.0582981531.22908877.181355720.352858933
3619.552817262433.8867951550.53840879.643807540.357005586
3719.799384942513.1735971570.09122682.185051190.3612576
3820.049061932594.9973911589.89061184.807608680.365614837
3920.301887422679.4393851609.93967387.514082840.370077281
4020.557901142766.583391630.2415690.307159940.374645022
4120.817143272856.5159051650.79946193.189612340.379318259
4221.079654532949.3261991671.61660496.164301250.384097284
4321.345476153045.1064031692.69625999.234179590.388982481
4421.614649883143.95161714.041735102.40229490.393974318
4521.887217973245.9599211735.656385105.67179230.399073345
4622.163223243351.232641757.543603109.04591790.404280187
4722.442709033459.8742781779.706826112.52802170.409595542
4822.725719233571.9927041802.149535116.1215610.415020177
4923.012298293687.6992451824.875254119.8301040.420554923
5023.302491213807.1087941847.887553123.65733310.426200677

References

  1. NEPAP. Available online: http://www.nepad.org/nepad/news/1429/africa-richer-you-think-says-exciting-new-african-wealth-cheque-report (accessed on 14 July 2020).
  2. Bakwena, M.; Bodman, P.; Le, T.; Tang, K.K. Avoiding the Resource Curse: The Role of Institutions. Available online: https://www.researchgate.net/profile/Thanh-Le-33/publication/47332076_Avoiding.the_Resource_Curse_The_Role_of_Institutions/links/0046351d25fa86ed6b000000/Avoiding-the-Resource-Curse-The-Role-of-Institutions.pdf (accessed on 22 March 2021).
  3. Natural Resource Governance Institute (NRGI). Available online: https://resourcegovernance.org/about-us/what-we-do/strategy (accessed on 15 July 2020).
  4. Sigam, C.; Garcia, L. Extractives Industries: Optimising Value Retention in Host Countries; UNCTAD: Geneva, Switzerland, 2012. [Google Scholar]
  5. Omenikolo, I.A.; Amadi, R.O. Challenges Facing Nigerian Local Content in Oil and Gas Industry. 2010. Available online: http://academia.edu/660216/CHALLENGES_FACING_NIGERIAN_LOCAL_CONTENT_IN_AND_GAS_INDUSTRY (accessed on 16 March 2021).
  6. Ibilol, A. Implementation of Local Content in Nigeria; Briefing Note on the Nigerian Natureal Resource Charter. 2013. Available online: http://nigerianrc.org/sites/default/files/Briefing%20Note%20on%20Local%20Content.pdf> (accessed on 14 March 2021).
  7. African Development Bank. Flagship Report Paper Series. Paper 6: Creating Local Content for Human Development in Africa’s New Natural Resource-Rich Countries. Available online: http://www.opml.co.uk/files/Publications/8517-harnessing-natural-resources/paper-1.pdf?noredirect=1 (accessed on 1 July 2019).
  8. Ovadia, J.S. Local content and natural resource governance: The cases of Angola and Nigeria. Extr. Ind. Soc. 2014, 1, 137–146. [Google Scholar] [CrossRef] [Green Version]
  9. Ovadia, J.S. Local content policies and petro-development in sub-Saharan Africa: A comparative analysis. Resour. Policy 2016, 49, 20–30. [Google Scholar] [CrossRef] [Green Version]
  10. Stevens, P.; Lahn, G.; Kooroshy, J. The resource curse revisited. Research paper. In Energy, Environment and Resources; Chatham House: London, UK, 2015. [Google Scholar]
  11. Amoako-Tuffour, J.; Augynn, T.; Atta-Quayson, A. Local Content and Value Addition in Ghana’s Mineral, Oil, and Gas Sectors: Is Ghana Getting It Right? African Centre for Economic Transformation: Washington, DC, USA, 2015. [Google Scholar]
  12. Tordo, S.; Warner, M.; Manzano, O.; Anouti, Y. Local Content Policies in the Oil and Gas Sector. 2013. Available online: https://elibrary.worldbank.org/doi/abs/10.1596/978-0-8213-9931-6 (accessed on 22 March 2021).
  13. Obiri, K.A.; Bjeirmi, B.; Boateng, P. A System Thinking Approach to Human Resource Development in the Oil Industry. J. Energy Res. Rev. 2020, 4, 39–49. [Google Scholar] [CrossRef]
  14. Obiri, K.A.; Bjeirmi, B. A Comparative analysis of local content policies in the North Sea and the Gulf of Guinea regions. J. Sci. Res. Rep. 2019, 25, 1–13. [Google Scholar] [CrossRef] [Green Version]
  15. Peek, P.; Gantès, P. Skills Shortages and Local Content in the Sub-Saharan African oil and Gas Industry; Centre de Recherches Enterprises et Societies: Geneva, Switzerland, 2008. [Google Scholar]
  16. MoE (Ministry of Energy). Available online: http://www.gnpcghana.com/_upload/general/Meet_the_press_sept_2012.pdf (accessed on 18 April 2020).
  17. Darkwah, A. Keeping hope alive: An analysis of training opportunities for Ghanaian youth in the emerging oil and gas industry. Int. Dev. Plan. Rev. 2013, 35, 119–134. [Google Scholar] [CrossRef]
  18. Yamoah, E.E. The link between human resource capacity building and job performance. Int. J. Hum. Resour. Stud. 2014, 4, 122–139. [Google Scholar] [CrossRef] [Green Version]
  19. Groot, R.; Molen, P. Workshop on Capacity Building in Land Administration for Developing Countries: Held at ITC Enschede, The Netherland, 12–15 November 2000; International Institute for Geo-Information Science and Earth Observation: Enschede, The Netherland, 2000. [Google Scholar]
  20. Aneke, P. The role of major operators in the development of local content in the Nigerian oil and gas industry. In A Paper Delivered during a National Seminar on the Dynamics of Equipment Leasing and Contract Financing for Local Contractors in the Oil and Gas Sector; Port Harcourt, Nigeria, 2002; Unpublished. [Google Scholar]
  21. Ariweriokuma, S. The Political Economy of Oil and Gas in Africa: The Case of Nigeria; Routledge: New York, NY, USA, 2009. [Google Scholar]
  22. Onuoha, N.I.; Onyihe, I.J.; Iledare, O. Economic Implications of Oil and Gas Supply Infrastructure Disruption in Nigeria. Available online: http://www.iaee.org/iaee2017/submissions/OnlineProceedings/ONUOHA%20NNACHI%20ONLINE%20PROCEEDINGS%20PAPER.pdf (accessed on 4 April 2020).
  23. Ramdoo, I. Local Content Policies in Mineral-Rich Countries. An Overview. Available online: https://ecdpm.org/wp-content/uploads/ECDPM-Discussion-Paper-193-Local-Content-Policies-Mineral-Rich-Countries-2016.pdf (accessed on 22 March 2021).
  24. Cosar, A.K. Human capital, technology adoption and development. BE J. Macroecon. 2011, 11, 130–141. [Google Scholar] [CrossRef] [Green Version]
  25. Youndt, M.A.; Subramaniam, M.; Snell, S.A. Intellectual Capital Profiles: An Examination of Investments and Returns. J. Manag. Stud. 2004, 41, 335–361. [Google Scholar] [CrossRef]
  26. Marimuthu, M.; Arokiasamy, L.; Ismail, M. Human Capital Development and Its Impact on Firm Performance: Evidence from Developmental Economics. J. Int. Soc. Res. 2009, 2, 265–272. [Google Scholar]
  27. Delaney, J.T.; Huselid, M.A. The Impact of Human Resource Management Practices on Perceptions of Organizational Performance. Acad. Manag. J. 1996, 39, 949–969. [Google Scholar]
  28. Sterman, J. Business Dynamics: Systems Thinking and Modelling for a Complex World. Available online: https://dspace.mit.edu/handle/1721.1/102741 (accessed on 22 March 2021).
  29. Alasad, R.; Motawa, I.; Ougunlana, S. A system dynamics-based model for demand forecasting in PPP infrastructure projects–A case of toll roads. Organ. Technol. Manag. Constr. Int. J. 2013, 5, 1–12. [Google Scholar] [CrossRef]
  30. Richmond, B. Systems dynamics/systems thinking: Let’s just get on with it. In Proceedings of the International Systems Dynamics Conference, Sterling, UK, 11–15 July 1994. [Google Scholar]
  31. Behl, D.V.; Ferreira, S. Systems thinking: An analysis of key factors and relationships. Procedia Comput. Sci. 2014, 36, 104–109. [Google Scholar] [CrossRef] [Green Version]
  32. Omotayo, T.; Olanipekun, A.; Obi, L.; Boateng, P. A systems thinking approach for incremental reduction of non-physical waste. Built Environ. Proj. Asset Manag. 2020, 10, 509–528. [Google Scholar] [CrossRef]
  33. Kim, D.H. Introduction to Systems Thinking; Pegasus Communications: Waltham, MA, USA, 1999; p. 16. [Google Scholar]
  34. Dettmer, H.W. Goldratt’s Theory of Constraints: A Systems Approach to Continuous Improvement; ASQ Quality Press: Milwaukee, WI, USA, 1999. [Google Scholar]
  35. Xu, Y.; Sun, C.; Skibniewski, M.J.; Chan, A.P.; Yeung, J.F.; Cheng, H. System Dynamics (SD)-based concession pricing model for PPP highway projects. Int. J. Proj. Manag. 2012, 30, 240–251. [Google Scholar] [CrossRef]
  36. Maryani, A.; Wignjosoebroto, S.; Partiwi, S.G. A System Dynamics Approach for Modeling Construction Accidents. Procedia Manuf. 2015, 4, 392–401. [Google Scholar] [CrossRef] [Green Version]
  37. Boateng, P.; Chen, Z.; Ogunlana, S. A dynamic framework for managing the complexities of risks in megaprojects. Int. J. Technol. Manag. Res. 2016, 1, 1–13. [Google Scholar] [CrossRef]
  38. Bank of Ghana. Available online: https://www.bog.gov.gh/monetary_policy_rpts/inflation-outlook-and-analysis-report-september-2020/ (accessed on 23 July 2020).
  39. Ackah Mohammed. Available online: https://www.wider.unu.edu/sites/default/files/Publications/Working-paper/PDF/wp2018-152.pdf (accessed on 23 July 2020).
  40. Ministry of Finance. Available online: https://www.mofep.gov.gh/press-release/2019-02-14/ghana%27s-oil-production-estimated-to-go-up-to-500%2C000-Barrels-per-day-by-2024#:~:text=%E2%80%9COverall%2C%20crude%20oil%20production%20is,and%20first%20quarter%20of%202021 (accessed on 23 July 2020).
  41. Kazzazi, A.; Nouri, B. A conceptual model for local content development in the petroleum industry. Manag. Sci. Lett. 2012, 2, 2165–2174. [Google Scholar] [CrossRef]
  42. Marcel, V.; Tissot, R.; Paul, A.; Omonbude, E. A Local Content Decision Tree for Emerging Producers; The Royal Institute of Internationa Affairs: London, UK, 2016. [Google Scholar]
  43. Ablo, A.D. Scale, local content and the challenges of Ghanaians employment in the oil and gas industry. Geoforum 2018, 96, 181–189. [Google Scholar] [CrossRef]
  44. Azevedo Filho, E.T.; Palma, M.A.M.; Perestrelo, M.; da Hora, H.R.M.; Lira, R.A. The pre-salt layer and challenges to competitiveness in Brazil: Critical reflections on the local content policy in the oil and gas Sector. Extr. Ind. Soc. 2019, 6, 1168–1173. [Google Scholar] [CrossRef]
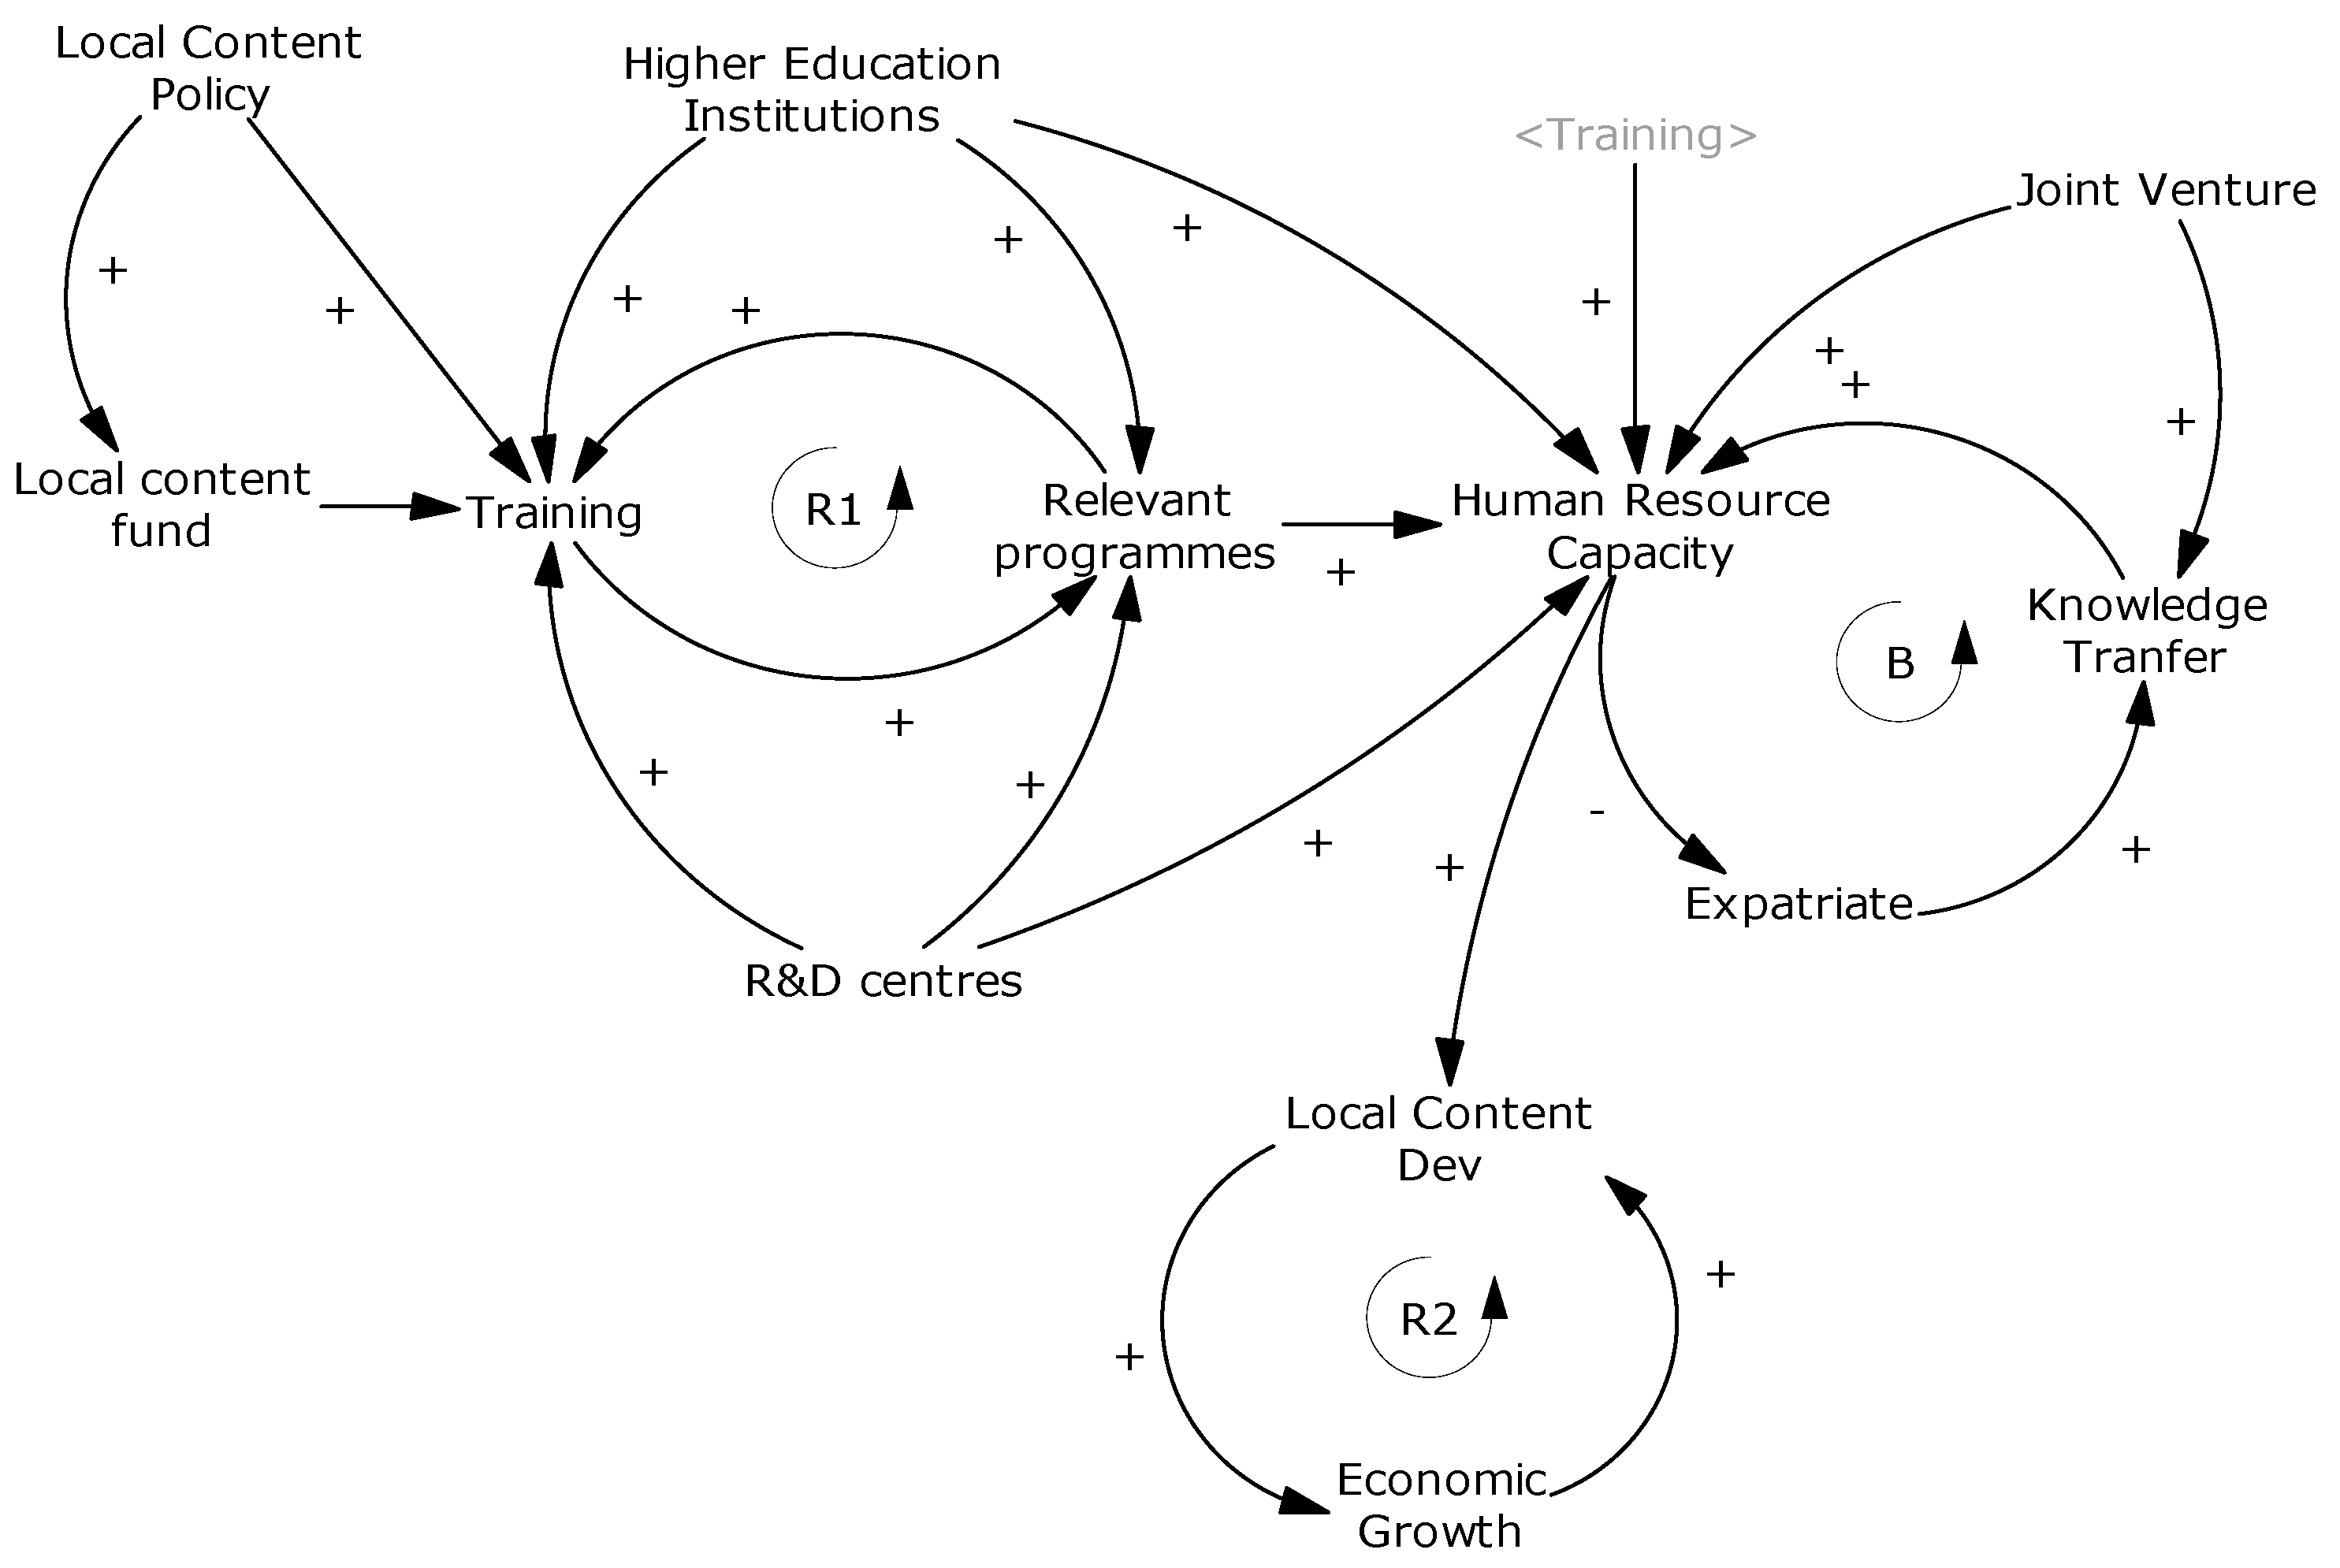
Figure 1. Causal Loop Diagram of Human Resource Capacity sub-model.
Sustainability 13 03546 g001
Figure 2. Validate causal loop diagram.
Sustainability 13 03546 g002
Figure 3. Systems dynamics for local content development for economic growth and oil and gas human resources in Ghana.
Sustainability 13 03546 g003
Figure 4. Revenue and local content investment (in the right axis).
Sustainability 13 03546 g004
Figure 5. Oil production and local content investment (in the right axis).
Sustainability 13 03546 g005
Figure 6. Oil and gas human resources and local content investment (in the right axis).
Sustainability 13 03546 g006
Figure 7. Knowledge transfer and local content investment (in the right axis).
Sustainability 13 03546 g007
Figure 8. Knowledge transfer and human resources (in the right axis).
Sustainability 13 03546 g008
Figure 9. Sensitivity confidence intervals for oil and human resources.
Sustainability 13 03546 g009
Figure 10. Sensitivity confidence intervals for knowledge transfer.
Sustainability 13 03546 g010
Figure 11. Sensitivity confidence intervals for local content investment.
Sustainability 13 03546 g011
Figure 12. Sensitivity confidence intervals for oil production.
Sustainability 13 03546 g012
Figure 13. Sensitivity confidence intervals for revenue (the values are multiplied by 1 million).
Sustainability 13 03546 g013
Table 1. System Boundary for Human Resource Development.
Challenge CodeChallenge Type
Human Resource Capacity (HRC)Type 1: Endogenous
Variables
HRC1Human resource capacity
HRC2Relevant programmes
HRC3Local content development
HRC4Expatriates
HRC5Knowledge transfer
HRC6Local content fund
HRC7Economic growth
HRC8Training
HRC9R&D Centres
Types 2: Exogenous
Variables
HRC10Joint Venture
HRC11Higher education institutions
HRC12Local content policy
HRC13Business development infrastructure
Publisher’s Note: MDPI stays neutral with regard to jurisdictional claims in published maps and institutional affiliations.