Abstract
El Quisco is a district and popular seaside resort on the coast of Chile that has suffered the effects of the growing demand for second homes and tourism activities. The district has the fourth highest influx of a floating population in the region, which has had numerous impacts on the district at several levels. The objective of this article is to examine the issue of carrying capacity in Chile and its public management at the local level. To this end, this research developed an exploratory and instrumental case study. Carrying capacity problems were first identified in the existing literature. This information was subsequently complemented with more local information by means of: analysis of territorial planning instruments (TPIs) relating to the district; participative workshops with municipal government stakeholders; and, lastly, confirmation of the problems identified through correlation analysis of available historical data. The main result of this research was the determination of carrying capacity issues in El Quisco. This broadly coincides with indications from the existing literature and TPIs, while factors identified by local stakeholders are territory-specific, giving rise to new measurement variables. It was possible, in turn, to rule out certain carrying capacity issues perceived by the community.
1. Introduction
The El Quisco district, located in the Valparaíso region in Chile, is a popular seaside resort close to a large metropolitan area (Santiago de Chile), which has suffered the positive and negative effects of the progressive demand for second homes and tourism activities.
In this context, demographic growth and its impact on the territory’s carrying capacity are some of the most relevant issues to have arisen. Between 1992 and 2017, the resident population increased by 160%, from 6097 to 15,955 inhabitants (INE, 2018). In 2017, the district had a floating population of 2,851,181 (INE & SERNATUR, 2018), the fourth highest in the region and the thirteenth highest nationwide.
This population increase has had several impacts on the district, particularly at its main tourist attraction, the town’s extremely overcrowded “Los Corsarios” beach, which, in turn, overwhelms the adjacent services and infrastructure. Moreover, the capacity of basic services does not fully cover the demand of the resident population, with an 87% coverage in electricity supply, 89.4% in sewerage services and 97.5% in drinking water provision, a situation that worsens in summer with the influx of tourists [1].
Another strong impact for the local population over the summer period is the collapse of the road and public transport networks and car parking availability, since El Quisco’s main road is the main access and exit route for the area. In turn, the household solid waste collection capacity is greatly exceeded, leading to the existence of several small-scale rubbish dumps in a number of the district’s gullied watercourses, specifically in the low-income sectors [1].
Regarding the social impact, the floating population generates numerous conflicts in the seaside resort, especially due to the influx of groups of young people, with problems related to alcohol and drug consumption and crimes such as “sexual offences (which increased by 200%) gun law violations (41% increase), assault (37% increase), burglary with forced entry (35% increase) and aggravated burglary (20% increase)” [1].
This series of impacts has made it necessary to study the carrying capacity, defined as the number of people an area can support without degrading the natural, cultural and social environment in order to maintain long-term quality of life [2]. In this particular study of El Quisco, the decision was made not only to characterize the issue but also to explore how the municipality approaches this problem in order to measure the difficulties and challenges presented by municipal management in the district.
In Chile, the local government or municipality, made up of the mayor and their council, is responsible for the administration of the local area, working together with the regional government when it comes to inter-district issues. By law, the municipality is responsible for “satisfying the needs of the local community and ensuring their participation in the economic, social and cultural progress of the respective districts” (Act 18,695 Art. 1). It becomes relevant, therefore, to recognize the problem of carrying capacity and the municipality’s awareness of this issue.
2. El Quisco
El Quisco district is located in the Valparaíso region in Chile and belongs to the San Antonio province (see Figure 1), along with the coastal districts of Algarrobo, El Tabo, Cartagena, San Antonio and Santo Domingo, which together make up the southern coastal zone of the country’s central zone. El Quisco is bordered by the Algarrobo district to the north, the El Tabo district to the south, the Casablanca district to the east and the Pacific Ocean to the west.
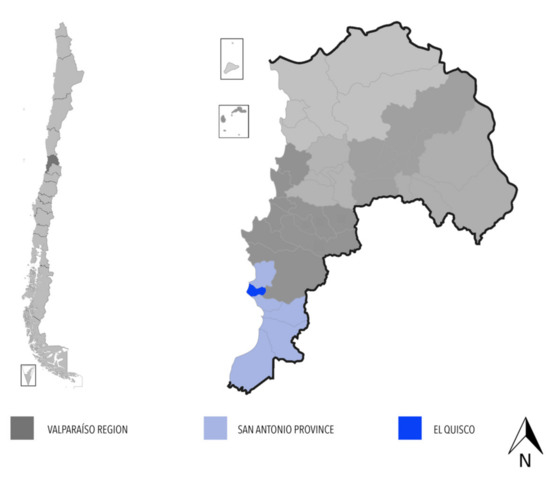
Figure 1.
Regional context of the El Quisco district, Chile. Source: authors’ own.
The intermediate location of this district within the province sets it up to be the geographical center. This situation is compounded by the fact that El Quisco possesses the broadest range of services in the province, thus functioning as the main local urban center. At the same time, its proximity to the national capital of Santiago, located 114 km to the east (see Figure 2), makes the district a particularly attractive holiday or weekend destination given its easy accessibility by a number of major, coastal and secondary roads.
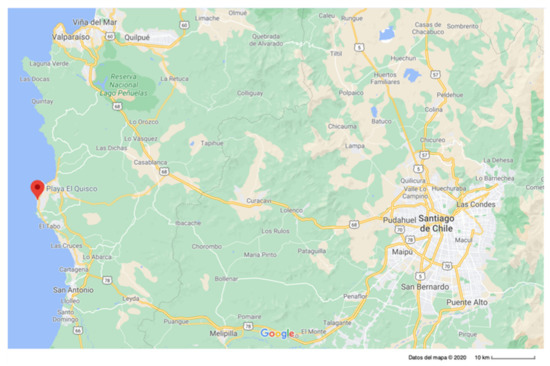
Figure 2.
Location of the El Quisco district in relation to Santiago de Chile. Source: Google Maps, 2020.
As mentioned, the district currently has 15,955 inhabitants (INE, 2018) with considerable intercensal growth very significantly weighted towards the over 55 age group, reaching up to a 700% increase in the over 80s. This corresponds to the migration of older adults seeking a better quality of life in this coastal district.
There has also been a considerable increase in the number of homes in the territory. The 8217 homes registered in the 1992 census had increased to 18,313 homes in the 2017 census. It should be noted that a large portion of these are second homes and tourist rental accommodation located in the district’s urban sector.
3. Theoretical Framework
The concept of carrying capacity (CC) was originally coined in 1798 by Thomas R. Malthus, who warned that the planet could only host a certain amount of human population due to limited availability of resources for subsistence. The concept was later linked to animal ecology using Verhulst’s logistic growth model in 1838. By the 1890s, the term CC was used officially by range managers specifically relating to land use for cattle grazing. In ecological theory, the term refers to the population size that is sustainable in relation to its support ecosystem [3,4].
In this way, the concept of CC shifted towards human ecology. In the 1960s and 1970s, it was widely used to study the maximum population size based on the maximum use of resources or the capacity for environmental assimilation in order to understand the interactions between human activity and the environment [4,5].
Today, the concept of CC is understood as the number of people an area can support without degrading the natural, cultural and social environment in order to maintain long-term quality of life [2]. CC effectively implies setting a maximum limit above which nature will react by resisting the accelerated growth and development of the population through droughts, landslides, floods, famines and other phenomena [2,5].
Some authors maintain that there is an inherent relationship between sustainability and CC [3,4,5,6,7,8,9,10,11,12,13], since a territory’s sustainability translates into the availability of resources for permanent use. In this sense, sustainability can be measured by means of CC, since, if the maximum limit of resources is known, efficient land use policies can be developed to guarantee resource availability in the future [5].
Studies on CC have been carried out to date based on different theories, with different research approaches applied, such as tourism carrying capacity (TCC) [6,7,8,11,12,14,15,16,17,18,19,20], ecological carrying capacity [4,21,22,23], human carrying capacity [9], regional carrying capacity [24] and urban carrying capacity [3,5,13], where integration of these analytical dimensions becomes essential when establishing a CC assessment framework for those administrating urban areas.
The most prominent definition of TCC comes from the World Tourism Organization (UNWTO): “the maximum number of people that may visit a tourist destination at the same time, without causing destruction of the physical, economic and sociocultural environment and an unacceptable decrease in the quality of visitors’ satisfaction” [6,12,14]. Ecological CC refers to the proposed limits to natural resources, environmental assimilative capacity, ecosystem services capacity and society supporting capacity that allow socio-economic activities to be carried out without causing change or impairment to the habitat’s functions or structures [23].
Human CC is based on the resilience of the environmental system to ensure its ability to absorb the impacts of human disturbances without a shift in state or function [9]. Regional CC is defined as the systematic capacity of a society to sustain a certain level of population and socioeconomic production while maintaining a reasonable rate of exploitation of resources [24].
Lastly, urban CC refers to the maximum level of urban development able to optimally satisfy the demands of the population of an urban area, considering both the natural system and its artificial components. Several factors affect this capacity, such as impacts on the natural environment, availability of natural resources, infrastructure and services, public perception, institutional context and support from society [3]. Notably, with this approach, the CC becomes relevant in the fields of urban planning and management, since consideration of urban CC contributes to a high degree of residents’ satisfaction in their connection with the city at physical, cultural and spiritual levels, thanks to its functional urban services, environmental quality, optimal transport system and pleasant civic environment [3].
One fundamental characteristic of a territory’s CC is that it is not fixed, with numerous factors influencing its increase or decrease, such as the preferences of the population, technology use, investment, productivity and consumption patterns. This capacity must therefore be understood dynamically [3,5,11].
In this study, the research approach that is applied is the TCC, considering the different factors that entail the complexity of phenomena associated with demographic growth as well as the floating population and the migration of new residents to a consolidated district as a tourist destination.
4. Methodology
A case study was chosen as the approach to develop this research, since this is a flexible research strategy that can be adapted to different theoretical perspectives [25]. It also allows the use of quantitative, qualitative or mixed research processes [26] and provides an opportunity to use different types of data [27]. This case study is exploratory [28] and instrumental [29] since it seeks to answer tourism carrying capacity questions in an under-studied field, namely, identification of this problem in Chile and its local-scale public management, while in the future, this approach could be extrapolated to other situations, from similar districts with characteristics of a tourist destination in the country, or other districts worldwide (see Figure 3).
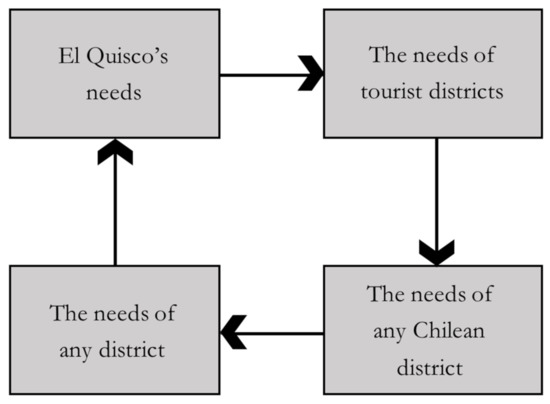
Figure 3.
El Quisco case study. Source: authors’ own.
The study was organized according to the following scheme (based on Taylor’s 2016 proposal for case studies), which defined the objectives, research questions, theoretical perspective, methodology, data collection methods, data analysis, report type and perspective of the conclusions in relation to the initial objective (see Figure 4).
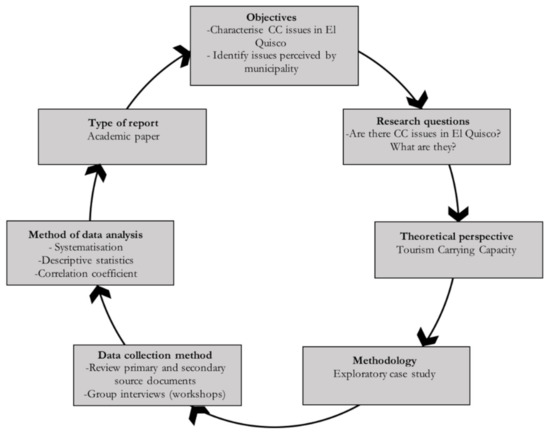
Figure 4.
Methodological scheme for case studies. Source: adapted from Taylor (2016).
4.1. Step 1: Theoretical Perspective
Identification of Dimensions for Analysis and Their Variables According to Authors in the Academic Literature.
A comprehensive review of the available academic literature on the concept of CC was first carried out. Studies were collated focusing on different types of carrying capacity, such as ecological, urban, tourism and regional CC. These studies involved different sizes of territory including megacities, cities, districts and tourism sectors, in diverse geographical locations, including islands, archipelagos, tourist beaches, bays and inland areas.
The main focus in this bibliographic review was on studies that evidenced the problems associated with the impacts of CC together with a proposal for measuring variables to calculate carrying capacity in each of the territories, in order to analyze the permanent impacts and those related to the tourist season. The main dimensions for analysis of the variables were also identified, allowing optimal classification of information. These dimensions are: environment, territorial aspects, infrastructure, economy, demographics, social aspects, culture and public management.
4.2. Step 2: Data Collection
4.2.1. Identification of Issues in Territorial Planning Instruments (TPIs) Relevant to El Quisco
A review was carried out at this stage of all the current regulatory and strategic TPIs relevant to the El Quisco area (see Table 1) in order to identify the issues related to CC that could be classified within the dimensions listed above. Once the issues were identified, they were systematized to reveal which difficulties faced by El Quisco coincided with those identified in the literature. In turn, when new problems emerged, these were added to the systematization as variables.

Table 1.
Relevant territorial planning instruments (TPIs) for the El Quisco district.
4.2.2. Identification of Issues According to Local Stakeholders Linked to the El Quisco Municipal Government
Two face-to-face participatory workshops were organized with representatives of several of El Quisco’s municipal institutions, such as the District Planning Office (SECPLA), Municipal Works Office (DOM), Community Development Office (DIDECO), Environment Office, Cleaning and Landscaping Department, Public Safety Office, Transport Office, Information Technology Division, Department of Health, Department of Education and Administrative and Financial Management Office. The activities took place on Tuesday 30 July 2019 and 3 December 2019. The objective of the first workshop was to identify the district’s issues in relation to TCC, while the second workshop sought to place these in order of priority and carried out an exercise to classify them according to time span, i.e., to establish if they are difficulties that occur in the tourist season or are permanent.
Once this information was collected, the data were added to the systematization developed in the previous step to indicate where issues coincided with the literature and the TPIs in question. When new issues emerged, these were integrated into the systematization in the form of variables.
4.2.3. Identification of Data Available for the Study of Variables in El Quisco
This involved searching for available data based on the relevant variables. It focused on the sort of data that could be processed and expressed in a dynamic model, which guided the search. Once the information was sorted, it was possible to observe which data met the modeling requirements and then include these data in the systematization, identifying the variables that could effectively be subject to analysis.
At this stage, it became possible to visualize the potential variables to be considered in the dynamic model and coincidence could be identified between the issues present in the literature, the TPIs, the perception of local stakeholders and the data available for the study in the El Quisco district.
4.3. Step 3: Data Analysis
4.3.1. Systematization of Available Knowledge
After collating the selected literature, the data and issues identified for each academic paper were arranged into tables using Excel spreadsheet software. These data were subsequently classified according to the following dimensions identified in the articles: environment, territorial aspects, infrastructure, economy, demographics, social aspects, culture and public management.
4.3.2. Descriptive Statistics
Once all the information had been arranged in tables, a detailed analysis was carried out to show correlations between the arguments of the different authors. After identifying which issues correlated to a greater or lesser extent, frequency analysis was used to classify these according to the number of correlating authors, establishing the frequency levels: very high; high; very low; and low. The objective was to prioritize the issues identified by the authors in order to understand which would most commonly arise in territories where the carrying capacity is exceeded, as is the case in the district studied here.
This classification of the different issues was later was translated into the corresponding variables, which were arranged according to the dimensions identified from the articles studied.
4.3.3. Correlation Coefficient
After having identified all the available data within the systematization, each piece of data was explored more deeply in order to discard any that lacked a historical sequence that could be studied. A range of data was selected corresponding to the years 2002–2020, which was then analyzed to determine behavior over time, where the resident population variable was the basis for visualizing any possible relationship with the data associated with the impact of CC in El Quisco.
Once the data were filtered, they were arranged into a spreadsheet according to year. The linear correlation coefficient was then calculated between the residents per year variable and each of the CC-associated variables to establish whether there was a direct or inverse relationship between the variables and to classify the strength of any such relationship between the variables:
where corresponds to the covariance between and and indicate the standard deviation for and and are the values at the ith observation and and are the means for and . In all cases, population was the common variable used. For instance, we analyzed the correlation of urban area and household production with respect to local population growth.
5. Results
The systematization of data from the literature is described below. This then served to capture the different levels of data enrichment arising from the territory-specific case study in order to discern the issues associated with CC in the El Quisco district and determine the level of congruence of the numerous sources of information.
5.1. Identification of Carrying Capacity Issues
In the review of the academic literature, which mainly covered studies with a proposal for measuring variables for calculating CC, a total of 318 variables were identified, associated with different dimensions of the impacts of CC. Frequency analysis subsequently made it possible to determine the main dimensions mentioned by the authors (environment, territorial aspects, infrastructure, economy, demographics, social aspects, culture and public management) and their respective measurement variables for the issues. Of the 318 variables identified, 77 were selected as relating to the main issues most frequently identified by the authors (see Table 2).
Table 2.
Summary of systematization of carrying capacity (CC) dimensions and variables in the literature.
When classifying the issues and variables, the majority of these across the board related to impacts from exceeding CC limits on the environment and natural resources in the places of study. These include habitat degradation and various types of environmental pollution in particular, while the acknowledged shortage of natural resources is exacerbated by the high demand of the population [3,5,6,7,8,11,12,13,14,15,18,19,20,21,22,23,24].
The authors largely concur regarding the economic impacts on the population, listing the increase in land value, loss of productive capacity in goods and services unrelated to tourism, promotion of unskilled labor, informal employment, unemployment and seasonal dependence on tourism for job creation [3,4,5,6,7,8,11,12,13,14,15,17,18,19,20,21,22,23,24].
There is also evidence of overburdened infrastructure and services, such as sewerage, drinking water supply, gas and electricity supply, transportation and road congestion. Health, security, telecommunications and waste collection services, banks and shops are particularly affected [3,5,6,7,8,11,12,13,14,15,16,17,19,22,23,24]. On account of the above, the resident population enjoy a lower quality of life and local cultural identity is also affected [3,5,6,8,11,12,13,14,15,17,19,22,24].
This over-demand at specific locations has larger-scale impact. The authors identified an increase in urban surface area: since the central parts of the cities are overcrowded, the population begins to move to peripheral sectors while, in turn, urban values per m2 increase in relation to rural values per m2. There is, in this sense, a periodic increase in population growth rates, either due to interest in a location’s quality of environment or the high level of services linked to job opportunities [6,8,9,11,12,14,15,16,17,20,21,23].
In terms of social impact, part of the population that has been displaced is observed to become vulnerable, with situations of poverty, crime and low levels of education [3,8,9,12,13,14,15,16,17,20,22,24]. Lastly, some authors highlight the relevance of the political dimension in optimizing CC in cities, since there are aspects of that dimension that are flexible and could be changed with public spending. The organizational and management capacities of local government therefore have a direct influence upon improvements in CC [3,5,11,13,14,15,17,19,20,22].
It is important to note that after the systematization work, most of the variables detected are related to the approach of the TCC, which are linked to the impacts of the tourist season and the permanent ones.
5.2. Identification of Tourism Carrying Capacity Issues in El Quisco
5.2.1. Identification of Issues in TPIs Linked to El Quisco
The issues present in the specific circumstances of the El Quisco area according to the TPIs largely coincided with those mentioned in the literature: of the 77 variables recognized in the literature, 46 were identified in the El Quisco district. In terms of environmental impact, the following stand out: urban growth threatening native woodland; deterioration of all tourist beaches; and pollution of numerous gullied watercourses in the district.
In addition to the above, El Quisco suffers various impacts through its status as a seaside resort due to the seasonal nature of tourism. As part of the economic dimension, TPIs emphasize the seasonality of tourism and its high percentage of informal employment. Infrastructure provision is the dimension most coinciding with the literature, with a total of 11 variables present in the district, particularly road saturation, shortage of parking spaces and insufficient street paving, sewerage and urban infrastructure in the district. In addition, insufficient provision of banking services and overburdening of health services are evident, the latter mainly due to population growth in recent decades, as evidenced by the increase in waste generation in the district and consequent challenges for waste collection services. Another impact exposed in the TPIs in relation to seasonality is the rise in antisocial behavior and crime and the increased pressures on the security services. All these impacts diminish the quality of life of the resident population and the tourist experience in the district.
In the demographic dimension, emphasis is placed on the aging population with the influx of elderly persons turning second homes into permanent homes.
It should be noted that new variables for study, not considered in the existing literature, emerge out of the issues associated with TCC identified in the TPIs in El Quisco. Among these, housing demand and unregulated land subdivision stand out particularly as a permanent problem, with no local government policy to tackle these issues. There are seven other new variables related to permanent problems not identified in the literature, which include: availability of water resources in the area within the environmental dimension, street paving within the infrastructure dimension, influx of elderly residents within the demographic dimension and number of community centers and cultural organizations within the cultural dimension. In turn, a new variable arises associated with problems of the tourist season identified as informal businesses within the economic dimension (see Figure 5).
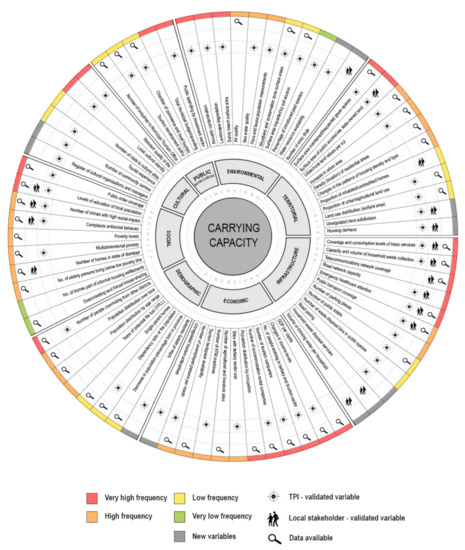
Figure 5.
Summary of systematization of issues associated with TCC identified in El Quisco. Source: authors’ own.
5.2.2. Identification of Issues by Local Stakeholders Connected to El Quisco Municipal Government
This interaction with local stakeholders from the municipality served to gather their perceptions of the issues that affect them. A smaller number of issues were observed than those detected in the literature or identified in the TPIs: out of a total of 77 variables, the local stakeholders identified 17 in El Quisco. The stakeholders’ variables largely coincide with the TPIs, although with 13 variables common to both, particularly regarding infrastructure saturation (with eight stakeholder variables) and, in the social dimension, crime and education (with five stakeholder variables).
Six new variables not in the literature are named by the local stakeholders, relating to a more specific perception of the issues, such as: the impact of the number of stray dogs in the district within the environmental dimension; volume of drinking water per dwelling, internet speed, final disposal of household waste and ongoing health coverage within the infrastructure dimension; and the number of school enrolments within the social dimension, with only two of these new variables coinciding with new variables in the TPIs (see Figure 5). Importantly, stakeholders were able to clarify which issues they meet permanently or seasonally during the year and put these in order of priority.
In prioritizing the issues, stakeholders emphasized the importance of housing demand and illegal land grabs and subdivisions in the area in the territorial dimension, alongside low levels of school enrolment and an increase in crime in the social dimension and the harmful effects of the change in the final disposal of household waste. Second in the order of priority were issues in the infrastructure dimension, such as: healthcare provision, internet access, public transport, increase in stray dog numbers, sewerage and household waste collection. Third and lowest in the order of priority were demands for public recreational space, traffic congestion, poor state of sidewalks, abandoned and deteriorated houses and the lack of provision of complementary services to tourism.
In a similar way to the previous sections, the variables that emerge are also mainly related to aspects of TCC and all are related to its permanent problems.
5.3. Characterization of Tourism Carrying Capacity Issues in El Quisco
5.3.1. Identification of Available Data to Study Variables in El Quisco
When visualizing the availability of data for the El Quisco district case study, it can be seen that most of the data available for study belong to the infrastructure, economic and social dimensions. This is especially true for the most commonly identified issues in the literature where it was observed that out of a total of 77 variables, 50 have available data (see Figure 5). Subsequently, when analyzing the feasibility of the data, only those with historical records were considered in order to study their behavior over time, taking into account the development of projections. This resulted in a total of 25 variables available for measurement.
In the environmental dimension, the only available data relate to air quality (which is not an issue in the territory) and soil type, while in the cultural dimension, there are no data whatsoever since these variables are mostly qualitative in nature.
Notably, no data were found to study the 13 new variables identified in the TPIs or by local stakeholders.
A systematization diagram of the TCC issues is presented below, identifying the dimensions present in the literature and classifying these into four categories of measurement variable according to their frequency of occurrence between authors. As well as giving an overview of the available data, Figure 5 connects them with the territorial information obtained about El Quisco, both from the TPIs and the local municipal stakeholders.
5.3.2. Evidence of CC in El Quisco
Firstly, in the analysis of the data available with historical records between the years 2002 and 2020 (see Table 3), variables such as population education levels, multidimensional poverty levels and the dependency ratio, even if a direct positive correlation is observed, do not have the minimum amount of data to prove the correlation.
Table 3.
Descriptive statistics and sources.
Secondly, a correlation coefficient greater than 0.5 could be observed in most of the variables with available data, with a particularly strong direct association between resident population growth and urban surface area in the El Quisco district. There is also an increasing number of companies belonging to the tourism industry in the district, which has a strong association with the growth of the resident population. This same behavior has also been observed for the variables for: sewerage, tourism-related employment, antisocial behavior, tourism rental businesses and tons of household waste per year.
Variables such as construction industry workers and drinking water coverage present a between 0.6 and 0.7 association with population growth, indicating that a considerable percentage of the population has no access to a formally regulated drinking water supply since coverage does not significantly increase with population growth.
Lastly, the variables that present a less than 0.5 association with resident population growth are emergency healthcare attention and crimes with high social impact in the district. The data do not show a strong relationship between the permanent saturation of emergency health services perceived by local stakeholders since the number of cases of emergency medical attention does not show a correlation with resident population growth. A similar situation is evident for crimes with high social impact: local stakeholders and El Quisco TPIs highlight the increase in crime and pressure on the security services in the tourist season in a cumulative way, but the variables’ behavior gives no evidence of any relationship to the population growth (see Table 4). There is, therefore, no CC issue in these two areas.
Table 4.
Behavior of variables and linear correlation coefficient with growth in resident population.
6. Discussion
In this study, the issues identified in the existing literature were systematized, which managed to show the degree of consensus between authors and their fundamental ideas despite their different CC research approaches. In turn, it enabled the most and least frequent issues identified by the authors to be categorized, in this way establishing the type of problems most likely to be identified in a variety of tourist districts.
The data were subsequently supplemented and enriched with the territory-specific El Quisco case study. Firstly, the different regulatory and strategic TPIs in force were analyzed, which widely validated the issues coinciding with the literature. This confirms the potential application of this methodology to other districts with overstretched TCC [3,4,5,6,7,8,9,10,11,12,13,14,15,16,17,18,19,20,21,22,23,24]. In turn, it is necessary to highlight the emergence of new variables that were not considered in the literature, which gave an understanding of the specific territorial circumstances and unique operating dynamics.
Secondly, the development of participatory workshops with municipal government stakeholders made it possible to identify the issues that were difficult for them to manage. In this area, in contrast to the information detected in the TPIs, validation was more limited since it arose from participants’ perceptions of their day-to-day feelings over the course of their work, especially in the tourist season where the pressures were strongly felt by the municipal government team and excess demand for their services became evident. As with the TPI validation process, new variables arose that were not in the literature, including one of the demands felt most strongly by the population.
Lastly, analysis of the data allowed identifying that a large part of the variables present a strong association with the resident population growth. However, in the case of two variables perceived by local stakeholders and TPIs to be recurrent and permanent issues (emergency healthcare cases and crime with a high social impact), analysis contradicted this perception since the variables did not show any correlation with the annual resident population growth, thus offering no verification that these problems are related to CC issues. Lastly, the correlation could not be tested in variables that did not have the minimum amount of historical data required.
Due to the territorial enrichment carried out here, it is necessary to show the limitations of the definition of the TCC proposed by PAP [14], Segrado et al. [12] and Navarro et al. [6] since it refers to an isolated and specific temporality and, as seen in this study, in addition to the impacts of the tourist season, there are cumulative effects that can be considered in long time series, providing the possibility of progressive deterioration in the district due to its status as a tourist destination.
It should be noted that with the type of data currently available, it is not possible to include the cultural dimension since, for this case study, no studies have been carried out to measure variables such as quality of life, tourist experience and cultural identity. Some authors criticize this situation in their respective studies [6,11,14,15,17,19]. The environmental dimension, which, according to most of the authors, is one of the most recurrent issues in studies [3,4,5,6,7,8,9,10,11,12,13,14,15,18,19,20,21,22,23,24], in this specific case, also lacks measurement data, putting it at a disadvantage both in the analysis process and for data-backed decision making.
7. Conclusions
7.1. Summary of the Results
This study served to assess the existence of TCC issues in the El Quisco district. The systematization of information in the literature managed to answer what effects are recognized as CC problems; specific territory-based data enrichment provided an answer to what effects are recognized as TCC problems in Quisco and identified and classified issues according to their corresponding dimensions and if they were problems of the tourist season or the permanent local government according to municipal stakeholders, providing more specific validation to the findings documented in the various TPIs.
It was subsequently possible to respond to how the effects that are recognized as TCC problems in El Quisco are dimensioned, and their relationship with the resident population growth through correlation analysis in 9 out of 13 variables was studied, the three with the highest values being: employment in tourism, urban area growth and sewerage provision.
Furthermore, it should be noted that two of the issues strongly perceived by local stakeholders do not show any correlation with population growth, including emergency healthcare attention and crimes with high social impact; therefore, CC issues are not confirmed in these fields. Finally, in the three variables, the data found were too scarce to prove correlations.
7.2. Theoretical Implications
It is necessary to point out that the information in the literature broadly coincides with the findings of this specific case study, which accounts for a Latin American reality that is not alien to the CC problems that other territories suffer, so the existence of problems generalized can be extrapolated to other districts or regions. At the same time, the more specific problems in the case study for this district do not coincide with the authors’ findings in the literature. This is due to the influence of various factors relating to the national and local contexts, as well as emerging issues that were not previously considered. This situation highlights the need to study these new issues arising as a result of the TCC in different territories. Since CC is a phenomenon that includes numerous dimensions and factors, any comprehensive study would be more effective if all the difficulties and their potential means of measurement were more robustly covered in order to achieve ongoing improvements to CC within the territory.
It should be noted that despite the fact that issues related to the environment dimension are those most frequently identified in the literature, this case study makes evident how little relevance these are given in the local context due to the almost complete absence of data for measurement. This makes it difficult to study TCC comprehensively. A similar situation also occurs in the cultural dimension. Here, the literature concurs with the case study that, as qualitative variables, their measurement becomes more complex and can only be considered over time. When variables such as quality of life and tourist experience are not taken into consideration, it becomes more difficult for local governments to progress in this dimension or for these aspects to be fully valued by the local population.
It is also essential to consider the limitations of tourism CC’s definition since it only refers to the “maximum number of people that may visit a tourist destination at the same time”. This definition puts the focus on a situation of limited temporality in the territories, not considering the cumulative or synergistic aspects of the effects that can be considered when analyzing long time series and that can mean their definitive deterioration, a fact that this study shows when observing the entire population on an annual basis.
7.3. Limitations and Future Research Perspectives
As indicated in the Methodology section, this is exploratory work and as such allows one to enter the subject, detecting limitations and leaving the doors open to new research.
In the first place, one of the findings is the diversity of existing CC approaches, which led to the determination of 318 different variables, which added to those raised in the case study, which are 13, giving a total of 331 aspects that could be linked. This magnitude of issues makes their study very complex, unless there are significant resources, and reveals the need to standardize or synthesize variables and work to identify those that are key to TCC.
After the variables were selected for study, the availability of data for the measurement of the variables raised by the literature revealed the main limitation of this study and that there are a large number of variables that do not have sufficient data for their analysis.
It is recommended as future research to delve into the variables that were not possible to measure in this study, in order to understand how they affect TCC; in turn, it is proposed to delve into the variables measured by means of more complex models, with the aim of detecting, with greater precision, their effects and how they can be used for territorial planning. In addition, it is encouraged to replicate this study in other tourist districts that suffer the impacts of population growth, either due to the floating population or migration processes, in order to provide more information to decision-makers and thus guide towards management and sustainable planning of the different localities.
Finally, this case study revealed the bases and variables to consider for the development of software focused on the prediction of CC for local management, called “Predictor Model of Carrying Capacity for sustainable management”, allowing municipalities to predict the impact of population increase on the environment, basic services and the economy in the long term (migration processes). The main goal of this software is to provide the municipalities a tool to plan the policies that are developed in the territory in an integrated way.
Author Contributions
Conceptualization, R.M. and K.B.; data curation, A.A.; formal analysis, D.Z., J.I.M., A.A. and P.Á.; funding acquisition, R.M., K.B. and D.Z.; investigation, K.B. and A.A.; methodology, K.B.; project administration, D.Z.; resources, D.Z.; software, H.G., R.C., J.I.M. and P.Á.; supervision, K.B.; validation, A.A.; visualization, J.I.M. and A.A.; writing—original draft, A.A.; writing—review and editing, K.B. All authors have read and agreed to the published version of the manuscript.
Funding
This research was funded by FONDEF IT18I0028: project “Carrying-capacity Model for Sustainable Management” of the National Research and Development Agency of Chile (ANID).
Institutional Review Board Statement
The study was conducted according to the guidelines of the Ethical Approval Act, and approved by the Scientific Ethics Committee of Social Sciences, Arts and Humanities of the Pontifical Catholic University of Chile. Protocol ID 181010006 with approval date 10 April 2019.
Informed Consent Statement
Informed consent was obtained from all subjects involved in the study.
Data Availability Statement
All data were collected by the authors during their own field research. Some data was possible to obtain through the Transparency Portal of the State of Chile: https://www.portaltransparencia.cl/PortalPdT/ (accessed on 21 June 2020); General data: https://datos.gob.cl/ (accessed on 21 June 2020); Waste data: http://www.subdere.gov.cl/ (accessed on 21 June 2020); Social data: http://observatorio.ministeriodesarrollosocial.gob.cl/encuesta-casen (accessed on 21 June 2020); Statistical data: https://ine.cl/; Urban data: https://www.minvu.gob.cl/ (accessed on 21 June 2020); Health data: https://deis.minsal.cl/ (accessed on 21 June 2020); Health services data: https://www.siss.gob.cl/586/w3-propertyname-729.html (accessed on 21 June 2020); Criminal data: http://cead.spd.gov.cl/estadisticas-delictuales/ (accessed on 21 June 2020); Tax data: https://homer.sii.cl/ (accessed on 21 June 2020).
Conflicts of Interest
The authors declare no conflict of interest.
References
- Portal, B.F.; Espinoza, J.C.; Zúñiga, M.C. Impacto de la demanda de un turismo social en la sustentabilidad de la actividad en el balneario de El Quisco, Provincia de San Antonio—Chile. Investig. Geogr. 2015, 2014, 102. [Google Scholar] [CrossRef]
- Abernethy, V. Carrying capacity: The tradition and policy implications of limits. Ethic Sci. Environ. Politics 2001, 1, 9–18. [Google Scholar] [CrossRef]
- Wei, Y.; Huang, C.; Lam, P.T.; Yuan, Z. Sustainable urban development: A review on urban carrying capacity assessment. Habitat Int. 2015, 46, 64–71. [Google Scholar] [CrossRef]
- Shi, H.; Shen, C.; Zheng, W.; Li, F.; Wang, X.; Chi, Y.; Guo, Z.; Qiao, M.; Gao, L.; Ding, D. A model to assess fundamental and realized carrying capacities of island ecosystem: A case study in the southern Miaodao Archipelago of China. Acta Oceanol. Sin. 2016, 35, 56–67. [Google Scholar] [CrossRef]
- Centre of Excellence INTEGRATED LANDUSE PLANNING AND WATER RESOURCES MANAGEMENT (ILPWRM). Urban Carrying Capacity…Concept & Calculation; Department of Civil Engineering, Indian Institute of Technology: Guwahati, India, 2012. [Google Scholar]
- Navarro, E.; Mihaela, I.; Fernández-Morales, D. Carrying Capacity Model Applied in Coastal Destinations. Ann. Tour. Res. 2013, 43, 1–19. [Google Scholar] [CrossRef]
- Botero, C.; Hurtado, Y.; Porto, J.G.; Ojeda, M.; Díaz Rocca, L. Metodología de Cálculo de la Capacidad de Carga Turística Como Herramienta para la Gestión Ambientaly su Aplicación en cinco Playas del Caribe Norte Colombiano; Gestión y Ambiente: Medellin, Colombia, 2008; Volume 11. [Google Scholar]
- Echamendi, P. La capacidad de carga turística. Aspectos conceptuales y normas de aplicación. Anal. Geogr. Univ. Complut. 2001, 21, 11–30. [Google Scholar]
- Graymore, M.; Sipe, N.G.; Rickson, R.E. Sustaining Human Carrying Capacity: A tool for regional sustainability assessment. Ecol. Econ. 2010, 69, 459–468. [Google Scholar] [CrossRef]
- Marsiglio, S. On the carrying capacity and the optimal number of visitors in tourism destinations. Tour. Econ. 2017, 23, 632–646. [Google Scholar] [CrossRef]
- Navarro, E.; Tejada, M.T.; García, F.A.; González, J.C.; Macías, R.C.; Peña, J.D.; Gutiérrez, F.F.; Fernández, G.G.; Gallego, M.L.; García, G.M.; et al. Carrying capacity assessment for tourist destinations. Methodology for the creation of synthetic indicators applied in a coastal area. Tour. Manag. 2012, 33, 1337–1346. [Google Scholar] [CrossRef]
- Segrado, R.; Palafox, A.; Arroyo, L. Medición de la capacidad de carga turística de Cozumel. Periplo Sustentable 2007, 13, 33–61. [Google Scholar] [CrossRef]
- Wei, Y.; Huang, C.; Li, J.; Xie, L. An evaluation model for urban carrying capacity: A case study of China’s mega-cities. Habitat Int. 2016, 53, 87–96. [Google Scholar] [CrossRef]
- PAP/RAC. Guidelines for Carrying Capacity Assessment for Tourism in Mediterranean Coastal Areas; PAP-9/1997/G.1; Priority Actions Programme Regional Activity Centre: Split, Croatia, 1997; p. viii+51. [Google Scholar]
- Hernández, M. Turismo y medio ambiente en ciudades históricas. De la capacidad de acogida turística a la gestión de los flujos de visitantes. Anal. Geogr. Univers. Complut. 2000, 20, 131–148. [Google Scholar]
- Gant, A.C. Apartamentos Turísticos, Hoteles y Desplazamiento de Población. Informe para el Debate Sobre el Nuevo Plan Especial Urbanístico de Regulación de los Alojamientos Turísticos. Caso: Barri Gòtic de Barcelona: Barcelona, Spain, 2016. Available online: www.agustincocolagant.net (accessed on 21 June 2020).
- Amer, J. Los Debates Sobre La Percepción Social Del Turismo En Las Islas Baleares. Nimbus 2009, 23–24, 5–23. [Google Scholar]
- Neuts, B. Crowding externalities from tourist use of urban space. Tour. Econ. 2012, 18, 649–670. [Google Scholar] [CrossRef]
- Coccosiss, H. Defining, measuring and evaluating carrying capacity in European tourism destinations. In Final Report; B4-3040/2000/294577/MAR/D2; University of the Aegean, Department of Environmental Studies, Laboratory of Environmental Planning: Athens, Greece, 2001. [Google Scholar]
- Carrascal, E.; Villegas, G.P. Ocupación territorial y deterioro ambiental ocasionado por la expansión ur-bano-turística en Acapulco, Guerrero. Investig. Geogr. 1998, 111–124. Available online: http://www.scielo.org.mx/scielo.php?script=sci_arttext&pid=S0188-46111998000300009&lng=es&nrm=iso (accessed on 25 June 2020).
- Kang, P.; Xu, L. The urban ecological regulation based on ecological carrying capacity. Procedia Environ. Sci. 2010, 2, 1692–1700. [Google Scholar] [CrossRef]
- Fang, C.; Zhou, C.; Gu, C.; Chen, L.; Li, S. A proposal for the theoretical analysis of the interactive coupled effects between urbanization and the eco-environment in mega-urban agglomerations. J. Geogr. Sci. 2017, 27, 1431–1449. [Google Scholar] [CrossRef]
- Liu, R.; Borthwick, A.G. Measurement and assessment of carrying capacity of the environment in Ningbo, China. J. Environ. Manag. 2011, 92, 2047–2053. [Google Scholar] [CrossRef] [PubMed]
- Dan-Lin, Y.; Han-Ying, M. Regional carrying capacity: Case studies of Bohai Rim area. J. Geogr. Sci. 2002, 12, 177–185. [Google Scholar] [CrossRef]
- Taylor, L. Case study methodology. In Key Methods in Geography; Sage Publications London: London, UK, 2016; pp. 581–595. [Google Scholar]
- Hernández Sampieri, R.; Mendoza, C.P. El matrimonio cuantitativo cualitativo: El paradigma mixto. In JL Álvarez Gayou (Presidente), 6° Congreso de Investigación en Sexología; Congreso efectuado por el Instituto Mexicano de Sexología, AC y la Universidad Juárez Autónoma de Tabasco: Villahermosa, Tabasco, Mexico, 2008. [Google Scholar]
- Kanazawa, M. Research Methods for Environmental Studies: A Social Science Approach; Routledge: Abingdon-on-Thames, UK, 2017. [Google Scholar]
- Yin, R. Case Study Research: Design and Methods, 5th ed.; Sage: Thousand Oaks, CA, USA, 2014. [Google Scholar] [CrossRef]
- Johnson, K.E.; Stake, R.E. The Art of Case Study Research. Mod. Lang. J. 1996, 80, 556. [Google Scholar] [CrossRef]


Publisher’s Note: MDPI stays neutral with regard to jurisdictional claims in published maps and institutional affiliations. |
© 2021 by the authors. Licensee MDPI, Basel, Switzerland. This article is an open access article distributed under the terms and conditions of the Creative Commons Attribution (CC BY) license (http://creativecommons.org/licenses/by/4.0/).