1. Introduction
Transport exclusion has many negative consequences for the inhabitants of the territories affected by this phenomenon, people arriving there, as well as organizations operating in the territories where transport-related social exclusion occurs. Research proves that one of the reasons for the intensification of social exclusion in remote areas is limited access to mobility. Clearly, such circumstances are the most burdensome for a wide range of potential employees or consumers who wish to travel to workplaces as well as commercial and service outlets (also those providing public services related to education and health care) [
1]. As previous research has shown, people who are unable to access transport easily have limited access to employment, education, health services, opportunities, and the social network [
2]. In addition, a high level of accessibility to public transport affects the high level of commuters’ access to other services [
3]. Therefore, ensuring a high level of accessibility is a prerequisite for establishing a user-friendly system of commuter transport services [
4].
The phenomenon of transport exclusion has a particularly negative impact on people with disabilities, the elderly, and adolescents (pupils), but also all those who are willing to use public transport (e.g., for economic reasons, due to a lack of a driving license, because of convenience or an ecological attitude). Transport exclusion is also a serious problem from the perspective of local authorities responsible for ensuring inhabitants’ accessibility to public services and improving the quality of life of local communities, as economic factors in this case radically hamper the fulfilment of social needs and expectations of the inhabitants of peripheral areas [
5]. The involvement of public institutions can and should be linked to the concept of social consent, i.e., a consensus that all citizens are entitled to particular services, irrespective of their personal income [
6]. Therefore, local authorities have to face the challenge of developing and implementing an organizational solution that minimizes the costs of the public transport system while ensuring the expected level of commuters’ satisfaction with the level of provided services [
7]. Transport exclusion also has various negative consequences for local businesses and institutions. Problems with commuting to work may result in people’s inability to start or continue working at certain times of the day due to the lack of convenient transport connections. Furthermore, under the conditions of transport exclusion, the costs of employment increase as potential employees need to commute to work in private vehicles. The consumption of products and services offered outside the place of residence also decreases due to difficult access and the reduction of the consumer’s purchasing power by the costs of commuting in a private car. Public transport can be seen as a factor stimulating economic efficiency by providing people with access to employment outside their place of residence [
8,
9]. In addition, studies on access to employment indicate that the availability of public transport has a positive impact on commuters’ salaries [
10]. According to the UITP (L’Union Internationale des Transports Publics) study conducted in 2007, 80% of people using the services of employment agencies would not have taken up employment if they had not been provided with access to collective transport [
11].
Transport exclusion and the resultant absolute increase in the share of private transport in commuter transport causes higher environmental costs due to exhaust emissions from private means of transport used by inhabitants of remote areas, which also requires appropriate actions on the part of local authorities [
12,
13,
14]. In such a situation, transport exclusion becomes a serious obstacle to the implementation of the concept of sustainable development—from the perspective of both the entire system of the local economy (or even the entire local community) and individual entities [
15].
This state of affairs is characteristic of peripheral border areas (especially those with numerous natural geographical limitations blocking the development of a road network) with low population density. An example of such an area is the Polish–Slovak borderland covering parts of the Bieszczady Mountains on the Polish side and the Bukovec Mountains on the Slovak side of the border [
16]. The essence of the problem of local public transport inefficiencies lies primarily in the relationship between the low frequency of journeys and the limited access to employment, consumption, education, health care, entertainment, and opportunities for establishing and maintaining social connections and services [
17].
One of the possible ways to reduce the phenomenon of transport exclusion (and at the same time to create an environment favoring sustainable development) is applying solutions based on carpooling [
18]. In general, this service generally consists in sharing a journey in a private vehicle with people living separately. However, the point is to organize a system that is formalized enough to be used on a regular basis through its inclusion in the official public transport network. The idea of institutionalized carpooling integrated into the public transport system can constitute a response to the challenges of ensuring an efficient public transport system in areas with low demand for transport services [
19]. A necessary resource for the development of such a system is appropriate information allowing an estimation of the scale of transport exclusion for individual localities. It has to be taken into consideration that this scale changes dynamically depending on the season of the year. This knowledge provides the basis for a flexible and adaptive estimation of the demand for carpooling services. On the other hand, a formal information processing center is needed to coordinate demand and supply for transport services (connecting commuters and potential service providers) [
20]. It has to be integrated into the public transport management system so that local authorities can dynamically shape its structure through a system of appropriate incentives. The proposed solution will be compatible with those included in the Mobility as a Service (MaaS) area. Thus, the objective is a completely formal inclusion of private means of transport in the official public transport network. This requires that possible journeys be planned carefully and official information reach potential commuters. A solution of this type provides for the utilization of the potential of regular journeys made by private persons along fixed routes as a complement to public transport services [
21]. Designing such a system in a way ensuring its effectiveness is a very complex task and therefore requires different points of view to be known and taken into account if the project is to succeed [
22]. The role of information is also extremely important from the perspective of educating potential commuters about the shape and scope of carpooling services and thus ultimately convincing them to take advantage of such an offer. The issues of safety, reliability, and stability of the solution, i.e., taking into account the conditions that are important for all the parties involved, are also important and very well-known from the perspective of behavioral economics and the economics of sharing [
23]. It is therefore clear that information management is the basis for an effective institutionalized carpooling system integrated into the public transport network [
24]. Thus, it is advisable to create a model for assessing a degree of transport exclusion (taking into account the specificities of peripheral border areas) that will at the same time allow the identification of the characteristic factors, determining that the currently used public transport system is ill-suited to the needs of a modern post-industrial society.
2. Background
Peripheral border areas are characterized by the presence of conditions that are observed regardless of the location where research is conducted [
25]. In the case of public transport, this can be linked to the specific features of a bus service system since this mode of transport clearly dominates in the peripheral border areas (especially where natural obstacles hinder the efficient use of dense rail networks) [
26]. This specificity results from the fact that the provision of transport activities brings return on investment only on routes leading to larger towns or cities, i.e., local centers of social life. In such circumstances, feeder lines connecting small villages with transport nodes need to be subsidized. However, where, for various commercial or financial reasons, there is pressure to reduce unit operating costs, unprofitable feeder lines are being phased out [
27]. Despite the apparent economic rationality of such an action, this leads to a reduction in the overall profitability of the whole system. This problem is due to the insufficient number of commuters that feeder lines provide, and thus the stream of commuters on the main line is not strong enough [
28]. This situation results in a vicious circle of transport exclusion caused by the gradual reduction of the number of routes, a lower frequency of transport services, a fall in the number of transfer nodes, insufficient expenditures on bus fleets and road infrastructure, as well as an overall decline in the quality of transport services provided, which additionally discourages potential commuters from using the poor transport offer. Ultimately, the phenomenon under discussion is gradually decreasing the competitive position of public transport. When the system is stabilized, the point of equilibrium is at a very low level—residual transport services are regularly used by those commuters who have virtually no other, easily accessible alternative.
In Central Europe, there are also specific conditions that, in the case of peripheral areas, are conducive to the occurrence of transport exclusion zones [
29]. Public transport systems functioning in such areas are based on the principles corresponding to the needs of an industrial society. This type of organization of social and economic life dominated in every corner of this part of the world several decades ago. However, over time, the social situation has changed radically, and yesterday’s industrial society is post-industrial nowadays [
30]. In the case of peripheral areas, the process of social transformation has brought serious consequences in terms of specific transport needs of local populations. Some inhabitants (especially younger age groups) have moved to major urban centers or emigrated abroad, and the low demographic growth has further intensified the changes in the age structure of the society. Many workplaces located in peripheral areas have also been shut down, while the popularity of teleworking and remote working has been increasing continually. The social changes described cause a completely new character of the demand for transport services, as it lacks previous regularity and intensity [
31]. The range of transport needs has been reduced, fragmented, and individualized. For this reason, a system based on outdated assumptions, even after modifications, cannot guarantee a sufficient supply of services at prices acceptable to commuters. This is the case even when its operation is subsidized from public funds. This problem affects huge areas of Central Europe inhabited by millions of people. Moreover, similar processes are also gradually taking place in other parts of the world (e.g., in many Asian countries), hence European experiences in this respect could also prove useful in other locations. For this reason, the issue under consideration is very important from both a scientific and a practical perspective.
A characteristic feature of public transport in areas where transport exclusion is particularly worrisome is the relatively high share of schoolchildren and old citizens in the total number of commuters, with a relatively small number of people of working age among them [
32]. In addition, the high level of car ownership among inhabitants of areas suffering from transport exclusion resulting from the previous decline of public transport and changes in the sociology of mobility [
33] makes it possible for commuters to take advantage of opportunities to travel to selected destinations together with car owners, which further reduces the demand for collective transport services [
34]. In the case of competition among private operators in the commuter transport market, it is sometimes possible to notice indications of conflicts between commuters themselves and public transport enterprises [
35]. Disputes usually concern the routes and starting times of transport services. Passengers expect, above all, connections and timetables adapted to locations and times convenient for them with regard to their employment, education, or personal needs and preferences [
36]. However, transport enterprises are not always ready to meet such expectations due to high operating costs or problems of a logistical or organizational nature. As the demand for transport services provided to private individuals is substitutable, conflicts usually end when commuters who are able to switch to private motorized transport eventually do so. The remaining commuters, fully dependent on public transport, turn out to be too small a group to generate sufficient profits for the operator (assuming that elements of a market-based approach to public transport are used) or do not have sufficient powers of persuasion to defend their position against the practices of private bus enterprises or local authorities [
37].
Reducing transport exclusion is extremely important in view of social exclusion caused by problems with moving further than one’s immediate neighborhood. The importance of mobility also has a social dimension expressed in terms of opportunities to interact with relatives, the local community, and society at large [
38]. In the social sense, mobility is a measure of freedom as well as a condition for participation in social and civic life [
39]. A collective transport offer is important for creating and maintaining social contacts and family ties [
40]. Indirectly, such a situation also entails a number of strictly economic or ecological consequences, which, as a result, hampers the implementation of the principles of sustainable development in areas affected by transport exclusion. In particular, transport exclusion can have the following social consequences [
41,
42]:
- -
the wastage of development opportunities by individuals, groups of people, and potentially even large organizations;
- -
social poverty, which decreases consumers’ purchasing power;
- -
adverse migration-related changes in the (age, education, etc.) structure of the population influencing the supply of labor and consumption;
- -
the occurrence of structural unemployment;
- -
the weakening or severing of social ties;
- -
socioeconomic disintegration;
- -
an increasing level of car ownership (which often entails the purchase of vehicles that are significantly worn out and emit a lot of pollution) and, consequently, a negative impact on the natural environment;
- -
the progressive peripheralization of smaller towns and villages.
These consequences are experienced by many social groups, but the greatest difficulties are encountered by the following ones [
43,
44,
45,
46,
47,
48,
49]:
- -
People with reduced mobility, who very often do not have the opportunity to obtain a license to drive a motor vehicle themselves on public roads. This means that in terms of movement (even over short distances), such persons are completely dependent on others (relatives, friends, representatives of the social welfare system). Moreover, the specificity of mobility disabilities they experience sometimes means that they need to use specialist means of transport. As a result, the disabled have limited chances of getting a job in places offering employment for just such people. In such situations, mobility disability can also have psychological effects in the form of a sense of being trapped at home. This condition can be seen as yet another effect of transport exclusion.
- -
Senior citizens. An advanced age itself often proves to be a factor that causes a significant deterioration in health, making it impossible for the average senior citizen to drive a car on their own. Furthermore, this period of life is often characterized by a drop in income. This may lead to reduced possibilities of covering car maintenance costs. Older people may try to ask their neighbors or relatives for help in this respect. However, if this is not possible for some reason, public transport remains the only alternative. For this category of commuters, public transport can be quite a challenge, especially in winter or when a bus stop is located at a considerable distance from one’s home. Senior citizens are a group of people who need frequent visits to a doctor or pharmacy.
- -
Caregivers for elderly or disabled people. In the areas where the quality of social services is rather low, transport exclusion also affects people who act as caregivers for the elderly and people with disabilities. This also concerns immediate family members of such people who feel obliged to give up their employment and face the consequences of joblessness. Caregivers who are relatives of disabled persons receive no remuneration for their work. This results in their impoverishment and the obvious lack of funds to finance the purchase and maintenance of a car. Therefore, the negative phenomenon experienced by one group of people is passed on in full force to another.
- -
People affected by poverty. This group is characterized by a low level of income which does not allow them to cover their own and their families’ costs of living. Sometimes feedback occurs when transport exclusion contributes to an increase in unemployment. People with low income cannot afford a car. The result is their reduced access to employment, education and other services. This can cause an increase in the level of structural unemployment and an intensification in social deprivation. In some situations, the cost of maintaining a car can significantly reduce a person’s remaining disposable income. For this reason, the spatial distribution of jobs and the non-overlapping distribution of residential settlements lead to a surprising effect: despite the high rate of unemployment in such localities, aggregate labor costs there are higher than in places with low unemployment.
- -
Teenagers. Teenagers are another group at risk of transport exclusion, especially in areas with low population density and dispersed residential settlements. This is especially true of those who commute to school every day. For teenagers, it is particularly negative to experience limitations in educational opportunities. This also concerns the possibility of taking part in various extracurricular activities as transport links function only during the busiest hours. These circumstances again cause young people to ask their relatives or friends for help, but such help is not always possible because it is difficult to reconcile sometimes opposing needs at the same time. It is also necessary to mention the negative social consequences of teenagers’ limited opportunities for developing relationships within peer groups.
An analysis of the available literature on the subject allows the indication of a significant research and theoretical gap. Scientific publications extensively describe such phenomena as transport exclusion, problems of peripheral areas in the post-industrial era and carpooling. However, there is a lack of research combining these issues into a coherent and holistic conceptual model that could be genuinely useful in eliminating transport exclusion (based on a hybrid public transport system using institutionalized carpooling). Therefore, the diagnosed research gap designates a new space for considerations focused on adapting the already available scientific knowledge on the use of institutionalized carpooling (used when eliminating transport exclusion) to the needs resulting from specific conditions occurring in peripheral border areas. Taking into account the situation that exists in such specific areas—as part of the search for the possibilities of transforming the public transport system—is the basic added value of the presented analysis. It is especially important to take into consideration the circumstances that determine that in order to purchase most of the goods and services, the population has to go to the local center each time (thus communication in the radial pattern dominates); both the authorities and the population have very limited financial resources, well below the national average; there are no large workplaces in the entire area; the demographic structure is disturbed by the migration of people of working age; there is a low population density; settlement of a dispersed nature predominates; the road network and the road infrastructure are insufficiently developed; and the existing network of public transport connections is residual or completely decommissioned. Therefore, it makes sense to consider the usefulness of only those solutions that can be implemented without significant investment quickly and flexibly (especially as larger vehicles cannot be filled with passengers because there are few and dispersed passengers) and that ensure that the effects will be visible in a short period of time. An important element of the considerations (element needed to explain the dynamics of possible changes and complete the picture of the whole) is also the analysis of the theoretical model showing the mechanism of regulating adaptive information processes that may support the improvement of the system of public transport in the context of the described conditions. The transport services offered by such a system correspond to the real needs of commuters in peripheral areas and also constitute a viable alternative to individual transport. A high quality of service, flexibility, adjustment to commuters’ needs, reliability, accessibility, and a high level of integration provide an opportunity for inhabitants of disadvantaged areas to overcome transport exclusion. One of the determinants of the attractiveness of carpooling may be the fact that the service can be provided on a door-to-door basis [
50], which solves the “last mile” problem [
51].
In the capacity of the organizers, stakeholders, and indirect beneficiaries of transport services, local authorities are interested in achieving the highest possible efficiency of the public transport system within the limits of the funds at their disposal. Thus, they strive to eliminate the phenomenon of transport exclusion. The multidimensional nature of their role prompts authorities to use specific organizational solutions to meet the challenges of managing and achieving such complex objectives [
52]. This creates space for the implementation of hybrid solutions that combine traditional public transport networks with institutionalized carpooling, which is a registered service consisting in sharing a private car with people who are not members of the same household [
53]. Thus, the solution comprises only these private journeys that have been registered by the public transport system coordinator and are officially offered as a complement to regular timetables. It is assumed that institutionalized carpooling will take place primarily on such days and at such hours when the availability of traditional transport connections falls below the level of transport exclusion. This is a partial departure from the idea of one or more professional transport service providers toward a large number of occasional service providers operating within a formalized central unit coordinating the functioning of the whole system. For such a system to be operational, it is necessary to create a flexible information-based mechanism that dynamically adapts to the evolving environment.
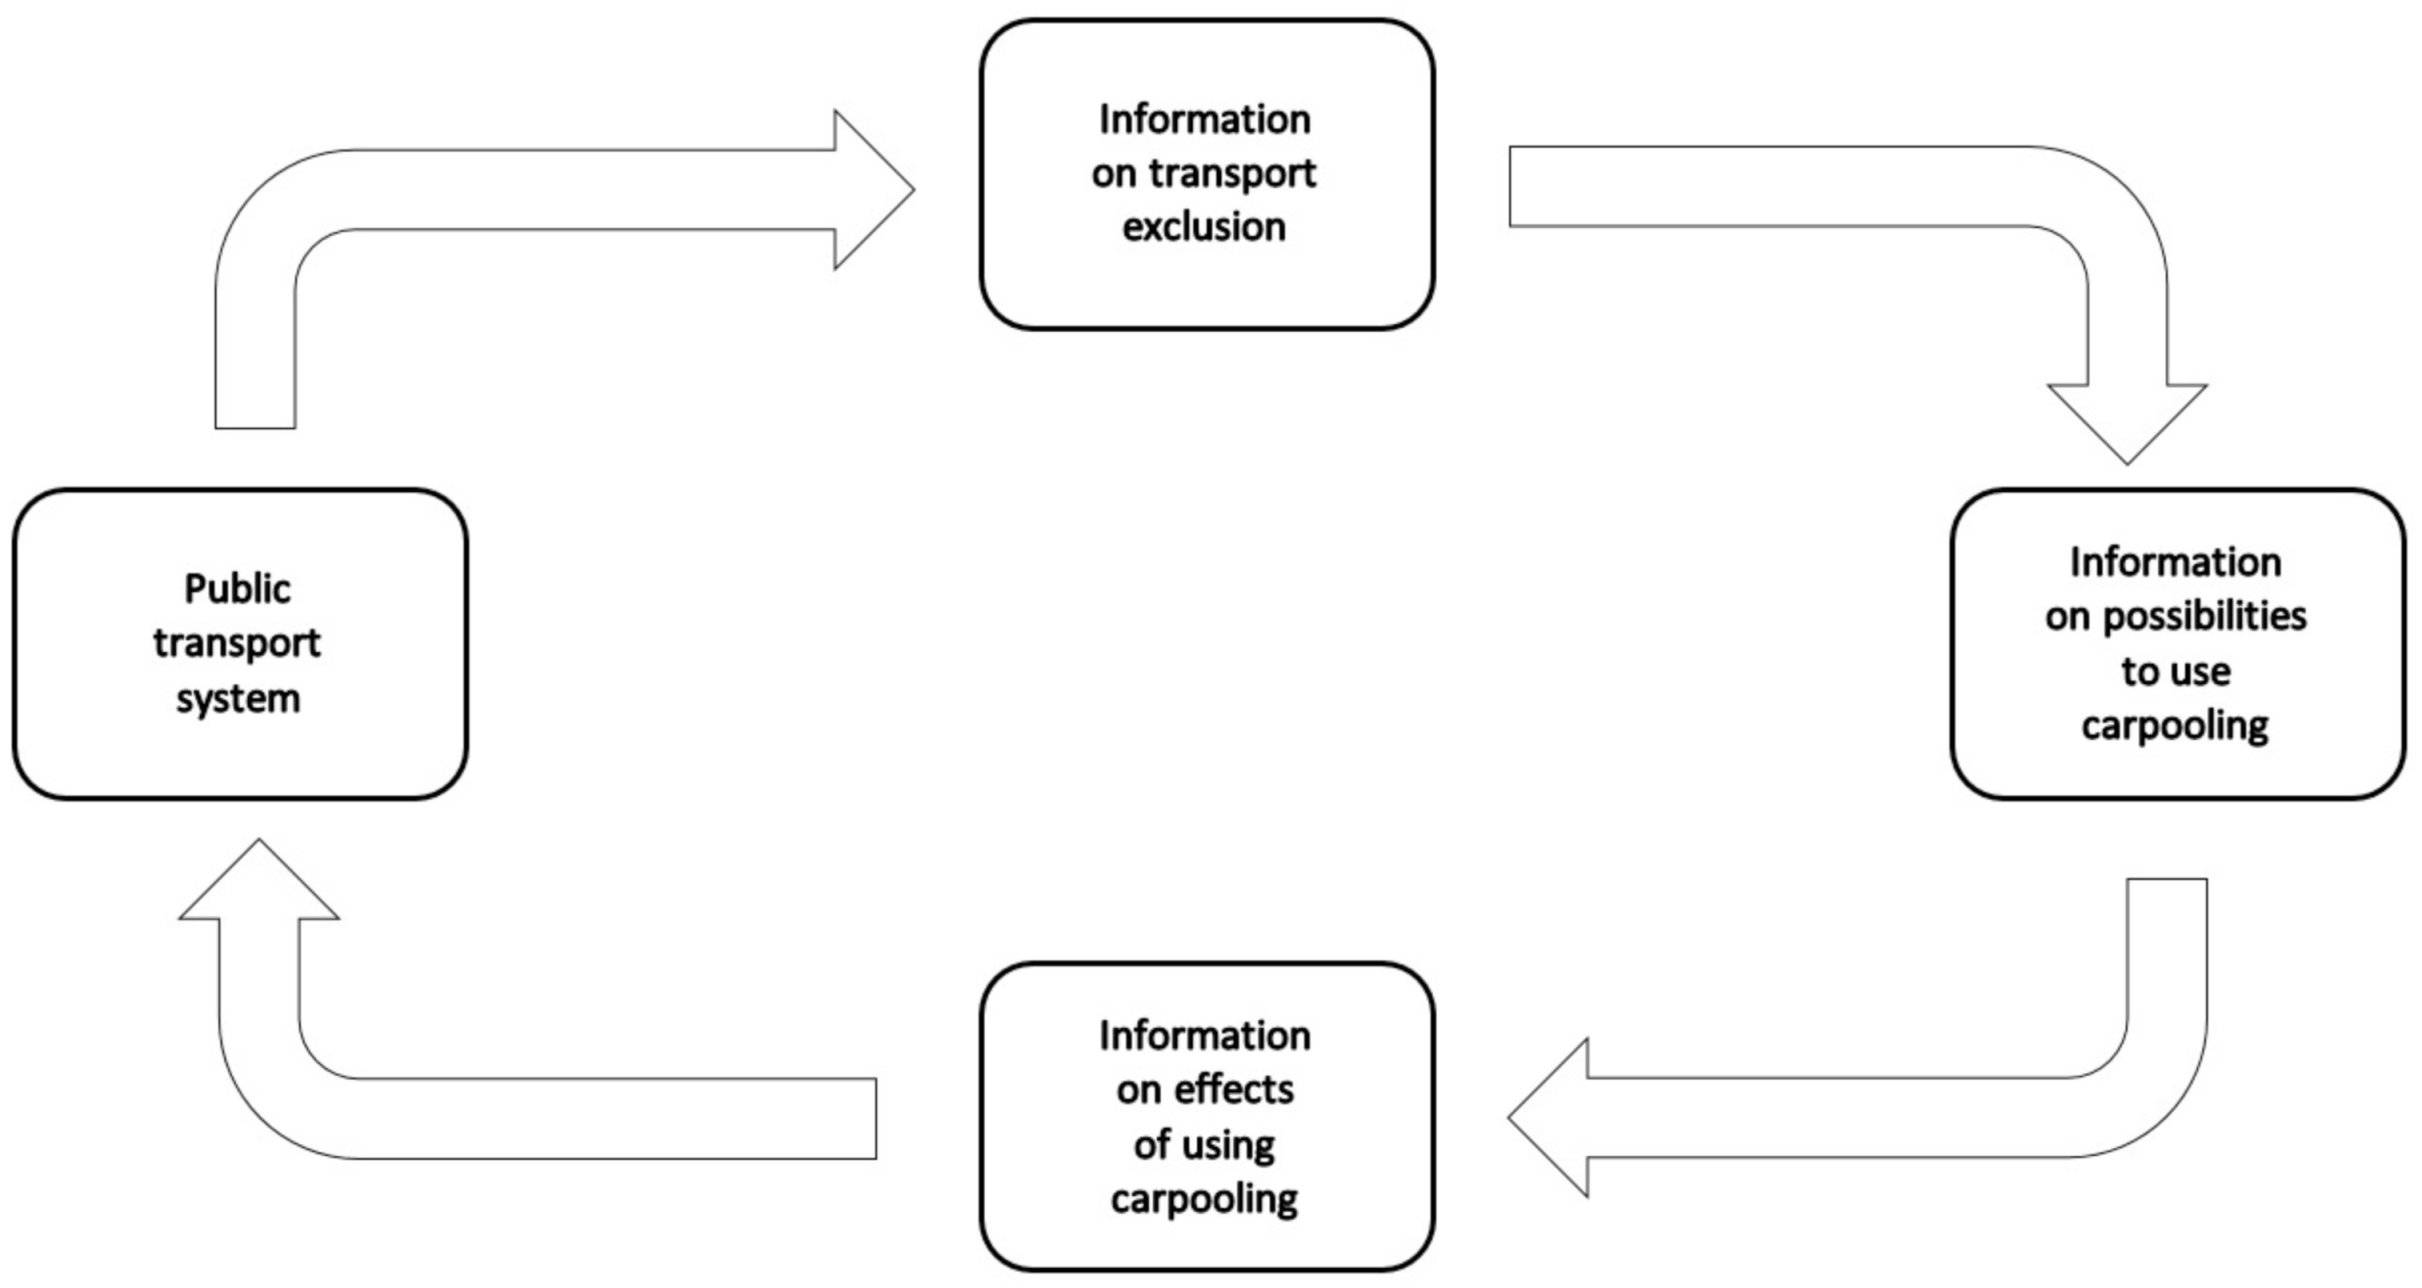
Based on the conducted analysis, it is possible to propose a model showing the role of information in the process of gradually integrating institutionalized carpooling into the public transport system (
Figure 1). Before the new service is launched, the public transport system is in a certain state of equilibrium: journeys are made at a frequency that guarantees the minimum cost-effectiveness of the activity, as determined by the market. This is the case when, in the long term, revenues from the sale of tickets and possible subsidies or funds from the local budget are sufficient to cover the operating costs of the transport service. Thus, at times when there is a shortage of available journeys, the majority of potential commuters use private vehicles, seek alternative solutions, or give up their travel plans. Therefore, the first challenge is to gather information on the time intervals when transport exclusion occurs (in the current state of equilibrium) and then to assess how many people experience this problem. The goal of this stage is to build a virtual model for assessing the dynamics of changes in the situation that will facilitate further calculations [
54]. The next step will result in an estimate of the scale of demand for the carpooling service. Information is then collected on the cost of creating and maintaining an institutionalized carpooling service and the number of potential enterprises who will declare readiness to provide such a service. Once a hybrid public transport system has been implemented, the effects of the new solution must be assessed. It is assumed that not only those excluded from transport but also some commuters using their own cars or the few journeys offered in the original timetable will choose the new service. The eventual range of use of the carpooling service depends on a number of factors such as low population density, the price of petrol, the possibility of socializing while driving, a long time of using public transport, an ecological attitude, time savings, financial savings, income, and safety [
55]. Ultimately, it will be necessary to make the original timetable (based on the use of public transport vehicles) realistic, which may result in a further substitutionary shift in demand between different means of fulfilling of transport needs. Such an adjustment in the form of launching subsequent iterations will continue until a new balance point of equilibrium is established. It is important, however, that the whole process be rationally managed on the basis of reliable and complete information.
3. Method
The study was aimed at confirming the thesis that the specificity of conditions (especially the scale of transport exclusion) that occur in peripheral border areas justifies the indication of institutionalized carpooling as a solution that is adequate to the challenges arising in such circumstances. The starting point for the empirical research was determining the method of measuring transport exclusion. Assuming that the public transport system is currently in a state of equilibrium—in other words, the number of offered journeys corresponds to the demand that guarantees the profitability of the system (even if this entails the occurrence of the phenomenon of transport exclusion)—the only parameter needed for calculations is the number of journeys per day. At the same time, in the context of the study, the profitability of the transport system should be understood as a situation where revenues from tickets and public subsidies allow the carrier to finance all running costs of the operation of the system, except for amortization (this is often the case with smaller private carriers, which, despite their low level of revenues, continue their transport activity). On the basis of an analysis of the available results of research on transport exclusion, the threshold value of this parameter (marked M) was set at 15 journeys per day for a particular locality [
56,
57,
58,
59]. These are findings referring to practical experience (observed in countries such as Switzerland, USA, or Australia), which is the result of using the available resources of academic knowledge. The theoretical sources of establishing the M parameter exactly at level 15 lie in the psychology of transport. A passenger is willing to accept a maximum of 1 h of time lost waiting for transport within one day (above this limit, the passenger’s tendency to look for alternative solutions grows dramatically). As local people travel almost exclusively on the route to the main central town and then return to their place of residence on the same day, the allowable average waiting time is the sum of two half-hour intervals. With this assumption and while taking into account the fact that 99% of journeys in border peripheral areas take place between 7.00 and 22.00, it turns out that the minimum number of connections is 1 per hour out of 15 h of daily activity of residents [
60]; 1 connection is understood here as the possibility of traveling both from the place of residence to the central city and from the central city to the place of residence (i.e., 1 connection is the possibility of traveling there and back). In the peripheral border areas, there is basically no connection other than the radially arranged public transport routes that lead from the central town to the smaller towns arranged around. The size of the vehicle does not matter here because the research assumes the rationality of carriers who are always ready to send a such vehicle on the route that will accommodate all those interested in the journey. As part of the research, transport exclusion is measured only in a spatial aspect, in relation to a single town. This results from the assumption that a resident of any town (small or large, more or less distant from the center) should have the same chance of using public transport. This means that the following interpretation applies:
- -
15 and more journeys per day: no transport exclusion;
- -
1–14 journeys per day: partial transport exclusion;
- -
0 connections: total transport exclusion.
Since particular days in a year vary with respect to the frequency with which the public transport system offers its services, the calculations were adjusted to take account of this circumstance. In this situation, one calendar year (for the purposes of the research, the calendar year 2020, comprising 366 days, was used) was divided into the following categories (S):
- -
working days outside holidays (S1): 212 days per year (57.92%);
- -
working days during holidays (S2): 44 days per year (12.02%);
- -
Saturdays outside holidays (S3): 41 days per year (11.20%);
- -
Saturdays during holidays (S4): 8 days per year (2.19%);
- -
Sundays outside holidays (S5): 41 days per year (11.20%);
- -
Sundays during holidays (S6): 9 days per year (2.46%);
- -
statutory days off (S7): 11 days a year (3.01%).
For each category of days in a year, calculations were made according to the following formula:
where
TRSE—transport-related social exclusion index;
R—number of journeys per day;
RSn—number of journeys per day (calculated separately for each category Sn);
Sn—designation of a specific category of days in a year (from S1 to S7);
M—parameter defining the daily number of journeys below which the phenomenon of transport exclusion occurs.
The TRSE index takes values from the following range:
- -
from −100% to 0% when transport exclusion occurs (the lower the value, the greater the scale of the phenomenon);
- -
0% when there is no transport exclusion (the higher the value of RSn, the greater the excess of journeys over the minimum level determined by the parameter M).
The TRSE index requires calculations to be carried out separately for each locality in the area covered by the research, together with values for the particular categories of days during the course of a year. This will also allow the TRSE index to be calculated as a weighted average for the number of days in each category. A juxtaposition of the number of inhabitants in a particular locality with the value of the TRSE index (for each category of days in a year) will show the scale of potential transport exclusion.
In addition to the measurement in respect of a single locality, the TRSE index will also be calculated in several variants for the whole of the territory under examination as a weighted average with respect to the following:
- -
the size of the population living in the particular localities;
- -
the category of the road at which the particular localities are located.
Additionally, to investigate the possible impact of transfer nodes (operating in the key localities of each of the areas under examination), the global value of the TRSE index (characterizing the whole area) will be additionally given as a result of calculations from which the data concerning the towns of Lesko and Snina will be excluded.
The picture of the situation in each town is completed by calculating the correlation between the following:
- -
the TRSE index (according to the particular types of days in a year);
- -
the category of the road passing through a locality (1—national roads and expressways; 2—provincial roads/class I roads; 3—district roads/class II roads; 4—communal roads/class III roads);
- -
the size of the population living in a particular locality.
In analyses of the problem of transport exclusion in peripheral border areas and the possibilities of eliminating it through institutionalized carpooling, the formulas presented above can be used to find answers to the following research questions (and to verify the accompanying hypotheses):
Question 1 (Q1) (major)
. In the case of regions with similar geographical, demographic, and economic conditions, does the scale of transport exclusion depend primarily on differences in the organization of the transport system?
Hypothesis 1 (H1) (major)
. In the case of regions with similar geographical, demographic, and economic conditions, the scale of transport exclusion depends primarily on differences in the organization of the transport system.
Question 2 (Q2) (auxiliary)
. In both regions, is the scale of transport exclusion in localities located far from the main transport routes different from that in localities located along the main transport routes?
Hypothesis 2 (H2) (auxiliary)
. In both regions, the scale of transport exclusion in localities located far from the main transport routes is different from that in localities located along the main transport routes.
Question 3 (Q3) (auxiliary)
. Is the percentage of the population living in the localities affected (even temporarily) by transport exclusion similar for each of the territories studied?
Hypothesis 3 (H3) (auxiliary)
. The percentage of the population living in the localities affected (even temporarily) by transport exclusion is similar for each of the territories studied.
Question 4 (Q4) (auxiliary)
. Is the average value of the TRSE index calculated for the particular categories of days for the first and second territories (calculated exclusively on the basis of data describing the situation in the localities affected by transport exclusion) similar?
Hypothesis 4 (H4) (auxiliary)
. The average value of the TRSE index calculated for the particular categories of days for the first and second territories (calculated exclusively on the basis of data describing the situation in the localities affected by transport exclusion) is similar.
Question 5 (Q5) (auxiliary)
. Is there a relationship between the size of a locality and the scale of transport exclusion for the particular types of days in a year?
Hypothesis 5 (H5) (auxiliary)
. There is a relationship between the size of a locality and the scale of transport exclusion for the particular types of days in a year.
4. Results
The commune of Lesko is situated at the southeastern end of Poland. It is inhabited by 11,319 people and occupies an area of 111.58 km2. Inhabited by 5304 people, the town of Lesko is a local shopping and service center. There are 15 villages in the commune. The inhabitants of the Lesko Commune earn on average 11.5% less than the average earnings in Poland. The net migration rate at the end of the year was −0.8%. The population density (person per square km) is 102 (for comparison, the value of this indicator for the whole of Poland is 123). There are 71 km of roads in the commune, which gives the result of 0.64 km/km2 (for comparison, the value of this indicator for the whole of Poland is 0.86). The total length of public transport routes is 57 km. There are 54 stops in the commune (3.6 stops per settlement; 4.77 stops per 1000 inhabitants). Public transport routes are arranged radially and lead from the central town to the smaller towns arranged around (this is basically the only option as there is no alternative road network). There is no railway or any national road passing through the commune. The public transport system in the commune functions based on the free market principles (economic calculations carried out by private carriers determine the launching of bus routes), with the exception of school buses, which are financed by the commune and also available for ordinary passengers. Open interviews conducted with local activists and NGOs (which strive to reduce the problem of transport exclusion) show that the inhabitants of the commune of Lesko use some form of carpooling services when traveling at short distances within the limits of the commune. Thanks to personal contacts, they receive this service from their friends, neighbors, or relatives (who live separately). In local transport, however, there is a lack of tools to link the demand and supply of carpooling services in the case of people who do not know each other. Therefore, even if a person potentially interested in such a service lives on a route along which another person is traveling in their own vehicle (and is potentially willing to provide a carpooling service), it is not possible to establish a connection between them. On the other hand, in the case of journeys on supra-regional routes (most often to the cities of Cracow and Rzeszów), the community has worked out solutions allowing potential passengers and drivers to contact each other. This process is carried out through Facebook groups and comprises journeys for the following distances: 0 km–50 km (demand declared in online posts: 2.2%, supply declared in online posts: 0.5%); 51 km–150 km (demand: 69.8%, supply: 75%); and 151 km–500 km (demand: 28%, supply: 24.5%). From January to mid-August 2020, those interested in finding the possibility to travel placed 439 posts for a total distance of 62,614 km, with an average distance of 142 km. Drivers searching for travel companions placed 601 advertisements for a total distance of 87,581 km, with an average distance of 145 km.
Among the 15 villages located in the Lesko commune, as many as 12 (i.e., 80%) are characterized by a TRSE index (the sum weighted with respect to the share of the particular categories of days in a year) of less than −50% (
Table 1). None of the localities is free from the problem of even partial transport exclusion (Lesko has the best index of −14%) and three villages (Dziurdziów, Jankowce, and Weremień) have a TRSE of −100% throughout the year. The average sum of the commune’s transport-related social exclusion index per inhabitant, including the town of Lesko, is −43%, with the average road category level per inhabitant of 2.7. If Lesko is not included in calculations, the index falls to −70% and the average road category level per inhabitant rises to 3.3.
An analysis of the results presented in
Table 2 shows that the most frequent TRSE index value is −100% (total transport exclusion). The value of 0% appears only six times. Apart from school days (S1) and working days during holidays (S2), transport exclusion is practically complete all over the area covered by the research. The least favorable results are for statutory days off (S7). Weekends outside holidays (S3, S5) are only marginally better. Some improvement can also be observed for holiday weekends (S4, S6). The situation looks better on working days outside holidays (S2) and best on school days (S1) (although also in this case, transport exclusion is a serious problem). The localities located at communal roads are deprived of transport all year round or have access to public transport on school days only (S1). The villages located at the national road (Postołów, Glinne) have access to fewer bus connections than Lesko due to the fact that some routes are served by fast buses.
The correlation matrix (
Table 3) reveals that in the commune of Lesko, the level of transport exclusion (generally for all variants of the TRSE index) is more strongly correlated with the category of the road at which a locality is located than with the number of inhabitants in a given locality. In the former case, the index values range from −0.94 (almost total negative correlation) to −0.64 (high negative correlation), and in the latter case, from 0.39 (moderate correlation) to 0.65 (high correlation). A certain distinction can be observed between working days (greater fluctuations in the level of transport exclusion) and statutory days off (the TRSE index for days marked as (S3), (S4), (S5), (S6) is equal to or close to 1, which means total convergence). For days in the category (S7), the calculation of the correlation with other variables is not possible because for each day category the TRSE index takes a constant value of −100%.
Snina District is located at the northeastern end of Slovakia. It is inhabited by 36,123 people and occupies an area of 804.74 km2. Inhabited by 19,520 people, Snina is the administrative center of the region with its own municipal transport system. There are 34 villages in the district, with Stakčín and the border village of Ubľa acting as minor shopping and service centers. The people of Snina District earn on average 44.25% less than the average wages in Slovakia. The net migration rate at the end of the year was −3.38%. The population density (person per square km) is 46.38 (for comparison, the value of this indicator for the whole of Slovakia is 111.45). There are 224 km of roads in the district, which gives the result of 0.28 km/km2 (for comparison, the value of this indicator for the whole of Slovakia is 0.88). The total length of public transport routes is 159 km. There are 234 stops in the commune (6.88 stops per settlement; 6.48 stops per 1000 inhabitants). Public transport routes are arranged radially and lead from the central town to the smaller towns arranged around (this is basically the only option as there is no alternative road network). The district has a railway line from Humenneho through Dlhé nad Cirochou, Belá nad Cirochou, Snina, and finally to Stakčín. The public transport system that operates in the district of Snina is shaped and partly financed by local authorities. Open interviews conducted in Snina show that, similarly to the Polish side of the border, the inhabitants of Snina use some form of carpooling services for short-distance journeys within the limits of the district. Thanks to personal contacts, they receive such a service from their friends, neighbors, relatives, or in the form of shared commuting to work. In Slovakia, there are also no tools to link local demand and supply for carpooling services in the case of people who do not know each other. Thus, if a person potentially interested in such a service lives on a route along which another person is traveling in their own vehicle (and is potentially willing to provide a carpooling service), there is no way to establish a connection between them. On the other hand, in the case of journeys on supra-regional routes (with Bratislava and Vienna as the most frequently chosen destinations), the community uses solutions allowing the establishment of contact between potential passengers and drivers. This process takes place through Facebook groups and covers journeys for distances longer than 151 km. In 2020, potential passengers posted 670 notices for a combined distance of 327,930 km, with an average distance of 489 km. Drivers, on the other hand, placed 564 ride offers for a total distance of 312,105 km, with an average distance of 553 km.
Out of the 34 villages in the district of Snina, as many as 25 (i.e., 73.5%) are characterized by a general TRSE index (the sum weighted with respect to the share of particular categories of days in a year) of below −50% (
Table 4). Only four localities situated along the railway line no. 196 are free from even partial transport exclusion. No locality has a TRSE index of −100% for the whole year, although very low values, e.g., −95%, −89%, −86%, −86%, appeared on a few occasions. The average level of transport exclusion for Snina District per inhabitant is −14%, and the average road category per inhabitant is 2.4. If the data for the town of Snina is excluded from calculations, transport exclusion in the remaining villages equals −30% per inhabitant, while the average road category is 2.9.
Among the results of the calculations carried out for Snina District and presented in
Table 5, it can be observed that the value of the TRSE index equals −100% (total transport exclusion) in 22 cases. The value 0% appears 30 times. Similarly to the commune of Lesko, apart from school days (S1) and working days during holidays (S2), transport exclusion in general is a very big problem especially during weekends (S3, S4) (S5, S6) and statutory days off (S7). The villages located at class I and class II roads have a transport exclusion index of around 50% on school days (S1) and working days on holidays (S2) and a high or total level of exclusion on weekends and statutory days off (S3, S4, S5, S6, S7). The villages located at class III roads have a moderate level of transport exclusion during school days (S1) and working days during holidays (S2) and a very high level of or total transport exclusion during weekends and statutory days off (S3, S4, S5, S6, S7). The localities most affected by transport exclusion are those outside, situated far from the main transport routes with a population of fewer than 100 inhabitants (Brezovec, Hrabová Roztoka, Jalová, Michajlov, Parihuzovce, and Runina), where a bus service can be used about a dozen or so times per week.
The correlation matrix (
Table 6) reveals that in Snina District, the level of transport exclusion for all days except for statutory days off is more strongly correlated with the category of the road at which a locality is located (values from −0.68 to −0.62) than with the number of inhabitants in a given locality (values from 0.47 to 0.61). On statutory days off, however, this relationship is reversed, which means that the size of the population is more important (correlation of 0.61) than the road category (correlation of −0.59). It can also be observed that the level of correlation of the particular variants of the TRSE index between each other is similar (regardless of the examined pair of indexes) and is close to 0.9, which is an indication of very strong correlation. This means that the level of transport exclusion in all localities changes in a similar way throughout the year, which can be paraphrased as a fair distribution of limited accessibility to the transport service.
5. Discussion and Conclusions
The model of public transport whose rules of operation were created decades ago for the purposes of the industrial economy dominated by shift work does not meet the contemporary needs and expectations of people living in peripheral border areas. This is so because there have been dramatic changes in not only the form of occupational activities of the inhabitants of such areas, but also the age structure and education structure of their local communities. In this situation, enterprises offering public transport services become uncompetitive in relation to private means of transport. The negative tendencies intensify each other: the less attractive the transport offer, the more passengers give up using public transport, which exacerbates the crisis and further limits the profitability of operations. This process indirectly leads to many subsequent negative social consequences described in more detail above. Because of financial limitations, both the model used in Poland (based on free market solutions) and the model providing for administrative interference in the network of public transport connections (the solution identified in Slovakia) do not allow a significant reduction of transport exclusion. In the case of Slovakia, however, the scale of negative phenomena proved to be smaller. This makes it possible to consider the first hypothesis (H1) as true. The transport exclusion index per inhabitant is −43% for the commune of Lesko (−70% when only rural areas are taken into account) and −14% for the district of Snina (−30% for rural areas). When calculating the value of the index per locality, it is −66% for Lesko and −57% for Snina, but what needs to be taken into consideration is the differences in the settlement structure between the two regions. It should be borne in mind that the conducted research shows that the possibilities of improving the existing solution are limited by the level of potential demand for transport services, especially in small villages located far from the main transport routes. In both areas covered by the research, what turns out to be of primary importance for the public transport system is to ensure that particular routes run along roads of higher categories, which makes it easier for transport service providers to fill seats in their vehicles but is simultaneously disadvantageous for people living in localities situated far from such roads. Thus, the second hypothesis (H2) was confirmed as well. The level of exclusion varies depending on the adopted public transport model. Depending on a day category, the average transport exclusion index ranges from −41% to −100% for Lesko and from −50% to −76% for Snina, while with respect to population, it ranges from −28% to −100% for Lesko and from −11% to −20% for Snina. Furthermore, it can be concluded that transport exclusion on the Slovak side of the border affects inhabitants more evenly [
59], while every locality is provided with access to basic transport services throughout a year, which was not achieved on the Polish side of the border. As a result, the third hypothesis (H3) was not confirmed. The fourth hypothesis (H4) was not confirmed, either. The averaged values of the TRSE index (calculated for the particular categories of days) are noticeably different for either territory. Taking into account only the rural population, the value of the index ranges from −54% to −100% for the commune of Lesko and from −24% to −43% for the district of Snina. The analysis of the correlations between the individual values obtained from the calculations shows a strong correlation between the number of people living in a particular locality and the level of transport exclusion affecting them: on both sides of the border, this correlation is much stronger on all days other than working days (regardless of whether they are working days during a holiday period or a school season). Therefore, the fifth hypothesis (H5) should be regarded as correct.
In the conditions of a dispersed residential settlement network, the post-industrial economy rejects public transport and opts for individual transport solutions tailored to the needs of the passenger and allowing them to optimize their activities. However, private individual transport is highly inefficient in terms of incurred costs and burdensome to the environment, takes up a lot of space for necessary road infrastructure, particularly car parks, causes congestions, provides safety at a relatively low level, and requires the driver’s constant and strong focus on steering the vehicle. Furthermore, certain social groups, due to their characteristic features, cannot afford private means of transport. Such phenomena as social fragmentation, individualization of needs, dispersion of demand, demographic changes, and changes in the structure of occupational activities cause a situation in which the model of organizing a public transport system on the basis of buses moving passengers at peak hours is not able to fulfil its function, even if some support from authorities is available. This is determined by economic considerations. Therefore, what is necessary is a new, reliable, and safe solution providing a wide range of available routes and travel times, opportunities for commuters to choose certain parameters of individualized services, and costs that are lower than those associated with private transport. It is also necessary to eliminate the problems of the last mile and the availability of vehicles for people with reduced mobility. If such a system is to function efficiently, all related information needs to be managed with a high level of precision. The goal is to combine residual demand and supply for off-peak rides (i.e., when there are not enough passengers to fill public transport vehicles) with the maximum utilization of resources already in use (including private vehicles). Institutionalized carpooling seems to meet these requirements. Although it is not the only possible solution, what makes it particularly advantageous is that it does not require any expensive infrastructure and the costs of acquiring and maintaining vehicles participating in service provision processes are transferred to and maintained by vehicle owners [
61]. The research shows that both communities have developed some forms of carpooling services on a bottom-up basis. This can be a good starting point for building a more formal solution. However, at this stage there are still many issues that need further clarification. In particular, it will be necessary in the future to carry out additional social research to determine what incentives should be prepared for potential service providers (that is private car owners traveling regularly along specific routes) to persuade them to participate in the system as well as to develop mechanisms ensuring the level of supply necessary for the smooth provision of the service. Certainly, launching an institutionalized carpooling service as part of a hybrid public transport system will also require an effective informational and educational campaign targeted at local communities and the provision of technological support to all interested parties in the form of a dedicated information technology system enabling contacts between drivers and passengers. As previous research has shown, the perceived attractiveness of carpooling is influenced by a number of factors: the potential frequency of use of the service, the motivation of stakeholders, the socio-demographic characteristics of the population, population density and the subjective perception of service availability [
62]. At this stage, the overall costs of a project providing for the development of a hybrid public transport system using institutionalized carpooling in peripheral border areas have not been estimated, so the idea requires further work if a decision is taken to implement the proposed solution.
As the research has shown, the specificity of the conditions characterizing both analyzed territories (especially the observed high scale of transport exclusion, but also the radial layout of travel routes by public transport and parameters describing the local community) justifies the formulation of a recommendation in the form of a proposal to implement institutionalized carpooling as a solution radically improving the quality of life of the inhabitants. It should be expected that the transformation of the public transport system will be a catalyst for further sustainable development of the studied areas, as suggested by the example of northern France [
63]. European experience confirms that the proposed solution may condition the success of social programs created to reduce the negative effects of the phenomenon of social exclusion on the “non-mobility areas” [
64]. Thus, it can be assumed that the very fact of implementing institutionalized carpooling also in the case of peripheral border areas has a clearly positive impact on the local community and contributes to its development, facilitating the effective implementation of any other social programs [
65]. This observation is also consistent with the postulates formulated by researchers who emphasize the importance of an effective public transport system for the sustainable development of peripheral areas [
66].
To sum up the performed analysis, it should be stated that its undoubted theoretical contribution enriching the available knowledge of possible solutions to social and organizational problems related to the phenomenon of transport exclusion is a conceptual model describing the role of information in the process of incorporating institutionalized carpooling into public transport systems in peripheral border areas (i.e., in such areas where systemic solutions in the field of public transport services are based on the obsolete principles incompatible with the contemporary needs and expectations characteristic of post-industrial society). An equally important theoretical contribution is the creation and testing of a methodology for estimating the scale of transport exclusion in the form of the TRSE index in areas classified as peripheral border areas. Another important achievement is the determination of the strength of the impact of such factors as the number of inhabitants of a given locality and the category of roads at which the locality is located on transport exclusion. The categories of days during the course of a year constitute another variable that proved to be important in the research conducted. This knowledge will make it easier in the future to diagnose the problem of transport exclusion in other similar peripheral border areas in Central and Eastern Europe, which are inhabited by millions of people. The considerations presented in this paper are an important practical contribution to the process of eliminating transport exclusion in border peripheral areas, as they provide representatives of local authorities with ready-made tools to diagnose the scale of the problem and formulate principles allowing the building of a new and efficient hybrid public transport system using institutionalized carpooling.


