Article

Influencing Factors and Social Media Reflections of Bakery Products Consumption in Romania

by
Georgiana-Raluca Lădaru
1,
Marian Siminică
2,
Maria Claudia Diaconeasa
1,*,
Diana Maria Ilie
3,
Carmen-Elena Dobrotă
4 and
Marian Motofeanu
1
1
The Department of Agrifood and Environmental Economics, The Bucharest University of Economic Studies, 010961 Bucharest, Romania
2
The Department of Finance, Banking and Financial Analysis, The University of Craiova, 13 A.I. Cuza Street, 200585 Craiova, Romania
3
The Agricultural Economics Office, Research Institute for Agriculture Economy and Rural Development, 010961 Bucharest, Romania
4
The Department of Administrative and Economic Sciences, Faculty of Business and Administration, 4-12 B-dul Regina Elisabeta, County 3, 030018 Bucharest, Romania
*
Author to whom correspondence should be addressed.
Sustainability 2021, 13(6), 3411; https://doi.org/10.3390/su13063411
Submission received: 10 February 2021 / Revised: 7 March 2021 / Accepted: 16 March 2021 / Published: 19 March 2021

Abstract

:
Bakery products, and bread specifically, represent an important part of the Romanian diet. Whether this situation is motivated by quality factors or by quantitative factors is an important aspect that needs to be investigated. In addition, the relation between peoples’ interest in a particular product such as bread during a crisis period should point out important characteristics of that population. Aiming at determining both the influencing factors of bakery product consumption and the importance given to this type of product in the media during a crisis, this empirical study highlights the profound connections between income level and the fear of not having food security for the people of a less developed country such as Romania. The study considers the use of both qualitative and quantitative methods to reach its objectives. The results point to a strong reliance of the respondents on cheap white-flour bakery products in their regular diet, and a significant increase in interest in bakery products during the COVID-19 pandemic.

1. Introduction

The fact that grain-based products have been and still are an important part of people’s regular diets is not news. Their nutritional properties recommend them as significant energy sources for the human body [1,2]. Therefore, grains have become hard-to-replace food products. Among other factors that contribute to the popularity of these products are the worldwide spread, the affordability, and the general recognition [3].
Nevertheless, grains have not escaped the evolution of mankind in thinking and understanding specific things. For example, Harari’s [4] presentation of the “wheat that domesticated mankind,” turning man to a sedentary nature with a diet concentrated on the few plants it grew, offered some simplified insight into the puzzles regarding the degrading general state of humanity. Other researchers stressed more particular issues generated by grain-based products such as the contribution to increases in allergies, intolerances [5], or chronic diseases [6]. Even so, grain-based products are a major component of the human diet [1].
The choice of country is not random, but well-intended, as Romania is part of Europe, a region characterized by a high consumption of wheat, ref. [7] and was once known as “the granary of Europe” for its high production and export of wheat. In addition, according to Food and Agriculture Organization (FAO) [7] the consumption of wheat and wheat-derived products per capita in 2018 was more than 128 kg in Romania, placing this country third in the European Union after Italy and Malta. Another motivation for the choice of country is related to the poverty level, as bakery products are part of the subsistence food category [8] and Romanians spend more than half of their monthly income on consumption goods, with bakery products occupying a significant part of their spending [9]. Actually, Romanians’ spending on food was the highest in the EU in 2018 [10].
The importance of a sensitive topic is expected to have a representative depiction on social media at the countrywide level, presenting different opinions and situations that offer researchers powerful insights into the interests and fears of the local population regarding the selected topic, as previous studies have demonstrated [11,12]. In addition, high importance given to a topic on different social media channels may influence peoples’ reactions related to the topic [13,14,15]. Therefore, the depiction of bakery products and bread on Romanian social media should offer significant information on its importance and the main problems encountered in Romania in relation to it.
The aim of this empirical research is to analyze the importance of bakery products in Romanians’ diets, as well as the factors that influence the choice to consume this category of products.
The study follows two main objectives:
  • Determining the importance given to bakery products as a topic of discussion at the social media level in Romania through a qualitative analysis; and
  • Determining consumer preferences for bakery products and the main factors that influence the choice of these products through a quantitative analysis.
The general presentation of this research follows a logical structure: First, the theoretical framework is set, followed by the methodological approach. Second, the results and discussions are conveyed in two different subsections, one on the qualitative results and another on the quantitative results. The discussions frame the results within the body of literature. The third and last section presents the main conclusions and limitations of this study.
From a socioeconomic perspective, it is important to constantly monitor the consumption trends of basic food products, as they offer specific information on the development stage of a region. Therefore, food policies based on the real needs of consumers may be designed, including measures of support in uncertain times such as the COVID-19 pandemic as well as marketing strategies targeted at a particular markets’ characteristics. In this case, the current study adds to the body of literature by presenting particularities of Romanian consumer preferences for grain-based products, especially bakery products.

2. Theoretical Background

The evolution of wheat consumption has been of interest to researchers for a long time [16,17], who have concluded that it is a main component of the human diet. However, concerns regarding the negative influence of its consumption through its derived products such as bread on health [18] or the environment [19] have increased.
In view of the growing trend of obesity in our country, some questions can be raised about the quality of nutritional information on food, and these questions can also be found in Kiesel et al. [20]. The authors questioned whether the way in which nutrition information is provided affects consumer choices, but also whether consumers appreciate nutrition information [20]. Some authors claimed that firms have much more comprehensive information about the quality of their products than they consent to offer, thus creating an asymmetric information situation. Therefore, mandatory nutrition labelling can fill this information gap by correcting asymmetric information and turning a good experience or good faith characteristic into quality [19,21]. Consumers’ attitude towards nutrition labelling is determined by their interest, knowledge, demographic data, and the current format of the label [22].
Consumers are also particularly interested in nutrition information on food labels [23,24]. In general terms, these labels also seek to inform and warn about nutritional content, facilitating the choice of food and improving daily consumption [25]. For example, increasing information on the differences between white bread and whole bread or other types of bread have increased consumers’ awareness of the nutritional gaps of the first type of product and their efforts to avoid it [26,27,28].
Nowadays, changing consumption habits and introducing diversity to lifestyles is an important aspect for many people. Some authors [23,24] observed that consumers are trying to follow specific rules that reduce the volume of certain foods in their diet in order to provide their bodies with the appropriate amount of nutrients and also to care for the environment.
Food trends have changed due to various endogenous and exogenous factors such as food crises and environmental concerns, as well as support for local producers and improved transparency of the supply chain [29,30]. Therefore, the correlation between a crisis period such as COVID-19 and the interest of consumers in specific information on food is important.
The first hypothesis of the authors is that the interest in information on bakery products and bread by Romanian consumers increased significantly during 2020.
Some authors [31] argued that local food production, traditions, and links to the product origin can be powerful elements of local identity and culture. Where there is a strong local identity and commitment to the region, demand for local products is likely to be higher. Hence, foodstuffs combining the characteristics of local, regional, and traditional products are highly appreciated by consumers [31,32]. A close connection to bakery products, and especially bread, has been registered for Eastern European countries, including Romania, for which bread is seen as an important local, traditional product, in addition to its accessible price [32]. Other aspects influencing food consumption, such as cognitive, regulatory, and emotional attributes, as well as buying points and sociodemographic characteristics, have been studied [33], showing that product quality, process quality, and regional identity have a particular importance in influencing consumer preferences for regional products, whereas cognitive attributes do not have a significant influence on consumer preferences.
Consumer food choices are affected by various factors that are of interest to the food industry. Some studies [34,35] pointed out the influence of familiarity on the expectations and taste of specific foodstuffs among consumers familiar with and unfamiliar with specific regional products, showing that familiarity affects how consumers use the available information to form an appreciation of the product quality, proposing that increasing consumers’ knowledge of the products would increase their choice of high-quality products. This strategy is in line with current consumer behavior modifications, which show an increasing focus on traditional, natural, and local products at the expense of industrial products [35,36].
The second hypothesis of the current study relates to the influencing factors of bakery product consumption. Therefore, the authors assumed that younger consumers are more influenced by the quality of the bakery products (preferring local or artisanal products), whereas older consumers are significantly influenced by the price of bakery products.
Other studies [37] found that major regional differences in consumer preferences make segmentation of the regional market an attractive option, determining that consumer preference structures are more strongly influenced by differences in economic development than subculture.
The third hypothesis of this study is, therefore, that income is a main influencing factor for bakery products and bread consumption, with lower incomes leading to higher bread consumption. In addition, people in rural areas are believed to consume higher quantities of bread than people in urban areas.
Some authors [38,39,40] considered consumer preferences in terms of product style and what that means in practical terms for the marketing of widespread food products (e.g., bread, wine, or meat). They found that there are specific differences in consumption behavior and sensory preferences in men and women and between generic cohorts, specifically millennial and elderly consumers, with the provision of key tangible aspects of food products, namely, consumer sensory preferences, as being particularly important.
Therefore, the fourth hypothesis of our study is that there are significant differences between the preferences of female and male respondents regarding bread, as well as among age categories, with older categories of respondents consuming more bread than younger categories. In addition, male respondents are expected to consume higher quantities of these products.
In terms of sustainability, understanding environmental impacts of complete food supply chains is important for the food industry to help devise strategies for reducing the impacts of current and future products. Several authors studied the impact of food production on the use of energy and resources [41,42,43], resulting in major warnings related to the current production and consumption pattern that is damaging the environment.
Improving the efficiency of the food supply chain has been identified as a key means of improving food security while reducing pressure on natural resources [43]. However, there were studies [44] regarding the strong fluctuations and short-term changes of eating habits, claiming they can have major consequences on the potential generation and management of food loss and waste, as well as greenhouse gas emissions, all considering nutritional and economic aspects. Given the exceptional restriction measures imposed by the Spanish government as a consequence of the COVID-19 pandemic, the food production and consumption systems underwent significant changes. During the first weeks of COVID-19 restrictions there was no significant adjustment in the global generation of food loss and waste (FLW), but there was a partial reallocation from extra-internal consumption to households (12% increase of FLW for households) [44].
Therefore, the fifth hypothesis of this study is aimed at the waste of bakery products and bread, assuming that there is a significant difference between age groups and income groups in the quantity of wasted products, with the older categories wasting less than the younger categories and the low-income categories wasting less than the higher-income categories.
The debate in the media concerning a particular topic provides important insight into society’s perception and understanding of the topic [11] Considering food-related topics, several authors looked into how the social media debate depicted them and how they influenced consumption [45,46]. Topics that were of higher interest in the debate related to some sort of controversy, for example, genetically modified organisms in food production [47] or the impact of food on health, especially on diabetes, obesity, or children [46,48]. Other authors studied the depiction of new food technologies [49] or the effect of advertising fast food directly to children [48]. In this case, the main fears of a society, related directly to food as a prime condition for life, are presented in the media.
Therefore, a powerful reflection of the COVID-19-generated modifications on consumption in relation to a basic food category (bakery products) is expected to be found in the online media articles of the first part of the ongoing pandemic period (January–December 2020).

3. Methodology

In order to pursue the previously stated objectives, the researchers considered a mixed method approach. The importance given in the media to the topic of bakery products and the main threads of discussion generated by the topic were analyzed through a qualitative method, using the content from all available channels (newspapers, television news, blogs, and social media posts) that was posted on a social media network (Facebook, Twitter, Pinterest, etc.) during a specific period as well as word frequency software Buzzsumo [50]. The software allows the performance of social media discourse analysis on a selected topic and region, and it is a tool used in different areas, such as the spreading of medical fake news [51], citation analysis [52], the recently developed vaccination debate [53], or the refugees crisis [54].
The selection of social media content used the search phrase “produse de panificatie OR paine” (“bakery products OR bread” in the Romanian language) and filtered the results by “Romania” as a region. This generated 844 articles with a 459,874 total user engagement and 544 average engagements per post on these topics for the period from January 2020 to December 2020, whereas the search for only “produse de panificatie” (Romanian for “bakery products”) using the same filters generated only 42 articles with 3016 total user engagements and 71 average engagements per post. The findings explain the significant differences. The engagement refers to the number of user interactions with a post on the considered topic (views, clicks, shares, comments, or reactions) [55].
The qualitative analysis relates both to the content of the retrieved articles and to the engagement they registered on the web-based platforms. Additionally, the main themes generated by the retrieved content were extracted by analyzing and coding each of the articles by the main debated topic [56].
The consumer preferences for bakery products and the factors that pose the most influence on choice were determined through an empirical study [57] using a quantitative method [58].
Regarding the method of gathering the information, a quantitative survey was considered, using the structured investigation technique through a self-administered questionnaire [59]. As a sampling method, a convenience sampling through the “snowball” process was used [60]. The main criteria for being included in the sampling group was to be a bakery product consumer.
In order to determine the sample size, the Taro Yamane method was used [61,62], according to which
n = N ( 1 + N   × e 2 )
where N is the total population of 17,592,625 people over the age of 15 (Romania’s population in 2020, according to [9], so the minimum size of the determined sample (n) was 693 people, using an error (e) of 3.8%.
The questionnaire was composed of 27 questions (26 closed questions and one open question). Once developed, the questionnaire was pilot tested on 20 people to gather feedback on understanding the questions and thus improve the quality of the research [57]. The questionnaire was distributed online.
The variables [63] used in the study of the Romanian bakery product market were (a) dependent variables: consumer preferences for bakery products, and (b) independent variables: gender, age, place of residence, and income. Only the independent variables that generated important observation are further debated in the findings and discussion section.
The data gathered through the questionnaire were interpreted with the quantitative analysis software IBM SPSS, version 27 [59,64]. The influence of the independent variables on the dependent variables was studied using the chi-squared test [65].
The total number of answers gathered was 718, therefore the minimum sample was ensured. However, the structure of the sample does not resemble the population structure [9]; therefore, the findings serve well to form a hypothesis for a future study with a representative sample [66].
The structure of the sample by gender was composed of 77% females and 23% males; 23.4% of the sample lived in a rural area and 76.6% lived in an urban area. The distribution of the sample by age showed a preponderance of young people, 7.52% of whom were younger than 20 years old, 54.87% of whom were between 20 and 29 years old, 18.25% of whom registered an age between 30 and 39 years old, 12.81% of whom registered an age between 40 and 49 years old, and only 6.55% of whom were older than 50 years. Regarding the distribution of the sample by monthly income, 32.2% of the respondents had incomes lower than RON 2000 (around EUR 410 at 4.87 RON/EUR according to the National Bank of Romania [67], 38.4% registered incomes between RON 2000 and 4000 per month, 17.5% registered monthly incomes between RON 4000 and 6000, and only 11.9% registered monthly incomes above RON 6000.

4. Findings and Discussion

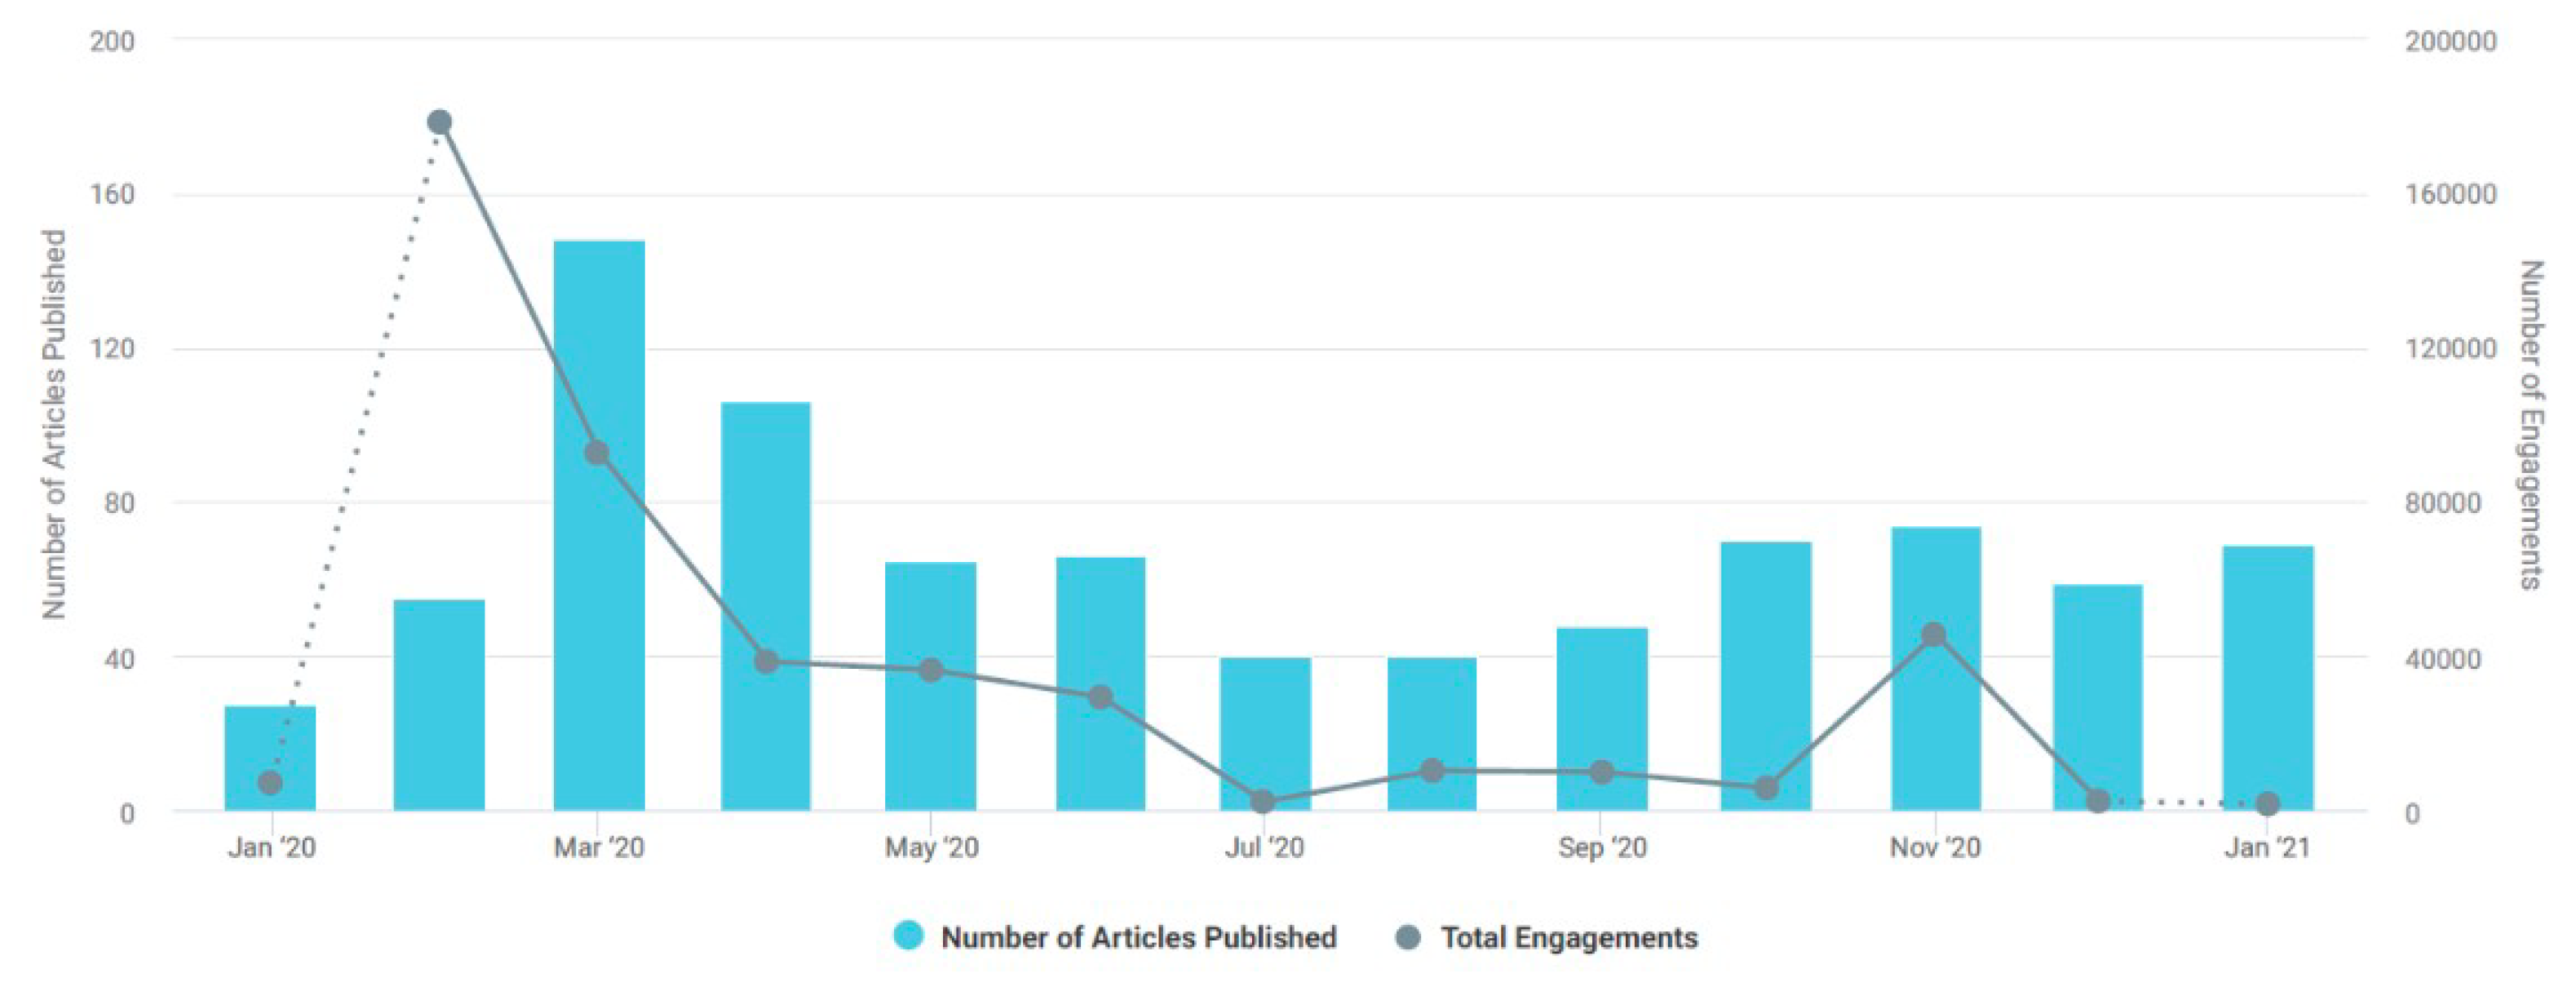
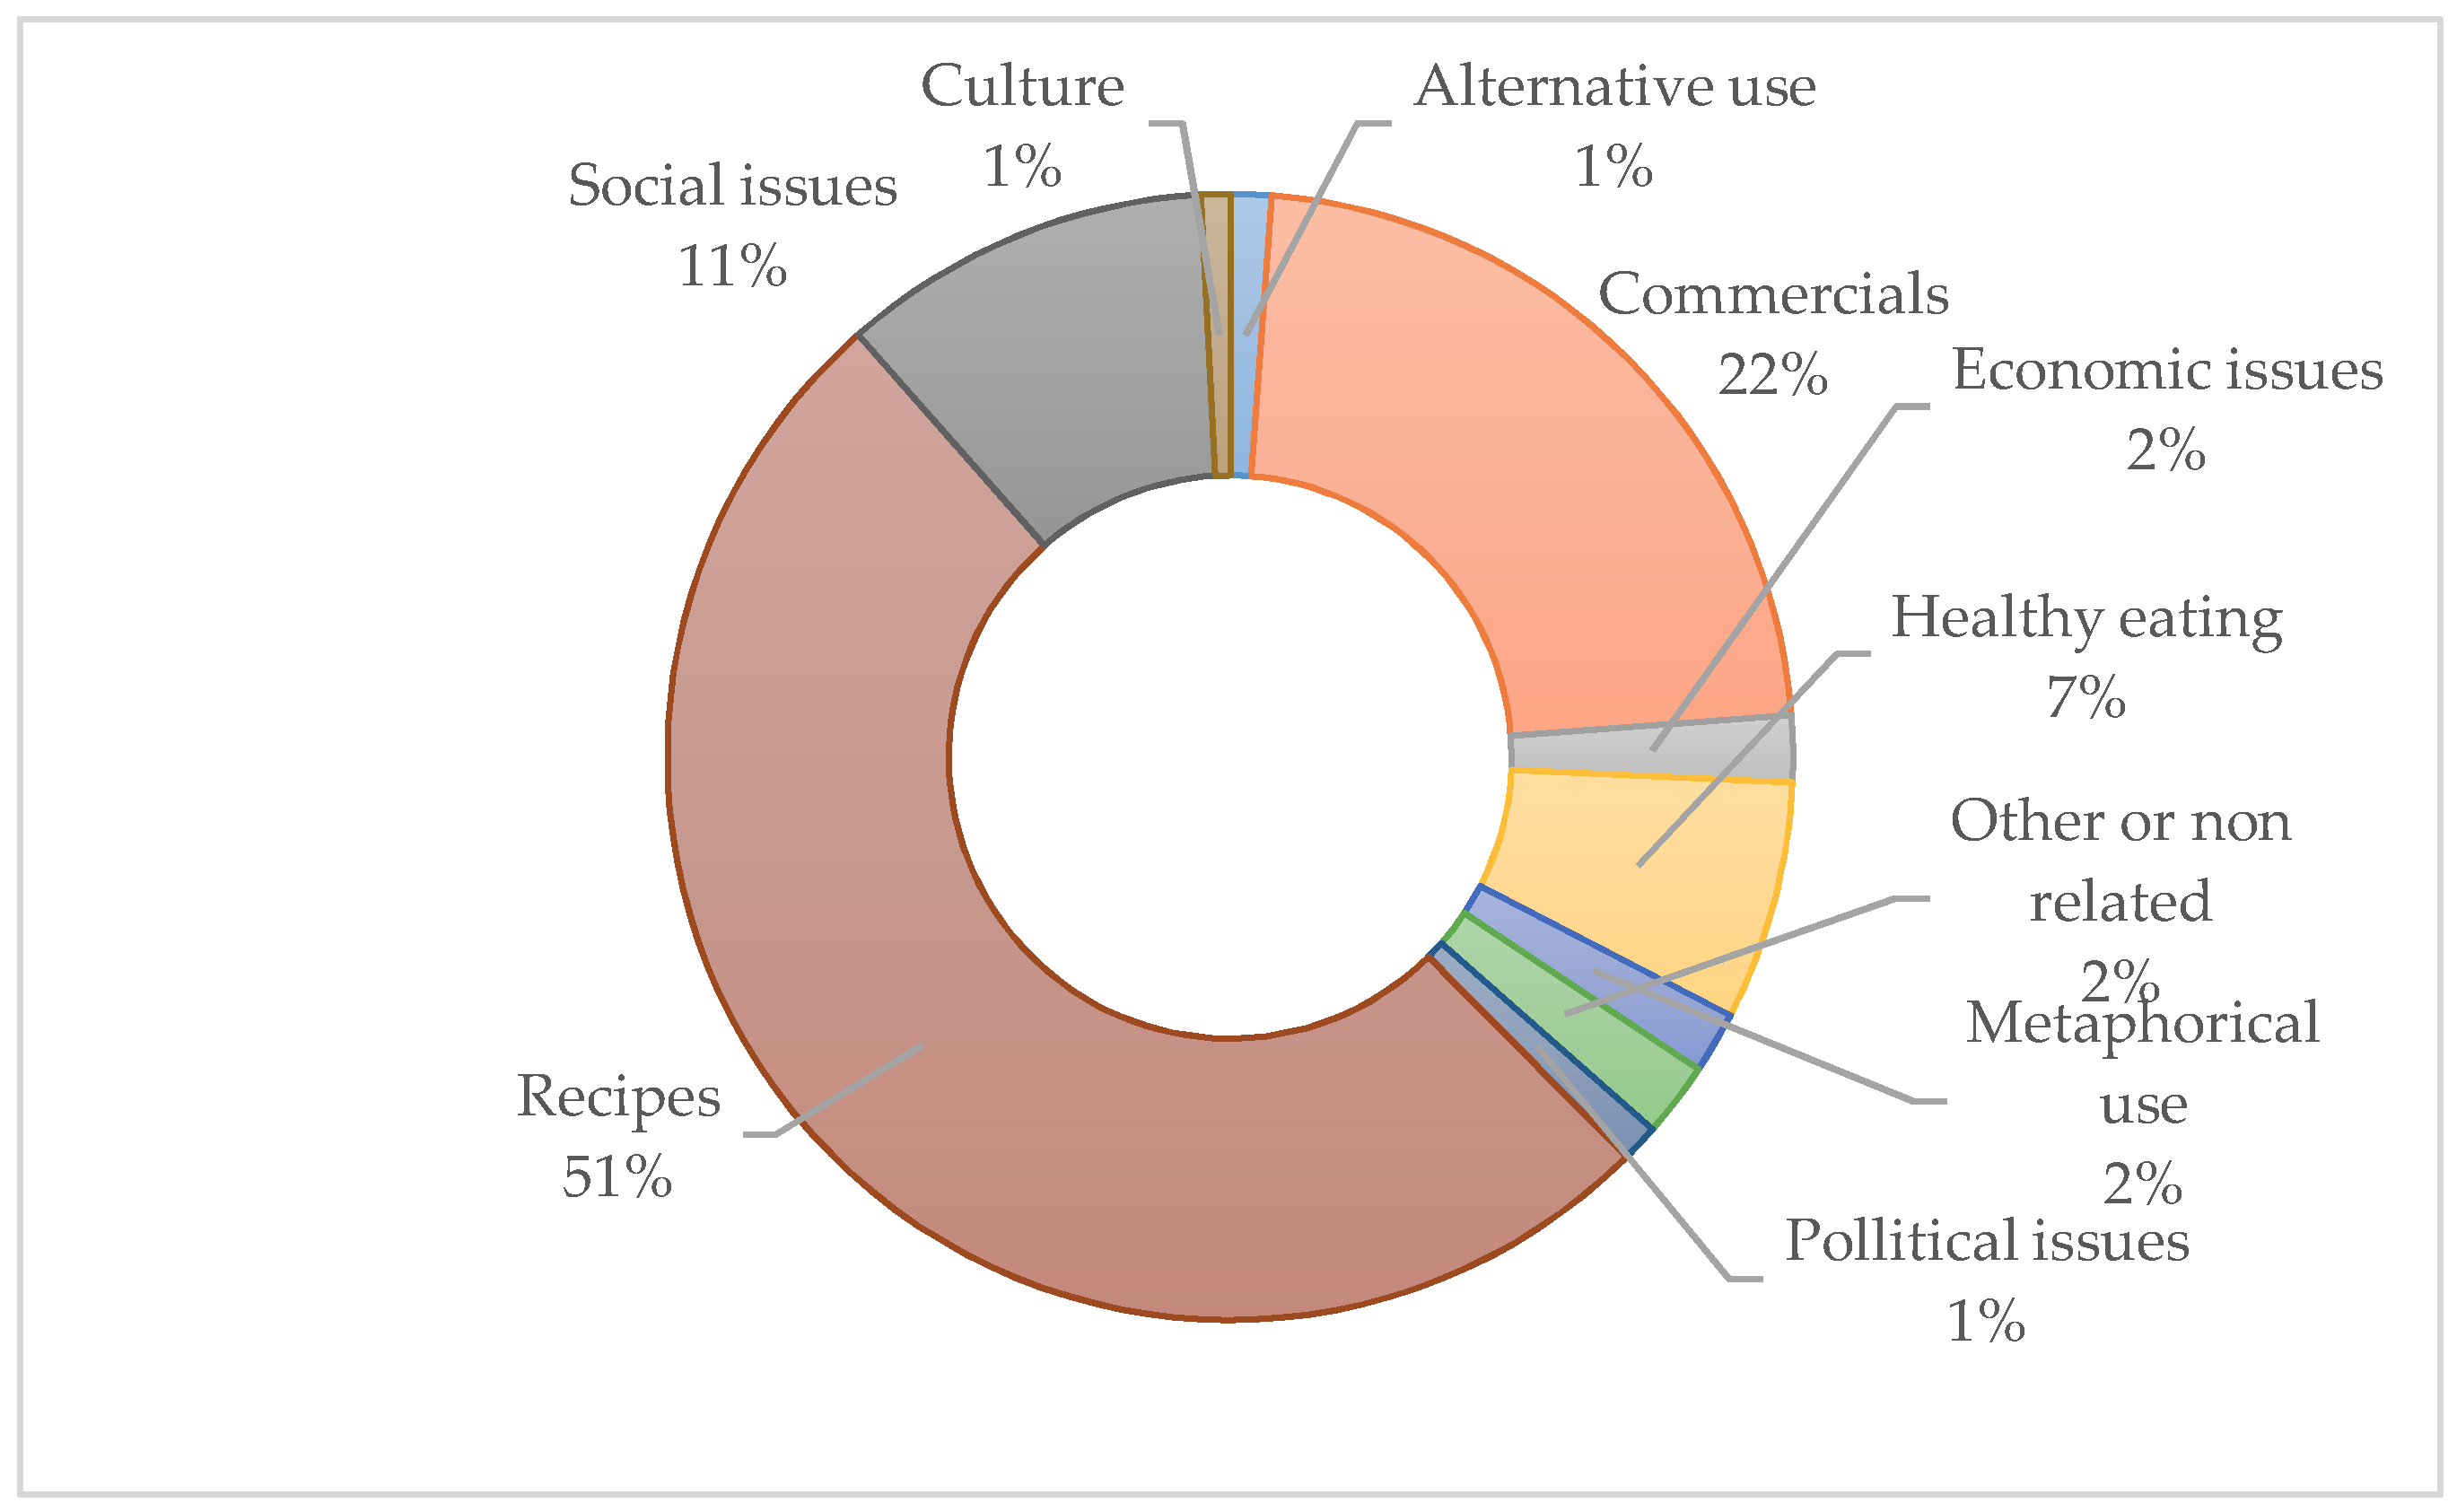
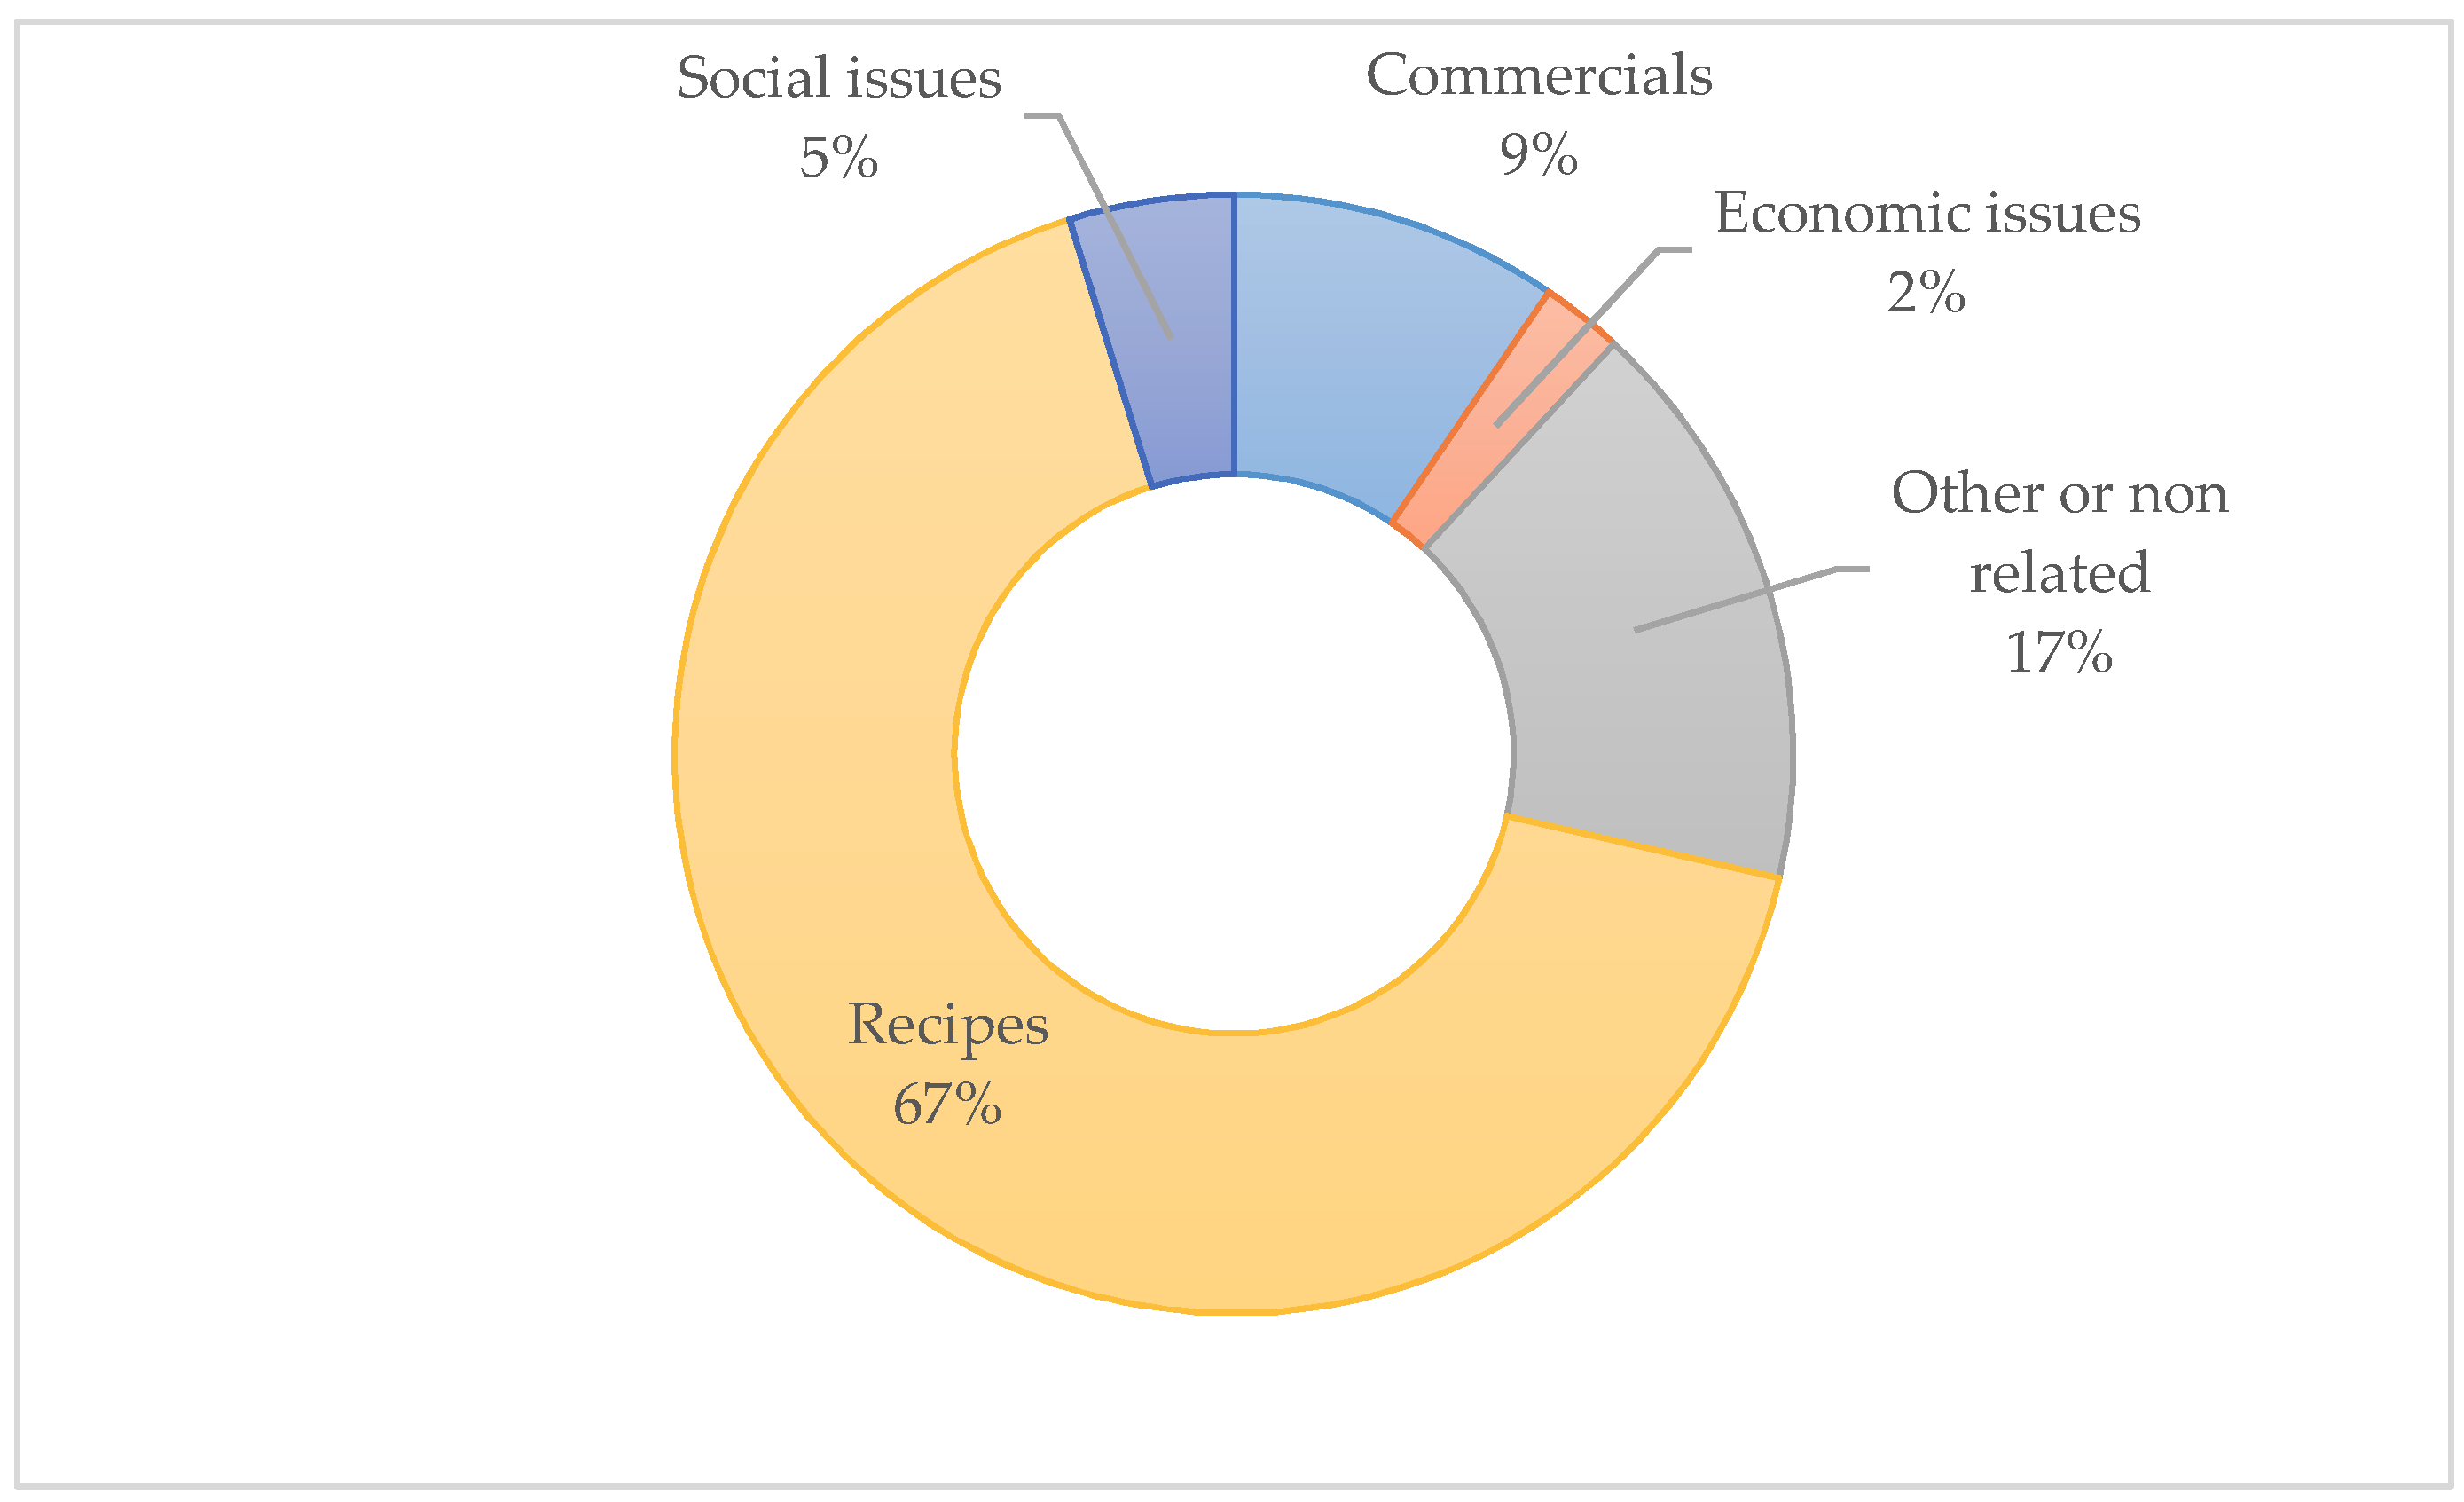
4.1. Engagement with Media Posts Regarding Bakery Products

The importance of the qualitative analysis does not reside in offering precise or quantifiable results on a topic, but rather the possibility of pointing out some important changes in consumer behavior [68], especially in sensitive periods such as the COVID-19 pandemic period [69].
There was a considerable difference between the results of the content retrieved with the search of “bakery products OR bread” and only “bakery products,” as expected, because bread is a basic food product in Romania. According to the National Institute of Statistics [9] the average purchase of bread rose to around 8 kg per month, whereas other wheat products such as flour or pasta remained below 0.9 and 0.4 kg, respectively, per month.
Therefore, in Figure 1 and Figure 2 the registered engagement with media posts on the bakery product topic and the total number of articles posted are presented, respectively.
Considering the total number of articles retrieved by the software, bread itself gathered most of the interest from the online post readers (95%).
It is important to notice that in Figure 1 the number of posted articles increased after the rise in user engagement. Overlapping with the increasing news on a possible worldwide spread of an unknown virus (COVID-19) in the first two months of the year and on recommendations for avoiding crowds and social distancing [70], the interest in posts regarding bread increased significantly. In March 2020, the number of posts regarding bread was the highest in the analyzed period, whereas engagement began to decrease.
Remarkably, both the number of posts and the user engagement followed a similar evolution after March 2020, and even more, they followed the same evolution as the number of new registered infections in Romania and the intensified restriction periods [71]. Therefore, after the initial scare before the lockdown and its first days, the user interest in this type of article diminished considerably. During the summer period, when the restrictions were reduced to a minimum, user engagement was the lowest, only increasing in November along with the second wave of infections and the regional lockdowns and dropping again before Christmas when the interest of the users was probably directed in other ways.
What differs significantly, besides the number of articles posted only on bakery products, is the fact that bread is a perishable product [72], whereas flour or pasta have longer expiry periods and can be stored for a long time. The high interest registered in articles on bakery products in March 2020 coincided with the first period of lockdown, when the information on the virus was still limited and the advice was to stay at home as much as possible [71], so people tried to make provisions of non-perishable products. Along with the new information and the reduction of restrictions to visit stores, the interest in these products became close to nothing and remained at that stage for the rest of the analyzed period.
Considering that Facebook is the preferred social network in Romania [73], this network registered the highest user engagement for both the searched categories, with 99% of all engagement. Regarding the content type, the bread-related articles were both videos (46.5%) and diversified content (54.5%) when bread articles were involved, whereas for bakery products, there was only diversified content (text/pictures/links). Considering the lengths of the articles found on “bakery products OR bread,” the preferred length was between 1000 and 2000 words, whereas the preferred length of the articles found on “bakery products” was fewer than 1000 words. Another interesting feature that provides insight on user interaction with a specific topic on Facebook was the user reaction, expressed through different emoticons. For “bakery products OR bread” the main reaction registered was “angry” (32%), whereas for “bakery products” it was “love” (58%). Since there was a considerable difference in preference for these article posts, the main themes of these articles were coded and are further presented in Figure 3 and Figure 4.
Considering the main topics of the articles retrieved for “bakery products OR bread” on web-based platforms in the analyzed period, we saw that more than half of them included some kind of recipe for bread or similar dough that can be made at home. This result is particularly important in the pandemic context, when people spent more time at home and started to cook more, either due to passion or fear of possible infection [74]. The second category of relative importance in the analyzed content was that of commercials, including both bakery products that were promoted online or kitchen tools and appliances, as a market response to the increased interest in baking.
An interesting result was revealed by the social issues category, which included topics on donation requests or social cases of extreme poverty, with the connection to bread being ensured by its standard as a cheap product that everyone should be able to afford. Therefore, articles in this category often used phrases such as “they could not afford a piece of bread” or “help with a piece of bread,” offering a glimpse into the level of poverty felt by the lower income categories of Romania. The economic category included articles on the price of bakery products—especially bread—the production capacity for this basic product, and the emerging business generated by the pandemic situation.
Healthy eating was another important category, with the content of these articles including healthy recipes, advice, or warnings from different kinds of experts on what choice of food is healthier or how toxic some choices of bread are. There was a particular category within this one regarding advice given to parents on the proper choice of food they should give to their children, which was in line with previous studies [46,48].
Categories with a lower preponderance in the analyzed content were metaphorical uses (including jokes or sayings, generally related to poverty); alternative uses for bread (as in fishing, gardening, or even home remedies); political issues—a category that is not exactly related to bread or bakery products, but is related to the Latin dictum panem et circenses, or “bread and circus,” as a subtle critique brought to the political scandals during this period [75]; and culture, including songs, traditions, or personal experiences related to bread.
Although the number of articles retrieved by the search of “bakery products” was significantly lower than for the previous search, the themes extracted by coding the content of these articles were similar to the themes of the larger content but had a lower degree of diversity. Even more, several articles were found in both contents, most of them relating to recipes for baking bread.
The hypothesis regarding an increased interest of consumers in bakery products, and especially bread, during the first months of the ongoing COVID-19 pandemic was confirmed. Exceeding the hypothesis, the general interest, considering the results, was directed at home baking recipes, and therefore was directly influenced by the home lockdown restrictions that were instated in 2020.
By analyzing the content generated by Buzzsumo [50] for the two key phrases searched, the main problems in Romanian society as they were portrayed on social media were determined in relation to this basic category of food product. The results are consistent with previous studies, offering a perspective on the health impact of bread [26]. The debate goes in multiple directions, such as presenting healthier bread options such as traditional or artisanal [45], the benefits of eating bread instead of other products [48], and warnings related to the dangers of hidden components of industrially produced bakery products [47,49]. The socioeconomic problems in Romanian society were also depicted in the media posts through the metaphors, the social cases presented, and the critiques of political activity, which mainly reflected the worries of not affording basic food products, which is therefore in line with previous studies on the influencing factors of food consumption [36,37,44]. It is important to note that not only does the media influence readers through its content, but social media content is also an image of the society it operates in [11,12,15]. The complexity of the bread-related topics, including considerable references to profound political and social issues, may be an explanation for the most encountered user reaction to these articles, that of anger.

4.2. Influencing Factors of Bakery Product Consumption

The significance level for the chi-squared test was first used to determine the preference for different types of bakery products, considering age, income, and gender as independent variables. The results, presented in Table 1, showed considerable differences between products, but also between variables. Gender showed no significant influence on any of the products presented to the respondents, whereas the consumption of bread with different additions (e.g., potato flakes, olives) was not influenced by any of the considered variables.
Age and income determined highly significant levels of influence for white-flour bread and bagels. Significant levels of influence were determined by age categories for black-flour bread and diet bread, by income for diet bread, and only by income for whole wheat bread. Considering the consumption preference for white bread by age categories, there was a higher preference registered for younger respondents, with 44.44% of those younger than 20 years old preferring to consume it “very much,” and the preference for this product decreasing with each older category, with those over 50 years old preferring to consume it “little.” Considering the income categories, those with lower incomes preferred to consume white bread in a considerably higher percentage than those with a higher income, who preferred it “little.” For the black-flour bread, all age categories preferred to consume it “little,” yet for the categories older than 40 years old, the second percentage was in the “much” and “very much” options, whereas for the younger categories the second percentages went towards the least preferred options. The differences in income categories registered for the preference of whole wheat bread showed an increasing preference along with the level of income increasing. Diet bread presented a particular case. Although the preference for consuming it was significantly influenced both by age and income, the preference declared by the majority of the consumers in all age and income groups showed they did not like to consume it at all. For bagels, the youngest category of consumers (less than 20 years old) preferred to consume them “much,” whereas the other categories preferred to consume them “little” or “very little.” Considering the income categories, there was a higher preference for the RON 2001 to 3000 and RON 4001 to 5000 categories than for all the others. For other bakery products, the youngest category had a higher preference for other types of bakery products than the older categories. When considering the income categories, all of them had other preferences in the “little” percentage.
Considering the real consumption of bakery products, as appreciated by the respondents, significant levels of influence were registered by the age, income, residence, and gender variables. The differences registered by age group, residence group, and income group are presented in Table 2.
There were some differences within the groups of the variables that influenced consumption. Regarding the residence influence, as claimed in the third hypothesis, the rural respondents had a higher consumption, with 42% considering they consumed “much” from this product category, whereas 44% of urban respondents considered they consumed little of this product category. For the influence of income, the categories of less than RON 2000 and RON 4001 to 5000 considered that they consumed “much” from the bakery products category, whereas all others considered their consumption to be “little.” However, by considering the mean of the responses, the categories below RON 5000 had a higher consumption than those above this level. Therefore, the second hypothesis may be considered confirmed, with the results being in line with similar studies [37] that determined a higher importance of economic aspects than of cultural aspects on food consumption.
Considering age, although all groups considered their consumption of bakery products to be preponderantly “little,” there was a difference given by the second percentage, which determined a higher consumption for categories younger than 40 years old than for those above this level. There was a significant difference between male and female respondents, considering gender as an influencing variable. Females preponderantly considered their consumption of bakery products to be “little,” whereas males had equal shares of the “much” and “little” categories. However, 60% of the female respondents considered their consumption to be little and very little, and only 51% of the male respondents considered theirs to be the same. The fourth hypothesis was confirmed in what concerns gender influence on the consumption of bakery products but not confirmed in what concerns the age influence. Younger respondents had a higher overall consumption that older categories in this study. The results are in line with Bruwer et al. [38] regarding gender differences, but do not follow the same pattern for the age differences. In addition, the results of Sánchez-García et al. [23] regarding the fact that female consumers are inclined to reduce the consumption of certain food products, in this case bread, are in line with our findings. Furthermore, a population-representative study might have different results.
Considering the factors that might have an influence on the purchasing decision for this category of products, only few proved to have a significant probability for the studied sample. For example, there was no significant influence of age on the choice of quality products or special offers, but there was a mild correlation with gender. Furthermore, the differences between groups of the same independent variable where a significant influence was determined using the chi-squared test are presented. In Table 3, the differences of choice considering the ways of production for bakery products and the price for these products by age groups can be observed.
The methods of production for bakery products refers to the industrial or artisanal way. Considering the health and environmental concerns that were studied previously [19,35] the authors expected consumers to give this item particular importance. The results show that this supposition was true, with all age groups declaring that they considered the methods of production as important or very important in their purchasing decision, with the highest importance being registered for the 40 to 49-year-old group. However, given the fact that these results are not supported by similar ones considering different income groups, this might suggest that in reality, consumers consider these factors only in a declarative way, being primarily guided by their income availability [3]. The price of the products was a significant factor for all age groups, with the majority considering it important (“high importance”). No relevant differences between age groups could be extracted. Therefore, the second hypothesis of this study was not confirmed, as a differentiation between most important factors by age group could not be made for this sample.
Considering the respondents ’segmentation of price preference by levels of income, the results are presented in Table 4.
The differences between price preferences influenced by age groups was repeated. Considering the different income groups, most of the respondents considered this issue to be of high importance and very high importance in their choice of bakery products. However, the percentage of respondents who considered it to be of little importance was higher for those with higher incomes than for those with lower incomes. Therefore, a differentiation by income groups is more likely to be found also in representative samples.
The correlation between respondents’ gender and their preference for different purchasing criteria of bakery products is presented in Table 5.
The quality of the bakery products and special offers had significant correlations with the gender categories. Both female and male respondents considered quality to be a factor of high importance when purchasing bakery products. Furthermore, females had a higher percentage of responses in this category. Considering special offers for these products, they were of little importance for most of the respondents in both gender categories, but one-fifth of them considered them of high importance. More males than females took into consideration special offers. The different patterns between male and female respondents and a higher preference for quality for the second category are, again, in line with previous results [35,39].
Additional influences were tested, and some results are important for this study and for further developing of such research. For example, there was a very significant influence, with a probability of about 99.9%, of age on the frequency of purchasing bakery products. The age group below 20 years old, with a percentage of over 37%, answered that they bought bakery products daily and with a weight of 31.4% two to three times a week. From the age category of 20–29 years old, a majority share of 36% bought two to three times a week, and 34.5% bought daily. From the other age categories, the respondents purchased mainly two to three times a week with weights between 40.2% and 48.8%, and from the same categories with weights between 23.4–31.5% they bought bakery products weekly. Age also influences, with a high probability of 99%, the purchasing location for bakery products. Most of the respondents preferred supermarkets or hypermarkets, but the preference decreased for the categories above 30 years old, with the smallest preference in the category above 50 years old. Proximity, local stores, and local bakeries were the least preferred in this type of purchase, with most of the respondents in all age categories mentioning that they rarely purchased from them.
Considering the declared food waste for bakery products of the respondents in this study, the results by age, income, and gender can be observed in Table 6. The chi-squared test was not valid in this case, as some categories had no answers, so the table only presents the percentages of respondents within each category.
Regarding age, all groups declared that they wasted less than 10% of purchased bakery products. However, there was a higher percentage who wasted very little in the categories above 40 years old than in the younger ones. Regarding income categories, the highest percentage of wasted bakery products was found for the low to medium income categories, whereas the respondents with the lowest and middle income had the smallest amount of waste for the considered products. In addition, the category above RON 6000 per month had the highest percentage, in the 50% waste category. Considering gender, male respondents declared that they wasted less than female respondents. The results may be also correlated with the higher consumption of bakery products found in the male category.
Considering these results, the fifth hypothesis was confirmed regarding the age criteria, due to the higher percentages of respondents in categories above 40 years old who declared the lowest level of waste for bakery products. The second part of this hypothesis was, however, not confirmed. The results do not show a lower level of waste for low income respondents, but rather for those with middle incomes.

5. Conclusions, Implications, and Limitations

The present study, even if only empirical, offers significant results for the scientific domain, and also for the policymakers who can use such results to construct specific measures to help the population cope with a crisis period such as the COVID-19 pandemic.
By following the qualitative and quantitative results, the high importance given to bakery products, and especially bread, by the respondents was highlighted. The qualitative analysis aimed at determining the importance given in social media articles for the Romanian region showed significant similarities between the interests of social media users in Romania and the periods of lockdown in this country. This is particularly important since bakery products are a basic food category, so this similarity may highlight a significant concern of social media users regarding not being able to suffice with basic food products during such periods. Therefore, providing specific measures to ensure the supply of basic food products should be considered a priority by policymakers in times of crisis.
Even more, the frequent use of bread in Romanian expressions is a reflection of the fear of poverty. Bread is used as a common part of Romanian songs or metaphors, and also to bring important critiques to the local or national authorities, as was seen in the qualitative analysis. These results should be of interest to policymakers since they paint a raw image of Romanians’ fears, problems, and general state of mind.
The quantitative analysis added to the qualitative results and supported the previous considerations in terms of the level of poverty through the interpretation of the respondents’ answers. The most consumed bakery products were the cheapest ones, specifically, white flour bread and bagels, whereas those with more nutritional value were preferred along with an increase in income.
While the older respondents estimated their consumption as being slightly higher than younger ones, a slight difference in income was also determined. Those with incomes above RON 5000 declared a lower consumption for this product category. More important differences were determined between rural and urban respondents, as well as between female and male respondents. The rural respondents declared a higher consumption for bakery products than urban respondents, as did male respondents compared to female respondents.
Price had the highest importance of the analyzed factors, with a 99.9% probability of influencing the purchasing decision in this category of products in the case of our respondents, yet its importance decreased with increase in income. Quality seemed to be more important as a decision factor to female respondents, whereas special offers were more important to male respondents. The frequency of purchasing bakery products was significantly influenced by age, with the younger respondents purchasing more frequently than the older categories of respondents. In addition, supermarkets or hypermarkets were preferred to local stores by all age categories.
Considering waste of bakery products, the respondents to our study had a very small declared percentage of wasted products, with the high consumption for this category of products probably leaving little to waste, rather than it being due to environmental considerations.
Overall, the study has strong implications considering the mixed methods approach that points out an important need to consider the food behavior of Romanians and the fears and uncertainties of consumers related to it as a priority in policymaking. The choice of a such a basic product as a topic of research highlighted significant remarks on the current consumption pattern of Romanian consumers, pointing to a high consumption of basic food products, and even the lack of this basic product (white bread), through the qualitative analysis, which was supported by the results of a quantitative analysis on a sample of respondents. The fact that price was the prime influencing factor of the purchasing decision for a basic food product should be seriously considered in tailoring new food policies, especially considering the sustainable development targets for the year 2030 [76].
The consumer preferences determined in this study should also be of interest for bakery producers in designing products and communication campaigns that consider regional consumers’ characteristics.
As further avenues of research, the authors consider it a good idea to expand the quantitative research by using a representative sample of the Romanian population and using a longitudinal study to determine the quantitative modifications of the Romanian consumers in regard to bakery products before, during, and after a crisis period such as the COVID-19 pandemic, as well as for other basic food products.
Limitations: Some limitations of this study may come from the research methods chosen, con-sidering other sources of information on consumer interests (such as printed media or scientific information) for the qualitative analysis may have different or more detailed results. The choice of only one country for this analysis may also lead to small-scale results. Searching for other food products within the social media results may also contribute to the development of the body of literature. Even more, the fact that this is an empirical study means that we cannot expand the results to the entire population, but only offer hypotheses for a representative sample of the population.

Author Contributions

The authors worked together on this research, but, per the structure, conceptualization, G.-R.L., M.C.D., and D.M.I.; methodology, software validation, and resources, G.-R.L., M.C.D., and M.S.; formal analysis, G.-R.L., M.C.D., and C.-E.D.; writing—original draft preparation and writing—review and editing, M.C.D., M.S., and M.M. All authors have read and agreed to the published version of the manuscript.

Funding

This research received no external funding.

Institutional Review Board Statement

The study did not require ethical approval.

Informed Consent Statement

Not applicable.

Data Availability Statement

The data presented in this study are available on request from the corresponding author. The data are not publicly available due to privacy.

Acknowledgments

This paper is the result of the ADER 24.1.1 project: “Research on development of studies and analyzes, for the substantiation of public decisions and policies, for the marketing of agri-food products in order to ensure the food security and safety for the population”.

Conflicts of Interest

The authors declare no conflict of interest.

References

  1. Awika, J.M. Major cereal grains production and use around the world. In Advances in Cereal Science: Implications to Food Processing and Health Promotion; ACS Symposium Series; American Chemical Society: Washington, DC, USA, 2011; Volume 1089, Chapter 1; pp. 1–13. [Google Scholar] [CrossRef]
  2. Shewry, P.R.; Hey, S.J. The contribution of wheat to human diet and health. Food Energy Secur. 2015, 4, 178–202. [Google Scholar] [CrossRef]
  3. Yiridoe, E.K.; Bonti-Ankomah, S.; Martin, R.C. Comparison of consumer perceptions and preference toward organic versus conventionally produced foods: A review and update of the literature. Renew. Agric. Food Syst. 2005, 193–205. [Google Scholar] [CrossRef]
  4. Harari, Y.N. Sapiens: A Brief History of Humankind. In History Biggest Fraud; Random House: New York, NY, USA, 2014. [Google Scholar]
  5. Shan, L.; Molberg, Ø.; Parrot, I.; Hausch, F.; Filiz, F.; Gray, G.M.; Sollid, L.M.; Khosla, C. Structural basis for gluten intolerance in celiac sprue. Science 2002, 297, 2275–2279. [Google Scholar] [CrossRef] [Green Version]
  6. Newby, P.K.; Maras, J.; Bakun, P.; Muller, D.; Ferrucci, L.; Tucker, K.L. Intake of whole grains, refined grains, and cereal fiber measured with 7-d diet records and associations with risk factors for chronic disease. Am. J. Clin. Nutr. 2007, 86, 1745–1753. [Google Scholar] [CrossRef]
  7. Food and Agriculture Organization (FAO). New Food Balance. 2021. Available online: http://www.fao.org/faostat/en/#data/FBS (accessed on 20 January 2021).
  8. Kostov, P.; Lingard, J. Subsistence farming in transitional economies: Lessons from Bulgaria. J. Rural Stud. 2002, 18, 83–94. [Google Scholar] [CrossRef]
  9. National Statistics Institute (NIS). Average Monthly Spending per Household. 2021. Available online: http://statistici.insse.ro:8077/tempo-online/#/pages/tables/insse-table (accessed on 21 January 2021).
  10. Eurostat. How Much are Households Spending on Food? 2019. Available online: https://ec.europa.eu/eurostat/web/products-eurostat-news/-/DDN-20191209-1?inheritRedirect=true&redirect=%2Feurostat%2Fweb%2Fmain%2Fhome (accessed on 21 January 2021).
  11. Siddiqui, S.; Singh, T. Social media its impact with positive and negative aspects. Int. J. Comput. Appl. Technol. Res. 2016, 5, 71–75. [Google Scholar] [CrossRef]
  12. Akram, W.; Kumar, R. A study on positive and negative effects of social media on society. Int. J. Comput. Sci. Eng. 2017, 5, 347–354. [Google Scholar] [CrossRef]
  13. Corbett, J.B.; Durfee, J.L. Testing public (un) certainty of science: Media representations of global warming. Sci. Commun. 2004, 26, 129–151. [Google Scholar] [CrossRef]
  14. Filieri, R.; Alguezaui, S.; McLeay, F. Why do travelers trust TripAdvisor? Antecedents of trust towards consumer-generated media and its influence on recommendation adoption and word of mouth. Tour. Manag. 2015, 51, 174–185. [Google Scholar] [CrossRef] [Green Version]
  15. Liu, Y.; Lopez, R.A. The impact of social media conversations on consumer brand choices. Mark. Lett. 2016, 27, 1–13. [Google Scholar] [CrossRef]
  16. Igrejas, G.; Branlard, G. The importance of wheat. In Wheat Quality for Improving Processing and Human Health; Springer: Cham, Switzerland, 2020; pp. 1–7. [Google Scholar]
  17. Tekindal, M.A.; BAYRAK, H.; ÖZKAYA, B.; Yasemin, G.E.N.Ç. Box-Behnken Experimental Design in Factorial Experiments: The Importance of Bread for Nutrition and Health Running Head. Turk. J. Field Crop. 2012, 17, 115–123. [Google Scholar]
  18. Burton, P.M.; Monro, J.A.; Alvarez, L.; Gallagher, E. Glycemic impact and health: New horizons in white bread formulations. Crit. Rev. Food Sci. Nutr. 2011, 51, 965–982. [Google Scholar] [CrossRef]
  19. De Boni, A.; Pasqualone, A.; Roma, R.; Acciani, C. Traditions, health and environment as bread purchase drivers: A choice experiment on high-quality artisanal Italian bread. J. Clean. Prod. 2019, 221, 249–260. [Google Scholar] [CrossRef]
  20. Kiesel, K.; McCluskey, J.; Villas-Boas, S. Nutritional Labeling and Consumer Choices. Annu. Rev. Resour. Econ. 2011, 3, 141–158. [Google Scholar] [CrossRef] [Green Version]
  21. Caswell, J.A.; Mojduszka, E.M. Using informational labeling to influence the market for quality in food products. Am. J. Agrie. Econ. 1996, 78, 1248–1253. [Google Scholar] [CrossRef] [Green Version]
  22. Montandon, A.C.; Colli, C. Effective nutrition labels for fast food consumers. Br. Food J. 2016, 118, 2534–2549. [Google Scholar] [CrossRef]
  23. Sánchez-García, I.; Rodríguez-Insuasti, H.; Martí-Parreño, J.; Sánchez-Mena, A. Nutritional traffic light and self-regulatory consumption: The role of emotions. Br. Food J. 2019, 121, 183–198. [Google Scholar] [CrossRef]
  24. Fichera, E.; von Hinke, S. The response to nutritional labels: Evidence from a quasi-experiment. J. Health Econ. 2020, 72, 102326. [Google Scholar] [CrossRef]
  25. Sunstein, C.R. Are food labels good? Food Policy 2020, 99, 101984. [Google Scholar] [CrossRef]
  26. Worsley, A. The behavioural and demographic contexts of white bread consumption. Br. Food J. 2003, 105, 695–699. [Google Scholar] [CrossRef] [Green Version]
  27. Gellynck, X.; Kühne, B.; Van Bockstaele, F.; Van de Walle, D.; Dewettinck, K. Consumer perception of bread quality. Appetite 2009, 53, 16–23. [Google Scholar] [CrossRef] [Green Version]
  28. Sajdakowska, M.; Gębski, J.; Żakowska-Biemans, S.; Jeżewska-Zychowicz, M. Willingness to eat bread with health benefits: Habits, taste and health in bread choice. Public Health 2019, 167, 78–87. [Google Scholar] [CrossRef]
  29. Dragon, P.; Albergaria, H. (Eds.) Political Argumentary for the Economy of Proximity Development (ANATOLE Project Report). Retrieved from Association of the Agricultural Chambers of the Atlantic Arc Website. 2012. Available online: http://www.ac3a.fr/AC3A_en.php (accessed on 5 February 2021).
  30. Galanakis, C.M. The food systems in the era of the coronavirus (COVID-19) pandemic crisis. Foods 2020, 9, 523. [Google Scholar] [CrossRef]
  31. Fernández-Ferrín, P.; Calvo-Turrientes, A.; Bande, B.; Artaraz-Miñón, M.; Galán-Ladero, M.M. The valuation and purchase of food products that combine local, regional and traditional features: The influence of consumer ethnocentrism. Food Qual. Prefer. 2018, 64, 138–147. [Google Scholar] [CrossRef]
  32. Soukand, R.; Stryamets, N.; Fontefrancesco, M.F.; Pieroni, A. The importance of tolerating interstices: Babushka markets in Ukraine and Eastern Europe and their role in maintaining local food knowledge and diversity. Heliyon 2020, 6, e03222. [Google Scholar] [CrossRef] [PubMed] [Green Version]
  33. Paustian, M.; Reinecke, F.-E.; Theuvsen, L. Consumer preferences for regional meat products. Br. Food J. 2016, 118, 2761–2780. [Google Scholar] [CrossRef]
  34. Nacef, M.; Lelièvre-Desmas, M.; Symoneaux, R.; Jombart, L.; Flahaut, C.; Chollet, S. Consumers’ expectation and liking for cheese: Can familiarity effects resulting from regional differences be highlighted within a country? Food Qual. Prefer. 2019, 72, 188–197. [Google Scholar] [CrossRef]
  35. Chen, X.; Gao, Z.; McFadden, B.R. Reveal preference reversal in consumer preference for sustainable food products. Food Qual. Prefer. 2020, 79, 103754. [Google Scholar] [CrossRef]
  36. Cvijanović, D.; Ignjatijević, S.; Vapa Tankosić, J.; Cvijanović, V. Do Local Food Products Contribute to Sustainable Economic Development? Sustainability 2020, 12, 2847. [Google Scholar] [CrossRef] [Green Version]
  37. Frank, B.; Abulaiti, G.; Enkawa, T. Regional differences in consumer preference structures within China. J. Retail. Consum. Serv. 2014, 21, 203–210. [Google Scholar] [CrossRef]
  38. Bruwer, J.; Saliba, A.; Miller, B. Consumer behaviour and sensory preference differences: Implications for wine product marketing. J. Consum. Mark. 2011, 28, 5–18. [Google Scholar] [CrossRef] [Green Version]
  39. Teuber, R.; Dolgopolova, I.; Nordström, J. Some like it organic, some like it purple and some like it ancient: Consumer preferences and WTP for value-added attributes in whole grain bread. Food Qual. Prefer. 2016, 52, 244–254. [Google Scholar] [CrossRef]
  40. Meyerding, S.G.; Kürzdörfer, A.; Gassler, B. Consumer preferences for superfood ingredients—The case of bread in Germany. Sustainability 2018, 10, 4667. [Google Scholar] [CrossRef] [Green Version]
  41. Jeswani, H.K.; Burkinshaw, R.; Azapagic, A. Environmental sustainability issues in the food-energy-water nexus: Breakfast cereals and snacks. Sustain. Prod. Consum. 2015, 2, 17–28. [Google Scholar] [CrossRef]
  42. Scardigno, A. New solutions to reduce water and energy consumption in crop production: A water–energy–food nexus perspective. Curr. Opin. Environ. Sci. Health 2020, 13, 11–15. [Google Scholar] [CrossRef]
  43. Krishnan, R.; Agarwal, R.; Bajada, C.; Arshinder, K. Redesigning a food supply chain for environmental sustainability–An analysis of resource use and recovery. J. Clean. Prod. 2020, 242, 118374. [Google Scholar] [CrossRef]
  44. Aldaco, R.; Hoehn, D.; Laso, J.; Margallo, M.; Ruiz-Salmón, J.; Cristobal, J.; Kahhat, R.; Villanueva-Rey, P.; Bala, A.; Batlle-Bayer, L.; et al. Food waste management during the COVID-19 outbreak: A holistic climate, economic and nutritional approach. Sci. Total Environ. 2020, 742, 140524. [Google Scholar] [CrossRef]
  45. Meyers, C.; Abrams, K. Feeding the debate: A qualitative framing analysis of organic food news media coverage. J. Appl. Commun. 2010, 94, 22–37. [Google Scholar] [CrossRef] [Green Version]
  46. Henderson, J.; Coveney, J.; Ward, P.; Taylor, A. Governing childhood obesity: Framing regulation of fast food advertising in the Australian print media. Soc. Sci. Med. 2009, 69, 1402–1408. [Google Scholar] [CrossRef]
  47. Vicsek, L. Gene-fouled or gene-improved? Media framing of GM crops and food in Hungary. New Genet. Soc. 2013, 32, 54–77. [Google Scholar] [CrossRef] [Green Version]
  48. Stefanik-Sidener, K. Nature, nurture, or that fast food hamburger: Media framing of diabetes in the New York Times from 2000 to 2010. Health Commun. 2013, 28, 351–358. [Google Scholar] [CrossRef] [PubMed]
  49. Runge, K.K.; Chung, J.H.; Su, L.Y.F.; Brossard, D.; Scheufele, D.A. Pink slimed: Media framing of novel food technologies and risk related to ground beef and processed foods in the US. Meat Sci. 2018, 143, 242–251. [Google Scholar] [CrossRef] [PubMed]
  50. Buzzsumo. 2021. Available online: https://buzzsumo.com/ (accessed on 28 January 2021).
  51. Waszak, P.M.; Kasprzycka-Waszak, W.; Kubanek, A. The spread of medical fake news in social media–the pilot quantitative study. Health Policy Technol. 2018, 7, 115–118. [Google Scholar] [CrossRef]
  52. John, K. Journals on information literacy: Citation analysis and social impact metrics. Ser. Libr. 2019, 77, 23–37. [Google Scholar] [CrossRef]
  53. Massarani, L.; Leal, T.; Waltz, I. The debate on vaccines in social networks: An exploratory analysis of links with the heaviest traffic. Cad. De Saúde Pública 2020, 36, e00148319. [Google Scholar] [CrossRef]
  54. Reed, H.H.P. Framing of Immigrants and Refugees: A Content Analysis of Mainstream and Partisan News Coverage of Immigration. Ph.D. Dissertation, University of Missouri, Columbia, MO, USA, 2017. [Google Scholar]
  55. He, L.; Han, C.; Mukherjee, A.; Obradovic, Z.; Dragut, E. On the dynamics of user engagement in news comment media. Wiley Interdiscip. Rev. Data Min. Knowl. Discov. 2020, 10, e1342. [Google Scholar] [CrossRef]
  56. Vaughn, P.; Turner, C. Decoding via coding: Analyzing qualitative text data through thematic coding and survey methodologies. J. Libr. Adm. 2016, 56, 41–51. [Google Scholar] [CrossRef]
  57. Cappelli, L.; D’ascenzo, F.; Ruggieri, R.; Rossetti, F.; Scalingi, A. The attitude of consumers towards “Made in Italy” products. An empirical analysis among Italian customers. Manag. Mark. Chall. Knowl. Soc. 2019, 14, 31–47. [Google Scholar] [CrossRef] [Green Version]
  58. Coşkun, A.; Özbük, R.M.Y. What influences consumer food waste behavior in restaurants? An application of the extended theory of planned behavior. Waste Manag. 2020, 117, 170–178. [Google Scholar] [CrossRef]
  59. Marina, M.; Asma, A.; Jaafar, S.N.A.; Abdul Wahab, M.R.; Wan Zainal Shukri, W.H. Nutrition menu labelling in Terengganu: A cross-sectional study of knowledge, attitudes, perception and their relationship with healthy food choices. Food Res. 2020, 4, 1573–1581. [Google Scholar] [CrossRef]
  60. Everitt, B.S.; Skrondal, A. The Cambridge Dictionary of Statistics; Cambridge University Press: Cambridge, UK, 2010. [Google Scholar]
  61. Yamane, T. Statistics: An Introduction Analysis; Harper & Row: NewYork, NY, USA, 1973. [Google Scholar]
  62. Oluwafemi, I.; Oluwafemi, J.; Laseinde, T.O.; Awoyemi, B.O.; Babatunde, A. Datasheet showing the impact of work environment on productivity in higher education institutions. Data Brief 2019, 25, 104090. [Google Scholar] [CrossRef] [PubMed]
  63. Mishra, D.; Min, J. Analyzing the relationship between dependent and independent variables in marketing: A comparison of multiple regression with path analysis. Innov. Mark. 2010, 6, 2259524. [Google Scholar] [CrossRef] [Green Version]
  64. Herbst, K.; Becker, G.M.A.; Harper, L.; Bagley, D.; Nieuwhof-Leppink, A.J.; Kaefer, M.; Kalfa, N. Don’t be mean, be above average: Understanding data distribution and descriptive statistics. J. Pediatric Urol. 2020, 16, 712. [Google Scholar] [CrossRef] [PubMed]
  65. McHugh, M.L. The chi-square test of independence. Biochem. Med. 2013, 23, 143–149. [Google Scholar] [CrossRef] [PubMed] [Green Version]
  66. Paul, K.I.; Batinic, B. The need for work: Jahoda’s latent functions of employment in a representative sample of the German population. J. Organ. Behav. 2010, 31, 45–64. [Google Scholar] [CrossRef]
  67. National Bank of Romania. Exchange Rate. 2021. Available online: https://www.cursbnr.ro/ (accessed on 21 January 2021).
  68. Thøgersen, J. Country differences in sustainable consumption: The case of organic food. J. Macromarketing 2010, 30, 171–185. [Google Scholar] [CrossRef]
  69. Spanish Ministry of Agriculture, Fisheries and Food (MAPA). Press Releases, March/April, Madrid, Spain. Available online: https://www.mapa.gob.es/es/prensa/ultimas-noticias/los-hogares-espa%C3%B1oles-estabilizan-sus-compras-de-alimentos--/tcm:30-537374(2020) (accessed on 5 February 2021).
  70. Steffens, I. A hundred days into the coronavirus disease (COVID-19) pandemic. Eurosurveillance 2020, 25, 2000550. [Google Scholar] [CrossRef]
  71. Health Ministry of Romania. 2021. Available online: http://www.ms.ro/masuri-recomandate-in-vederea-reducerii-impactului-pandemiei-covid-19/ (accessed on 5 February 2021).
  72. Van Woensel, T.; Van Donselaar, K.; Broekmeulen, R.; Fransoo, J. Consumer responses to shelf out-of-stocks of perishable products. Int. J. Phys. Distrib. Logist. Manag. 2007, 37, 704–718. [Google Scholar] [CrossRef]
  73. Duffett, R.; Petroșanu, D.M.; Negricea, I.C.; Edu, T. Effect of YouTube marketing communication on converting brand liking into preference among millennials regarding brands in general and sustainable offers in particular. Evidence from South Africa and Romania. Sustainability 2019, 11, 604. [Google Scholar] [CrossRef] [Green Version]
  74. Lim, J.M.; Tun, Z.M.; Kumar, V.; Quaye, S.E.D.; Offeddu, V.; Cook, A.R.; Lwin, M.O.; Jiang, S.; Tam, C.C. Population anxiety and positive behaviour change during the COVID-19 epidemic: Cross-sectional surveys in Singapore, China and Italy. Influenza Other Respir. Viruses 2021, 15, 45–55. [Google Scholar] [CrossRef]
  75. De Angelis, A.; Vecchiato, A. Panem Et Circenses: The Persuasive Effect of Soft News in Berlusconi’s Italy. SSRN 2018, 3245572. [Google Scholar] [CrossRef]
  76. United Nations (UN). Sustainable Development Goals. 2015. Available online: https://sdgs.un.org/goals (accessed on 6 February 2021).
Figure 1. Number of articles and user engagement on bakery products or bread from January 2020 to December 2020. Source: authors’ analysis using Buzzsumo [50].
Sustainability 13 03411 g001
Figure 2. Number of articles and user engagement on bakery products from January 2020 to December 2020. Source: authors’ analysis using Buzzsumo [50].
Sustainability 13 03411 g002
Figure 3. Main topics in “bakery products OR bread” content from January 2020 to December 2020. Source: authors’ interpretation.
Sustainability 13 03411 g003
Figure 4. Main topics in the “bakery products” content from January 2020 to December 2020. Source: authors’ interpretation.
Sustainability 13 03411 g004
Table 1. Differences of bakery product consumption preference by age, income, and gender.
Significance LevelWhite-Flour BreadBlack-Flour BreadWhole Wheat BreadBread with AdditionsDiet BreadBagelsOther Bakery Products
Age>0.00001>0.05<0.1<0.1>0.05>0.00001>0.00001
Income>0.00001<0.1>0.1<0.1>0.05>0.00001>0.00001
Gender<0.1<0.1<0.1<0.1<0.1<0.1<0.1
Source: authors’ interpretation using SPSS.
Table 2. Differences for the consumed quantity of bakery products by age, residence, income, and gender.
Consumed Quantity (%) Very LittleLittleMuchVery Much
VariableGroups
Age
(significance level > 0.0001)
>20 y.o.1.8540.7438.8912.96
20–29 y.o.18.2736.2932.9910.66
30–39 y.o.16.7945.8031.306.11
40–49 y.o.23.9151.0922.831.09
>=50 y.o.29.7942.5523.404.26
Residence
(significance level > 0.0001)
Rural10.7129.1742.2616.07
Urban20.5544.1827.826.00
Income
(significance level > 0.0001)
RON <1000 10.3235.7142.868.73
RON 1.001–20009.5243.8132.3812.38
RON 2.001–300018.6339.7527.9512.42
RON 3001–400024.3548.7021.743.48
RON 4.001–500025.0032.1438.104.76
RON 5001–600016.6745.2428.579.52
RON >600025.8841.1825.884.71
Gender
(significance level > 0.1)
Female19.8941.2329.118.50
Male12.7338.7938.187.88
y.o. = years old; RON = National currency of Romania; The answers for “no quantity consumed” were not considered in this case to ensure the validity of the test. Source: authors’ interpretation with SPSS.
Table 3. Differences for production methods and price preferences by age.
Influencing FactorsAge GroupsVery Little Importance (%)Little Importance (%)High Importance (%)Very High Importance (%)
Variable
Methods of production (artisanal/industrial) (significance level > 0.05)>20 y.o.11.1127.7829.6331.48
20–29 y.o.15.2322.3435.7926.65
30–39 y.o.13.7423.6638.9323.66
40–49 y.o.8.7010.8734.7845.65
≥50 y.o.12.7717.0231.9138.30
Price (significance level > 0.001)>20 y.o.11.1133.3335.1920.37
20–29 y.o.6.6025.6345.1822.59
30–39 y.o.17.5627.4841.2213.74
40–49 y.o.16.3030.4335.8717.39
≥50 y.o.27.6617.0236.1719.15
y.o. = years old. Source: authors’ interpretation with SPSS.
Table 4. Differences for price preferences by income.
Influencing FactorsIncome GroupsVery Little Importance (%)Little Importance (%)High Importance (%)Very High Importance (%)
Variable
Price (significance level > 0.0001)RON <10007.1426.1941.2725.40
RON 1001–20006.6723.8144.7624.76
RON 2001–30002.4829.8148.4519.25
RON 3001–400011.3020.0050.4318.26
RON 4001–500026.1922.6232.1419.05
RON 5001–600016.6728.5733.3321.43
RON >600024.7136.4729.419.41
RON = National currency of Romania. Source: authors’ interpretation with SPSS.
Table 5. Differences for quality and special offer preference by gender.
Influencing FactorsGenderVery Little Importance (%)Little Importance (%)High Importance (%)Very High Importance (%)
Variable
Quality (significance level > 0.1)Male3.072.8914.4779.57
Female6.064.8518.7970.30
Special offers (significance level > 0.1)Male32.0132.1921.7014.10
Female41.8229.7020.008.48
Source: authors’ interpretation with SPSS.
Table 6. The level of bakery product waste by age, income, and gender.
<10%10%20%30%40%50%
Age<20 y.o.54.5512.7318.189.091.823.64
20–29 y.o.57.0015.7812.479.163.562.04
30–39 y.o.54.5518.1814.399.090.003.79
40–49 y.o.68.4811.969.788.701.090.00
>50 y.o.76.0917.390.004.350.002.17
IncomeRON <100064.5713.3910.248.661.571.57
RON 1001–200052.3814.2917.147.626.671.90
RON 2001–300056.5216.7714.296.213.113.11
RON 3001–400062.6113.0410.4313.040.870.00
RON 4001–500060.2418.079.648.430.003.61
RON 5001–600057.1421.4314.297.140.000.00
RON >600058.8216.478.2410.591.184.71
GenderFemale57.6915.0113.569.042.711.99
Male63.6417.587.277.880.613.03
y.o. = years old. Source: authors’ interpretation with SPSS.
Publisher’s Note: MDPI stays neutral with regard to jurisdictional claims in published maps and institutional affiliations.

