Article

Applying Social Learning to Climate Communications—Visualising ‘People Like Me’ in Air Pollution and Climate Change Data

1
Science Communication Unit, University of the West of England, Bristol BS16 1QY, UK
2
Air Quality Resource Management Centre, University of the West of England, Bristol BS16 1QY, UK
3
Transport & Mobility Leuven, 3010 Leuven, Belgium
4
Independent Researcher, SPA Sustainability, 2334 Leiden, The Netherlands
5
Cycling UK, Surrey GU2 9JX, UK
*
Author to whom correspondence should be addressed.
Sustainability 2021, 13(6), 3406; https://doi.org/10.3390/su13063406
Submission received: 29 January 2021 / Revised: 10 March 2021 / Accepted: 15 March 2021 / Published: 19 March 2021

Abstract

:
Technological approaches to carbon emission and air pollution data modelling consider where the issues are located and what is creating emissions. This paper argues that more focus should be paid to people—the drivers of vehicles or households burning fossil fuels (‘Who’) and the reasons for doing so at those times (‘Why’). We applied insights from social psychology (social identity theory and social cognitive theory) to better understand and communicate how people’s everyday activities are a cause of climate change and air pollution. A new method for citizen-focused source apportionment modelling and communication was developed in the ClairCity project and applied to travel data from Bristol, U.K. This approach enables understanding of the human dimension of vehicle use to improve policymaking, accounting for demographics (gender or age groups), socio-economic factors (income/car ownership) and motives for specific behaviours (e.g., commuting to work, leisure, shopping, etc.). Tailored communications for segmented in-groups were trialled, aiming to connect with group lived experiences and day-to-day behaviours. This citizen-centred approach aims to make groups more aware that ‘people like me’ create emissions, and equally, ‘people like me’ can take action to reduce emissions.

Graphical Abstract

1. Introduction

The European Commission considers climate change to be the biggest environmental concern for its citizens [1], with the same sources that burn fossil fuels also producing air pollution. Air pollution has been identified by the World Health Organisation as representing the biggest environmental risk to public health (as a major cause of respiratory and cardiovascular diseases), with an estimated seven million deaths globally and more than 80% of people living in urban areas exposed to air quality levels that exceed WHO guideline limits [2]. However, the impacts of air pollution are not equitable, with low- and middle-income countries suffering from the highest exposures and people from socially deprived communities and certain groups (such as children, elderly people, pregnant women and those with underlying health conditions) being more vulnerable [3,4]. Air pollution and carbon emissions are linked through common sources (transport, domestic heating, industry) and complex atmospheric interactions; therefore, any interventions must consider the ancillary benefits that can be achieved through co-management of both traditional pollutants and carbon emissions [5,6,7,8].
The focus of air quality management to date—and to a lesser extent carbon management—has been meeting legislative targets using a technocratic approach, known as the physical-technical-economic model (PTEM) [8]. The PTEM takes an engineering view of the world, i.e., focussing on the buildings, objects and devices that use energy or create emissions and omitting the people who create emissions [9]. This has led to a focus on hotspots of pollution—geographically defined areas where European limit values are exceeded (for nitrogen dioxide (NO2) or for particulate matter (PM)) [10,11]. However, in the case of transport, it only considers traffic as a problem at the location where the exceedances are occurring (i.e., in hotspots) and what type of vehicle is creating them [6,12]. This means that any action to deal with traffic often results in micro-scale shuffling and relocating of vehicles, seeing them as problematic only on a particular section of the road rather than recognising this as a local manifestation of symptoms as the result of the entire set of journeys that are being made [13,14,15]. Secondly, this focus on specific areas where acute symptoms are manifested fails to allow air quality management to align itself with other policy areas concerned with overall vehicle flows such as greenhouse gas/carbon emissions reduction [8] or public space/quality of life [16] in order to manage the problem systemically and holistically from a societal perspective [17].

1.1. Moving Away from ‘Where’ and ‘What’ to ‘Who’ and ‘Why’

In order to broaden out from the PTEM perspective, we argue that more attention should be paid to people—the drivers of the vehicles or the homeowners burning fossil fuels (‘Who’) and the reasons for doing so at those times (‘Why’). This is where social psychology can offer insights into the broader causes of emissions, ones that incorporate people and social and spatial structuring into how we understand, communicate and address these problems. In line with work on the social determinants of health [18], it is necessary to recognise that much work has indicated that the actions that lead to pollution (for example driving a car or solid fuel burning) are often not considered to be free choices by those who participate in them [19]. Therefore proposals to incorporate ‘people’ more clearly within emissions reduction strategies need to go beyond simple considerations of individual choice or willingness to pay and instead look at the social context of people’s actions [20,21].
Recent efforts have been made to examine emissions from the cultural perspectives of the emitters using social practice theory [22,23,24] and socio-technical systems and transitions [25,26]. Much work within the psychology of climate change has considered risk perception [27,28], affective and cognitive processes [29] and human altruism and cooperation [30]. It has recently been argued that social psychology has much to offer to further understand attitudes and beliefs, facilitators and barriers and changing attitudes and behaviours [31]. For this article, we applied further insights into social human behaviour in relation to social identity theory [32], social cognitive theory [33] and the resulting Overton Window of Political Possibility [34].

1.1.1. Social Identity Theory

Social identity describes how a person’s individual sense of pride and self-esteem is related to their group membership(s) (e.g., social class, family, religion, etc.) [32,35]. Humans are constantly evaluating whether another person, culture or country is ‘like them’ by categorising others as ‘in-group’ (us) or ‘out-group’ (them) (thus stereotyping others). The central hypothesis of social identity theory is that group members of an in-group will seek to find negative aspects of an out-group, thus enhancing their self-image.
Our social identity is formed through three distinct processes:
(a)
Social categorisation—we categorise people (including ourselves) to understand the social environment. We define appropriate behaviour by reference to the norms of the groups to which we belong. For instance, car drivers may categorise themselves as different from cyclists, or parents with pushchairs may feel different from young commuter pedestrians.
(b)
Social identification—in this stage, we adopt the identity and norms of the group we have categorised ourselves as to which we belong. For instance, male cyclists commuting to work may start to wear lycra or use performance monitoring gadgets.
(c)
Social comparison—once we have categorized and identified ourselves as part of a group, we then tend to compare that group with other groups. For instance, car drivers may mock cyclists in the rain or compare their speed and comfort in a car to that of travelling by bike.
(d)
Social identity theory indicates that these ‘social badges’ play out whether we are in front of others or by ourselves. They are used to identify and connect with people or societies we deem to be like ourselves (in-groups—people like me), and also to stereotype and disparage people or cultures which we deem to be different from us (out-groups). This need to relate to others generates unconscious biases resulting in judgement towards the non-dominant ‘out-groups’ in society.
Communication around climate change and air pollution has so far focused on long-term consequences of climate change or personal carbon footprints, which are perceived as psychologically distant and disempowering for individuals [28,36,37]. Recent work has sought to change this by segmenting audiences based on their attitudes to climate change [38] and climate action [39]. However, we argue that climate communications will be strengthened through further understanding of the distinct groups and identities of people and activities in society, enabling tailored communications accounting for and resonating with their personal circumstances.

1.1.2. Social Cognitive Theory

Humans are social creatures, and therefore the things we see others doing (mainly from within our in-group) are the things we want to copy or be part of [40]. Social learnring/cognitive theory [33] describes how an individual’s learning is not only related to personal capabilities and experiences but also to observing others; this can be through social interactions, life experiences or outside media influences [41]. In other words, an individual might not do something just because they are good at it; they will also observe the outcome of the behaviour and how others react to it socially [42].
The beliefs that individuals hold about their abilities and eventual outcomes are a powerful influence on how they will behave; this is a critical aspect of social cognitive theory known as perceived self-efficacy (PSE) [43]. This suggests that if people believe an action will have a favourable result and they can successfully perform it, they will be more motivated to perform that action. Self-efficacy is therefore a measure of perceived ability rather than actual performance; however, people with high PSE are more likely to continue performing that action [41]. Bandura [44] identified four aspects that potentially contribute to the development of PSE. These have been detailed here using an example of a woman learning to cycle on main roads with cars:
(a)
Vicarious experiences (i.e., comparisons of capability to others, modelling and observing)—a woman deciding whether to cycle will be influenced by whether other women cycle; if this is considered a ’normal’ thing for women to do, then other women will likely join in. In contrast, if women are observed to receive negative feedback from male cyclists or aggressive drivers, then it will put other women off cycling.
(b)
Mastery or performance accomplishments (i.e., experiences of relevant success)—a beginner female cyclist will be more likely to continue cycling if they have a positive experience cycling on main roads; they will then have a memory to recall about their ability to cycle alongside cars.
(c)
Verbal persuasions (positive feedback from peers and supervisors, coaching)—to continue cycling, the female cyclist would need to receive direct positive feedback on this activity. In contrast, negative feedback would reduce self-efficacy and put the woman off cycling.
(d)
Emotional arousal—both vicarious (indirect) and mastery (direct) experiences can influence our emotional states. To improve self-efficacy for an activity, we need to experience positive emotional responses. Therefore, the woman would need to feel that she is capable and confident at cycling and that other people approve or admire her behaviour.

1.1.3. Overton Window of Political Possibility

These everyday experiences for people give rise to a socially constructed sense of ‘normality’ in society, whereby the practices that most people undertake, within our social circles (in-groups), are considered to be ‘normal’ [40,45]. In policymaking, this shared sense of reality determines that only certain political ideas and policies are acceptable at one point in time; a theory known as the Overton Window of Political Possibility [34]. As normality is socially constructed by the dominant culture, this means that cultural realities can change between social groups, cities, regions and countries, with one idea operating at different stages in each context. Indeed, the Overton Window can shift over time so that an idea moves from unthinkable to radical, to acceptable, to sensible, to popular and finally into policy. For example, a climate change policy which is considered quite sensible in one city, such as an extensive network of bike lanes allowing for cars to be curtailed in the city centre (Amsterdam in the Netherlands), may be considered to be quite radical in another city (such as Bristol, U.K.). Politicians will generally only pursue policies that are widely accepted throughout society as legitimate policy options, or otherwise, they may risk losing popular support and become unelectable. In order to introduce new policies, democratic policymakers therefore need to determine how an idea can be communicated so that it resonates with what may be socially constructed as acceptable or sensible to the majority of citizens.

1.2. Seeing People in the Data

The traditional techno-centric approach to travel data analysis sees emissions segmented by fuel type or source (e.g., cars, buses or Euro Standards) and fails to consider the human dimension related to vehicle use. This paper outlines a new approach to conduct modelling and communication from a group perspective, aiming to better represent how citizens see their own lives and shift the public’s understanding of our role in generating pollution or carbon emissions.
The ClairCity Project [46] (Ref No: 689,289) sought to incorporate social psychological theories in air quality and carbon management. An approach that focusses on the ‘Who’ and ‘Why’ in addition to the ‘Where’ and ‘What’ allows us to understand the role of citizens’ day-to-day behaviours, practices and activities and the perceptions of those activities in the generation of emissions. This subsequently allows consideration for enabling, linked interventions that can be put in place to remove any actual/perceived barriers which result in this entrenched behaviour so that greener choices become the social norm.
ClairCity involved over 818,000 citizens across Europe in six case study cities: Amsterdam in the Netherlands, the Aveiro region of Portugal, Bristol in the U.K.; Ljubljana in Slovenia, the Liguria region of Italy and Sosnowiec in Poland. The project explored the way that group activities and wider social contexts shaping individual behaviours are likely to change or be open to change in the coming decades. The full citizen engagement methods are described in the ClairCity Evaluation Report [46]; however, this paper focusses solely on transport source apportionment modelling and communications, which was trialled in the city of Bristol (U.K.).

2. Materials and Methods

In this article, we outline a new citizen-focussed method to apportioning existing emissions according to group demographics, along with an extensive citizen engagement process to allow modelling for policy preferences and the resulting changes in emissions. In trialling this new approach to citizen-focussed source apportionment and communication, our research questions were:
(1)
How can we better represent citizens in emissions data so that modelling indicates recognisable daily practices?
(2)
How can citizen preferences for future policies be modelled to show potential changes in emissions?
(3)
How can we apply social learning to communicating these models to citizens?
The implications for this research are discussed in full with recommendations for future climate communications.

2.1. Emissions Source Apportionment by Demographics and Motive

In order to link emissions to people’s everyday behaviour, practices and activities, emissions were divided and modelled according to demographics (e.g., gender or age groups), socio-economic factors (e.g., income) and practice motives for specific behaviours (e.g., commuting to work, leisure, shopping, etc.). This scientifically robust yet flexible methodology is designed to use different types of public datasets, which can be applied to different cities in a similar fashion.
The novel citizen source apportionment approach starts by connecting transport emissions at link level via the following sequential steps:
(a)
Establish a noded network of the city. OpenStreetMap (OSM) (https://www.openstreetmap.org/ accessed on 4 March 2021) holds all details necessary for traffic assignment including road type (residential, regional, highway) number of lanes, directions, speed limits, etc. A MATLAB script converted the OSM map to a simple network.
(b)
Generate transport demand from land-use information to an origin-destination table. A generalised approach focussed on peak travel demand that allows different data sources for land-use. OSM in itself is a potential source, but full land-use information was determined by UrbanAtlas (https://www.eea.europa.eu/data-and-maps/data/copernicus-land-monitoring-service-urban-atlas accessed on 4 March 2021).
(c)
Assign demand on the network to generate traffic at link level. Generic assumptions were made for trip distance and flexible assumptions on preferences for different types of road (insofar as they are available), and these were assigned to the map by linking to Travel Survey data from TravelWest in 2015 [47] and the U.K. National Travel Survey in 2018 [48].
(d)
Calibrate the traffic demand with a limited amount of counting points. The traffic generation from surveys is highly uncertain and needs to be scaled in such a way that the resulting traffic demand at link level corresponds to measurements. These data were calibrated with counting information from Bristol City Council.
(e)
Multiply the traffic demand with common emission factors. The emission factors are derived from the publicly available COPERT V [49] methodology, taking into account the fleet composition (age, fuel type, Euro standards, etc.) at country level.
This emissions inventory is then fused with traffic survey data to break down the emissions by motive, gender, age and income. Travel survey data typically hold detailed information about travel behaviour, combining information on the individual as well as information on the trip. In this particular case, travel data from TravelWest in 2015 [47] and the U.K. National Travel Survey in 2018 [48] included:
  • The individual scale:
    Income group (3 groups);
    Age group (5 groups);
    Gender (male/female);
    Car ownership (0, 1, more).
  • The trip scale:
    Transport mode (bicycle, bus, car, motor, taxi, train, walk);
    Trip motive (business, commute, education, leisure, other escort, personal business, shopping, other);
    Time of day (morning, midday, evening, night) as well as day type (weekday, weekend).
The data fusion focussed on matching trip distances observed from the travel survey data, which only holds a sample of all trips, with the estimated traffic demand from estimated transport volumes (and emissions) at link level. This fusion resulted in a dataset that allows further segmentation of the underlying source of the emission by properties of the citizen (age, income, gender) as well as the behavioural element (trip motive or time of day). The resulting graphs detail the baseline emissions for Bristol in 2015.

2.2. Citizen Engagement to Model Future Policy Outcomes

The citizen-focussed source apportionment models were then made future-facing through citizen engagement carried out in Bristol during 2017–2018. The project drew upon previous research into citizen engagement, including constructing population representativity of citizens from a wide variety of demographics [50]; knowledge and cultural capital barriers for people from lower socio-economic backgrounds [51]; accessibility, communication and geographical barriers [52]; and power dynamics between people from different genders, ethnicities and socio-economic status [53]. The ClairCity engagement process [54] therefore tried to redress these barriers by using a variety of methods to reach different citizen groups.

2.2.1. Citizen Engagement for Policy Preferences

Two online surveys were developed to find out citizen preferences for future policy changes to reduce emissions. In the first survey, citizens were firstly asked to qualitatively generate future scenarios for policies to reduce emissions, and in the second they were asked to quantitatively rate their agreement with these potential emission reduction policies using Likert scales. The full list of policy measures and the survey questions are detailed in the Bristol Delphi Evaluation report [55].
The surveys were targeted at city-wide media and emailing lists, aiming to recruit the affected and partisan publics who had an interest in air pollution and carbon emissions, as well as the general public who were interested in decision-making for the city; however, all citizens were eligible to take part. To overcome some of the barriers around digital literacy, accessibility and topic awareness, the online surveys were converted into a face-to-face questionnaire. Areas that were known to have reduced engagement in city decision-making, with lower socio-economic status and in some cases high ethnic diversity, were then purposively sampled. In total, 730 participants took part in the two surveys.
An online game was also developed called ‘Skylines’, with the aim of reaching a much younger demographic of citizens [56]. A further 836 participants voted on the same policy choices presented in the survey, with 56% of participants being below age 34 and who we may assume might not have ordinarily taken part in policy discussions.

2.2.2. Ratification of Emissions Scenarios

The potential future policies and their relative popularity (how many votes they received in the surveys and game) were then ratified by a qualitative Stakeholder Dialogue Workshop. The workshops aimed to bring together people from different community and business groups in order to co-create scenarios for a low-carbon and clean air future; the full workshop protocol is available in the Bristol Stakeholder Report [57]. Seventy-three participants were recruited from community groups who had expressed an interest in air pollution and carbon emissions or the city’s future. The different policy options from the surveys and game were qualitatively organised by the participants into low-, medium- and high-ambition futures. The three scenarios were presented to a further 18 participants in a qualitative Policy Workshop. Participants were policymakers who either worked in local Councils or were local politicians; the full protocol for the workshop is available in the Bristol Policymaker Report [58]. The policymaker participants used their expertise to combine the three scenarios into one Unified Policy Scenario, taking account of all the citizen policy preferences with their ease of implementation over time.
The Unified Policy Scenario options were translated into quantified options to assess their impact on air quality and carbon emissions up to 2025, 2035 and 2050. For example, the citizens’ favourite policy was to ban and phase out polluting vehicles, and the policymaker workshop thought that this was possible by 2025 in Bristol. This would mean that the vehicle stock would be less polluting after this date, and thus the link emissions (using the source-apportionment methodology described in Section 2.1) were modelled to quantify the future scenario. These data were then further broken down to account for changes to different motives and practices over time.

2.3. Communicating Behaviour to Salient Social Groupings

The authors then worked with graphic designers to develop visual infographics for both the baseline and future-facing source-apportionment modelling. This aimed to represent social practices that citizens could recognise, such as leisure and shopping [9,22]. The science communication dissemination efforts were informed by social psychology theories [32,33] so that the visuals and communications identified salient demographic groups such as male/female and social grouping of age categories or commuter types.
The aim in all social media postings was to tailor communications to segmented social identity groups, enabling vicarious role modelling and in-group salience or social badging. The baseline source-apportionment infographics were shared on tailored social media channels/groups via Twitter and Facebook (@claircity). The Unified Policy Scenario infographics were also shared online and with core stakeholder groups in the city such as the Bristol Advisory Committee on Climate Change [59]. Media coverage also resulted, with the authors able to tailor discussions around recognisable groups of people and activities [60].

3. Results

3.1. Participants

In total, 730 participants directly took part in the surveys, and 836 people took part in the Skylines game, with a further 91 people engaged in the ratification workshops. Participants were 57% female, with the modal age category being 37–50 years of age (31%), although all ages were represented. Most were well-educated, with 65% having a degree or higher qualification.
Social media engaged directly with 1281 followers, with some Twitter posts having over 12,000 impressions. There were also 42,309 website views from the U.K. Media reports further reached audiences across radio and newspapers.

3.2. Citizen-Centred Source Apportionment of Baseline NOx Emissions

Using the citizen source apportionment method, the total distance travelled by citizens in Bristol in 2015 was analysed by motive and by mode. Figure 1 shows these data presented in a traditional scientific style. The choice of mode depends on motive for travel as well as demographic characteristics of the citizen. It is not surprising to see car travel as the dominant current transport mode. For education purposes, public transport and active travel are more important compared to travel for leisure purposes. The same observations were made for different age groups—the car is dominating in all age groups, yet public transport and active travel are more common among younger people.

3.2.1. Kilometres Travelled

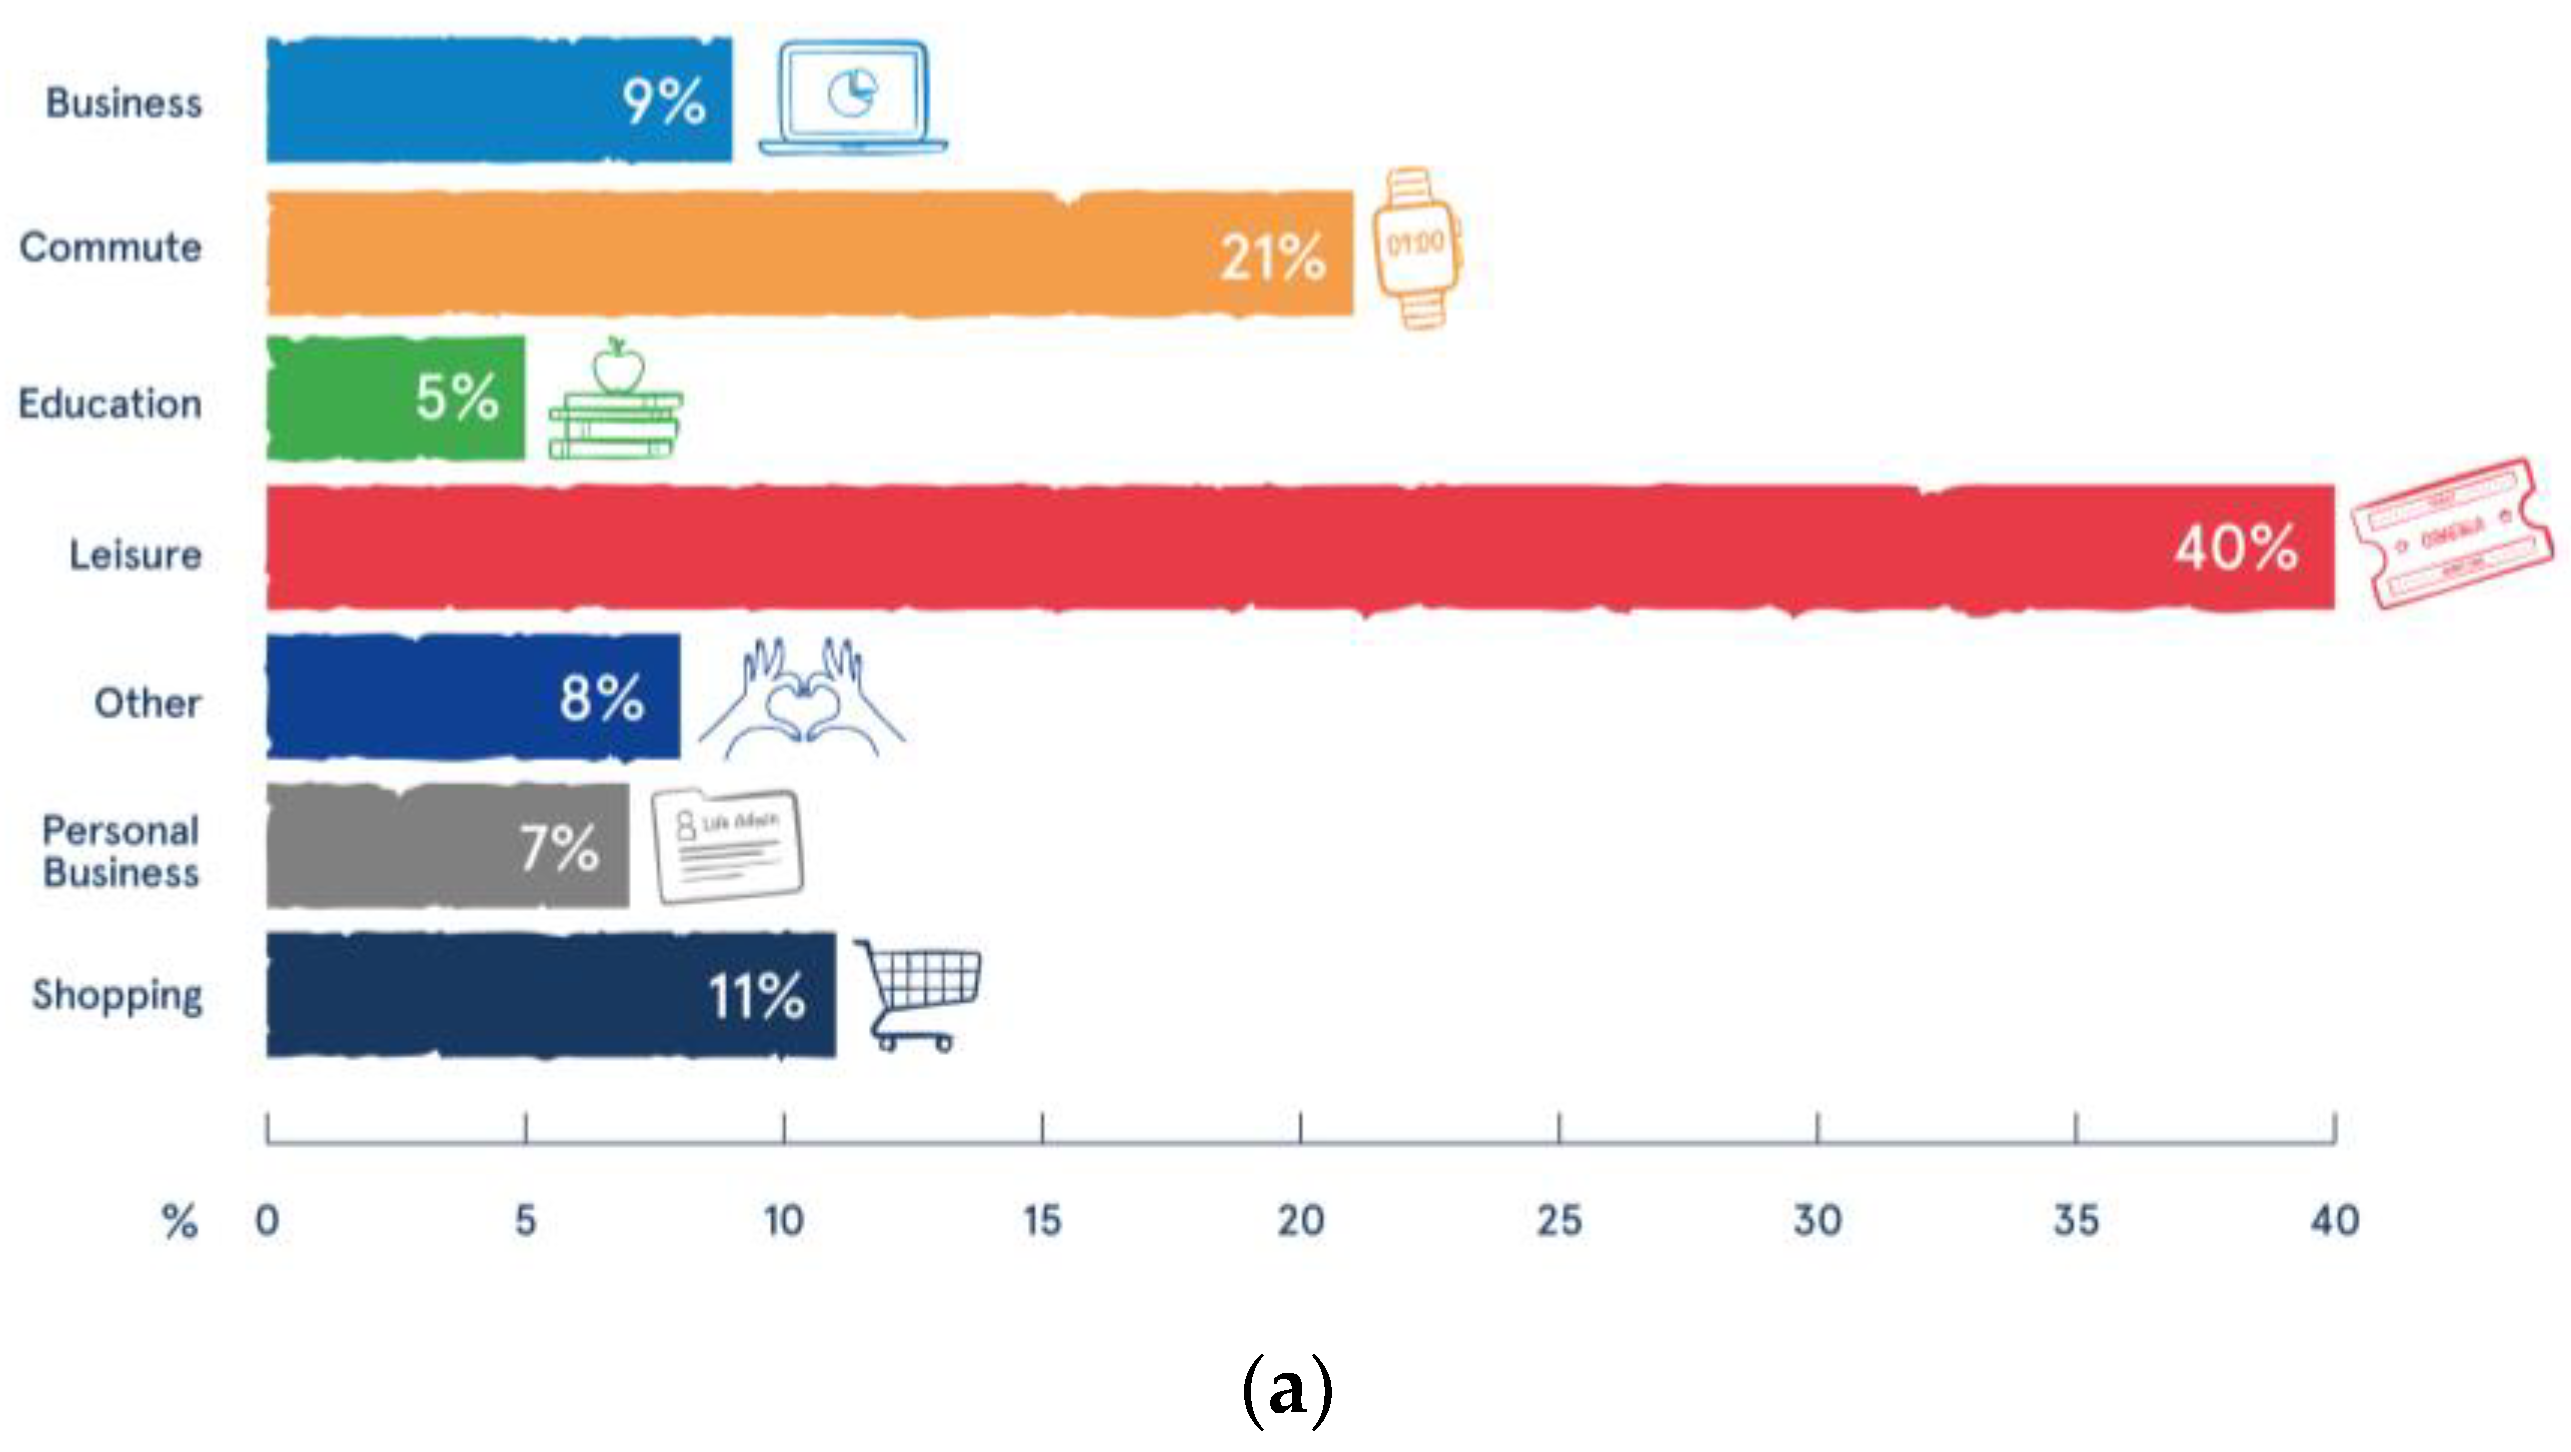
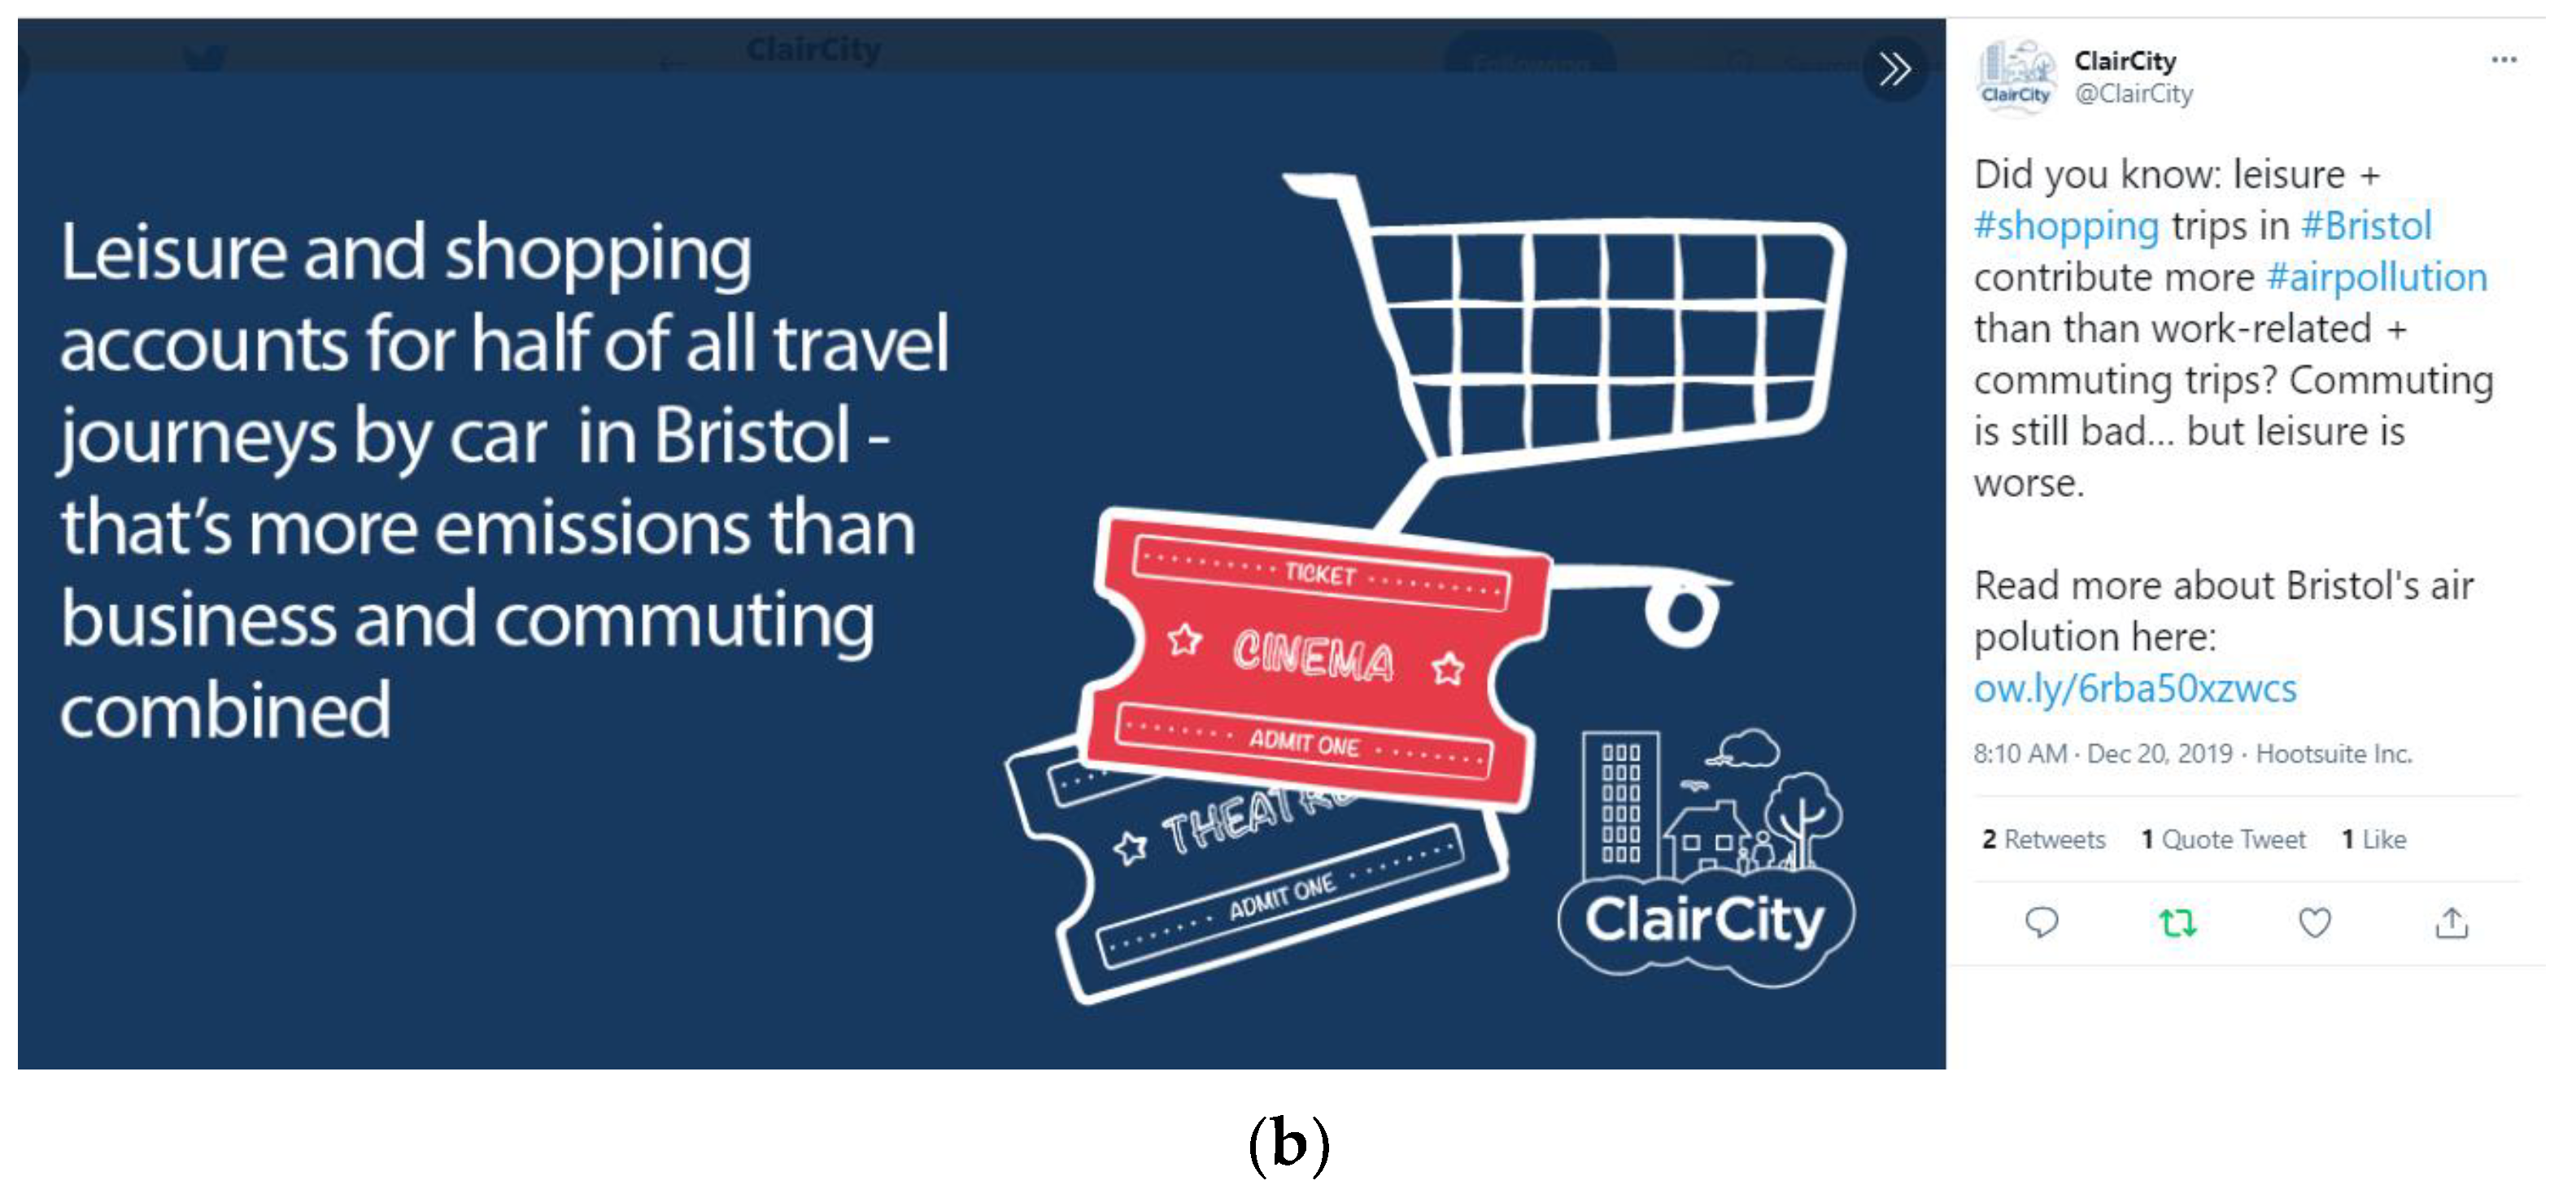
The data indicate that while commuting by car has a substantial influence, it is actually the use of the car for shopping and leisure purposes that has the highest impact on kilometres travelled and therefore also carbon and NOx emissions. The annual emission means provided new insights for local decision-makers, as most travel emission reduction schemes focus on commuting patterns. However, for policymakers working on air quality management zones and reduction in carbon emissions, this new citizen source apportionment revealed a new focus of activity, with leisure and shopping activities accounting for nearly double the kilometres travelled (34%) than commuting (16%). These data are presented in a more visual infographic format to highlight social practices and to chime with recognisable social in-groups (Figure 2).

3.2.2. The role of Gender and Age

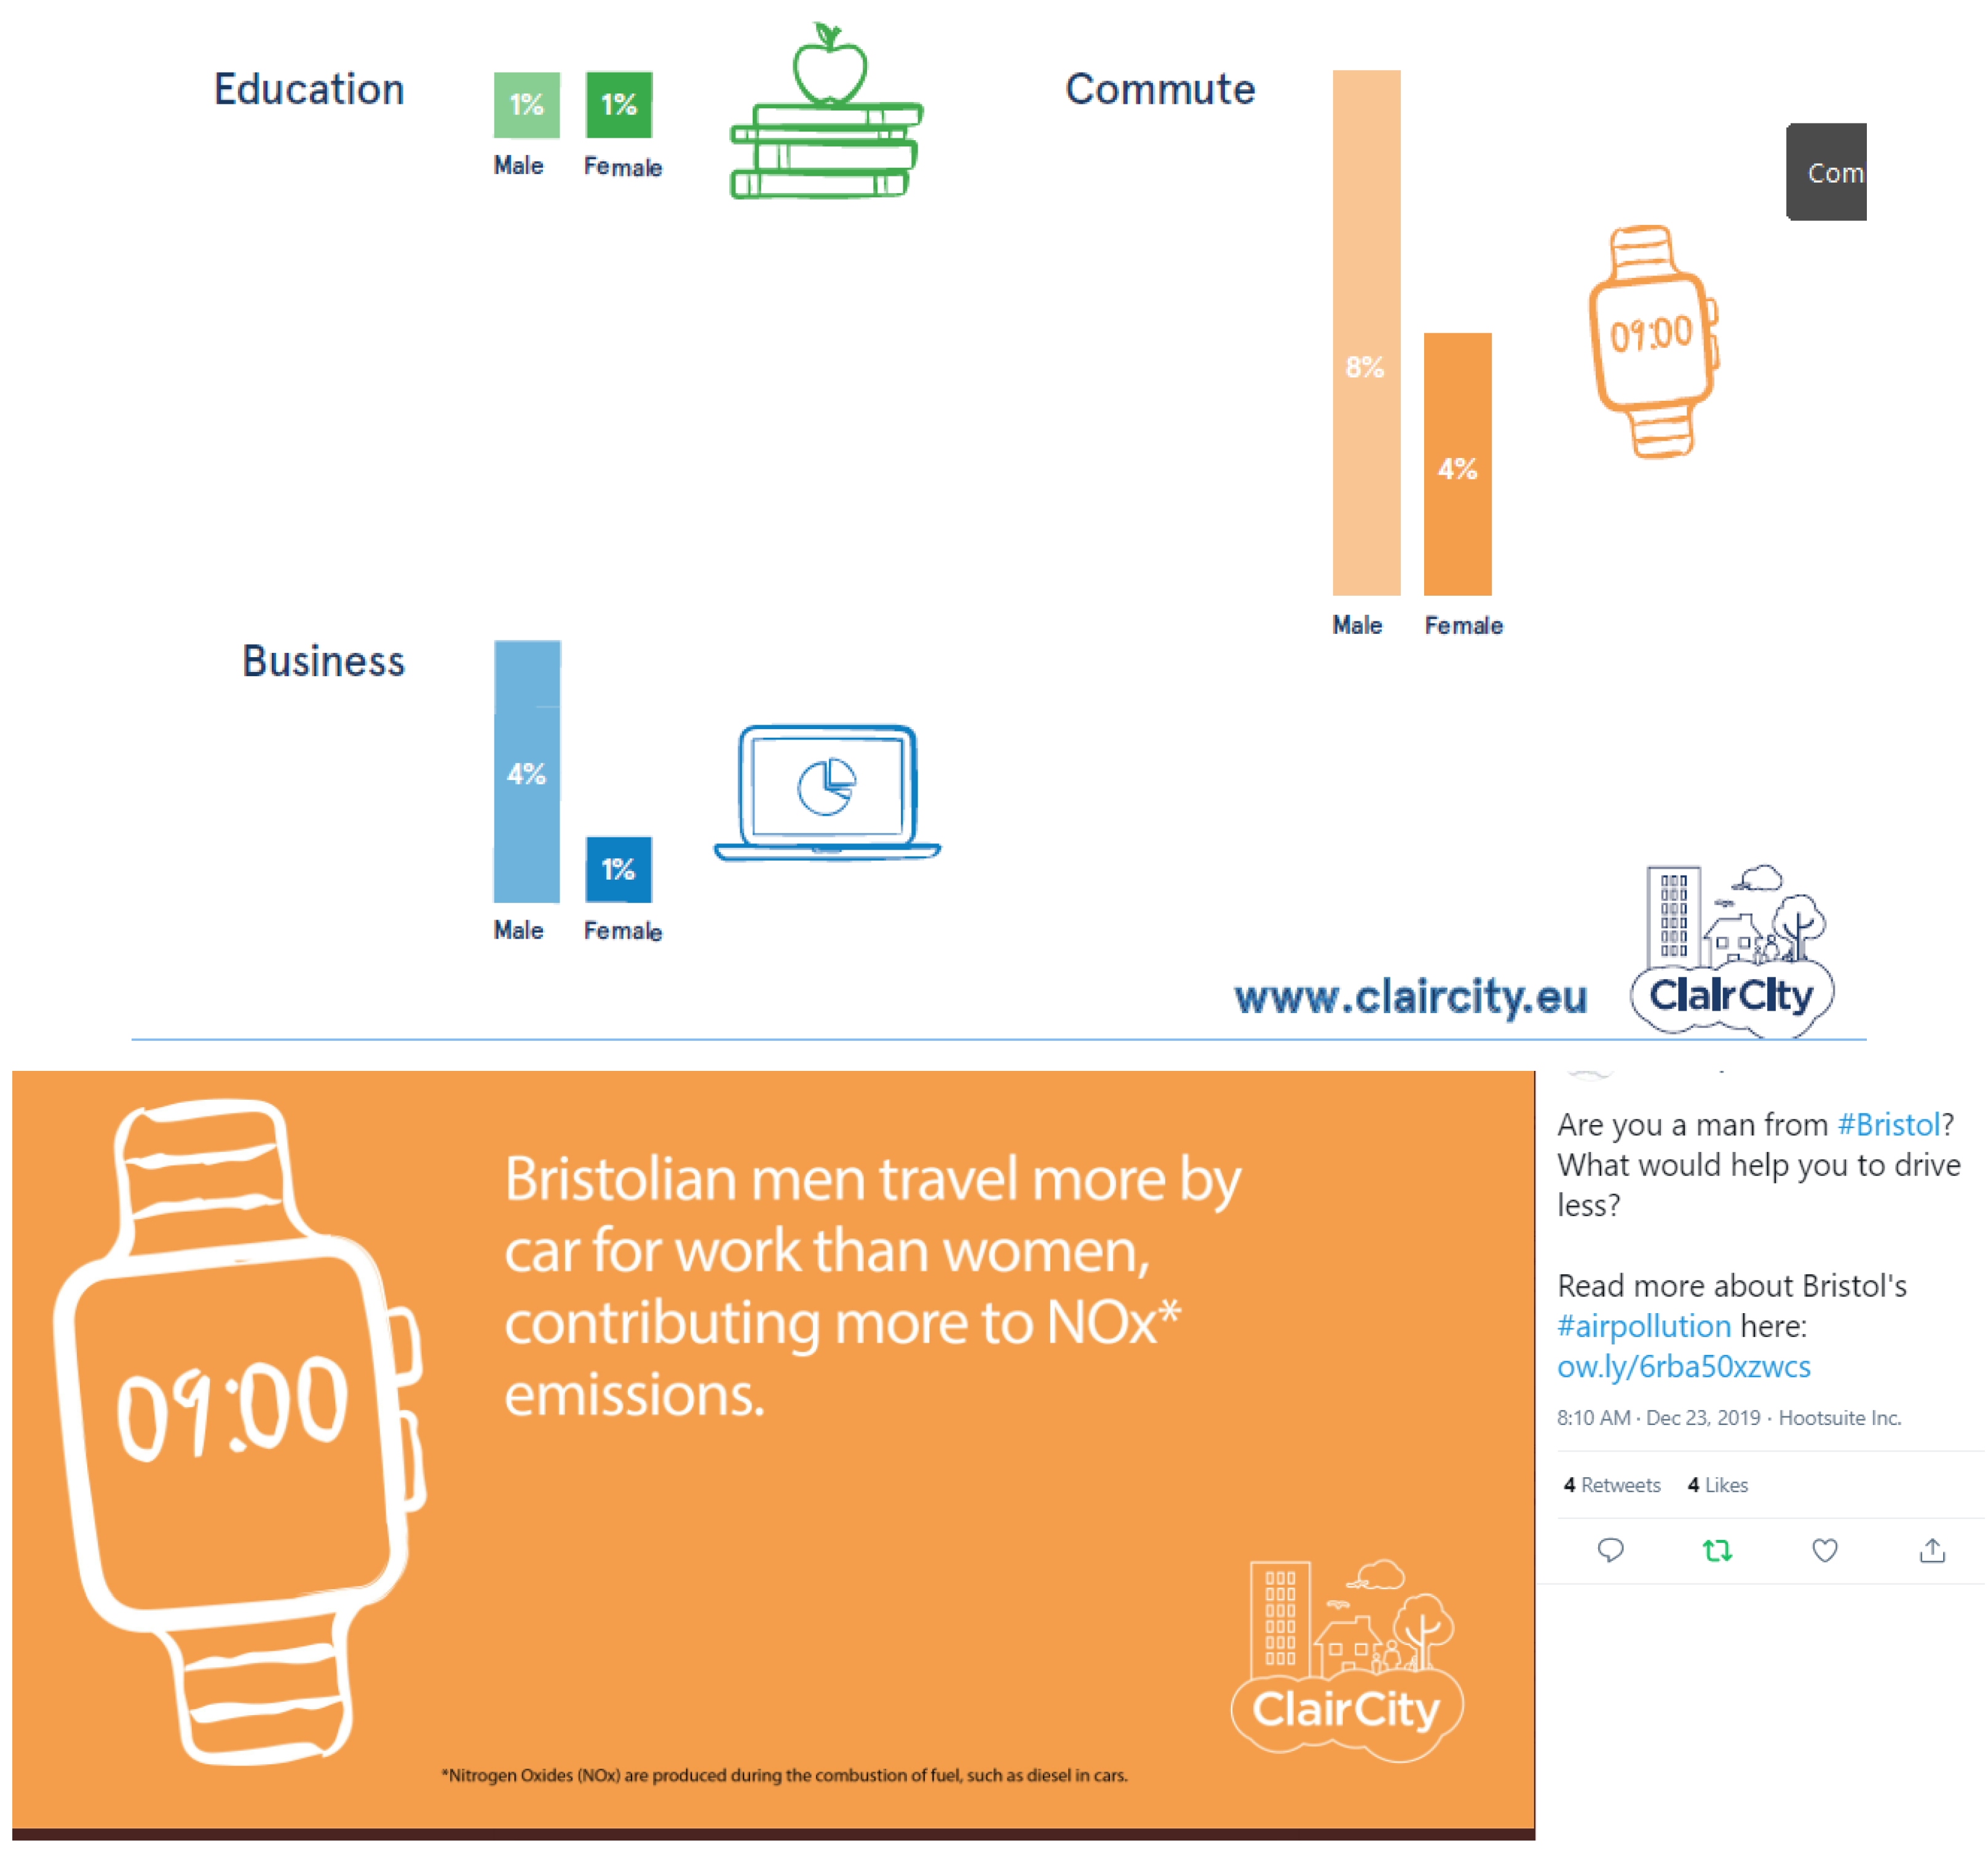
The annual road transport NOx emissions can be apportioned by gender and age to illustrate the influence of different demographics. The most prominent finding is that females generate lower emissions for commuting by car compared to males (3.7% female, 7.9% male) and for business purposes (1.2% female, 4% male). Figure 3 shows the scientific graphs to illustrate these data, and Figure 4 shows the infographic and social card. Additionally, females walk and cycle less than males—there may be a number of reasons for this such as the need for more travel flexibility, family responsibilities, road safety concerns, etc. As expected, working-age adults in the age category of 26–49 and 50–69 dominate the emissions data predominantly using the car for leisure and commuting.

3.2.3. The Influence of Socio-Economic Factors (Income and Car Ownership)

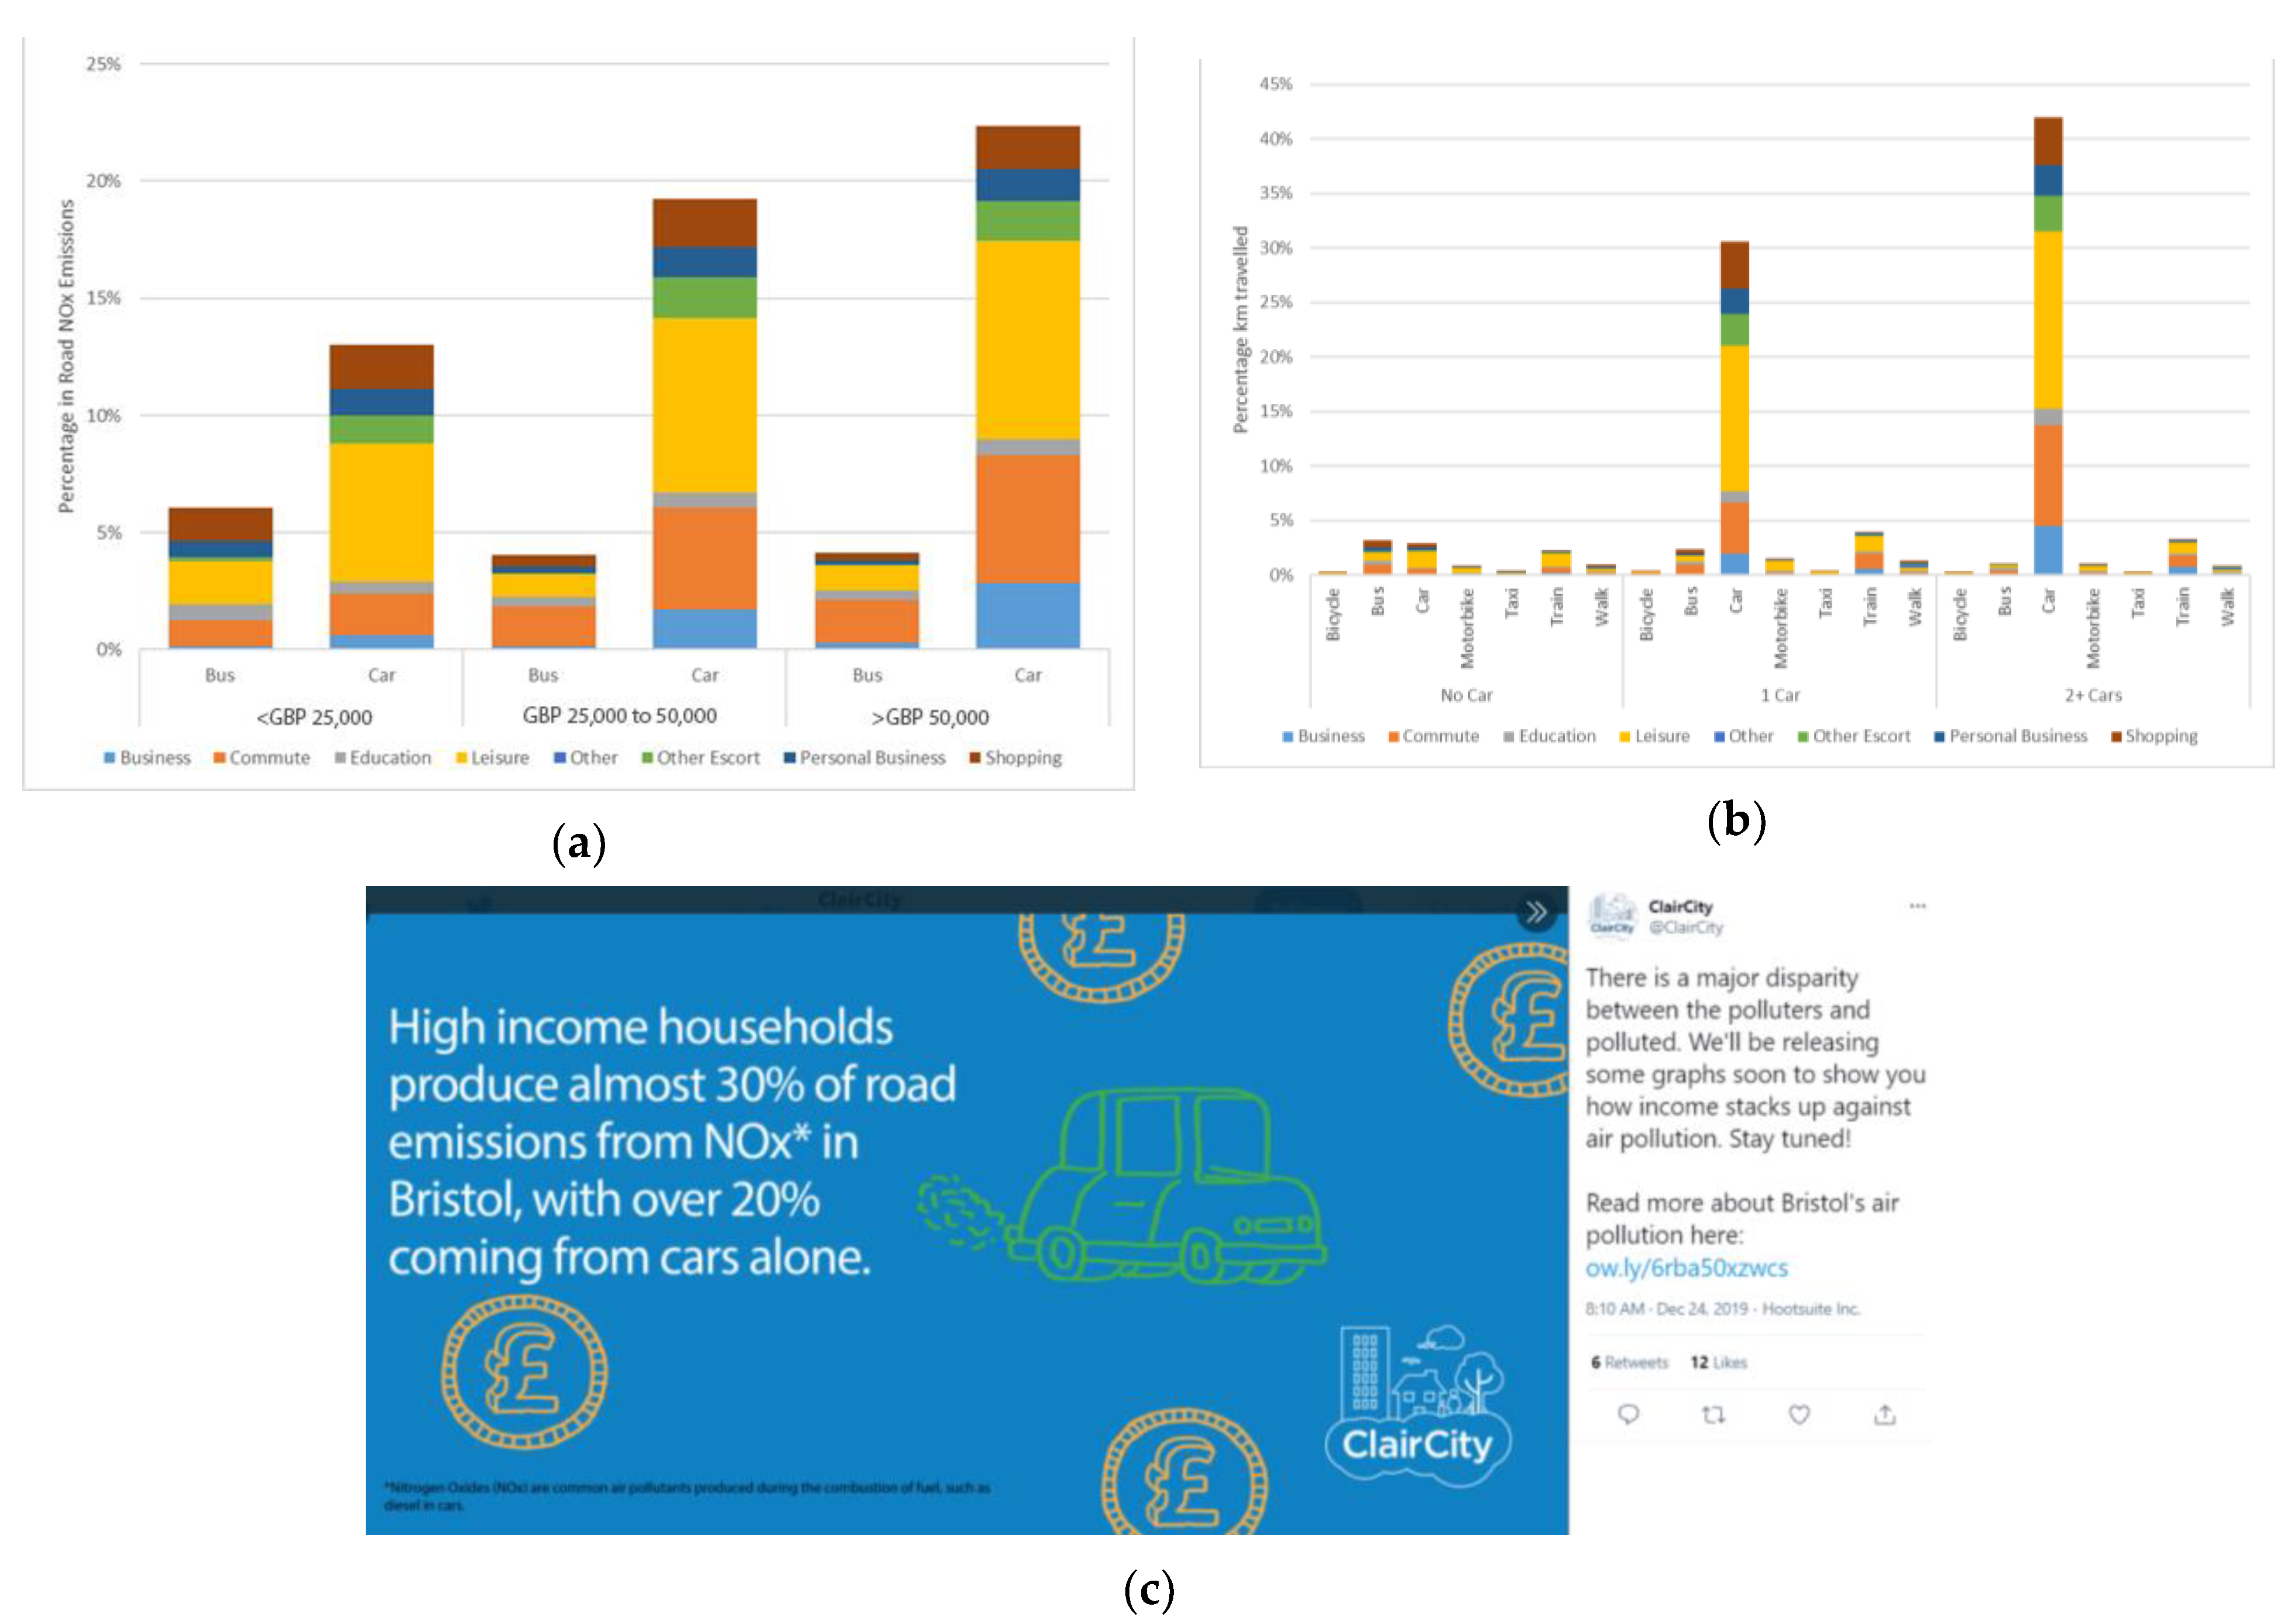
The annual road transport NOx emissions data for Bristol can also be apportioned by income (e.g., <GBP 25,000, GBP 25,000–50,000 and >GBP 50,000) (Figure 5). The data show that there is an impact of income on the generation of NOx emissions as citizens with higher incomes also generate more emissions; this is also supported by other studies [41]. For example, people earning <GBP 25,000 generate 13% of the NOx emissions by car compared to 19.3% and 22.4% for people earning GBP 25–50,000 and >GBP 50,000, respectively. It is also noticeable that people earning <GBP 25,000 are also those most making greater use of the cheaper travel option such as the bus and active travel options but least use of the train. As expected, people who own more cars drive more—this was highlighted in communications and social cards (Figure 5).

3.3. Future Behaviour Change

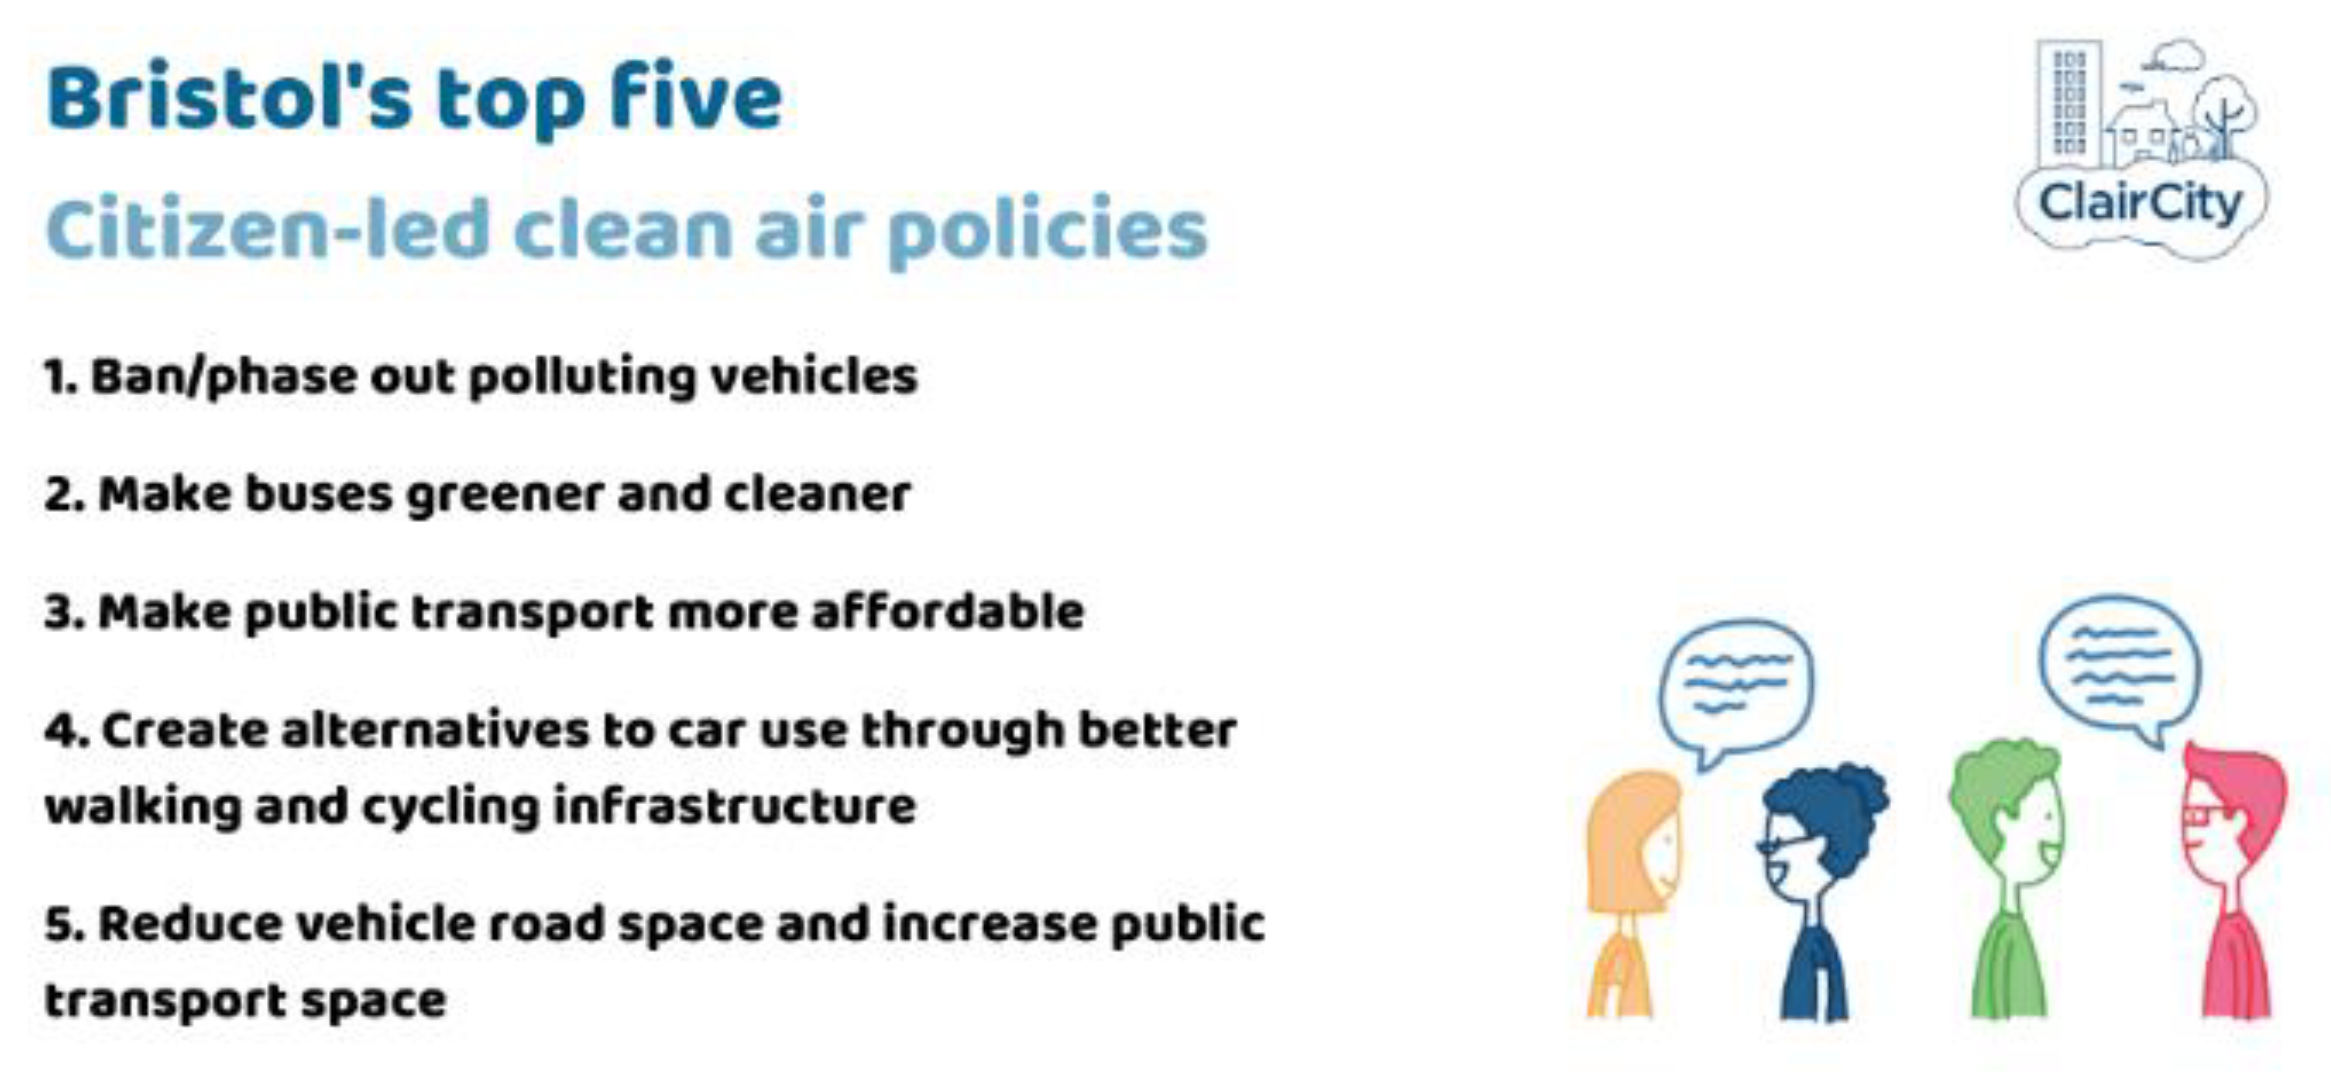
Implementing the suggested policy measures of citizens would enable alternative behaviours and activities, thereby substantially improving air quality and a subsequent reduction in the number of premature deaths caused by air pollution in the city. All policy suggestions and modelling assumptions from the Unified Policy Scenario are shown in the Bristol Policy Report [30] with the top five suggestions shown in Figure 6. Three-quarters (74%) of participants surveyed wanted to use public transport or active travel in the future, compared to 54% now. For shopping and leisure, 66% want to use public or active transport in the future, compared to 38% now.
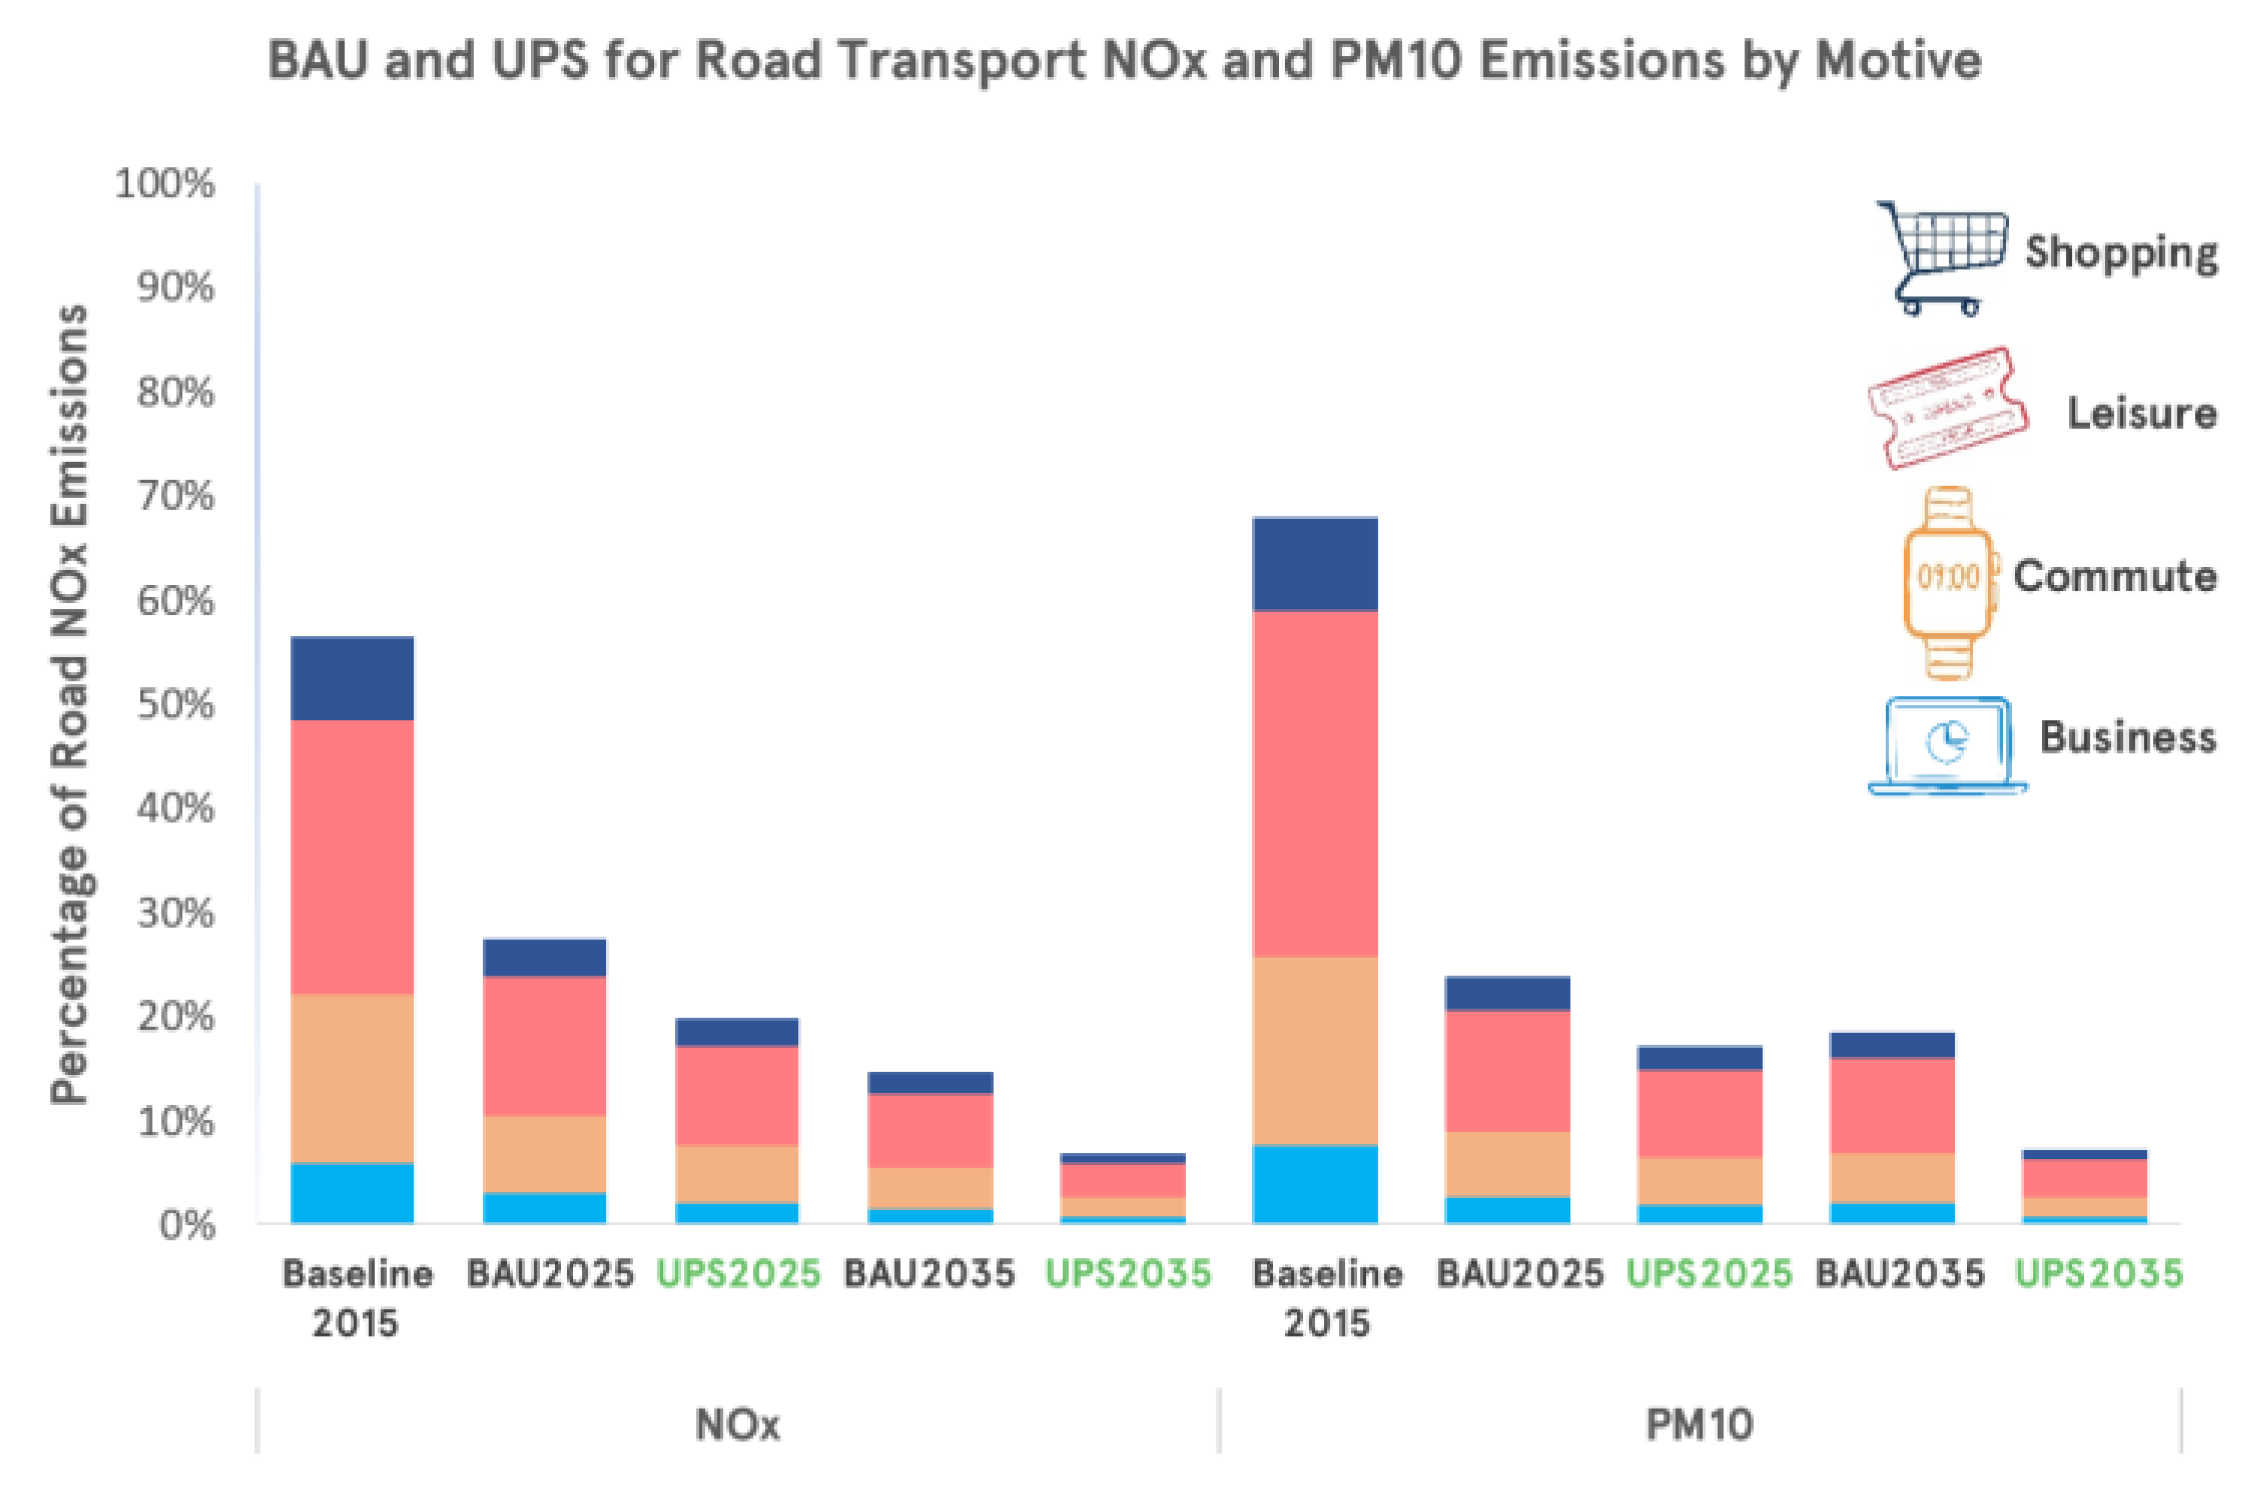
The resulting reductions in air pollution (and accompanying carbon emissions) for Bristol were modelled to show the differences between the Business-as-Usual (BAU) scenario and the Unified Policy Scenario (UPS) for future predictions in 2025, 2035 and 2050. Figure 7 shows that transport NOx emissions are reduced to about 10% in 2035 compared to 2015 in the UPS scenario, while in the BAU, emissions in that year are still 19% of the 2015 emissions. Transport emissions in the UPS scenario are reduced to 5% for NOx and 3% for PM in 2050 compared to 2015. This is not the case in the BAU scenario. Similar reductions for the UPS and BAU were observed for carbon emissions.
Finally, the potential impacts of UPS and BAU scenarios on citizen behaviour compared to the baseline situation in 2015 were assessed. The analysis of transport modes shows that not only is car use reduced substantially in both scenarios, but also public transport (bus) use decreases since total transport use is declining (Figure 7). In the UPS, specific behavioural practices such as leisure and commuting travel are reduced compared to the BAU scenario.

4. Discussion

This paper presents a new method to model and communicate people’s everyday activities as a cause of climate change and air pollution. By analysing travel data using motive for travel, new possibilities become established for the source apportionment of emissions by social activities/practices and subsequent analytical and predictive modelling. Similarly, by analysing the contribution of different intersectional demographic characteristics to emissions, people are more likely to “see themselves in the data” with new possibilities to tailor communications to a variety of in-groups [61].
We believe this new source-apportionment method can allow for better understanding of the practices driving the emissions from transport and therefore allows for better policymaking. By focussing on the ‘Who’ and ‘Why’ in addition to the ‘Where’ and ‘What’, we can understand the role of citizens’ day-to-day behaviours and the perceptions of those activities in the generation of emissions. This new citizen-focussed source apportionment method of emissions is more amenable to represent the significant societal changes that are likely to occur between now and 2050 (with net-zero targets) and the way that these might impact choices at the level of individual citizens.
Policymakers can then determine enabling interventions to remove any actual/perceived barriers to change this entrenched behaviour so that greener choices become the social norm. For example, if future policies aim to support home-working, there would be a subsequent drop in commuting traffic. Commuting traffic has a distinct profile for transport modes (car/bus/bike), time of day (typically morning and evening peak) and who is travelling (typically the working population between 20–65 years old). Source apportionment therefore enables policymakers to see who is creating emissions, who is affected by policy changes and for citizens to identify their social groups (people like me) through mass media social cognition [61].

4.1. Policymaking in Bristol

Leisure and shopping transport in Bristol were found to cause more air pollution and carbon emissions than transport for commuting. A key finding from the baseline source apportionment [54] was therefore that more policymaking focus should be given to these social practices—to enable citizens to undertake leisure activities without using their cars. Suggestions include an intensified cooperation with destinations of leisure and shopping transport, such as retailers, shopping malls, sports clubs, theatres or cinemas, in order to promote active transport (walking, cycling) for reaching their venue. The car as a status symbol for some groups would also need to be addressed. In addition, the barriers that citizens encounter for changing their behaviour, such as current limitations of public and active transport infrastructure, need to be ameliorated. This is similar to policymaking in other worldwide cities to develop a “15-min city”, where all local amenities are located within a 15 min walk or cycle [62].
The citizen-led Unified Policy Scenario (UPS) indicated that the general policy preferences of the citizens align strongly with policies that are already committed to in the city (BAU) but that citizens ask for a faster or more ambitious implementation of measures. Measures that were most frequently mentioned covered a wide range of transport and energy policy measures relating to a clean air zone, stimulation of active travel and public transport, as well as to energy efficiency and renewables. More general measures frequently mentioned spatial planning, work-related issues and awareness building.
The citizen UPS modelling showed a faster and more significant fall in emissions, taking the city to within legal limits of air pollutants more quickly and reaching net-zero carbon emissions by 2050 [1]. This ambitious implementation of policies would have significant benefits in terms of carbon emissions, pollutant concentrations and the resulting health of citizens. Policymakers involved in the engagement modelling process generally considered these citizen policy preferences as feasible, but there remains reticence among politicians due to perceptions of societal pushback from voters [63]. This is despite recent surveys indicating that support for urgent climate action is growing internationally, with agreement that there is a climate emergency at 81% in the U.K. [64].
Communication of the citizen support for existing policies could therefore contribute to a wider acceptability of ambitious policymaking by politicians through indicating that current policies are considered ‘sensible’ within the Overton Window of Political Possibility [34]. Further citizen support could be created by making the year-by-year planned implementation of long-term policy ambitions as explicit as possible in communications and by examining where the implementation of planned policies could be accelerated. On the other hand, politicians with the responsibility for implementing policy changes need to see communications/stories from people within their in-group with salient social badges of ‘their voters’. This is so that the intended policies seem ‘sensible’ enough that politicians feel that policies have enough support from their voters so that they can stay in power [35]. For instance, Labour politicians in Bristol would need to see that working-class people support policies for liveable neighbourhoods, and Conservative politicians nationally in the U.K. would need to see that middle-class rural voters support curbs to car travel in cities. To help with this difficult challenge, future policies could be co-designed with targeted citizens to ensure their social practices and activities are taken into account.
This therefore raises the question of demographic representation in the ClairCity project, in order to maintain credibility and legitimacy of the citizens sampled [50]. The evaluation of ClairCity activities across Europe [46] shows the importance of designing a wide variety of engagement activities, as each type appeals to different genders, ages and education/expertise levels. Within Bristol, the sample size was large (N = 1657) and broadly gender-balanced, but the final ratification and policy were skewed towards a highly educated, male audience. This means that politicians have felt they can discount the data as being not representative of all citizens, or more bluntly, not coming from their social in-groups. This shows that successful implementation of citizen-led measures requires a multi-stakeholder process, which includes various levels of government, business, as well as citizens, taking into account the influence of social in-groups and social cognition preferences of the people in power.

4.2. Communications for Social Cognition—Seeing ‘People Like Me’

In the ClairCity dissemination efforts, the audiences were segmented into different groups, and then messaging was created to highlight the source apportionment modelling and how much contribution each group makes towards emissions. This revealed inequalities in emission production; men were more likely to drive cars for commuting/business than women, working-age people were more likely to drive cars, and people with higher incomes or more cars were more likely to drive further and for more reasons than those with low incomes. This reinforces previous work about environmental inequalities and justice in air pollution and climate impacts [1,3,65]. Policymakers need to take this into account in future policy development, using citizen source apportionment and co-development to address the requirements of segmented audiences.
While our communication channels had a wide reach, we probably did not influence people who were not already aware of climate change—beyond the mass media dissemination from newspapers and radio. To rectify this, future communication efforts need to be segmented with different messages and messengers for different audiences, such as the recent work by Climate Outreach [39]. Citizen source apportionment provides a good basis for this work, as it allows for the data to be analysed from the perspective of different groups in society.
Further thought is needed to define the communication channels that the target audiences trust, i.e., which have relevant material to the in-group [35,36], show relevant social badges and regularly showcase vicarious experiences (role models), in order to harness verbal persuasion to develop self-efficacy in this area [41,44,61]. For instance, to encourage fewer men to drive cars, you would need to communicate via a male-oriented TV/radio show (in-group specific), showcase stereotypical heterosexual men undertaking the desired behaviour (e.g., cycling to work or walking to play football) for vicarious experience and show other men approving of this behaviour for verbal persuasion.
Similarly, to encourage more women to cycle, you would choose an in-group specific media platform (e.g., Facebook mums groups or female-oriented TV shows), showcase stereotypically feminine women cycling with children or carrying shopping in bike carriers and show other women approving of this behaviour. Women in particular are sensitive to vicarious experience (from verbal persuasion and emotional arousal) rather than direct mastery experiences, perhaps due to centuries of societal disapproval for non-traditional female behaviour [66].
A cautionary note needs to be struck, however, to ensure that in-group specific communications do not have the effect of ostracising out-groups of other demographics in society. Using social badges to appeal to in-groups can make tailored communications particularly powerful, as they enhance credibility and emotional arousal to ensure the facts reach the desired audience (as first identified by Aristotle teaching about rhetoric) [67]. However, communications should not strengthen appeal to the in-group by weakening the out-group, i.e., resorting to racism, sexism, homophobia or class politics. Particularly as climate change impacts are felt around the world, communications should take care that efforts to encourage behaviour change do not exacerbate tendencies towards ecofascism [67,68,69].

5. Conclusions

Citizen-focussed source apportionment data modelling allows for better understanding of the social practices creating emissions along with ‘who’ and ’why’ is behind them. Through representing data in this way, we can understand the reasons and values behind citizens’ day-to-day behaviours and the perceptions of those activities in the generation of emissions. The ClairCity project showed how new thinking about the role of people in relation to air pollution and carbon emissions can widen options for action, leading to more acceptable and effective policies. Climate communications should draw on social identity theory and social cognitive theory in order to tailor communication efforts towards in-groups so that citizens become more aware that ’people like me’ create emissions and, equally, ‘people like me’ can take action to reduce emissions.

Author Contributions

Conceptualisation, E.H.; L.F.-R.; J.B.; K.V.; J.L. and T.C.; methodology, E.H.; L.F.-R.; J.B.; C.B.; S.S. and K.V.; formal analysis and visualisation, K.V.; P.I.P.; E.H. and S.L.; writing, L.F.-R. and E.H.; project administration, E.H. and L.F.-R.; funding acquisition, E.H. and J.L. All authors have read and agreed to the published version of the manuscript.

Funding

This research was funded by the European Union’s Horizon 2020 research and innovation programme under grant agreement No. 689289.

Institutional Review Board Statement

The study was conducted according to the guidelines of the Declaration of Helsinki and approved by the University of the West of England (Bristol, U.K.) Research Ethics Committee FET.17.03.30.

Informed Consent Statement

All research and evaluation participants in this project gave informed consent before participating in the engagement activities or evaluation methods.

Data Availability Statement

All original data and reports are available through Zenodo and the ClairCity website: http://www.claircity.eu/outputs/(accessed on 10 March 2021).

Acknowledgments

We acknowledge the partnership and support of the Bristol City Council and the UWE Bristol Air Quality Management Resource Centre in developing and delivering the studies which led to this paper. We also thank the whole ClairCity consortium for their efforts delivering similar work across Europe.

Conflicts of Interest

The authors declare no conflict of interest. The funders had no role in the design of the study; in the collection, analyses, or interpretation of data; in the writing of the manuscript, or in the decision to publish the results.

References

  1. European Environment Agency. Air Quality in Europe; European Environment Agency: Luxembourg, 2017. [Google Scholar]
  2. World Health Organisation. Review of Evidence on Health Aspects of Air Pollution; World Health Organisation: Copenhagen, Denmark, 2013. [Google Scholar]
  3. Barnes, J.; Chatterton, T. An Environmental Justice Analysis Of Exposure To Traffic-related Pollutants In England And Wales. WIT Trans. Ecol. Environ. 2017, 210, 431–442. [Google Scholar]
  4. Barnes, J.; Chatterton, T.; Longhurst, J.W.S. Emissions vs. exposure: Increasing injustice from road traffic-related air pollution in the United Kingdom. Transp. Res. Part D Transp. Environ. 2019, 73, 56–66. [Google Scholar] [CrossRef]
  5. Longhurst, J.W.S.; Irwin, J.G.; Chatterton, T.; Hayes, E.; Leksmono, N.; Symons, J.K. The development of effects-based air quality management regimes. Atmos. Environ. 2009, 43, 64–78. [Google Scholar] [CrossRef]
  6. Brunt, H.; Barnes, J.; Longhurst, J.W.S.; Scally, G.; Hayes, E. Local Air Quality Management policy and practice in the UK: The case for greater Public Health integration and engagement. Environ. Sci. Policy 2016, 58, 52–60. [Google Scholar] [CrossRef]
  7. Lutzenhiser, L. Social and behavioral aspects of energy use. Annu. Rev. Energy 1993, 18, 247–289. [Google Scholar] [CrossRef]
  8. Tiwary, A.; Chatterton, T.; Namdeo, A. Co-managing carbon and air quality: Pros and cons of local sustainability initiatives. J. Environ. Plan. Manag. 2014, 57, 1266–1283. [Google Scholar] [CrossRef] [Green Version]
  9. Chatterton, T. Air pollution: Putting people at the heart of the issues. Environ. Sci. 2017, 26, 2. [Google Scholar]
  10. Longhurst, J.W.S.; Lindley, S.J.; Watson, A.F.R.; Conlan, D.E. The introduction of local air quality management in the United Kingdom: A review and theoretical framework. Atmos. Environ. 1996, 30, 3975–3985. [Google Scholar] [CrossRef]
  11. Beattie, C.I.; Longhurst, J.W.S.; Woodfield, N.K. Air quality management: Evolution of policy and practice in the UK as exemplified by the experience of English local government. Atmos. Environ. 2001, 35, 1479–1490. [Google Scholar] [CrossRef]
  12. Longhurst, J.W.S.; Beattie, C.I.; Chatterton, T.; Hayes, E.; Leksmono, N.S.; Woodfield, N.K. Local air quality management as a risk management process: Assessing, managing and remediating the risk of exceeding an air quality objective in Great Britain. Environ. Int. 2006, 32, 934–947. [Google Scholar] [CrossRef]
  13. Fogg-Rogers, L.; Boushel, C.; Chatterton, T.; Hayes, E. Society vs the Individual. In Proceedings of the Conference on Communication and the Environment, Leicester, UK, 1 July 2017. [Google Scholar]
  14. Chatterton, T.; Barnes, J. A social and spatial analysis of emissions from private vehicle use in Great Britain. WIT Trans. Ecol. Environ. 2016, 207, 99–110. [Google Scholar]
  15. Barnes, J.; Hayes, E.; Chatterton, T.; Longhurst, J.W.S. Air quality action planning: Why do barriers to remediation in local air quality management remain? J. Environ. Plan. Manag. 2014, 57, 660–681. [Google Scholar] [CrossRef]
  16. Hart, J.; Parkhurst, G. Driven to excess: Impacts of motor vehicles on the quality of life in Bristol UK. World Transp. Policy Pract. 2011, 17, 12–30. [Google Scholar]
  17. Williams, D.G.; Spotswood, F.; Parkhurst, G.; Chatterton, T. Practice ecology of sustainable travel: The importance of institutional policy-making processes beyond the traveller. Transp. Res. Part F Traffic Psychol. Behav. 2019, 62, 740–756. [Google Scholar] [CrossRef]
  18. Marmot, M.; Friel, S.; Bell, R.; Houweling, T.A.J.; Taylor, S. Closing the gap in a generation: Health equity through action on the social determinants of health. Lancet 2008, 372, 1661–1669. [Google Scholar] [CrossRef]
  19. Chatterton, T.; Coulter, A.; Musselwhite, C.; Lyons, G.; Clegg, S. Understanding how transport choices are affected by the environment and health: Views expressed in a study on the use of carbon calculators. Public Health 2009, 123, e45–e49. [Google Scholar] [CrossRef] [PubMed] [Green Version]
  20. Chatterton, T. What should be the focus of ’behaviour change’: Individuals or society? Soc. Bus. 2017, 7, 229–240. [Google Scholar] [CrossRef]
  21. Chatterton, T.; Wilson, C. The ‘Four Dimensions of Behaviour’ framework: A tool for characterising behaviours to help design better interventions. Transp. Plan. Technol. 2014, 37, 38–61. [Google Scholar] [CrossRef] [Green Version]
  22. Shove, E.; Pantzar, M.; Watson, M. The Dynamics of Social Practice. In The Dynamics of Social Practice: Everyday Life and How It Changes; SAGE Publications: London, UK, 2014. [Google Scholar]
  23. Shove, E.; Walker, G. What Is Energy For? Social Practice and Energy Demand. Theory Cult. Soc. 2014, 31, 41–58. [Google Scholar] [CrossRef] [Green Version]
  24. Schatzki, T.R.; Cetina, K.K.; Von Savigny, E. The Practice Turn in Contemporary Theory; Routledge: London, UK, 2005. [Google Scholar]
  25. Geels, F.W. The multi-level perspective on sustainability transitions: Responses to seven criticisms. Environ. Innov. Soc. Transit. 2011, 1, 24–40. [Google Scholar] [CrossRef]
  26. Geels, F.W. The dynamics of transitions in socio-technical systems: A multi-level analysis of the transition pathway from horse-drawn carriages to automobiles (1860–1930). Technol. Anal. Strateg. Manag. 2005, 17, 445–476. [Google Scholar] [CrossRef]
  27. Van der Linden, S. The social-psychological determinants of climate change risk perceptions: Towards a comprehensive model. J. Environ. Psychol. 2015, 41, 112–124. [Google Scholar] [CrossRef]
  28. Spence, A.; Poortinga, W.; Pidgeon, N. The Psychological Distance of Climate Change. Risk Anal. 2011, 32, 957–972. [Google Scholar] [CrossRef] [Green Version]
  29. Swim, J.K.; Stern, P.C.; Doherty, T.J.; Clayton, S.; Reser, J.P.; Weber, E.U.; Gifford, R.; Howard, G.S. Psychology’s contributions to understanding and addressing global climate change. Am. Psychol. 2011, 66, 241–250. [Google Scholar] [CrossRef] [PubMed] [Green Version]
  30. Van Lange, P.A.M.; Joireman, J.; Milinski, M. Climate Change: What Psychology Can Offer in Terms of Insights and Solutions. Curr. Dir. Psychol. Sci. 2018, 27, 269–274. [Google Scholar] [CrossRef] [Green Version]
  31. Fielding, K.S.; Hornsey, M.J.; Swim, J.K. Developing a social psychology of climate change. Eur. J. Soc. Psychol. 2014, 44, 413–420. [Google Scholar] [CrossRef]
  32. Tajfel, H. Social identity and intergroup behaviour. Soc. Sci. Inf. 1974, 13, 65–93. [Google Scholar] [CrossRef]
  33. Bandura, A. Social Learning Theory; Prentice Hall: Englewood Cliffs, NJ, USA, 1976. [Google Scholar]
  34. Mackinac Center for Public Policy. Overton Window. 2019. Available online: https://www.mackinac.org/OvertonWindow (accessed on 12 November 2019).
  35. Tajfel, H.; Turner, J.C. An integrative theory of intergroup conflict. In The Social Psychology of Intergroup Relations; Austin, W.G., Worchel, S., Eds.; Brooks/Cole: Monterey, CA, USA, 1979; pp. 33–47. [Google Scholar]
  36. Nisbet, M.C. Communicating Climate Change: Why Frames Matter for Public Engagement. Environ. Sci. Policy Sustain. Dev. 2009, 51, 12–23. [Google Scholar] [CrossRef]
  37. Hulme, M. Why We Disagree About Climate Change, Understanding Controversy, Inaction and Opportunity; Cambridge University Press: Cambridge, UK, 2009; pp. 41–43. [Google Scholar]
  38. Fielding, K.S.; Hornsey, M.J. A social identity analysis of climate change and environmental attitudes and behaviors: Insights and opportunities. Front. Psychol. 2016. [CrossRef] [Green Version]
  39. Wang, S.; Corner, A.; Nicholls, J. Britain Talks Climate: A Toolkit for Engaging the British Public on Climate Change; Climate Outreach: Oxford, UK, 2020. [Google Scholar]
  40. Cialdini, R.B.; Reno, R.R.; Kallgren, C.A. A Focus Theory of Normative Conduct: Recycling the Concept of Norms to Reduce Littering in Public Places. J. Pers. Soc. Psychol. 1990, 58, 1015. [Google Scholar] [CrossRef]
  41. Bandura, A. Health Promotion by Social Cognitive Means. Health Educ. Behav. 2004, 31, 143–164. [Google Scholar] [CrossRef] [PubMed]
  42. Fogg-Rogers, L.; Sardo, M.; Boushel, C. Robots vs. Animals: Establishing a culture of public engagement and female role modelling in a multi-disciplinary engineering laboratory. Sci. Commun. 2017, 39, 195–220. [Google Scholar] [CrossRef]
  43. Bandura, A. Self-efficacy: Toward a unifying theory of behavioral change. Psychol. Rev. 1977, 84, 191–215. [Google Scholar] [CrossRef]
  44. Bandura, A. Self-efficacy: The exercise of control. In Self-Efficacy: The Exercise of Control; W H Freeman/Times Books/Henry Holt & Co.: New York, NY, USA, 1997; pp. 9–604. [Google Scholar]
  45. Lindenberg, S.; Paluck, E.L. Norm Perception as a Vehicle for Social Change. Soc. Issues Policy Rev. 2016, 10, 181–211. [Google Scholar]
  46. Sardo, M.; Laggan, S.; Boushel, C.; Fogg-Rogers, L. Citizen-Led Air Pollution Reduction in Cities (ClairCity) Final Evaluation Report; ClairCity: Bristol, UK, 2020; Available online: https://uwe-repository.worktribe.com/output/6017473/ (accessed on 26 January 2021).
  47. TravelWest. Travel to Work Survey; TravelWest: Bristol, UK, 2015. [Google Scholar]
  48. Evans, A.; Kelly, A.; Slocombe, M. National Travel Survey; Department for Transport: London, UK, 2019.
  49. European Environment Agency. COPERT V—the Industry Standard Emissions Calculator. 2021. Available online: https://www.emisia.com/utilities/copert/ (accessed on 10 March 2021).
  50. Martin, G.P. ‘Ordinary people only’: Knowledge, representativeness, and the publics of public participation in healthcare. Sociol. Health Illn. 2008, 30, 35–54. [Google Scholar] [CrossRef] [Green Version]
  51. Carpini, M.X.D.; Cook, F.L.; Jacobs, L.R. Public deliberation, discursive participation, and citizen engagement: A Review of the Empirical Literature. Annu. Rev. Political Sci. 2004, 7, 315–344. [Google Scholar] [CrossRef]
  52. Yang, K.; Callahan, K. Citizen Involvement Efforts and Bureaucratic Responsiveness: Participatory Values, Stakeholder Pressures, and Administrative Practicality. Public Adm. Rev. 2007, 67, 249–264. [Google Scholar] [CrossRef]
  53. Martin, G.P. Representativeness, legitimacy and power in public involvement in health-service management. Soc. Sci. Med. 2008, 67, 1757–1765. [Google Scholar] [CrossRef]
  54. ClairCity. ClairCity Policy Package First City Bristol; ClairCity: Bristol, UK, 2019. [Google Scholar]
  55. Barnes, J.; Boushel, C. D4.4 Pilot Cities DELPHI Evaluation Report; ClairCity: Bristol, UK, 2018. [Google Scholar]
  56. King, A.; Callum, A.; Hayes, E. D4.8 Fully functional Game—First City; ClairCity: Bristol, UK, 2018. [Google Scholar]
  57. Barnes, J. D4.5 Stakeholder dialogue workshops—First City; ClairCity: Bristol, UK, 2018. [Google Scholar]
  58. Slingerland, S.; Artola, I. D6.5 Policy Workshop—First City; ClairCity: Bristol, UK, 2018. [Google Scholar]
  59. BACC. Bristol Advisory Committee on Climate Change. 2021. Available online: https://thebaccc.org/ (accessed on 27 January 2021).
  60. Boyd, C. How Using Your Car for Shopping Trips and Visiting Friends and Family Creates MORE Air Pollution than Commuting. Daily Mail. Available online: https://www.dailymail.co.uk/health/article-7813033/Using-car-shopping-trips-leisure-activities-creates-air-pollution-commuting.html (accessed on 20 December 2019).
  61. Bandura, A. Social cognitive theory of mass communication. Media Psychol. 2001, 3, 265–299. [Google Scholar] [CrossRef]
  62. Moreno, C.; Allam, Z.; Chabaud, D.; Gall, C.; Pratlong, F. Introducing the “15-Minute City”: Sustainability, Resilience and Place Identity in Future Post-Pandemic Cities. Smart Cities 2021, 4, 93–111. [Google Scholar] [CrossRef]
  63. Martin, M.; Islar, M. The ‘end of the world’ vs. the ‘end of the month’: Understanding social resistance to sustainability transition agendas, a lesson from the Yellow Vests in France. Sustain. Sci. 2020, 16, 601–614. [Google Scholar] [CrossRef]
  64. Flynn, C.; Yamasumi, E.; Fisher, S.; Snow, D.; Grant, Z.; Kirby, M.; Browning, P.; Rommerskirchen, M.; Russel., I. People’s Climate Vote; United Nations Development Programme and University of Oxford: Oxford, UK, 2021. [Google Scholar]
  65. Barnes, J.; De Vito, L.; Hayes, E.; Guàrdia, N.B.; Esteve, J.F.; Van Kamp, I. Qualitative assessment of links between exposure to noise and air pollution and socioeconomic status. WIT Trans. Ecol. Environ. 2018, 230, 15–25. [Google Scholar]
  66. Zeldin, A.L.; Britner, S.L.; Pajares, F. A comparative study of the self-efficacy beliefs of successful men and women in mathematics, science, and technology careers. J. Res. Sci. Teach. 2007, 45, 1036–1058. [Google Scholar] [CrossRef]
  67. Mesa Community College. The Art of Rhetoric. 2021. Available online: http://www.mesacc.edu/~bruwn09481/Syllabi/documents/htm/ArtRetoric/index.htm (accessed on 3 March 2021).
  68. Taylor, B. Alt-right ecology Ecofascism and far-right environmentalism in the United States. In The Far Right and the Environment: Politics, Discourse and Communication; Forchtner, B., Ed.; Routledge: London, UK, 2019. [Google Scholar]
  69. Wilson, J. Eco-Fascism is Undergoing a Revival in the Fetid Culture of the Extreme Right. The Guardian. 2019. Available online: https://www.theguardian.com/world/commentisfree/2019/mar/20/eco-fascism-is-undergoing-a-revival-in-the-fetid-culture-of-the-extreme-right (accessed on 4 March 2021).
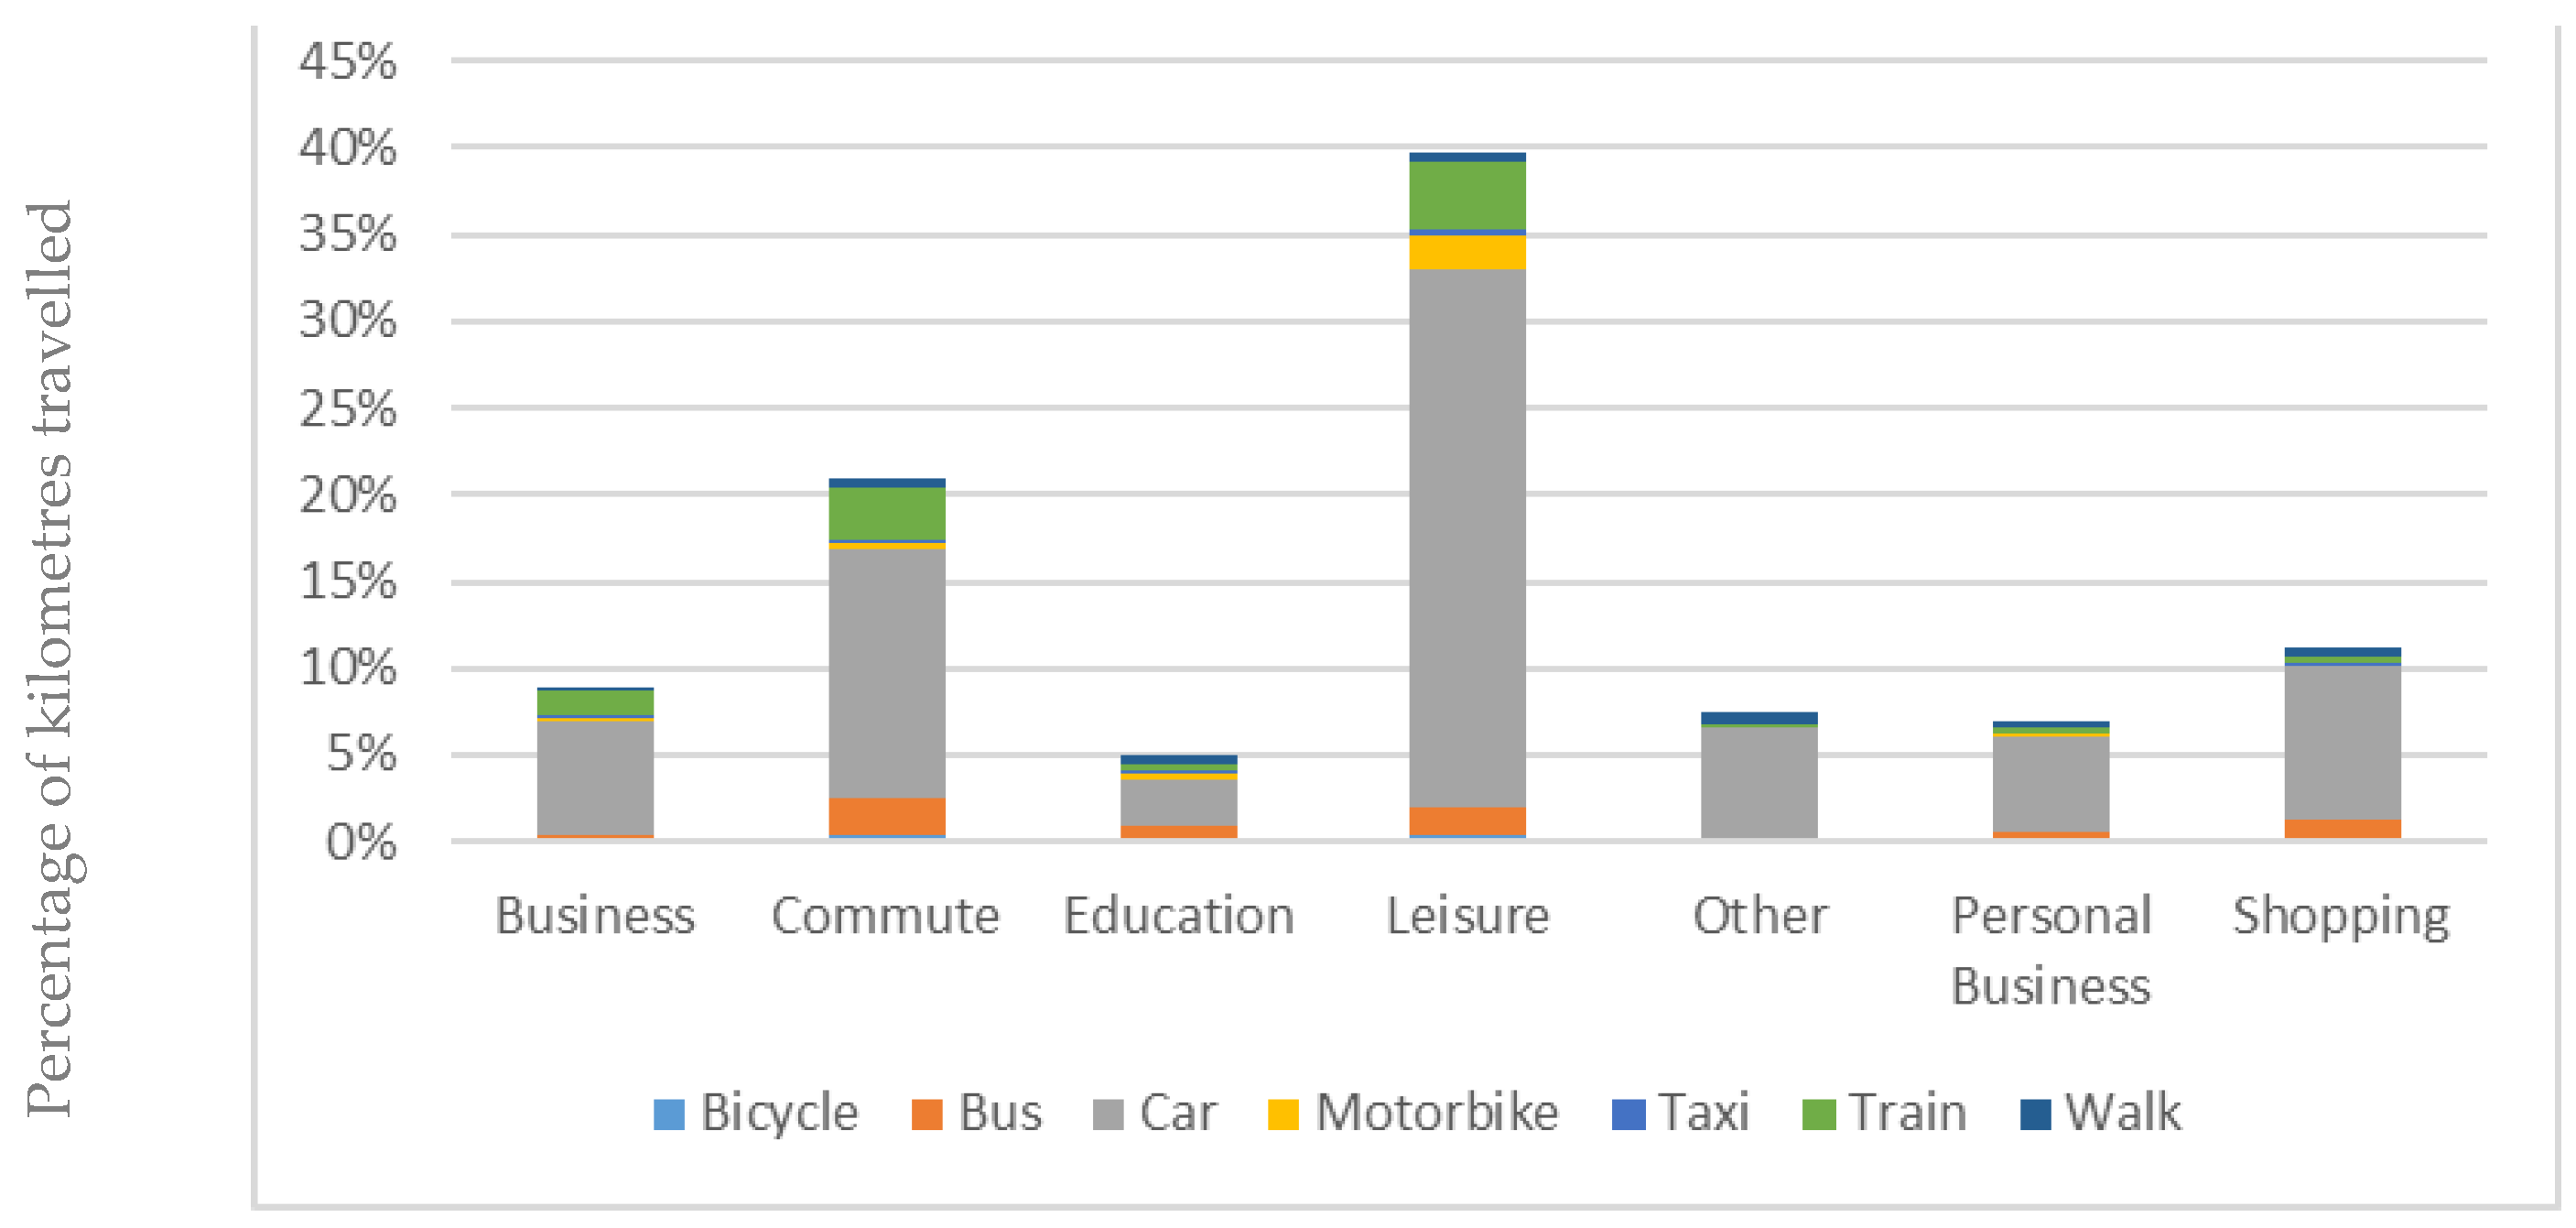
Figure 1. Kilometres travelled in Bristol (2015) source-apportioned by motive and mode.
Sustainability 13 03406 g001
Figure 2. (a) This infographic presents the relative contribution of each motive to total kilometres travelled by car in Bristol in 2015. It was designed to highlight recognisable social practices and activities. (b) This social card links to the data and was designed to resonate with activities that people do every day that contribute to carbon emissions and air pollution.
Sustainability 13 03406 g002aSustainability 13 03406 g002b
Figure 3. Source-apportionment for NOx emissions by mode, motive, age (right) and gender (left) in Bristol.
Sustainability 13 03406 g003
Figure 4. Infographic (top) and social card (bottom) showing differences in air pollution produced through men’s and women’s different travel habits.
Sustainability 13 03406 g004
Figure 5. Source-apportionment by mode, motive, income (a) and car ownership (b) in Bristol, with accompanying social card (c).
Sustainability 13 03406 g005
Figure 6. Infographic shared on social media showing the top five policy suggestions from Bristol residents to reduce emissions.
Sustainability 13 03406 g006
Figure 7. An infographic graph of reductions in air pollution over time, comparing the Business as Usual (BAU) and Unified Policy Scenario (UPS) for citizen behaviour up to 2050. The graph also shows relative contributions of different social practices through citizen source apportionment.
Sustainability 13 03406 g007
Publisher’s Note: MDPI stays neutral with regard to jurisdictional claims in published maps and institutional affiliations.